

Translate this page into:
Evaluating the antimicrobial activity and cytotoxicity of polydopamine capped silver and silver/polydopamine core-shell nanocomposites
⁎Corresponding authors. mlambm@unisa.ac.za (Mbuso Mlambo), nosipho.moloto@wits.ac.za (Nosipho Moloto)
-
Received: ,
Accepted: ,
This article was originally published by Elsevier and was migrated to Scientific Scholar after the change of Publisher.
Peer review under responsibility of King Saud University.
Abstract
Abstract
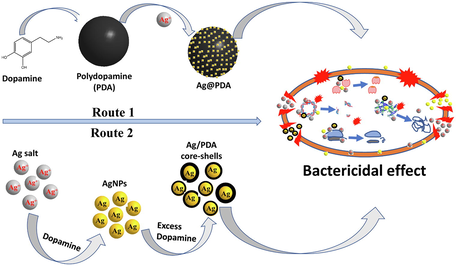
Fabrication of bioactive nanomaterials with improved stability and low toxicity towards healthy mammalian cells have recently been a topic of interest. Bioactive metal nanomaterials such as silver nanoparticles (AgNPs) tend to lose their stability with time and become toxic to some extent, limiting their biological applications. AgNPs were separately encapsulated and loaded on the surface of a biocompatible polydopamine (PDA) to produce Ag-PDA and Ag@PDA nanocomposites to unravel the issue of agglomeration. PDA was coated through the self-polymerization of dopamine on the surface of AgNPs to produce Ag-PDA core-shells nanocomposites. For Ag@PDA, PDA spheres were first designed through self-polymerization of dopamine followed by in situ reduction of silver nitrate (AgNO3) without any reductant. AgNPs sizes were controlled by varying the concentration of AgNO3. The TEM micrograms showed monodispersed PDA spheres with an average diameter of 238 nm for Ag-PDA and Ag@PDA nanocomposites. Compared to Ag@PDA, Ag-PDA nanocomposites have shown insignificant toxicity towards human embryonic kidney (HEK-293T) and human dermal fibroblasts (HDF) cells with cell viability of over 95% at concentration of 250 µg/mL. A excellent antimicrobial activity of the nanocomposites was observed; with Ag@PDA possessing bactericidal effect at concentration as low as 12.5 µg/mL. Ag-PDA on the other hand were only found to be bacteriostatic against gram-positive and gram-negative bacteria was also observed.
Keywords
Silver nanoparticles
Polydopamine
Nanocomposite
E. coli
S. aureus

1 Introduction
Silver nanoparticles (AgNPs) are arguably the most significant and commonly known metal-based antimicrobial agents, even though their lethal mechanisms against pathogenic microbes are not fully understood. The antimicrobial activity of Ag has been known for centuries (Modak and Fox Jr, 1981, Jansen et al., 1994, Kim et al., 1998). AgNPs possess a broad spectrum of antibacterial activity due to their large surface area, their ability to quickly release lethal Ag ions and the production of reactive oxygen species (ROS) (Durán et al., 2010, Zawadzka et al., 2014). In addition, the ease of AgNPs to contact and penetrate the microorganisms' cell membrane gives them the advantage to attack vital organelles. Previous studies have demonstrated that AgNPs interact with sulphur-containing proteins and phosphorus-containing compounds like DNA inside the bacterial membrane (Marambio-Jones and Hoek 2010, Kim et al., 2011, Mirzajani et al., 2011). Ideally, nanoparticles target or deactivate the respiratory chain by interfering with DNA replication and suppressing cell division, leading to cell death(Feng et al., 2000, Sondi and Salopek-Sondi 2004, Morones et al., 2005, Song et al., 2006). In addition, these mechanisms inhibit mutation and bacterial resistance of microbes towards AgNPs, which is one of the main concerns for most antibiotics (Shi et al., 2015).
Even though Ag has been exploited in various commercial products (e.g., food preservatives, cosmetics, and wound dressings), they still attract most research due to their practical application in various fields. However, the critical challenges of AgNPs agglomeration still exist and limit their practical applications. Multiple methods for the fabrication of AgNPs have been extensively reported over the past decades (Iravani et al., 2014, Ahmed and Mustafa 2020, Keshari et al., 2020). Commonly, AgNPs are prepared by reduction of silver nitrate (AgNO3) and stabilized by capping agents such as trisodium citrate, sodium dodecyl sulphate and cetyltrimethylammonium bromide (CTAB), and many more (Ranoszek-Soliwoda et al., 2017, Shah et al., 2019, Albeladi et al., 2020). Polymers such as polyvinylpyrrolidone (PVP), polyethylene glycol (PEG) and dextran have also been used to synthesize AgNPs-based nanocomposites (Pinzaru et al., 2018, Ribeiro et al., 2019, Sharmila et al., 2019). Other materials such as carbon, silica and calcium silicate (CaSiO3) have also been used to prepare and support AgNPs (Ning et al., 2021, Li and Qiu, 2020, Kumar and Gehlaut, 2020). However, some capping agents and polymers are toxic to human cells, non-biodegradable, and therefore cannot be used for biological applications (Abramenko et al., 2019). Non-toxic and biodegradable materials have been used to fabricate and stabilize AgNPs-based nanocomposites. AgNPs incorporated on the surface of biocompatible and biodegradable CaSiO3 were found to exhibit an excellent antimicrobial activity against gram-positive and gram-negative bacteria (Kumar and Gehlaut, 2020). Various polymers including polydopamine (PDA) have also been reported to be non-toxic and biodegradable (Sileika et al., 2011, Babitha and Korrapati 2017).
PDA can easily be obtained from the self-polymerization of dopamine, a biomolecule of catecholamine and phenylamine families (Lynge et al., 2011, Liebscher et al., 2013). Due to their inspired mussel-adhesion abilities/properties inherent from dopamine, PDA can easily be coated on various materials (Lynge et al., 2011). Furthermore, the control over the shapes, sizes and uniformity of PDA offers tremendous advantages of using it as a template for various applications(Ryou et al., 2011, Yan et al., 2013, Liu et al., 2014, Xiong et al., 2014). The high abundance of catechol and amine groups offer PDA the ability to undergo secondary reactions. These functional groups endow PDA with the potential to adsorb and reduce metal ions. Recent studies have shown the power of PDA to reduce Ag ions to form AgNPs (Wu et al., 2015). This facile method for fabrication and incorporation of AgNPs on the surface of PDA have been investigated(Luo et al., 2015). It is also important to point out that PDA has proven biocompatible with insignificant toxicity against mammalian cells (Wu et al., 2015). This gives PDA the potential to be used to fabricate nanocomposites that can be employed in water treatment and biological applications.
This study presents a facile, green, and efficient approach to fabricating nanocomposites based on AgNPs and PDA. In the process, AgNPs were either coated (Ag-PDA) or incorporated on the outside (Ag@PDA) surface of PDA. A novel way of fabricating PDA coated AgNPs is presented, which involved two steps, 1) pre-reduction of AgNO3 using dopamine followed by, 2) dopamine polymerization and coating on the surface of AgNPs. On the other hand Ag@PDA nanocomposites were fabricated through modification of previously reported method (Wu et al., 2015, Luo et al., 2015). In this case, AgNO3 was directly reduced on the surface of PDA spheres without any reductant. The sizes of the AgNPs were varied by varying the concentration of AgNO3 in all the nanocomposites. Various studies have shown the incorporation/coating of AgNPs with PDA and their potential applications, including antimicrobial activity (Feng et al., 2012, Hu et al., 2013, Thota and Ganesh, 2016, Wu et al., 2018, Zhu et al., 2020, Sui et al., 2021, Wang et al., 2021). Howerever, it is still unclear how the surface composition of Ag coated (Ag-PDA) and incorporated on the surface (Ag@PDA) of PDA could affect their antimicrobial activity and toxicity towards mammalian cells. Therefore, this study thoroughly investigated and compared the antimicrobial activity of Ag-PDA and Ag@PDA against gram-positive (S. aureus) and gram-negative (E. coli). The as-synthesized nanocomposites have shown a wide range of antibacterial activity against gram-positive (S-aureus) and gram-negative (E-coli) with good biocompatibility. Their toxicity was insignificant against human embryonic kidney cell line (HEK-293T) and human dermal fibroblasts (HDF), with cell viability of over 80% at concentrations as high as 200 µg/mL. Due to the bactericidal effect and non-toxic nature towards skin cells (HDF) at controlled concentrations, these nanocomposites can be excellent candidates in advanced wound dressings.
2 Experimental
2.1 Materials
Silver nitrate (AgNO3), dopamine hydrochloride, Tris buffer, Luria Bertani Broth (LB), Tryptic Soy Agar (TSA), dimethylformamide, Dulbecco's Modified Eagle Medium (DMEM), Fetal bovine serum (FBS) and penicillin-streptomycin were all purchased from Sigma Aldrich and used as received. All glassware was washed with an aqua-regia solution and rinsed with distilled water.
2.2 Synthesis of nanocomposites materials
2.2.1 Preparation of AgNPs coated/encapsulated in PDA (Ag-PDA)
To Synthesize AgNPs coated/encapsulated in PDA, various concentrations of AgNO3 (1, 5 and 10 mM) were prepared in 100 mL distilled water. The solution was heated to a boil, and 1 mL of dopamine hydrochloride (1 mM) was added dropwise. The colour of the solution changed immediately, from clear to pale yellow, indicating that the formation process of colloidal AgNPs was initiated. The reaction was stopped after 7 min and cooled at room temperature. After that, 50 mL of the colloidal AgNPs was withdrawn and added to 100 mL Tris-buffer (0.5 M). The mixture was stirred for 30 min before adding 10 mL dopamine hydrochloride (0.1 g). The reaction was carried out for 24 h with gentle stirring. The product was washed 3 times with distilled water with centrifugation at 15000 rpm for 15 min.
2.2.2 Preparation of AgNPs on the surface of PDA (Ag@PDA)
PDA spheres were prepared by mixing 50 mL distilled water and 25 mL ethanol. 2 mL ammonium hydroxide (30–33%) was added to the mixture, and the reaction was gently stirred for 30 min. A 0.1 g dopamine was dissolved in distilled water and added to the mixture. The reaction was carried out for 30 h, and the product was washed with distilled water using a centrifuge at 15000 rpm for 15 min before characterization.
AgNPs loaded on PDA spheres were prepared by dispersing 10 mg of PDA spheres in 30 mL distilled water through ultrasonication in ice-cold water. Various amounts of AgNO3 (1, 5 and 10 mM) were prepared and added (10 mL) to the PDA suspension. The reaction was carried out for 30 min. The product was washed using centrifugation at 15000 rpm for 15 min then dried at room temperature before characterization.
2.3 Cell viability studies
The toxicity of the nanocomposites against mammalian cells was determined using HDF and HEK-293T cell lines. The cell viability was assessed using the MTS cell proliferation assay. The HEK-293T cells were cultured in Dulbecco's Modified Eagle Medium (DMEM) supplemented with 10% fetal bovine serum (FBS) and 1% penicillin-streptomycin antibiotic solution HDF cells were cultured in HDF growth medium. The cells were grown in a 37 °C incubator with a humidified atmosphere of 5% CO2.
For the assay, both the HEK-293T and HDF cells were seeded at a density of 1 × 10⁶ cells/mL in 96-well tissue culture plates. The cells were incubated at 37 °C under 5% CO2 for 48 h to allow for stabilization. Two-fold serial dilutions of the nanocomposites (both Ag-PDA and Ag@PDA) in complete culture media were then introduced into the wells containing the cells, with final concentrations on the plates ranging between 31 and 1000 µg/mL. At a 20 μL/well volume, MTS solution was added, and the plates were incubated at 37 °C for an additional 4 h. The plates were then incubated under standard culture conditions (37 °C and 5% CO2) for 72 h, after which the viability of the cells was determined using the MTS dye. The optical density (OD) was then determined at 490 nm using a plate reader, and untreated cells (cells without nanocomposites) were used as a negative control. The percentage of viable cells (%Viability) was calculated using the following equation:
2.4 Antimicrobial activity tests
2.4.1 Well diffusion method
The antimicrobial activity of the materials was tested using a conventional well-diffusion method against Escherichia coli (E. coli) and Staphylococcus aureus (S. aureus). Typically, LB Broth was prepared using ultra-pure water followed by autoclaving at 121 °C for 15 min. The bacterial strains (both E. coli and S. aureus) were inoculated separately in the LB Broth and cultured at 37 °C on a rotary shaker at 250 rpm overnight. Bacteria strains were then aseptically spread on the surface of Tryptic Soy Agar (TSA) plates, followed by the puncture of wells on the agar using a cork borer. 100 µL of Ag-PDA and Ag@PDA suspensions were introduced into the wells, and the plates were incubated at 37 ◦C for 18–24 h. Following incubation, the clear zones around the wells (zones of inhibition) were measured using a ruler.
2.4.2 Minimum inhibitory concentration (MIC) and bacteriostatic studies
The MIC test was conducted using the standard microdilution method. Eight sterilized test tubes were used to perform the tests. The concentration of bacteria in the tubes was adjusted to 1*106 CFU/mL using the McFarland method. Two-fold dilutions of Ag-PDA and Ag@PDA were prepared in 2 mL LB Broth inoculated with bacterial cells. The concentration range of the nanocomposites was 100 to 0,78125 µg/mL from the first to the last tube. The test tubes were then closed and incubated at 37 °C for 24 h. The transparent tube with the least concentration of the nanocomposite was then considered the MIC. The milky colour in other tubes was due to the growth of bacterial cells.
2.5 Characterization
All excess impurities from colloidal solutions were removed using a universal 320R centrifuge at a maximum speed of 15,000 rpm for 15 min. Chemical structure analysis was done using a Bruker Tensor 27 Fourier transform infrared (FTIR) spectrometer. A thermal study was conducted using a Perkin Elmer TGA 6000 thermogravimetric analyzer (TGA) using high-purity nitrogen at a heating rate of 10 °C/min and a gas flow rate of 10 mL/min. Transmission electron microscopy (TEM) images were obtained from FEI Tecnai-T12 microscopy at an electron acceleration voltage of 120 kV and beam spot size of 10–100 nm. The TEM particle diameters were determined using ImageJ software. Powdered X-ray diffraction (PXRD) analysis was performed on a Bruker D2 Phaser with Cu radiation, and each scan was recorded over 20 min.
3 Results and discussion
3.1 Characterization of nanocomposites
AgNPs and PDA based nanocomposites were successfully synthesized through facile processes. These processes involved self-polymerization of dopamine at room temperature with gentle stirring to produce PDA spheres through polymerization of dopamine. To polymerize dopamine, mild alkaline conditions were required. Therefore, ammonium hydroxide and tris buffer solutions were used to initiate the polymerization process. AgNPs were either encapsulated inside (Ag-PDA) or incorporated outside the surface (Ag@PDA) of PDA, in-situ, to produce the nanocomposites. The morphologies and sizes of the as-synthesized PDA and the nanocomposites were studied using TEM, and their micrographs are respectively shown in Figure S1 and Fig. 1.![TEM images of (a-c) Ag-PDA and (d-f) Ag@PDA nanocomposites at different AgNO3 concentrations. [(a, d) 1 mM, (b, e) 5 mM and (c, f) 10 mM].](/content/184/2022/15/6/img/10.1016_j.arabjc.2022.103798-fig2.png)
TEM images of (a-c) Ag-PDA and (d-f) Ag@PDA nanocomposites at different AgNO3 concentrations. [(a, d) 1 mM, (b, e) 5 mM and (c, f) 10 mM].
Monodispersed PDA spheres with an average diameter of 238 nm were obtained, as shown in Figure S1 (A and B). Fig. 1 (a-c) and (d-f) respectively shows the TEM micrographs of Ag-PDA and Ag@PDA nanocomposites prepared using various concentrations of AgNO3. The size distributions of AgNPs encapsulated inside (Ag-PDA) and incorporated outside (Ag@PDA) PDA are presented in Figure S2 (a-c) and (d-f). The average diameters of spherical-like AgNPs were 4.1, 8.4 and 8.8 nm for Ag-PDA nanocomposites prepared with 1, 5 and 10 mM AgNO3, as indicated in Fig. 1a, b and c, respectively. The encapsulation of AgNPs inside PDA resulted in Ag-PDA core-shells, as witnessed in Fig. 1(a-c). The thickness of the PDA surrounding AgNPs was not uniform, with the thickness sizes ranging from 2 to 7 nm. Fig. 1d, e and f respectively show the TEM micrographs of Ag@PDA nanocomposites prepared with AgNO3 concentrations of 1; 5 and 10 mM. AgNPs incorporated on the surface of PDA to form Ag-PDA were also found to be spherical. In addition, uniformly dispersed AgNPs on the surface of PDA spheres with the average diameters 8.1, 9.1 and 12.7 were obtained. These diameters correspond to 1-, 5- and 10-mM concentrations of AgNO3 used to prepare Ag-PDA, as shown in Fig. 1d, e and f, respectively. The average diameter slightly increased with an increase in the concentration of AgNO3. The elemental composition of the nanocomposites was confirmed by Energy-dispersive X-ray spectroscopy (EDS) as shown in Figure S3(a and b). The EDS revealed the presence of elemental Ag in both Ag@PDA (Figure S3a) and Ag-PDA (Figure S3b) nanocomposites. The peaks corresponding to O, C and N are inherent from PDA while Cu comes from the sample grid. The selected area electron diffraction (SAED) pattern of the nanocomposites also revealed the presence of crystaline Ag with face centered cubic crystal phase as shown in Fig. 3S(c and d).
The crystal phase and crystallinity of PDA, Ag-PDA and Ag@PDA were investigated using PXRD, as shown in Fig. 2. The diffractogram of pristine PDA spheres used to fabricate Ag@PDA nanocomposite shown in Figure S4 reveals a broad peak between 10° and 30° 2θ angles. This finding is attributed to the amorphous nature of PDA. It is important to note that the Synthesis of Ag-PDA nanocomposite was performed in-situ; therefore, there is no diffraction pattern for pristine PDA.![PXRD patterns of (A) Ag-PDA and (B) Ag@PDA nanocomposites prepared with different concentrations of AgNO3 [(i) 1 mM, (ii) 5 mM and (iii) 10 mM].](/content/184/2022/15/6/img/10.1016_j.arabjc.2022.103798-fig3.png)
PXRD patterns of (A) Ag-PDA and (B) Ag@PDA nanocomposites prepared with different concentrations of AgNO3 [(i) 1 mM, (ii) 5 mM and (iii) 10 mM].
![FTIR spectra of (a) Ag-PDA and (b) Ag@PDA nanocomposites at different AgNO3 concentrations [(i) DA, (ii) PDA, (iii) 1 mM, (iv) 5 mM and (v) 10 mM].](/content/184/2022/15/6/img/10.1016_j.arabjc.2022.103798-fig4.png)
FTIR spectra of (a) Ag-PDA and (b) Ag@PDA nanocomposites at different AgNO3 concentrations [(i) DA, (ii) PDA, (iii) 1 mM, (iv) 5 mM and (v) 10 mM].
Fig. 2 (a & b) respectively show the diffraction patterns of Ag-PDA and Ag@PDA nanocomposite prepared with different amounts of Ag loading. Diffractograms i, ii and iii represent the nanocomposites prepared with 1, 5 and 10 mM of AgNO3, respectively. The crystalline diffraction peaks at 2θ angles of 38.6°, 44.7°, 64.7°, 77.7° and 81.9° for Ag-PDA and 39.1o., 45.2°, 65.1°, 78.3° and 82.4° for Ag@PDA were observed. These peaks correspond to the diffraction of (1 1 1), (2 0 0), (2 2 0), (3 1 1) and (2 2 2) lattice planes of face centred cubic (FCC) phase of Ag crystal. The presence of characteristic diffraction peaks of Ag crystal in both samples provides evidence that PDA and its monomer, dopamine, reduced Ag ions to metallic silver. The PDA amorphous peak was still observable between 10° and 30° 2θ angles in some diffractograms. It was observed that diffraction peaks did not shift, and the widths of the peaks were almost the same after varying the concentration of AgNO3. This can be attributed to the fact that there was no considerable difference in the sizes of AgNPs as was observed from TEM analysis. The presence of unassigned peaks (marked with an asterisk) on the diffractograms of Ag-PDA prepared with 10 mM, Ag@PDA prepared with 5 mM, and 10 mM of AgNO3 were observed. These peaks were matched to AgCl crystal. The formation of AgCl crystal can be attributed to the interaction of excess Ag ions from AgNO3 and Cl ions from dopamine hydrochloride.
The XPS was further used to elucidated the chemical composition and understanding the mechanism underlying the formation of Ag-PDA and Ag@PDA nanocomposites. Figure S5 shows the survey spectra of (a) pristine PDA which is characterized by O 1s, N 1s and C 1s species. The existance of O 1s and N 1s species is the confirmation of the presence of catechol and amine groups; while C 1s representing the C-C backbone (Figure S9) of PDA. Figure S5 (b, c) and (d, e) respectively show the survey spectra of Ag@PDA and Ag-PDA prepared with (b, d) 1 mM and (c, e) 10 mM of AgNO3. Compared to the PDA spectra, the survey spectra of Ag@PDA and Ag-PDA exhibited an extra signal peak which is attributed to Ag 3d signal. This is the confirmation of the presence of Ag element in the nanocomposite structures. A Chlorine (Cl 2p) signal emerged on the survey spectrum of Ag@PDA ad Ag-PDA prepared with 10 mM AgNO3. This signal was due to the remaining Cl ion which are inherent from dopamine hydrochloride.
To further study and understand the chemical composition of the nanocomposites, high resolution spectra of Ag 3d, Cl 2p, O 1s and C 1s spectra were analysed. Figure S6 shows Ag 3d high resolution spectra of (a, b) Ag@PDA and (c, d) Ag-PDA prepared with 1 and 10 mM AgNO3. Ag@PDA prepared with 1 mM of AgNO3 exhibited two peaks at binding energies (BE) of 374.1 and 368.1 eV which were attributed to Ag3d3/2 and Ag3d5/2 electrons of Ag0, respectively. The BE of Ag3d3/2 and Ag3d5/2 electrons respectively shifted to 372.7 and 366.4 eV in Ag-PDA prepared with 1 mM of AgNO3. The shifting of BE of Ag3d peaks could be due to the ways that AgNPs interact with PDA since they are coated on Ag-PDA and incorporated on the outside surface on Ag@PDA. In addition, the existence of these two peaks in an evidence that PDA was able to reduce Ag ions to Ag0 in situ.
The two Ag3d peaks of Ag@PDA and Ag-PDA nanocomposites prepared with 10 mM AgNO3 were deconvoluted into more other peaks as shown in Figure S6(b and d). Ag@PD was charaecterized by peaks at 373.8, 372.7, 367.1 and 366.8 eV (Figure S6b). The peaks at 373.8 and 367.1 were attributed to metallic Ag0, whereas the peaks at 372.7 and 366.8 were due to Ag+. Ag-PDA was also characterized by the peaks at 373.1, 367.0 and 366.1 eV, of which the peaks at 373.1 and 367.0 eV were due to Ago with the peak at 366.1 eV attributed to Ag+ (Figure S6d). The emergence of Ag+ species in these nanocomposites is the confirmation of the presence of AgCl crystals. The Cl2p spectra (Figure S7) further confirmed the existence of AgCl with the BE of Cl2p1/2 and Cl2p3/2 electrons at 198.5 and 196.9 eV for both Ag@PDA and Ag-PDA, respectively. These coexistence of Ag0 and AgCl for Ag@PDA and Ag-PDA preoared with 10 mM AgNO3 was also observed from the PXRD analysis. The coexistence of Ag0 and AgCl was also obseverd from Ag-PDA prepared with 5 mM AgNO3 was also observed from PXRD analysis, however only 10 mM sample was selected for XPS analysis.
Figure S8 shows the O 1s high resolution spectra of the pristine PDA and the nanocomposites. Two oxygen species corresponding to quinone and catechol groups were observed. The BE of quinone group were at 532.7, 532.9, 532.7, 532.8, and 533.2 eV while those of catechol group being at 531.3, 531.7, 531.3, 531.6 and 531.6 eV for PDA, Ag@PDA (1 mM), Ag@PDA (10 mM), Ag-PDA (1 mM) and Ag-PDA (10 mM), respectively. A slight shift in the BE of the nanocomposite compared to that of pristine PDA was observed which could be attributed to the interaction of AgNPs and PDA. The decrese on the intensity of catechol peak for AgPDA (1 mM) and Ag-PDA (1 mM) was an added evidence of the interaction between AgNPs and PDA.
Chemical structures of dopamine (DA), PDA, Ag-PDA and Ag@PDA nanocomposites were investigated using FT-IR spectroscopy, as shown in Fig. 3. The FT-IR spectra show well-defined characteristic functional groups of DA as indicated in Fig. 3a(i) and 3b(i), respectively. The broad vibrational band around 3250 cm−1 shows the overlapping stretching modes of –OH and –NH groups. The sharp peaks around 1700 cm−1 and 1250 cm−1 are attributed to C=O and C-O vibrations, respectively, while the peak at 1500 cm−1 represents the vibrational modes of C=N and C=C. The PDA, Ag-PDA and Ag@PDA spectra are shown in Fig. 3a(ii-v), and 3b(ii-v) displayed almost all vibrational bands present in the pristine DA spectra. The two sets of spectra have aided in elucidating the interaction between Ag and PDA. The bands of Ag-PDA and Ag@PDA nanocomposites are broadened and slightly shifted to the higher wavenumber compared to that of PDA. The broadening and the slight shifting of the bands could indicate the interaction between Ag and PDA through hydrogen bonding. This interaction promotes the attachment and stability of AgNPs on the surface of PDA. There was no noticeable change in the spectra when the concentration of AgNO3 was changed. This shows that the incorporation of AgNPs does not affect the chemical structure of PDA.
The thermal stability study of the materials was carried out using thermogravimetric analysis (TGA) within the temperature range of 35–900 °C. The TGA thermograms of Ag-PDA and Ag@PDA are respectively shown in Fig. 4(a & b) and their derivative-TGA (D-TGA) thermograms in Figure S10(a, b & c). The multi-step decomposition of PDA can be easily observed from the D-TGA curves. This is a result of different chemical groups and the heterogeneous structure of PDA (Xiong et al., 2014). The first decomposition occurs around 50 °C and can be attributed to the removal of residual moisture. The other decomposition peaks occurred around 360 °C, 510 °C and 620 °C, representing the significant loss of the polymer backbone and functional groups. The decomposition around 360 °C was due to the loss of side groups of the polymer, such as hydroxyl (–OH) and amine (–NH). Between 510 °C and 620 °C, the polymer completely decomposes due to the cleavage of the C-C bonds of the polymer backbone. It was, however, observed that the decomposition of PDA was accelerated due to the incorporation of AgNPs. This can be seen by the shift in the decomposition peaks towards lower temperatures in Fig. 4(a and b). AgNPs could be acting as a catalyst, causing the rapid decomposition of PDA. The total residues of 10, 15 and 20% for Ag-PDA and 5, 8 and 17% for Ag@PDA prepared with varying AgNO3 concentrations were observed. The residue confirms the presence, and the amount of Ag loaded on the PDA. The amount of residue increased with an increase in the concentration of AgNO3 used.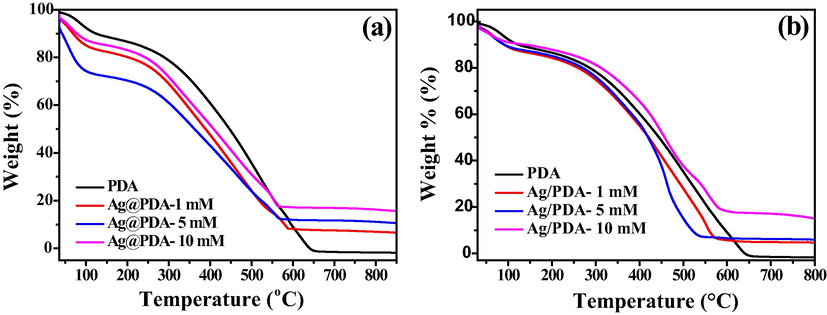
TGA of (a) Ag-PDA and (b) Ag@PDA nanocomposites at different AgNO3 concentrations.
3.2 Biocompatibility studies of AgNPs-DP
The cell viability of Ag-PDA and Ag@PDA at different concentrations was assessed by evaluating their cytotoxicity towards HEK-293 T and HDF cell lines in vitro, using the MTS cell proliferation assay. This assay is based on the reduction of the yellow methyltetrazolium salt by live/viable cells to generate a purple coloured formazan product. This reduction is carried out by nicotinamide adenine dinucleotide phosphate (NADPH)-dependent dehydrogenase enzymes which are active in viable cells, thus making the absorbance of the resulting formazan product (at 490 nm) directly proportional to the number of viable cells.
Furthermore, the effect of Ag loading (in terms of the AgNO3 concentration) on the cytotoxicity was also evaluated. As shown in Figs. 5 and 6, both Ag-PDA (a) and Ag@PDA (b) did not show a significant level of cytotoxicity towards both HEK-293T and HDF cells, especially at low concentrations. Ag-PDA did not show significant toxicity even at a concentration as high as 250 µg/mL for HEK-293T cell, with cell viability exceeding 50% for all the Ag loadings (i.e., 1, 5 and 10 mM AgNO3). Against HDF, Ag-PDA exhibited cell viability of over 50% only at the lowest concentration of Ag loading (1 mM) Ag-PDA.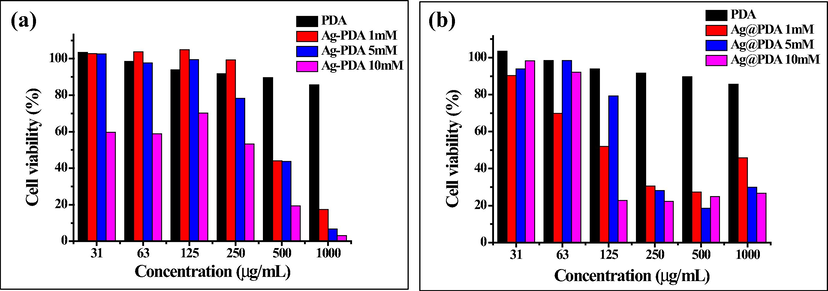
Cell viability of HEK-293 T cells exposed to (A) Ag-PDA and (B) Ag@PDA at different concentrations of AgNO3.
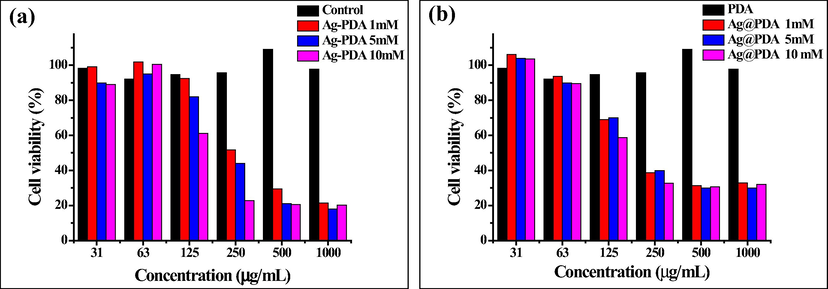
Cell viability of HDF cells exposed to (a) Ag-PDA and (b) Ag@PDA at different concentrations of AgNO3.
Ag@PDA displayed significant signs of toxicity to the cells at higher concentrations than Ag-PDA. This is be attributed to the fact that AgNPs are encapsulated inside PDA for Ag-PDA, whereas AgNPs are supported on the surface of PDA in Ag@PDA, making them directly exposed to the cells. Since AgNPs are encapsulated inside PDA, the release of Ag ions and the direct contact to the cells is limited, hence low toxicity. The amount of Ag loading on the PDA also influenced the cytotoxicity. These observations were more evident on the Ag-PDA than on the Ag@PDA samples, which showed a clear trend. At a high concentration of Ag loading, Ag-PDA becomes more toxic to the cells. The HEK-293T and HDF cell viability was almost 100% at lower loading of Ag (i.e., 1 and 5 mM AgNO3) between the concentration range of 31 to 250 µg/mL. As the loading increases (i.e., 10 mM AgNO3), the cell viability decreases drastically.
The cytotoxicity effect of Ag-PDA and Ag@PDA towards the cell lines was further evaluated by determining the minimum concentration at which they kill 50% of the cells, also known as 50% cytotoxic concentration (CC50). The CC50 values of Ag-PDA and Ag@PDA against HEK-293T and HDF cells were determined from the sigmoid curves. The curves are shown in Figures S11 (a & b) and are recorded in Table 1. The CC50 values are relatively high, indicating that Ag-PDA and Ag@PDA are less toxic towards HEK-293T and HDF cells. Ag-PDA has high CC50 values compared to Ag@PDA, which supports the cell viability findings. The CC50 values of Ag-PDA were observed to be high for low loading of Ag, a phenomenon observed in the cell viability assay.
Sample
CC50 (µg/mL)
HEK-293T
HDF
Ag-PDA
Ag@PDA
Ag-PDA
Ag@PDA
A
476
231
352
241
B
430
210
232
159
C
400
180
166
126
D
–
–
3.3 Antimicrobial activity of AgNPs-DP
The antimicrobial activity of the nanocomposites was determined by a standard well-diffusion method against gram-negative (E. coli) and gram-positive (S. aureus) bacteria. The qualitative antimicrobial activity was done by monitoring the ability of each material to inhibit bacterial growth. The nanocomposites have proven to possess antimicrobial properties as indicated by clear zones of inhibition around the wells on the agar plates. The zones of bacterial inhibition were photographed in the agar plates and are shown in Fig. 7 (a and b) for Ag-PDA and Ag@PDA nanocomposites, respectively. A slight increase in the diameter of zones of inhibition in response to an increase in the concentration of AgNPs loaded on PDA was observed for both bacterial strains. These observations were more apparent in Ag@PDA compared to Ag-PDA samples.![Inhibitory Zones photographs produced by (a) Ag-PDA and (b) Ag@PDA nanocomposites at different AgNO3 concentrations [ (A) 1 mM, (B) 5 mM and (C) 10 mM] and (D) PDA.](/content/184/2022/15/6/img/10.1016_j.arabjc.2022.103798-fig8.png)
Inhibitory Zones photographs produced by (a) Ag-PDA and (b) Ag@PDA nanocomposites at different AgNO3 concentrations [ (A) 1 mM, (B) 5 mM and (C) 10 mM] and (D) PDA.
Since AgNPs are supported on the outside surface of PDA for Ag@PDA, it becomes easy for them to penetrate, interact and destroy the vital cell organelles. On the other hand, AgNPs in Ag-PDA does not get direct exposure to the bacterial cell wall since they are encapsulated inside the PDA, which reduces their antimicrobial activity. Additionally, the activity of Ag@PDA was deduced to be higher compared to Ag-PDA against both E. coli and S. aureus. It is important to note that the pristine PDA did not show any antimicrobial activity against both bacterial strains as there was no clear zone of inhibition observed. The measured inhibition zones were recorded in Tables 2 and 3 for Ag-PDA and Ag@PDA nanocomposite.
Sample
Zone of Inhibition (mm)
MIC (µg/mL)
MBC (µg/mL)
E-Coli
S-Aureus
E-Coli
S-Aureus
E-coli
S-aureus
A
11
11
50
50
–
–
B
12
11
50
50
–
–
C
12
12
50
50
–
–
D
0
0
–
–
–
–
Sample
Zone of Inhibition (mm)
MIC (µg/mL)
MBC (µg/mL)
E-Coli
S-Aureus
E-Coli
S-Aureus
E-coli
S-aureus
A
12
11
6.25
12.5
–
–
B
13
11
6.25
12.5
12.5
–
C
15
14
3.125
3.125
12.5
12.5
D
0
0
–
–
–
–
To further investigate the antimicrobial activity of the nanocomposites, the minimum inhibitory concentrations (MIC) and the minimum bactericidal concentrations (MBC) of Ag-PDA and Ag@PDA were determined. The MIC and MBC values of Ag-PDA and Ag@PDA are respectively summarized in Tables 2 and 3. Equal MIC values of 50 µg/mL for all Ag-PDA samples with different Ag loading (Table 2A, B and C) were observed in both the bacterial strains. The MICs for Ag@PDA samples were low compared to Ag-PDA, as shown in Table 3. The MICs were found to decrease with an increase in the concentration of AgNPs loading as indicated in Table 3(A, B and C) for 1, 5 and 10 mM AgNO3 used. These findings signify the requirement of less amount of Ag@PDA to inhibit bacterial growth compared to Ag-PDA. The MIC of as low as 3.125 µg/mL was obtained from the Ag@PDA sample prepared by 10 mM AgNO3. The MIC values obtained for the Ag-PDA nanocomposites were between 8- and 10-fold lower than the CC50 values, while MIC values obtained for the Ag@PDA were between ∼6- and 26-fold lower than the CC50 values. These results show that these materials could potentially be used as antimicrobial agents without eliciting toxicity against mammalian cells.
The ability of the nanocomposites to kill the bacteria was investigated through MBC. The MBC was obtained by swabbing each bacterial strain treated with the nanocomposites on the agar plates shown in Figure S12 (a and b) for Ag-PDA and Ag@PDA, respectively. The bacterial growth was observed within 24 h of swabbing the Ag-PDA nanocomposites plate. This indicates that Ag-PDA nanocomposites can only inhibit bacterial growth and cannot kill the bacteria. Ag@PDA nanocomposites prepared by 10 mM AgNO3 [Figure S12b(C)] exhibited bactericidal properties with the MBC of 3.125 µg/mL [Table 3b(C)] for both bacterial strains. At the AgNO3 concentration of 5 mM [Figure S12b(B)], Ag@PDA only exhibited the bactericidal activity against E-coli with the MBC of 6.25 µg/mL [table “” not found /]
. S-aureus was resistant since the growth was observed within 24 h of swabbing. Significant growth was observed for Ag@PDA prepared with 1 mM AgNO3 [Figure S12b(A)] against E. coli and S. aureus.
The antimicrobial activity of the nanocomposites was also evaluated by studying the bacterial growth kinetics in the medium (LB Broth) containing each bacterial strain (E. coli and S. aureus) and the nanocomposites. The media containing only the bacterial cells and PDA were used as controls. The bacterial proliferation was examined by measuring the cell suspension's optical density (OD) at 600 nm. The growth kinetics were studied at a concentration range of 3.125–100 µg/mL for both Ag-PDA and Ag@PDA prepared with different concentrations of AgNO3, as shown in Fig. 7.
Fig. 8 (a and b) represent the bacterial growth curve of Ag-PDA prepared with 10 mM of AgNO3 against E. coli and S. aureus, respectively. Rapid bacterial growth was observed within the first hour of incubation for the control samples. There was no significant difference between the suspension containing PDA and those containing only bacterial cells (E. coli and S. aureus). This was an indication that PDA could not inhibit bacteria from growing. At low concentrations of the nanocomposites (between 3.125 and 25 µg/mL), Ag-PDA inhibited E-coli from growing in the first 2 h, as shown in Fig. 8a. The bacterial (E-coli) growth was indicated by the increase of OD readings and the turbidity of the suspension. The bacteria continued to grow with time, as witnessed by the increasing turbidity and the OD. When the concentration of Ag-PDA was increased to 50, and 100 µg/mL, inhibition of bacterial growth was observed throughout the testing period study. Ag-PDA showed weak antimicrobial activity against S. aureus, as indicated in Fig. 7b. S. aureus started to grow within the first hour, as was evident from increasing OD and the turbidity of the suspensions. At low concentrations of AgNPs loading (i.e., 1 and 5 mM AgNO3), a similar trend of bacterial growth was observed for Ag-PDA against both bacterial growths, as shown in Figure S13 (a-d).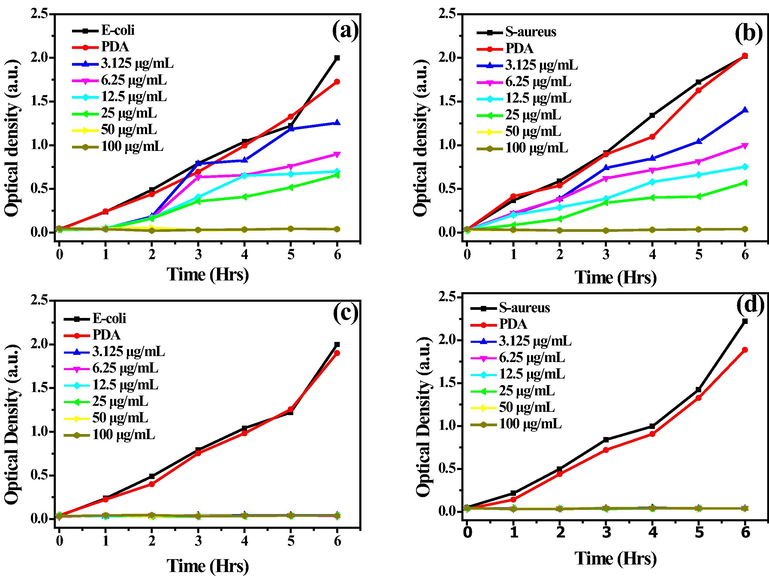
The bacterial growth curves of (A, B) Ag-PDA and (C, D) Ag@PDA against E-coli and S-aureus.
On the other hand, Ag@PDA nanocomposites could inhibit both bacterial strains (E. coli and S. aureus) from growing, as shown in Fig. 8c and d. The OD was constant throughout, and there was no turbidity observed in the suspensions. These results further prove the strong antimicrobial activity of Ag@PDA over that of Ag-PDA. At low concentrations of AgNPs loading (i.e., 1 and 5 mM AgNO3) as shown in Figure S13 (e-h), bacterial growth (E. coli) was observed within the first and the fourth hour for 3.125 µg/mL Ag@PDA. Above the concentration of 3.125 µg/mL, the bacterial growth was retarded the entire time. However, S. aureus seemed to be more resistant even at concentrations as high as 25 µg/mL since bacterial growth was observed within an hour. Only when the concentration of Ag@PDA was raised to 50 and 100 µg/mL did the bacterial growth get retarded for the entire study time. It was noticed that E. coli is more sensitive to both Ag-PDA and Ag@PDA nanocomposite than S. aureus. This may be attributed to the fact that gram-positive bacteria (S. aureus) have a thick cell membrane that is stable than that of gram-negative bacteria (E. coli). Gram-negative bacteria are more susceptible to AgNPs as compared to gram-positive.
According to previously reported work, AgNPs inhibit or kill bacteria through various mechanisms of action.. According to reported data, AgNPs kill bacteria by damaging the cell membrane leading to the leakage of organelles (Xie et al., 2019). It was also suggested that AgNPs first interact with the bacteria's cell wall or cell membranes, which disturb their properties. This is followed by the penetration of AgNPs inside the bacterial cell, resulting in DNA damage. Thirdly, Ag NPs undergo dissolution resulting in the release of silver ions which can possibly interact with thiol-containing proteins inside the cell (Shuai et al., 2020). Various studies also investigated the production of ROS by AgNPs and their ability to deplete antioxidants within the cells thereby inactivating the bacteria. In this study, Ag@PDA could kill and inhibit bacterial growth at concetration as low as 12.5 µg/mL. Ag-PDA was only found to be bacteriostatic instead of being bactericidal, even at 100 µg/mL. This means it will require larger amount Ag-PDA for bactericidal activity compared to Ag@PDA. The proposed mechanism of action of these nanocomposites to kill the bacteria is illustrated on a schematic in Fig. 9. The fast and prominent antimicrobial activity of Ag@PDA compared to Ag-PDA is due to the fact that AgNPs are exposed, and can easily interact with the negatively charged bacteria membrane and organelles. In addition, the release of Ag ion will be quiker from Ag@PDA compared to that of Ag-PDA. The direct interaction of Ag-PDA with bacteria membrane will be limited, and therefore, will mostly relies on penetrating the membrane, release the ions and production of ROS within the cell. It has also been reported that the interaction of Ag with PDA can induce the generation of ROS which can result in a significant damage of bacteria cell membrane (Niyonshuti and Krishnamurthi, 2020). The antimicrobial activity of the as-synthesized nanocomposites was further compared with other Ag based nanomaterials reported in related studies, as shown in Table 4. It is clear that the antimicrobial activity of the nanocomposites depends on various parameters such as concentration, composition, and structure of the nanocomposites. Ag-PDA and Ag@PDA showed increased antimicrobial activity at relatively low concentrations compared to other reported nanomposites (Table 4).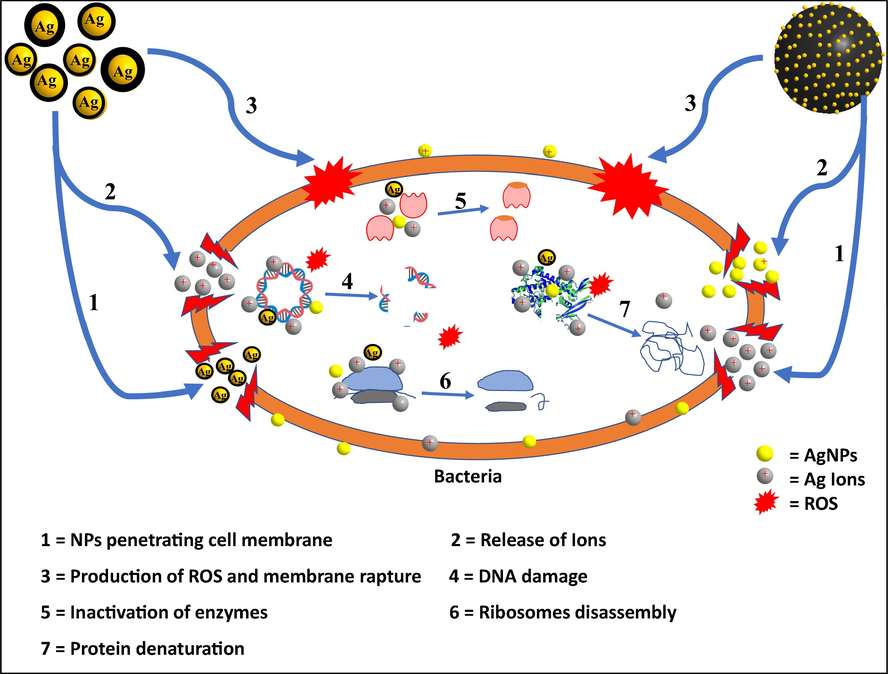
Schematic illustrating possible machanisms of action of the as-synthesized nanocomposites against bacteria.
Structural feature(s)
Antimicrobial performance
Concentration of AgNPs
References
ZOI (mm)
MIC (µg/mL)
Bactericidal/bacteriostatic and MBC (µg/mL)
Ag coated with PDA (Ag-PDA)
12
50
Bacteriostatic
5 mM
This work
Ag loaded on PDA surface (Ag@PDA)
13
6.25
12.5
5 mM
This work
Ag incorporated on PDA coated on a substrate
Not reported
Not reported
Bactericidal (MBC not reported)
12 mM
Sileika and Kim, 2011
Ag loaded on PDA spheres
Not reported
40
Bacteriostatic (MBC not reported)
1.96 mM
Wu et al., 2015
Ag coated with PDA
Not reported
Not Reported
Bactericidal (MBC not reported)
4.8 nM
Niyonshuti and Krishnamurthi, 2020
Ag loaded within polymers scaffold matrix (PLLA-PGA/6Ag@pMBG)
14.4
Not reported
Bactericidal (MBC not reported)
20 mM
Shuai et al 2019
Ag-Cellulose nanocomposite
63
0.25
Not reported
1 mM
Adepu and Khandelwal, 2018
Ag loaded on GO
13.1
50
Not reported
10 mM
Adepu and Khandelwal, 2018
4 Conclusions
Ag-PDA and Ag@PDA nanocomposites were successfully designed through a facile and green synthesis method. The diameters of AgNPs were controlled by varying the concentration of AgNO3. As the concentration of AgNO3 increased, the AgNPs diameter also increased. The stability of AgNPs was achieved by either coating or incorporating them on the surface of PDA. Both the nanocomposites have shown excellent thermal stability, as evident from the TGA. The toxicity of the nanocomposites towards HEK-239T and HDF cells was relatively low. However, at the high concentrations, the nanocomposites became toxic as expected. Ag@PDA affected the cell viability than Ag-PDA, rendering it more toxic than the latter.
Also evident from the results obtained in this study is that the Ag-PDA and Ag@PDA nanocomposites showed inhibition of bacterial growth at notably lower concentrations than their minimum cytotoxic concentrations. The antimicrobial activity of these composites against E. coli and S. aureus was excellent. It was found that the amount of AgNPs loading in terms of AgNO3 had more effect on the nanocomposites' antimicrobial activity than their sizes. At high Ag loading, the antimicrobial activity was also increased. Ag@PDA nanocomposites were more active than Ag-PDA. Moreover, Ag@PDA nanocomposites were bactericidal at a high concentration of Ag loading, wherein Ag-PDA nanocomposites were only bacteriostatic. With these findings, it is clear that the synthesized nanocomposites pose great potential in advanced wound care treatment. This is because of their ability to kill bacteria at low concentrations and their good biocompatibility towards HDF, which are the main cells present in skin connective tissue (dermis) and play a crucial role during cutaneous wound healing.
Acknowledgements
The authors would like to acknowledge the University of Witwatersrand School of Chemistry, The University of the Witwatersrand Postgraduate Merit Award and the National Research Foundation of South Africa for funding. We would also like to thank the DSI/Mintek Nanotechnology Innovation Centre, and the Centre for Metal-based Drug Discovery for allowing us to use their facilities for antibacterial and cytotoxicity studies, respectively.
Declaration of Competing Interest
The authors declare that they have no known competing financial interests or personal relationships that could have appeared to influence the work reported in this paper.
References
- The effect of capping agents on the toxicity of silver nanoparticles to Danio rerio embryos. Nanotoxicology. 2019;13:1-13.
- [Google Scholar]
- Broad-spectrum antimicrobial activity of bacterial cellulose silver nanocomposites with sustained release. Journal of Materials Science 2018 In this issue
- [CrossRef] [Google Scholar]
- Green synthesis of silver nanoparticles mediated by traditionally used medicinal plants in Sudan. Int. Nano Lett.. 2020;10:1-14.
- [Google Scholar]
- Effect of CTAB on the surface resonance plasmon intensity of silver nanoparticles: Stability and oxidative dissolution. J. Mol. Liq.. 2020;302:112565.
- [Google Scholar]
- Biodegradable zein–polydopamine polymeric scaffold impregnated with TiO2 nanoparticles for skin tissue engineering. Biomed. Mater.. 2017;12:055008.
- [Google Scholar]
- Potential use of silver nanoparticles on pathogenic bacteria, their toxicity and possible mechanisms of action. J. Braz. Chem. Soc.. 2010;21:949-959.
- [Google Scholar]
- One-step synthesis of monodisperse polydopamine-coated silver core–shell nanostructures for enhanced photocatalysis. New J. Chem.. 2012;36(1):148-154.
- [Google Scholar]
- A mechanistic study of the antibacterial effect of silver ions on Escherichia coli and Staphylococcus aureus. J. Biomed. Mater. Res.. 2000;52:662-668.
- [Google Scholar]
- Highly efficient graphene-based ternary composite catalyst with polydopamine layer and copper nanoparticles. ChemPlusChem. 2013;78(12):1483-1490.
- [Google Scholar]
- Synthesis of silver nanoparticles: chemical, physical and biological methods. Res. Pharm. Sci.. 2014;9:385-406.
- [Google Scholar]
- In vitro Evaluation of the Antimicrobial Efficacy and Biocompatibility of a Silver-Coated Central Venous Catheter. J. Biomater. Appl.. 1994;9:55-70.
- [Google Scholar]
- Antioxidant and antibacterial activity of silver nanoparticles synthesized by Cestrum nocturnum. J. Ayurveda Integrative Med.. 2020;11:37-44.
- [Google Scholar]
- Antibacterial activity of silver-nanoparticles against Staphylococcus aureus and Escherichia coli. Microbiol. Biotechnol. Lett.. 2011;39:77-85.
- [Google Scholar]
- Antimicrobial effects of metal ions (Ag+, Cu2+, Zn2+) in hydroxyapatite. J. Mater. Sci. - Mater. Med.. 1998;9:129-134.
- [Google Scholar]
- Facile Synthesis of SiO₂/CMC/Ag Hybrids Derived from Waste Biomass (Sugarcane Bagasse) Having Special Medical Application. Journal of Nanoscience and Nanotechnology 2020 In this issue
- [CrossRef] [Google Scholar]
- A Multifunctional Antibacterial and Osteogenic Nanomedicine: QAS-Modified Core-Shell Mesoporous Silica Containing Ag Nanoparticles. BioMed Research International 2020 In this issue
- [CrossRef] [Google Scholar]
- Polydopamine and Its Derivative Materials: Synthesis and Promising Applications in Energy, Environmental, and Biomedical Fields. Chem. Rev.. 2014;114:5057-5115.
- [Google Scholar]
- Facile synthesis of novel size-controlled antibacterial hybrid spheres using silver nanoparticles loaded with poly-dopamine spheres. RSC Adv.. 2015;5:13470-13477.
- [Google Scholar]
- Polydopamine—a nature-inspired polymer coating for biomedical science. Nanoscale. 2011;3:4916-4928.
- [Google Scholar]
- A review of the antibacterial effects of silver nanomaterials and potential implications for human health and the environment. J. Nanopart. Res.. 2010;12:1531-1551.
- [Google Scholar]
- Antibacterial effect of silver nanoparticles on Staphylococcus aureus. Res. Microbiol.. 2011;165:542-549.
- [Google Scholar]
- Sulfadiazine Silver-Resistant Pseudomonas in Burns. New Topical Agents. 1981;116:854-857.
- [Google Scholar]
- Improving the random lasing performance using Au@SiO2 nanocubes-silver film hybrid structure. Journal of Luminescence 2021 In this issue
- [CrossRef] [Google Scholar]
- Polydopamine Surface Coating Synergizes the Antimicrobial Activity of Silver Nanoparticles. ACS Applied Materials & Interfaces 2020 In this issue
- [CrossRef] [Google Scholar]
- Stable PEG-coated silver nanoparticles – A comprehensive toxicological profile. Food Chem. Toxicol.. 2018;111:546-556.
- [Google Scholar]
- The role of tannic acid and sodium citrate in the synthesis of silver nanoparticles. J. Nanoparticle Res.. 2017;19:1-15.
- [Google Scholar]
- Antimicrobial Efficacy of Low Concentration PVP-Silver Nanoparticles Deposited on DBD Plasma-Treated Polyamide 6,6 Fabric. Coatings.. 2019;9:581.
- [Google Scholar]
- Mussel-Inspired Polydopamine-Treated Polyethylene Separators for High-Power Li-Ion Batteries. Adv. Mater.. 2011;23:3066-3070.
- [Google Scholar]
- Molecular insights into sodium dodecyl sulphate mediated control of size for silver nanoparticles. J. Mol. Liq.. 2019;273:222-230.
- [Google Scholar]
- Shape controlled synthesis of dextran sulfate stabalized silver nanoparticles: biocompatibility and anticancer activity. Mater. Res. Express. 2019;6:045066.
- [Google Scholar]
- Enhanced colloidal stability and antibacterial performance of silver nanoparticles/cellulose nanocrystal hybrids. J. Mater. Chem. B. 2015;3:603-611.
- [Google Scholar]
- A strawberry-like Ag-decorated barium titanate enhances piezoelectric and antibacterial activities of polymer scaffold. Nano Energy. 2020;74:104825.
- [Google Scholar]
- Antibacterial polymer scaffold based on mesoporous bioactive glass loaded with in situ grown silver. Chem. Eng. J.. 2019;374:304-315.
- [Google Scholar]
- Antibacterial Performance of Polydopamine-Modified Polymer Surfaces Containing Passive and Active Components. ACS Applied Materials & Interfaces 2011 In this issue
- [CrossRef] [Google Scholar]
- Antibacterial Performance of Polydopamine-Modified Polymer Surfaces Containing Passive and Active Components. ACS Appl. Mater. Interfaces. 2011;3:4602-4610.
- [Google Scholar]
- Silver nanoparticles as antimicrobial agent: a case study on E. coli as a model for Gram-negative bacteria. J. Colloid Interface Sci.. 2004;275:177-182.
- [Google Scholar]
- Fabrication of Silver Nanoparticles and Their Antimicrobial Mechanisms European Cells and Materials. 2006;11:58.
- Mussel-inspired pH-responsive copper foam with switchable wettability for bidirectional oil-water separation. Colloids Surf., A. 2021;630:127603.
- [Google Scholar]
- Simple and facile preparation of silver–polydopamine (Ag–PDA) core–shell nanoparticles for selective electrochemical detection of cysteine. RSC Adv.. 2016;6(55):49578-49587.
- [Google Scholar]
- Polydopamine interface encapsulating graphene and immobilizing ultra-small, active Fe3O4 nanoparticles for organic dye adsorption. Ceram. Int.. 2021;47(3):3219-3231.
- [Google Scholar]
- Preparation and characterization of antifouling and antibacterial polysulfone ultrafiltration membranes incorporated with a silver–polydopamine nanohybrid. J. Appl. Polym. Sci.. 2018;135(27):46430.
- [Google Scholar]
- Bioinspired synthesis of polydopamine/Ag nanocomposite particles with antibacterial activities. Mater. Sci. Eng., C. 2015;55:155-165.
- [Google Scholar]
- The antibacterial stability of poly (dopamine) in-situ reduction and chelation nano-Ag based on bacterial cellulose network template. Appl. Surf. Sci.. 2019;491:383-394.
- [Google Scholar]
- Polydopamine particles for next-generation multifunctional biocomposites. J. Mater. Chem. A. 2014;2:7578-7587.
- [Google Scholar]
- Polydopamine Spheres as Active Templates for Convenient Synthesis of Various Nanostructures. Small. 2013;9:596-603.
- [Google Scholar]
- Surface area or diameter – which factor really determines the antibacterial activity of silver nanoparticles grown on TiO2 coatings? New J. Chem.. 2014;38:3275-3281.
- [Google Scholar]
- An aerogel adsorbent with bio-inspired interfacial adhesion between graphene and MoS2 sheets for water treatment. Appl. Surf. Sci.. 2020;512:145717.
- [Google Scholar]
Appendix A
Supplementary data
Supplementary data to this article can be found online at https://doi.org/10.1016/j.arabjc.2022.103798.
Appendix A
Supplementary data
The following are the Supplementary data to this article:Supplementary data 1
Supplementary data 1


