

Inhibitory effects of ethyl acetate and butanol fractions from Morinda lucida benth on benzene-induced leukemia in mice
⁎Corresponding author. aadetutu@lautech.edu.ng (Adewale Adetutu),
-
Received: ,
Accepted: ,
This article was originally published by Elsevier and was migrated to Scientific Scholar after the change of Publisher.
Peer review under responsibility of King Saud University.
Abstract
Introduction
Morinda lucida Benth has been traditionally reported as a remedy for the treatment of cancer as well as Leukemia in Africa. Therefore, this study was aimed at screening fractions of M. lucida for potential anti-leukemia constituents and activities in mice.
Methods
leukemia was induced with intra-peritoneal administration of benzene. Fractions of M. lucida were administered by oral gavaging in mice and screened for anti-leukemia and anti-clastogenic activities. The liver sections were assessed for hepatoprotective activity and possible anti-leukemia compounds in fractions were analysed using GC-MS. Docking analysis was done to understand the mechanism of anti-leukemic activity.
Results
Significant (p < 0.05) anti-leukemic activity was observed in the ethyl acetate and n-butanol fractions while prevention of chromosomal and liver damage was exhibited by all the fractions. GC-MS analysis of the fractions revealed anti-leukemic constituents. The identified constituents showed promising pharmacokinetic properties and inhibitory potential against certain proteins involved in cancer development.
Conclusion
Overall, the anti-leukemic activity observed in this study might be attributed to the antioxidant, apoptotic induction, cell cycle control, and anti-inflammatory properties of M. lucida fractions.
Keywords
Leukaemia
M. lucida
Cell cycle
Apoptosis
Ethyl acetate and n-butanol fractions
In-silico

1 Introduction
Leukemia, a cancer of the blood and bone marrow is characterized by uncontrolled proliferation of immature blood cells that originate from mutated Hematopoietic stem cells (HSC). This malignancy in HSC arises because of the arrest of normal blood cell maturation (Kuo et al., 2017) consequently impeding the development of healthy functional cells (Lau et al., 2009a; 2009b). Leukemia accounts for about 61,090 new cases representing 3.2% of all cancer and 23,660 deaths representing 3.9% of all cancer death in 2021 (NCI, 2021). The global awareness of Leukemia as a major contributor to the number of cancer death worldwide across ages has intensify research efforts and clinical studies against the disease (Wasser and Weis, 1999). The development of treatments for leukemia has advanced over the years and chemotherapy is the main type of treatment given to patients (Yang et al., 2015). The improvements in leukemia treatments have increased the 5-year survival rate to 65% (National Cancer Institute, 2021). However, the development of more effective treatments is needed to decrease the number of fatalities caused by this disease (Choodamani et al., 2021).
Deregulation in the cell cycle and differentiation processes is the main cause of transformation of a normal cell to a cancerous cell (Otto and Sicinski, 2017). Cell growth and development is a complex process that is inter linked by several molecular pathways. For instance, progression through the cell cycle checkpoints is regulated by complex interactions of cyclin and cyclin-dependent kinases (CDKs), and apoptotic proteins (Jayaraman and Jamil, 2014; Ullah et al., 2019). Whereas transforming growth factor (TGF β) is a cytokine that plays key role in cell proliferation, differentiation, and apoptosis (Nakano et al., 2017). In the light of this, the genes and proteins regulating these processes can serve as key therapeutic targets for the development of new and effective drug candidate.
Medicinal plants are been used in the treatment of various diseases with important contribution to therapies for various cancer (Gao and Watanabe, 2011; Hsu and Chung, 2012; Seydi et al., 2015). Several plant compounds with varying anti-carcinogenic mechanism have been reported (Hadem et al., 2016).
Morinda lucida belongs to the Rubiaceae family, it is a tropical West Africa rain forest tree also called Brimstone tree (Adeneye and Agbaje, 2008). The plant has been used locally for cancer treatments in the western part of Nigeria (Adeleye et al., 2018). Pharmacological studies have shown that M. lucida possess hypoglycaemic activity (Odutuga et al., 2010), antiplasmodial (Unekwuojo et al., 2011; Umar et al., 2013), antimicrobial activity (Addy et al., 2013), antifungal activity (Rath and Ndonzao, 1995) and anticancer activity (Ajaiyeoba et al., 2006). We had previously reported the anti-leukemic potential of the crude extracts in mice (Adetutu et al., 2020), whereas, Appiah-Opong et al. (2016) reported the efficacy in leukemia cell line. In this present study, we evaluated the anti-leukemic potentials of M. lucida fractions and identified the phytochemicals in the bioactive fractions. We also elucidated the possible mechanism by which the bioactive fractions exhibited anti-leukemic activity using molecular docking analysis.
2 Materials and methods
2.1 Plant collection and extraction of M. lucida extract
M. lucida leaves were collected and authenticated with voucher number LHO505 by a qualified taxonomist. The leaves were then air-dried for three weeks and pulverized using electric blender. Five hundred grams (500 g) of the leaves was soaked in 2.5 L of methanol for 72 hrs with constant shaking. The crude extract was filtered using filter paper and then concentrated with rotary evaporator. The concentrated samples were kept in the refrigerator until further use.
2.2 Fractionation of M. lucida
Methanol leaf extract of M. lucida was fractionated using four different solvents (n-hexane < chloroform < ethylacetate < n-butanol) according to Bakht et al. (2011) and Ahmed et al. (2015) with slight modification. Firstly, 380 g of the pulverized leaves sample was extracted in methanol (1.5 L) and concentrated using rotary evaporator at 40 °C. The crude extract was dissolved in distilled water (150 ml) and partitioned sequentially with n-hexane (200 ml), chloroform (200 ml), ethyl acetate (200 ml) and n-butanol (200 ml) respectively. Upon dissolution of the crude extract in water, and the addition of n-hexane (the least polar), the mixture was stirred on magnetic stirrer for an hour, transferred into a separating funnel and allowed to stand for about three hours until distinct layers were formed. Compounds soluble in the upper n-hexane phase (n-hexane being lighter than water) were collected and the lower aqueous phase was extracted with the next solvent in the increasing order of polarity i.e. chloroform < ethylacetate < n-butanol. Chloroform is heavier than water, ethyl acetate (lighter than water) and n-n-butanol (lighter than water). The fractions were concentrated under pressure using rotary evaporator and stored at 4 °C until use.
2.3 Experimental animals and design
Forty-eight male Swiss albino mice (20–30 g) were acclimatized for a period of 2 weeks in cages and kept under normal light/dark cycle with assess to food and water ad libitum. The animals were divided into 8 groups of six animals each. Animals were made leukaemic with intra-peritoneal administration of 400 mg benzene /kg body weight diluted in propanol and water at 2:1:1 respectively every 48 hr for four weeks (Lau et al., 2009a; 2009b). After four weeks, leukemia was established by the presence of blast cells in the peripheral blood of all animals. Treatment of the animals began after induction was established and continued every 48 hr for four weeks (Table 1). The dose of extracts and the standard drug was calculated based on the data published earlier (Akindele et al., 2015; Unekwuojo et al., 2011).
| Groups | Treatment |
|---|---|
| A | Induction + 200 mg/kg/bw of n-hexane fraction of Morinda lucida |
| B | Induction + 200 mg/kg/bw of chloroform fraction of Morinda lucida |
| C | Induction + 200 mg/kg/bw of ethyl acetate fraction of Morinda lucida |
| D | Induction + 200 mg/kg/bw of n-butanol fraction of Morinda lucida |
| E | Induction + 200 mg/kg/bw of aqueous fraction of Morinda lucida |
| F | Induction without treatment + DMSO (Negative control) |
| G | DMSO (Control) |
| H | Induction + 25 mg/kg/bw of 5-fluorouracil (Positive control) |
Induction: Mice were induced with leukemia interperitoneally with 400 mg/kg body weight of benzene.
2.4 Establishment of leukaemia
2.4.1 Preparation of slide and establishment of leukemia
The presence of blast cells in the peripheral blood of all animals and percentage greater than 20% in bone marrow of selected animals proved leukemia induction (Whitlock and Gaynon, 2004). Bone marrow and blood smear were made on slides respectively, fixed in methanol and then stained with Leishman for 30 min. Slides were washed in phosphate buffered saline and allowed to dry. The slides were viewed under microscope and percentage blast cells were scored in bone marrow and detected in the peripheral blood. The blast cells were myeloblast identified by the presence of fine chromatin, large nucleus and blue cytoplasm without granules.
2.4.2 Micronucleus assay and histopathological study
The method of Rebouças et al. (2013) was adopted for the micronucleus assay with slight modification. The bone marrow was extracted from the two femurs and smears were prepared directly on slides, two per animal. Bone marrow smear was prepared with a drop of bovine calf serum, fixed with 30% methanol and then stained with May-Grunewald’s and 5% Giemsa. The slides were air-dried and coded for blind analysis. The incidence of micronuclei (MN) was observed in 1000 PCE for each animal with the aid of microscope and the percentage of micro-nucleated cells was calculated by dividing the number of cells exhibiting a micronucleus by the total number of polychromatic erythrocytes × 100. The test groups were compared with the respective controls, separately and in combination. For histological study, the liver was harvested from each mouse, washed and then fixed in 10% formal saline. Tissues were processed for light microscopic examination.
2.4.3 Gas chromatography-mass spectroscopy analysis
Identification of compounds in the ethyl acetate and n-butanol fractions of M. lucida was done on a GC-MS system (Agilent Technologies, 789OA) coupled with VL5975C Mass Selective Detector (MSD). HP5MS capillary column (30 m in length × 0.032 mm in diameter × 0.25 µm in thickness) was used. Pure helium gas was used as the carrier gas with flow rate of 2 ml/min. The initial temperature was set at 80 °C for 2 mins raised to 240 °C at 10 °C/min and holding time of about 6 min. One (1) µl of the sample was injected in a spitless mode. Samples were run at a range of 35–550 m/z and the compounds present in each of the fractions were identified by direct comparison of the mass spectrum of the analyte at a retention time produced in the chromatogram to that of a reference standard found in MS library 2014 National Institute of Standards and Technology (NIST), Maryland USA.
2.4.4 Statistical analysis
All data were expressed as mean ± SEM. Data were analysed by one-way Analysis of Variance (ANOVA) test using Graph Pad Prism Software 5.01 and considered significant at 95% confidence level. We used principal component analysis to establish the relationship between the treatments groups and analyse the correlation between variables (haematological parameters, micro nucleated polychromatic erythrocytes (MnPCE), peripheral blood blast cell (PBB), and bone marrow blast cell (BMB)). The score plots and loading plots were plotted to describe the variation in the first two components using Minitab Statistical Software (version 18.0, Minitab Inc., Enterprise Drive State College, PA) (Muhammad et al., 2014).
3 Insilico studies of the possible mode of anti-leukemic activity of bioactive constituents of the ethyl acetate and n-butanol fractions
3.1 Software and database
Autodock tools 1.5.6, Autodock vina and BIOVIA discovery studio visualizer 2019, RCSB protein data bank database, Pubchem database, cactus online smiles translator and Swiss Adme Server for ADME Predictions.
3.2 Preparation of protein and ligands
The crystal structure of the five proteins; Tumour Growth Factor β receptor kinase-1 (TGF-β) (PDB: 1RW8), CDK-6 (PDB:1XO2), BCL-2 (PDB: 2O2F), CDK-2 (PDB:3FZ1) and KEAP-1 (4ZY3) were retrieved from the RCSB protein data bank ( https://www.rcsb.org/) and imported into the BIOVIA discovery studio software for preparation and molecular docking studies. On the other hand, the SDS format of each ligand was obtained from PubChem database ( https://pubchem.ncbi.nlm.nih.gov/) and taken to cactus online smiles translator ( https://cactus.nci.nih.gov/translate/) for 3D PDB ligand download. Before docking analysis, interacting ligands, and water molecules were removed from the protein, thereafter saved in PDB format for docking analysis.
3.3 Active site
The active site residues of each protein reported experimentally were retrieved from previous reports. TGF-β receptor 1 active residues included Lys 232, Glu245, Tyr249, Ser280, His283, Leu340, and Asp351 (Choodamani et al., 2021; Sawyer et al., 2004). CDK6 (Ile19, Val27, Ala41, Lys43, Glu61, Phe98, Glu99, His100, Val100, Val101, Gln103, Asp104, Gln149, Leu152, Ala162 and Asp163 (Lu et al., 2005), BCL-2 (Phe101, Arg104, Tyr105, Asp108, Phe109, Met112, Leu134, Gly142, Arg143, Ala146) (Bruncko et al., 2007). CDK2 (Glu8, Ile110, Ala31, Lys33, Glu51, Phe80, Glu81, Phe82, Leu83, Gln85, Asp86, Gln131, Leu134, Ala144, and Asp145 (Anderson et al., 2009; Lu et al., 2005) and KEAP-1 Arg326, Tyr334. Ser363, Gly364, Leu365, Ala366, Gly367, Cys368, Val369, Arg380, Asn382, Asn414, Arg415, Ile416, Gly417, Val418, Gly419, Val420, Ile461, Gly462, Val463, Gly464, Val465, Ala466, Val467, Phe478, Arg483, Ser508, Gly509, Ala510, Gly511, Val512, Cys513, Val514, Ser555, Ala556, Leu557, Gly558, Ile559, Thr560, Val561, Ser602, Gly603, Val604, Gly605, Val606, Ala607, and Val608 (Saito et al., 2016).
3.4 Molecular docking studies
On the Autodock tool, polar-H-atoms were added to the proteins followed by Gasteiger charges calculation. The protein file was saved as pdbqt file and the grid dimensions and binding centre were set for x, y, z respectively; (1.503, 9.264, 18. 381) for 1RW8, (3.106, 48.432, 136.146) for 1XO2, (-2.009, −0.79, −4.668) for 2O2F, (1.951, 30.472, 21.707) for 3FZ1 and (-35.186, −1.93, −26.537) for 4ZY3. Docking calculations (Binding Affinity (ΔG°) were then performed by using Vina folder (Trott and Olson, 2010). Interactions between the ligand and protein were visualized using the BIOVIA discovery studio 2019 and ligand that exhibits more negative free energy of binding and low Ki was considered more potent.
3.5 Drug-likeness and ADME profiling of the identified compounds
Drug likeliness and Pharmacokinetics prediction (ADME) of the ligands was achieved computationally using the Swissadme web server ( www.swissadme.ch/). The canonical SMILES of the screened compounds obtained from the PubChem database was used for the ADME prediction in swissadme server. The major parameters assessed included rule of five violation (Lipinski’s), absorption, distribution, metabolism, and excretion.
4 Results
4.1 Effects of the fractions of M. lucida on the formation of blast cel in the bone marrow and peripheral blood of mice
Table 2 showed the percentage of blast cells in the Bone Marrow (BM) and Peripheral Blood (PB) of leukaemic mice treated with the fractions of M. lucida. Percentage of blast cells greater than 20% in the BM and incident in the PB was admitted as Leukemia indices. Only the groups treated with the ethyl acetate and the n-butanol fractions as well as the 5-florouracil treated groups showed percentage of blast cells<20% in bone marrow and absence of blast cells in the PB (Table 2).
| Groups | Parameters | |
|---|---|---|
| % BLAST (BM) | % BLAST (PB) | |
| n-Hexane | 26 | 28 |
| Chloroform | 22 | 19 |
| Ethyl-acetate | 13 | 0 |
| n-butanol | 11 | 0 |
| Aqueous | 19 | 31 |
| Untreated | 31 | 41 |
| Control | 3 | 0 |
| 5-florouracil | 16 | 0 |
KEYS: Untreated (Negative control): leukemic group without treatment.
5-florouracil (Standard drug); Positive control) treated leukemic and treated.
Control: Normal group without any treatment.
BM = Bone marrow.
PB = Peripheral blood.
Fig. 1a and 1b are the representative photomicrograph of blood and bone marrow smear respectively of leukaemic mice showing the presence of blast cells and differentiating white cells.
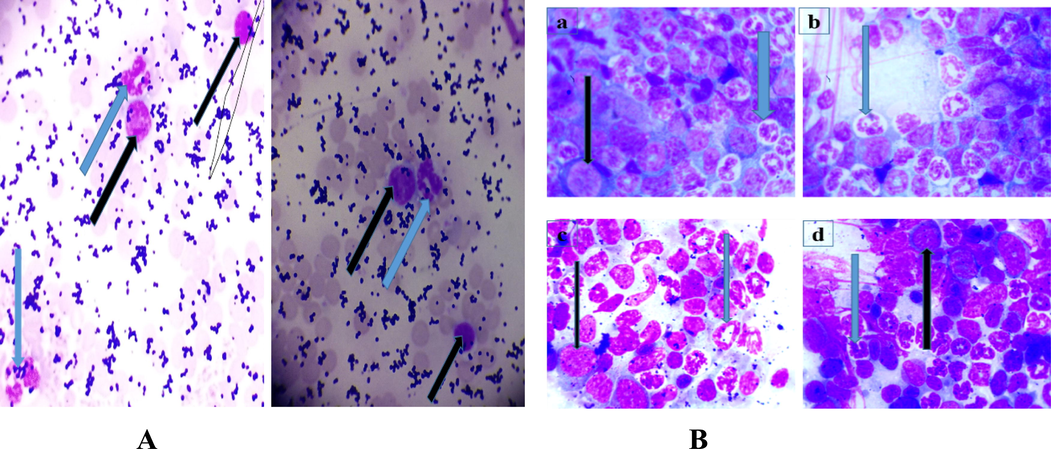
- A and 1B: Photomicrograph of Leishman stained blood and bone marrow smear with the presence of blast cells (black arrow) and neutrophil (blue arrow) (MG, X100). The blast cells were myeloblast identified by the presence of fine chromatin, large nucleus, and blue cytoplasm without granules. Lymphoblast on the other hand is characterized by more coarse chromatin and small cytoplasm. Fig. 1A(a) and Fig. 1B(b): are the representative photomicrographs of blood smear of mice during induction to establish leukemia before the commencement of treatments with the plant fractions. Fig. 1B(a), 1B(b) and 1B(c) are representative of the ethylacetate, n-butanol treated and control groups with numerous differentiated cells and few myeloblast characterized by large nucleus and blue cytoplasm. Fig. 1B(d) is a representative of the leukemic untreated group with less differentiated cells and more blast cells than the representative fraction treated groups.
4.2 Effects of M. lucida fractions on haematological parameters of mice.
Table 3 showed the effect of treatment of benzene induced leukaemic mice with the fractions of M. lucida on the haematological parameters. An insignificant (p > 0.05) increase in WBC was observed in the chloroform and n-butanol fraction treated group. Groups treated with n-hexane, ethyl acetate, n-butanol and aqueous fractions showed a significant (p < 0.05) increase in the HGB, RBC and PCV while the untreated, 5-florouracil and chloroform groups showed the least value for these parameters. Other parameters include granulocyte that was high in the untreated, chloroform and aqueous fraction groups but low in the control, ethyl acetate, n-butanol and 5-florouracil treated groups. Lymphocyte in the untreated, chloroform and aqueous fraction groups was low but high in the control, ethyl acetate, n-butanol and 5-florouracil treated groups (Table 2).
| Groups | PARAMETERS | |||||||
|---|---|---|---|---|---|---|---|---|
| Lymp % | Gran % | Mid % | WBC × 109/L | HGB g/dL | RBC × 1012/L | PCV % | PLT × 109/L | |
| n-Hexane | --- | ---- | ---- | 5.15 ± 2.05# | 11.65 ± 1.05** | 8.24 ± 1.22** | 40.95 ± 2.75*** | 1463 ± 695 |
| Chloroform | 25.0 | 61.9 | 13.1 | 6.9 ± 4.4# | 7.1 ± 0.20# | 5.99 ± 0.15# | 21.3 ± 0.6# | 1394 ± 49 |
| Ethyl-acetate | 57.3 | 22.5 | 20.2 | 2.73 ± 0.57** | 9.3 ± 0.90* | 6.87 ± 0.63* | 32.77 ± 2.62** | 1051 ± 197 |
| n-butanol | 68.8 | 18.8 | 12.6 | 4.9 ± 0.6# | 9.85 ± 1.55* | 7.96 ± 1.27** | 35.7 ± 4.3** | 551 ± 91 |
| Aqueous | 47.7 | 35.7 | 16.6 | 10.3 ± 4.7** | 8.0 ± 2.7# | 6.17 ± 1.87* | 30.3 ± 9* | 639 ± 446 |
| Untreated | 53.5 | 34.3 | 12.3 | 5.26 ± 1.86 | 7.15 ± 0.25 | 4.91 ± 0.42 | 23.4 ± 1.2 | 388 |
| Control | 81.47 | 12.07 | 8.5 | 4.23 ± 1.19# | 13.24 ± 0.89** | 8.42 ± 0.34** | 41.07 ± 3.14*** | 510 ± 116 |
| 5-florouracil | 58.9 | 25.1 | 16.0 | 5.1 ± 0.61# | 7.3 ± 2.42# | 4.84 ± 1.53# | 27.3 ± 8.17# | 865 |
PB (peripheral blood), BM (bone marrow). Blast ˃20% in BM and incidence in PB is leukaemia. Values were expressed as mean ± SEM and considered significant at P value < 0.05. ***significant difference when compared with the untreated group, #significant difference when compared with the control group.
KEYS; Untreated (Negative control): leukaemic group without treatment
5-florouracil (Positive control): leukaemic and treated with standard drug
Control: Normal group without any treatment
Induction: Mice in all the groups (except control group) were induced with 400 mg/kg/B.w of benzene for four weeks and treated with the fractions and 5-florouracil.
4.3 Anti-clastogenic effects of fractions of M. lucida
The result showed no significant (p > 0.05) difference in the percentage micro-nucleated polychromatic erythrocyte (%MnPCE) when the fraction treated groups were compared with the normal control and the 5-florouracil treated groups. When compared with the untreated group, a significant (p < 0.05) decrease in the %MnPCE was observed across the treatment groups, highly significant in the groups treated with the n-hexane, ethyl-acetate and n-n-butanol fractions as well as the drug treated group but slightly significant in the chloroform and aqueous fraction group (Fig. 2A). Fig. 2B is the representative photomicrograph showing the presence of Normochromatic Erythrocytes (NCE) and Micro Nucleated Polychromatic Erythrocytes (MnPCE).
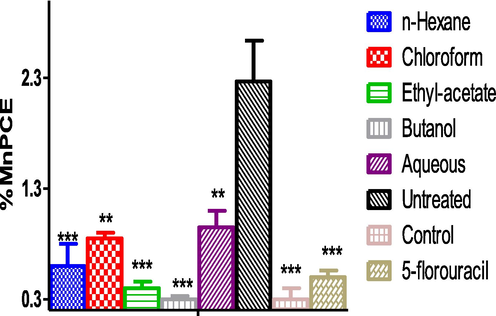
- Percentage MnPCE in benzene induced leukemic mice across treatment groups. ***significant difference when compared with the untreated group. Induction: Mice in all the groups (except control group) were induced with 400 mg/kg/B.w of benzene for four weeks and treated with the fractions and 5-florouracil. KEYS; Untreated (Negative control): leukaemic group without treatment. 5-florouracil (Positive control): leukaemic and treated with standard drug. Control: Normal group without any treatment MnPCE = Microucleated Polychromatic erythrocyte.
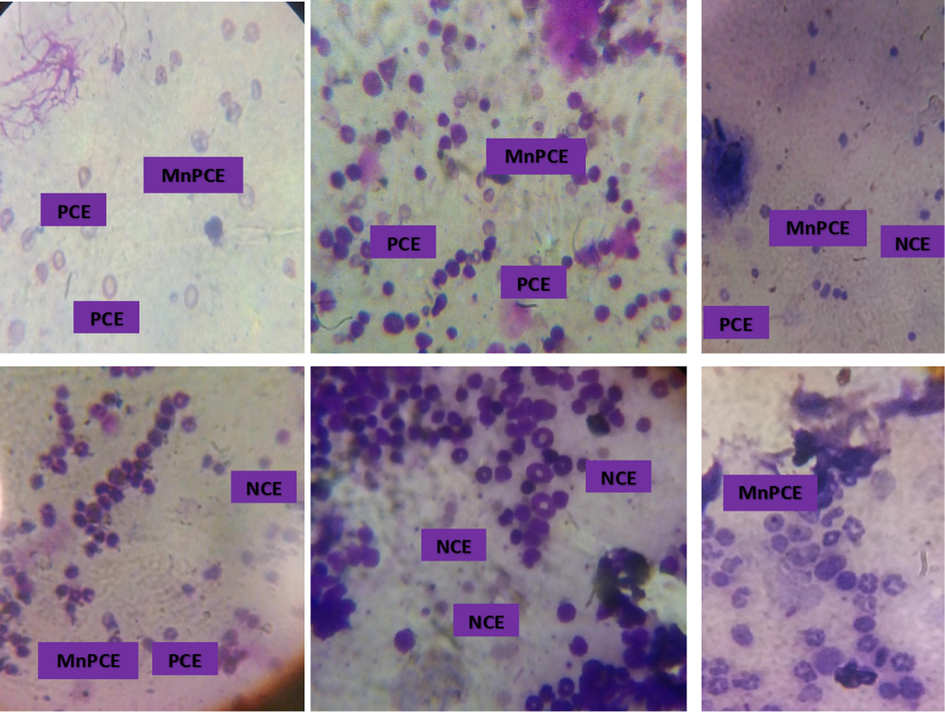
- Representative photomicrograph of bone marrow smears Stained with May-Grunwald’s and Geimsa in mice treated with benzene and or fractions of M. lucida. (MG, X100) The PCE is characterized by the presence of a chromatin at the centre while the micronucleated polychromatic erythrocytes in the addition contain small nuclei. The chromatin in the NCE is extruded. Fig. 2A is a representative of the n-hexane fraction treated group. Fig. 2B is a representative of the chloroform fraction treated group. Fig. 2C is a representative of the ethyl acetate fraction treated group. Figure 2D is a representative of the n-butanol fraction treated group. Fig. 2 E is a representative of the aqueous fraction treated group. Fig. 2F is a representative of the untreated group. PCE = Polychromatic Erythrocytes. NCE = Normochromatic Erythrocytes. MnPCE = Micro Nucleated Polychromatic Erythrocytes.
5 Principal component analysis (PCA)
The Screen plot (Fig. 7A) showed an overview of the similarities and differences among the treatment groups. While the loading plot, (Fig. 7B) described the relationship that existed among the measured biochemical parameter and their distribution within the first and second components dimensions. The two components accounted for 82.5 % of variations among the treatment groups. PC1 contributed majority (63.2 %) of the total variation while PC2 accounted for 19.3 % of the total variation. It is evidence that the variability observed in each group is accounted for by the treatment administered. Both the ethyl acetate and n-butanol fractions of M. lucida with the most significant anti-leukemic potential falls within the same quadrant close to the normal control while both the aqueous fraction and the untreated leukemic groups falls within the same quadrant showing that there is a least significant difference among these groups. The PC1 showed a positive correlation to the micronuccleated polychromatic erythrocytes (r= +0.40), bone marrow blast cells (r= +0.39), peripheral blood blast cell (r= +0.36) and WBC count (r= +0.24) but a negative correlation to PCV (r = -0.41), HGB (r = -0.41) and RBC (r = -0.40), all the biochemical parameters showed a negative correlation to PC2. Generally, the PC1 explained rather the large difference that existed especially between (control, ethylacetate, and n-butanol fractions) and the untreated leukemic, and the aqueous fraction treated groups. Both the PC1 and PC2 explained the divergence in the level of the biochemical parameters measured which were favourable for the n-butanol and ethyl acetate fraction that recorded low MnPCE, PBB and BMB.
5.1 Gas Chromatography-Mass spectroscopic analysis of ethyl acetate and n-butanol fractions of M. lucida
GC–MS spectra of M. lucida fractions revealed the peaks and indicated the occurrence of different compounds (Figs. 4 and 5). In addition, the spectra at m/z and molecular ion obtained were compared with data reported in literature (John et al., 2005). The chromatogram presented in Fig. 4 showed the retention time in the column and the peaks correspond to the compound present. Some of the compounds are indicated in Fig. 3 base on importance. Base on abundance, humulene (39.41%) and 3-decanone, 1-(4-hydroxy-3-methoxyphenyl)- (22.98%) were the most abundant. Other identified compounds include caryophyllene (3.9%), hexadecanoic acid, methyl ester (8.45%), and 1-(4-Hydroxy-3-methoxyphenyl)dec-4-en-3-one (2.87%).
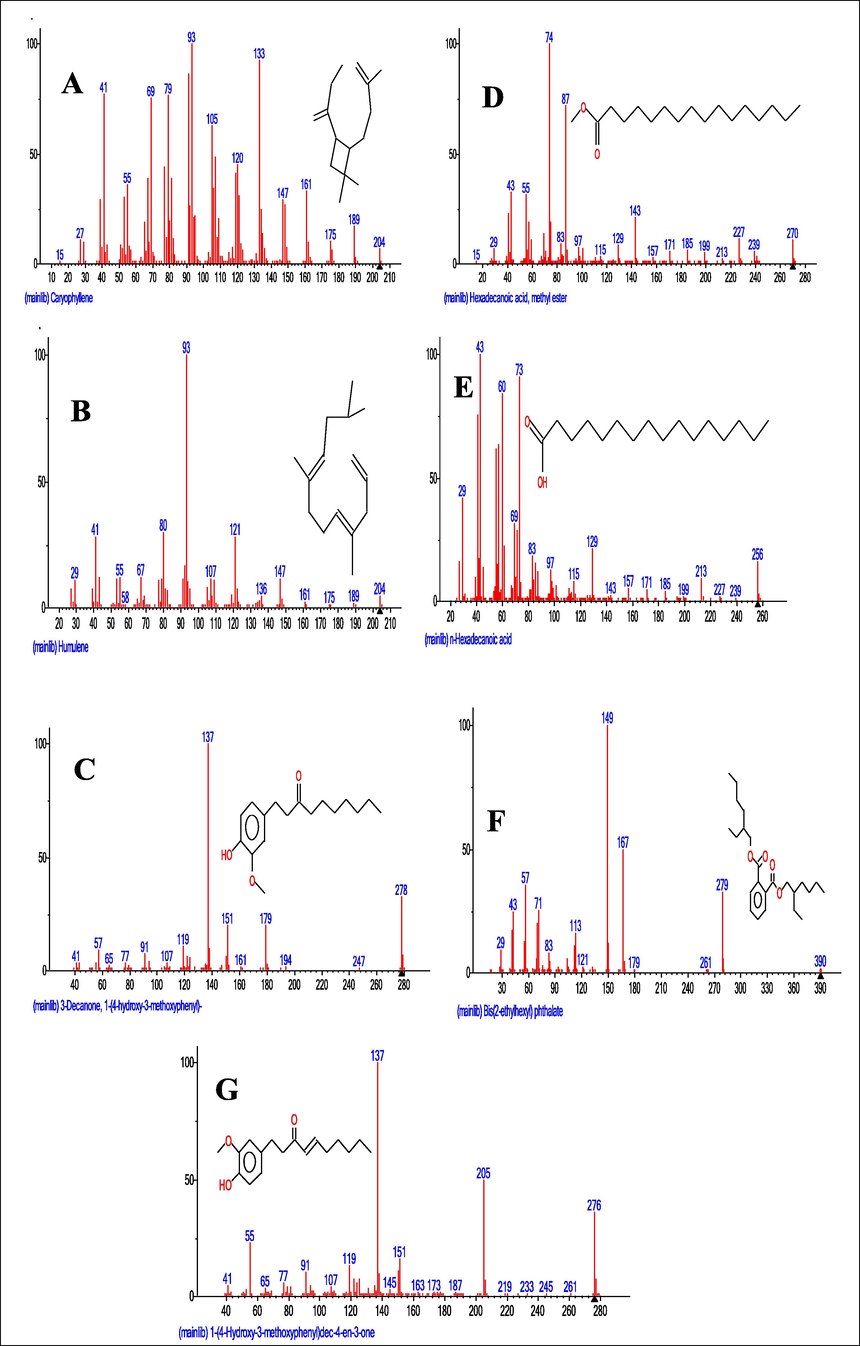
- Mass spectrum and structures of compounds identified in the ethyl acetate (A-D) and n-butanol (E-G) fractions of M. lucida. A = Mass spectrum and structure of caryophyllene identified in the ethyl acetate fraction. B = Mass spectrum and structure of Humulene identified in the ethyl acetate fraction. C = Mass spectrum and structure of 3-decanone, 1-(4-hydroxy-3-methoxyphenyl) identified in the ethyl acetate fraction. D = Mass spectrum and structure of hexadecanoic acid, methyl ester identified in the ethyl acetate fraction. E = Mass spectrum and structure of hexadecanoic acid identified in the n-butanol fraction. F = Mass spectrum and structure of 3-decanone,1-(4-hydroxy-3-methoxyphenyl) identified in the n-butanol fraction. G = Mass spectrum and structure of 1-(4-hydroxy-3-methoxyphenyl)dec-4-en-3-one identified in the n-butanol fraction.
Fig. 5 showed the retention time and 16 peaks corresponding to sixteen compounds in the n-butanol fraction. The mass spectrum and structures of some of the compounds present were shown in Fig. 4. 3-decanone,1-(4-hydroxy-3-methoxyphenyl) (41.45%), was the most abundant followed by 1-(4-Hydroxy-3-methoxyphenyl)dec-4-en-3-one (13.75%), and 1-(4-Hydroxy-3-methoxyphenyl)decane-3,5-dione (8.43%). Hexadecanoic acid, methyl ester (1.74%), was also identified.
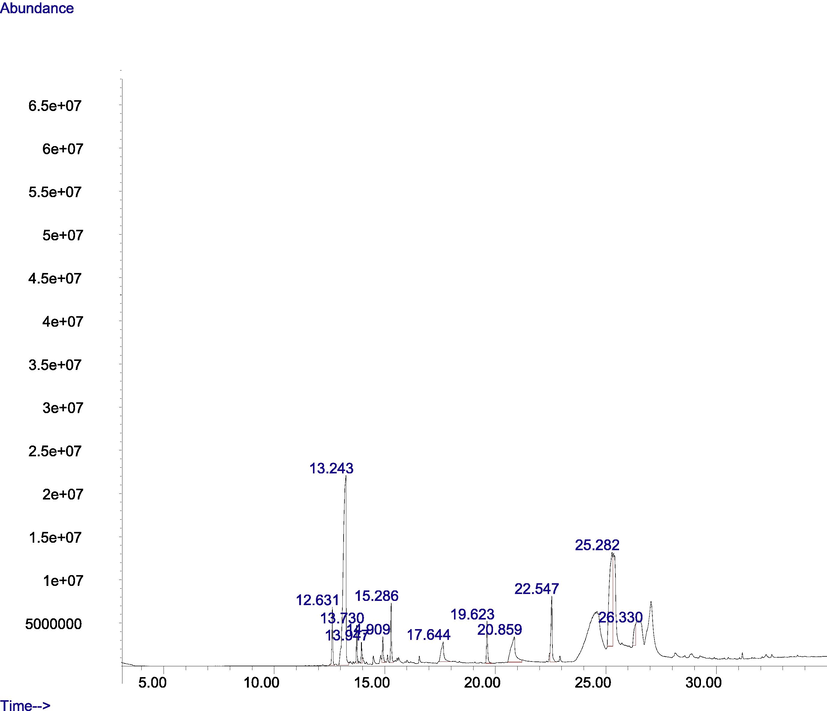
- GC-MS chromatogram of the ethyl acetate fraction of M. lucida.
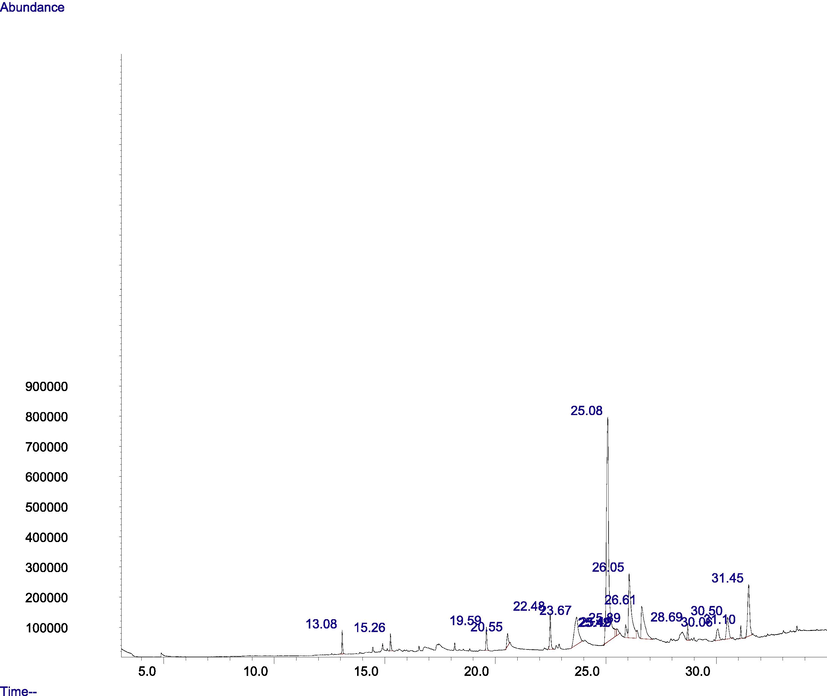
- GC-MS chromatogram of the n-butanol fraction of M. lucida.
5.2 Liver histo-pathological analysis of leukaemic mice treated with fractions of M. lucida
Figs. 6A and 6B is the photomicrograph of haematoxylin and eosin (H and E) stained liver section of benzene induced leukaemic mice treated with the fractions of M. lucida. The representative photomicrograph showed the portal triad (PT) comprised of hepatic vein (HV), hepatic artery (HA) and the bile duct (BD), central vein (CV) and branches of blood vessels. The photomicrograph is characterized by severe haemorrhage and fibrosis (Group E and F), presence of some necrotic tissue, degenerating blood vessel walls and some pyknotic hepatocytes as well as infiltration of some dark cells localized around the degenerating region (black arrow).
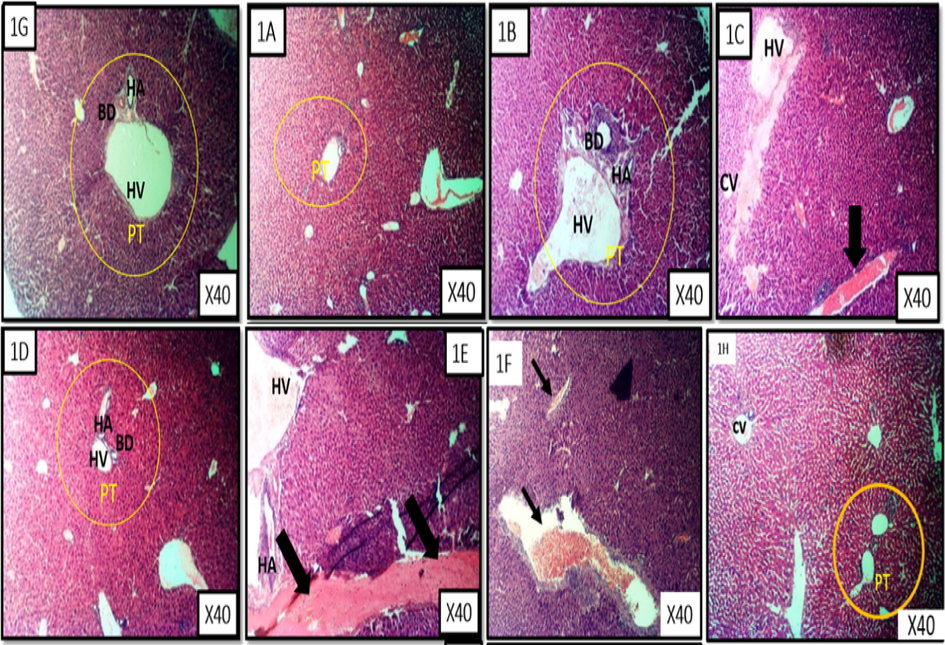
- Liver representative photomicrograph of leukaemic mice and treated with fractions of M. lucida. MG X40, H&E stain. Fig. 6 1A is a representative of the n-hexane fraction treated group. Fig. 6 1B is a representative of chloroform fraction treated group. Fig. 6 1C is a are representatives of ethyl acetate fraction treated group. Fig. 6 1D is a representative of the n-butanol fraction treated group. Fig. 6 1E is a representative of the aqueous fraction treated group. Fig. 6 1F is a representative of the untreated group . Fig. 6 1G is a representative of the control treated group. Fig. 6 1H is a representative of the 5-florouracil treated group.
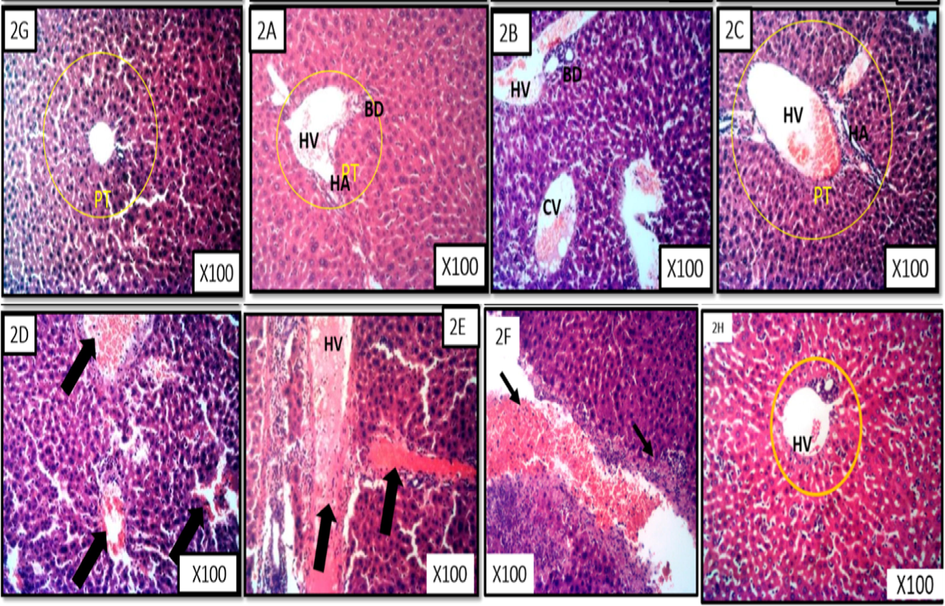
- Liver representative photomicrograph of leukaemic mice and treated with fractions of M. lucida. MG X100, H&E stain. Fig. 6 2A is a representative of the n-hexane fraction treated group. Fig. 6 2B is a representative of chloroform fraction treated group. Fig. 6 2C is a representative of ethyl acetate fraction treated group. Fig. 6 2D is a representative of the n-butanol fraction treated group. Fig. 6 2E is a representative of the aqueous fraction treated group. Fig. 6 2F is a representative of the untreated group. Fig. 6 2G is a representative of the control treated group. Fig. 6 2H is a representative of the 5-florouracil treated group.
6 Molecular docking analysis
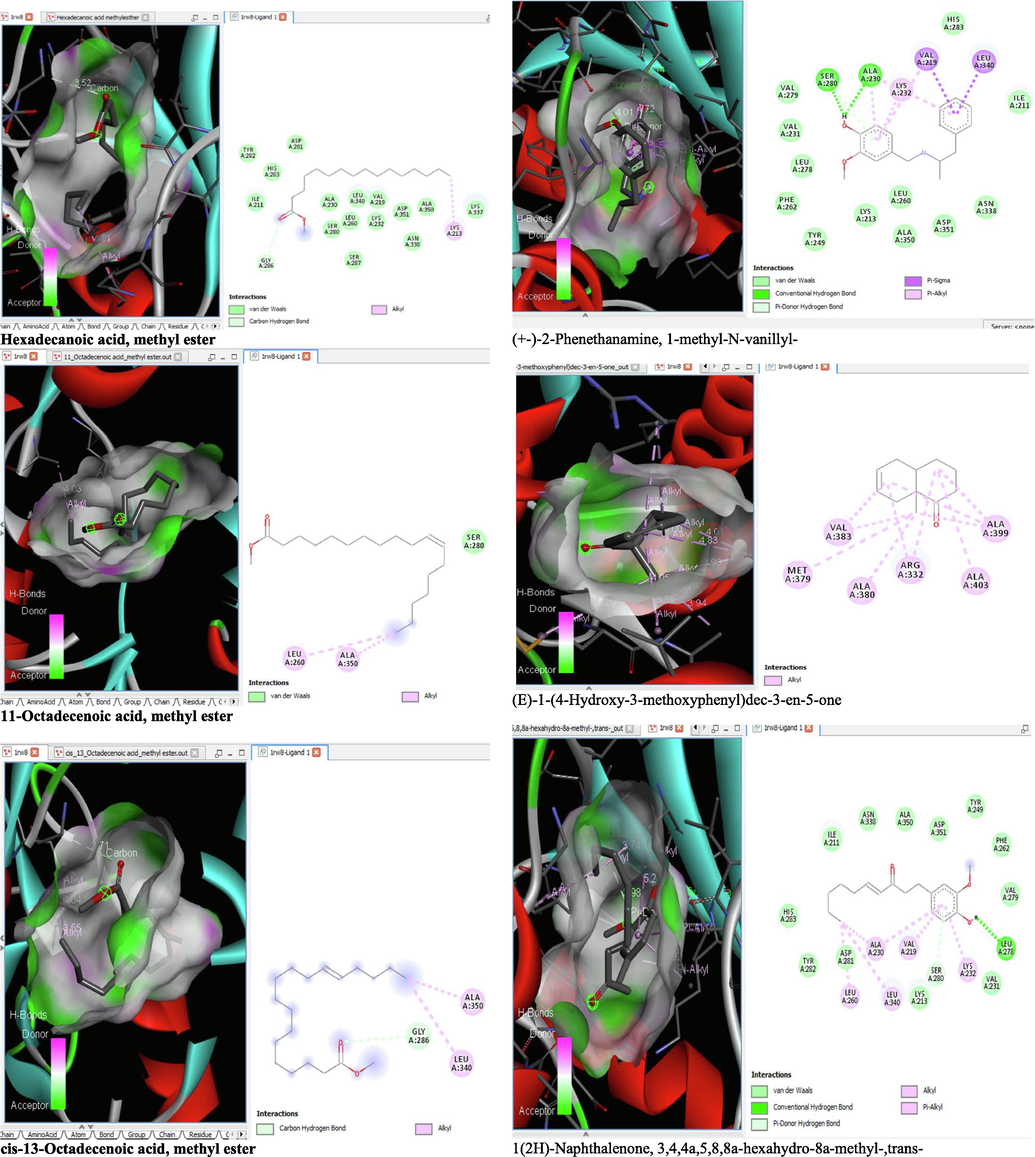
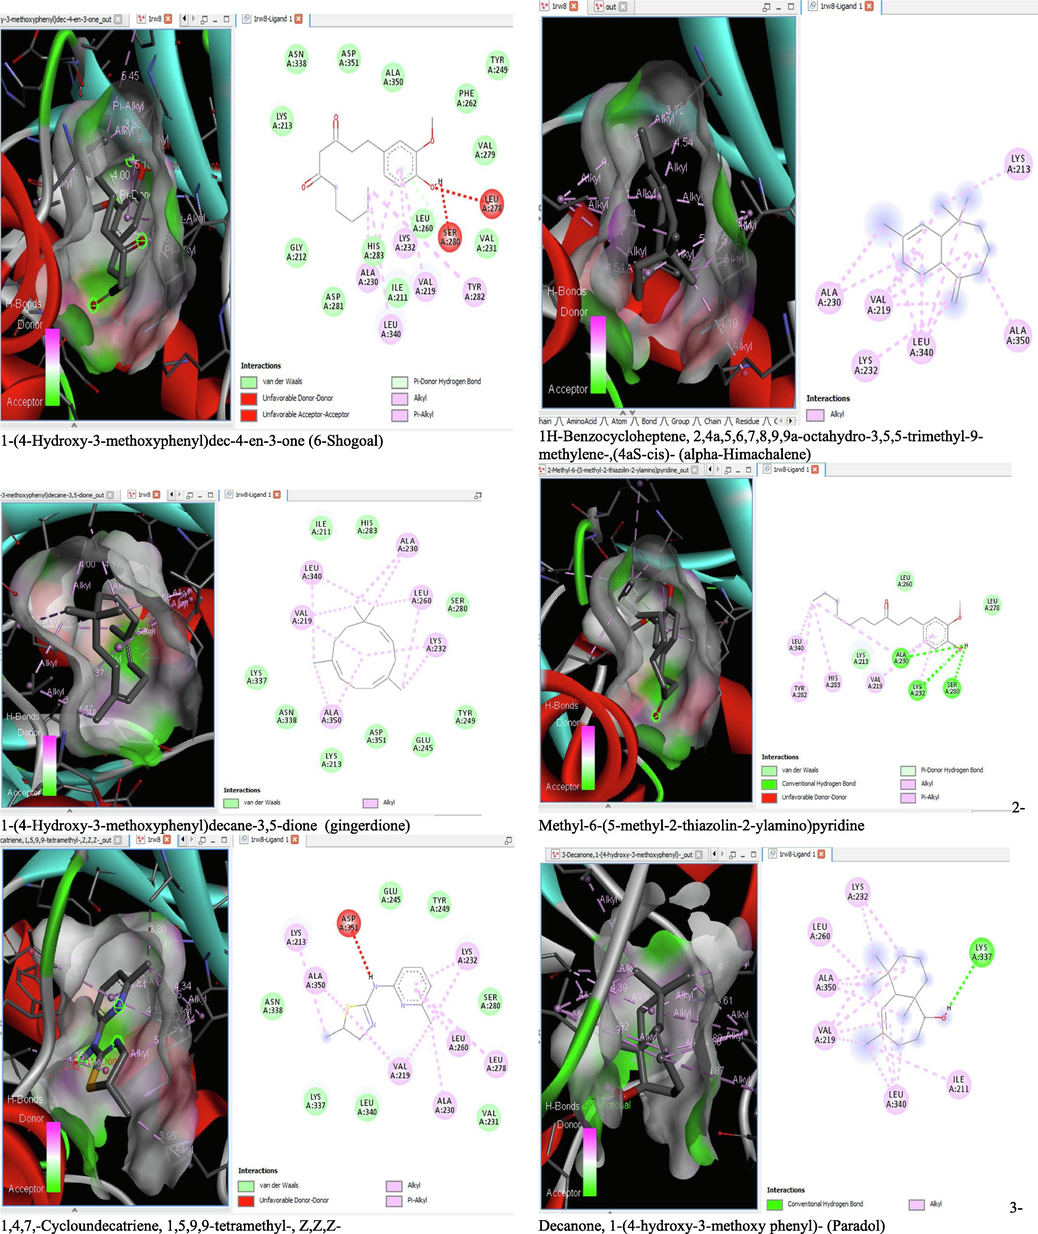
The binding affinity and the inhibition constant of the bioactive constituents of ethyl acetate and n-butanol fractions of M. lucida upon docking to the active site residue of the target proteins were depicted in Table 4. Some of the compounds exhibited lower binding energy thus indicating higher affinity for the target proteins. The binding energy for TGF-β receptor 1 range from −5.5 to −9.1 Kcal/mol. For cyclin dependent kinase 6, it ranges from −5.0 to −9.1 Kcal/mol, −4.8 to −7.9 Kcal/mol for BCL-2, −4.0 to −8.2 Kcal/mol for cyclin dependent kinase 2 and −4.7 to −8.2 Kcal/mol for Kelch-like ECH Associated Protein-1 (KEAP-1). Overall, 11 of the screened compounds namely (+-)-2-Phenethanamine,1-methyl-N-vanillyl-, (E)-1-(4-Hydroxy-3-methoxyphenyl)dec-3-en-5-one, 1(2H)-Naphthalenone,3,4,4a,5,8,8a-hexahydro-8a-methyl-,trans-, 6-Shogoal, Gingerdione, 1,4,7,-Cycloundecatriene,1,5,9,9-tetramethyl-,Z,Z,Z-, Alpha-Himachalene, 2-Methyl-6-(5-methyl-2-thiazolin-2-ylamino)pyridine, Paradol, Bis(2-ethylhexyl) phthalate and cis-Z-.alpha.-Bisabolene epoxide exhibited the highest binding affinity for all the target proteins. The best pose compounds bind with one or more amino acid residue within the active site of the proteins via hydrogen bond, van der waals, alkyl, π-alkyl, π- π T-shape and π-σ interactions. The protein–ligand complexes for each of the compounds and receptor showing the type of bonds and the interacting amino acid residues are revealed in Figs. 8A–8E.
| S/N | Ligand | TGF-β | CDK-6 | BCL-2 | CDK-2 | KEAP-1 | |||||
|---|---|---|---|---|---|---|---|---|---|---|---|
| Binding Affinity ΔG (Kcal/mol) | Inhibition Constant Ki (µM) 10-6 | Binding Affinity ΔG (Kcal/mol) | Inhibition Constant Ki (µM) 10-6 | Binding Affinity ΔG (Kcal/mol) | Inhibition Constant Ki (µM) 10-6 | Binding Affinity ΔG (Kcal/mol) | Inhibition Constant Ki (µM) 10-6 | Binding Affinity ΔG (Kcal/mol) | Inhibition Constant Ki (µM) 10-6 | ||
| Hexadecanoic acid, methyl ester | −5.5 | 107 | – | – | −4.8 | 342 | −4.0 | 1292 | −5.0 | 245 | |
| 11-Octadecenoic acid, methyl ester | −5.7 | 76.5 | −5.8 | 64.8 | −5.2 | 176 | −5.1 | 207 | −4.7 | 403 | |
| cis-13-Octadecenoic acid, methyl ester | −5.7 | 76.5 | −5.7 | 76.5 | – | – | – | – | −5.0 | 245 | |
| (+-)-2-Phenethanamine, 1-methyl-N-vanillyl- | −9.1 | 0.27 | −8.9 | 0.37 | −7.6 | 3.25 | −7.5 | 3.83 | −8.0 | 1.67 | |
| (E)-1-(4-Hydroxy-3-methoxyphenyl)dec-3-en-5-one | −6.8 | 12.3 | −7.9 | 1.97 | −6.3 | 28.2 | −6.8 | 12.3 | −6.3 | 28.2 | |
| 1(2H)-Naphthalenone, 3,4,4a,5,8,8a-hexahydro-8a-methyl-,trans- | −8.3 | 1.01 | −8.4 | 0.86 | −6.8 | 12.3 | −7.0 | 8.80 | −6.7 | 14.5 | |
| 1-(4-Hydroxy-3-methoxyphenyl)dec-4-en-3-one (6-Shogoal) | −8.1 | 1.41 | −7.9 | 1.97 | −6.3 | 28/2 | −7.1 | 7.45 | −7.0 | 8.80 | |
| 1-(4-Hydroxy-3-methoxyphenyl)decane-3,5-dione (gingerdione) | −8.1 | 1.41 | −9.1 | 0.27 | −6.9 | 10.4 | −8.2 | 1.20 | −6.6 | 17.10 | |
| 1,4,7,-Cycloundecatriene, 1,5,9,9-tetramethyl-, Z,Z,Z- | −7.3 | 5.35 | −7.5 | 3.83 | −5.8 | 64.8 | −6.8 | 12.3 | −7.2 | 6.31 | |
| 1H-Benzocycloheptene, 2,4a,5,6,7,8,9,9a-octahydro-3,5,5-trimethyl-9-methylene-,(4aS-cis)- (alpha-Himachalene) | −8.1 | 1.41 | −8.2 | 1.20 | −6.3 | 28.2 | −7.2 | 6.31 | −6.9 | 10.4 | |
| 2-Methyl-6-(5-methyl-2-thiazolin-2-ylamino)pyridine | −8.0 | 1.67 | −8.3 | 1.01 | −5.6 | 90.5 | −7.0 | 8.80 | −6.6 | 17.1 | |
| 3-Decanone, 1-(4-hydroxy-3-methoxy phenyl)- (Paradol) | −7.7 | 2.75 | −8.7 | 0.52 | −6.7 | 14.5 | −7.7 | 2.75 | −8.2 | 1.20 | |
| 4aR,5R,9aR)-1,1,4a,8-Tetramethyl-2,3,4,4a,5,6,7,9a-octahydro-1H-benzo[7]annulen-5-ol (Allohimachalol) | −6.4 | 23.9 | −6.7 | 14.5 | −6.4 | 23.9 | −5.9 | 54.8 | −5.4 | 126 | |
| 12-Oleanen-3-yl acetate, (3.alpha.)- (beta-Amyrenyl acetate) | −7.6 | 3.25 | −5.0 | 245 | −6.8 | 12.3 | −6.8 | 12.3 | −7.0 | 8.80 | |
| Bis(2-ethylhexyl) phthalate | −7.5 | 3.83 | −8.5 | 0.73 | −7.2 | 6.31 | −7.5 | 3.83 | −7.3 | 5.35 | |
| Caryophyllene | −5.8 | 64.8 | −6.8 | 12.3 | −6.4 | 23.9 | −5.8 | 64.8 | −5.6 | 90.3 | |
| cis-Z-.alpha.-Bisabolene epoxide | −8.0 | 1.67 | −8.3 | 1.01 | −7.9 | 1.97 | −7.2 | 6.31 | −6.0 | 46.4 | |
| Cyclohexene, 3-(1,5-dimethyl-4-hexenyl)-6-methylene-, [S-(R*,S*)]- | −5.6 | 90.3 | −7.2 | 6.31 | −5.7 | 76.5 | −6.2 | 33.3 | −5.3 | 149 | |
| endo-2-Methylbicyclo[3.3.1]nonane | −6.0 | 46.4 | −6.6 | 17.1 | −5.9 | 54.8 | −5.7 | 76.5 | −5.2 | 176 | |
| Humulene | −6.3 | 28.2 | −6.6 | 17.1 | −5.9 | 54.8 | −5.3 | 149 | −5.3 | 149 | |
| n-Hexadecanoic acid | −6.3 | 28.2 | −6.7 | 14.5 | −6.4 | 23.9 | −5.6 | 90.3 | −5.4 | 126 | |
| Squalene | −6.2 | 33.3 | −6.4 | 23.9 | −5.7 | 76.5 | −5.7 | 76.5 | −5.1 | 207 | |
| Tetradecanoic acid (myristic acid) | −6.0 | 46.4 | −6.4 | 23.9 | −6.1 | 39.3 | −5.6 | 90.3 | −5.0 | 245 | |
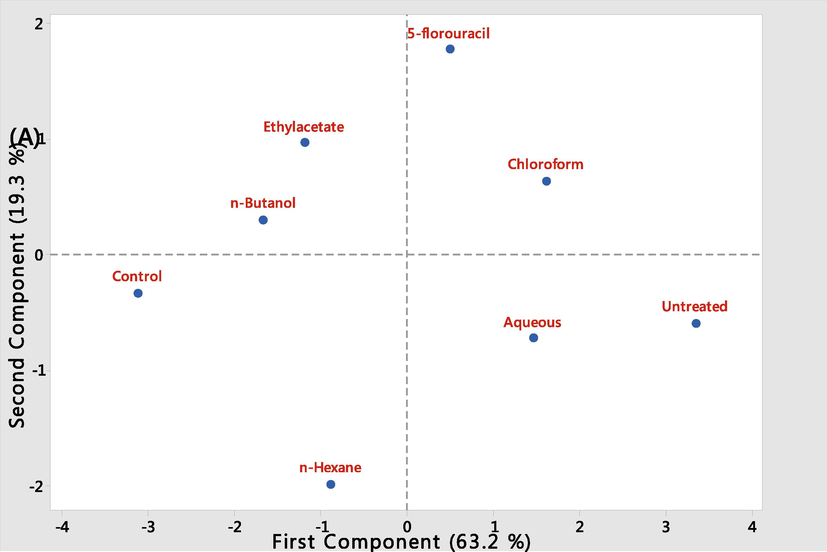
- Screen Plot showing the influence of M. lucida fractions administered to leukaemic mice with the control groups.
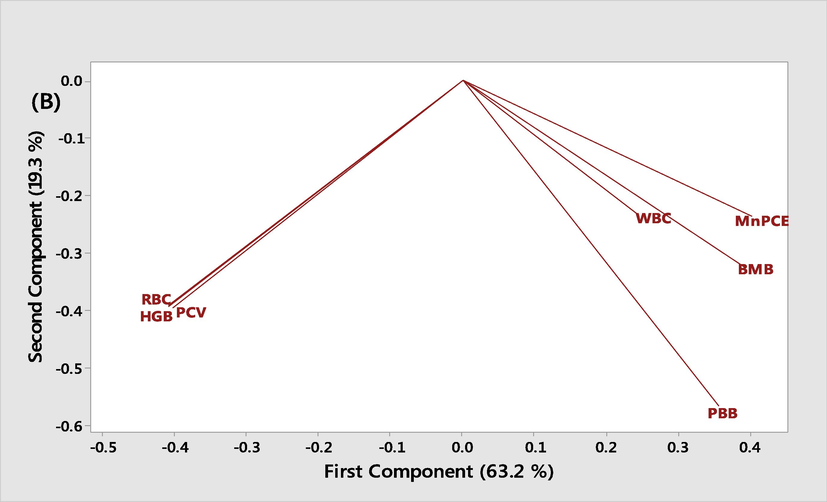
- Principal component analysis of the measured biochemical parameters in leukemic mice treated with different fractions of M. lucida and the control. BMB: Bone marrow blast. PBB: Peripheral blood blast.
- 3D and 2D complex structure of binding Interaction between ligand and protein (PDB: 1RW8).
- 3D and 2D complex structure of binding Interaction between ligand and protein (PDB: 1RW8).
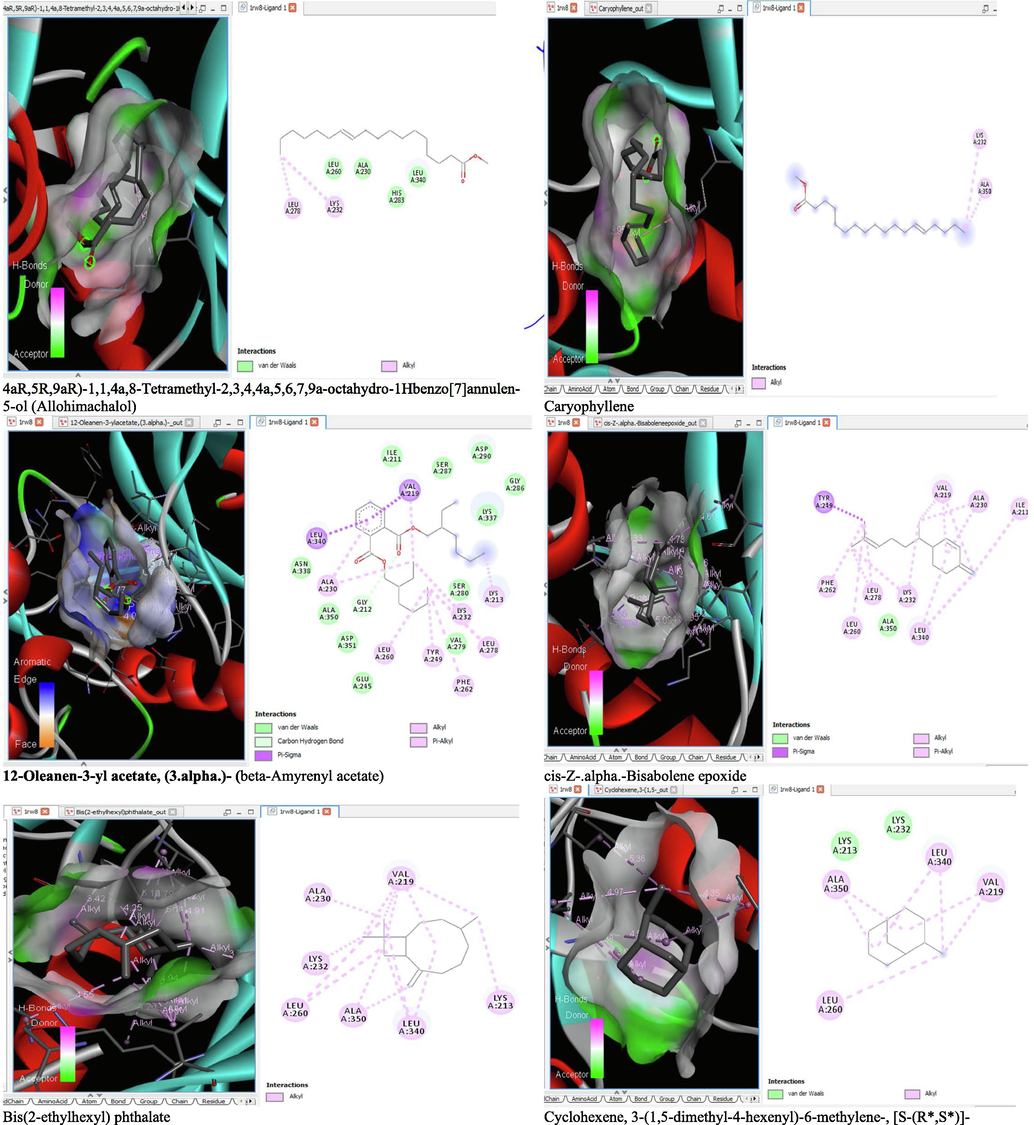
- 3D and 2D complex structure of binding Interaction between ligand and protein (PDB: 1RW8).
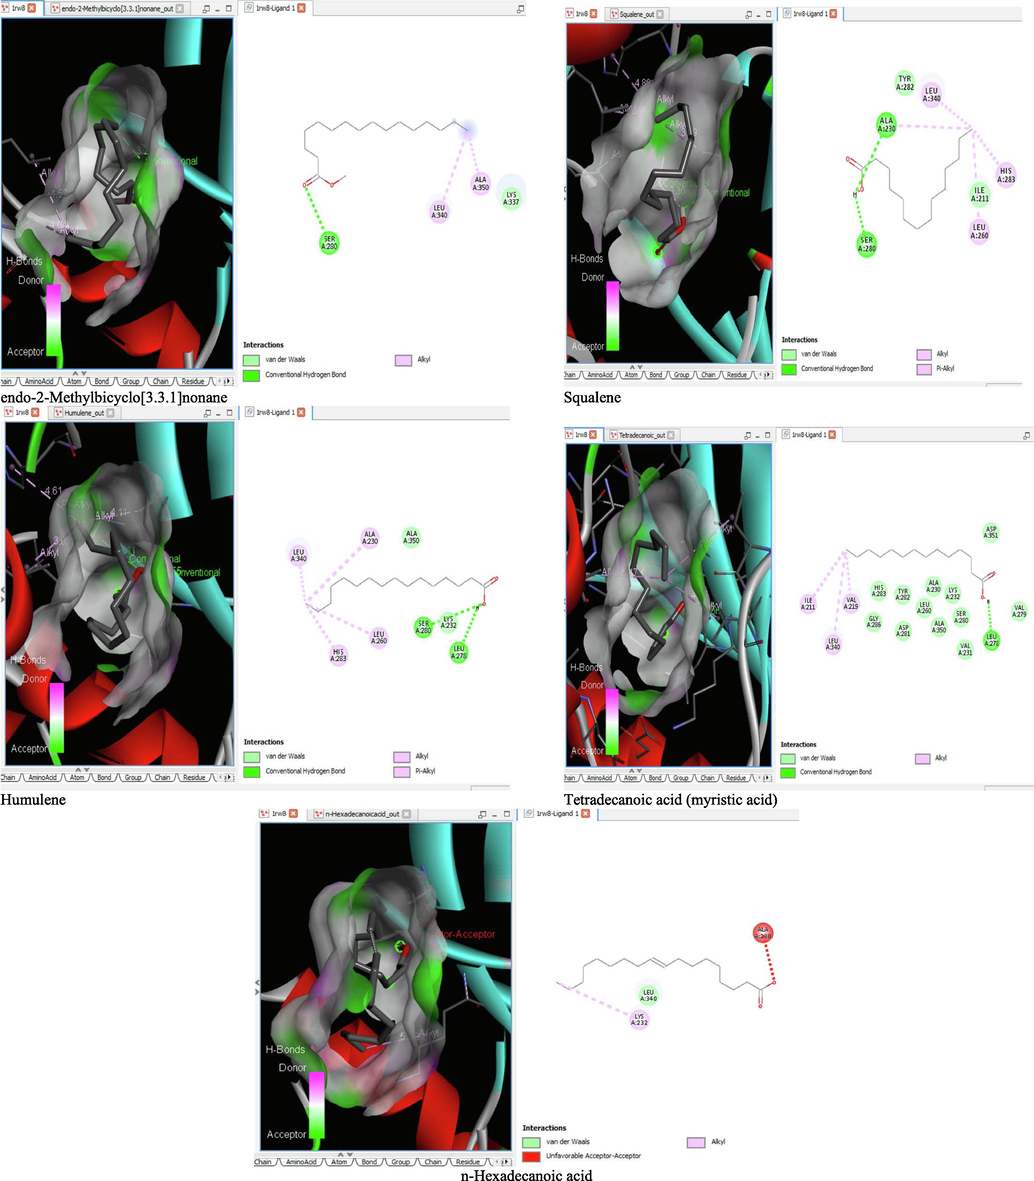
- 3D and 2D complex structure of binding Interaction between ligand and protein (PDB: 1RW8).
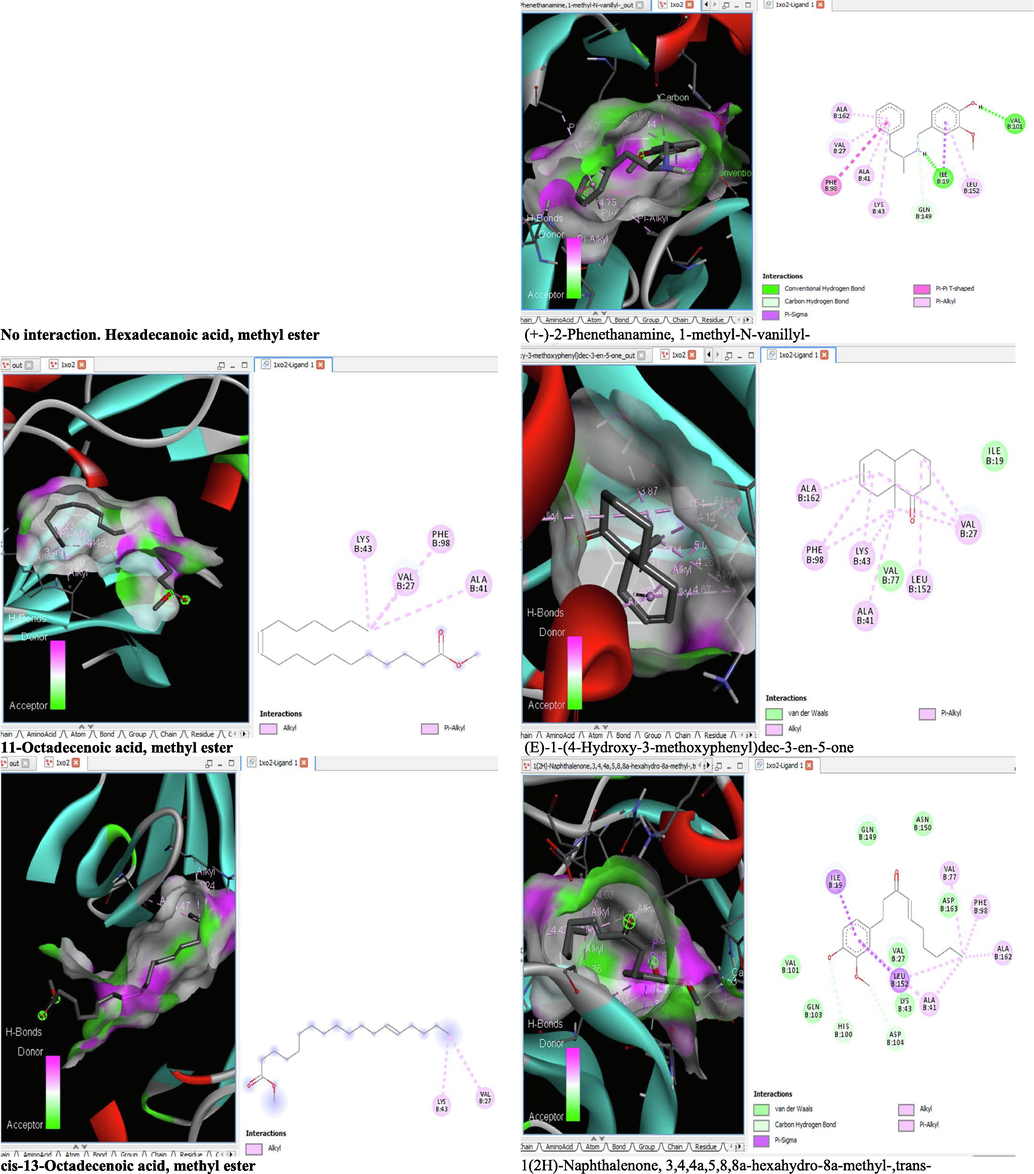
- 3D and 2D complex structure of binding Interaction between ligand and protein (PDB: 1XO2).
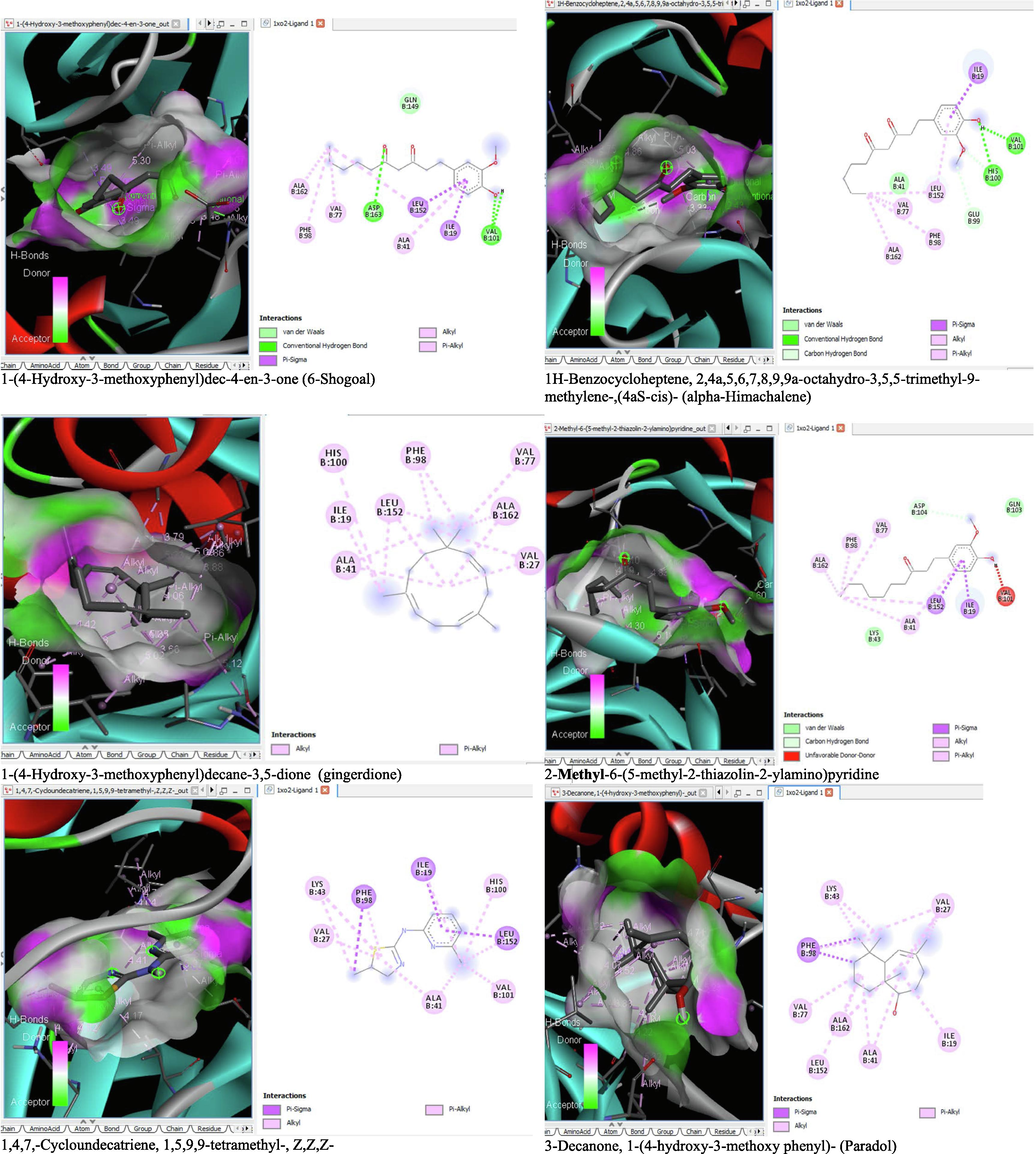
- 3D and 2D complex structure of binding Interaction between ligand and protein (PDB: 1XO2).
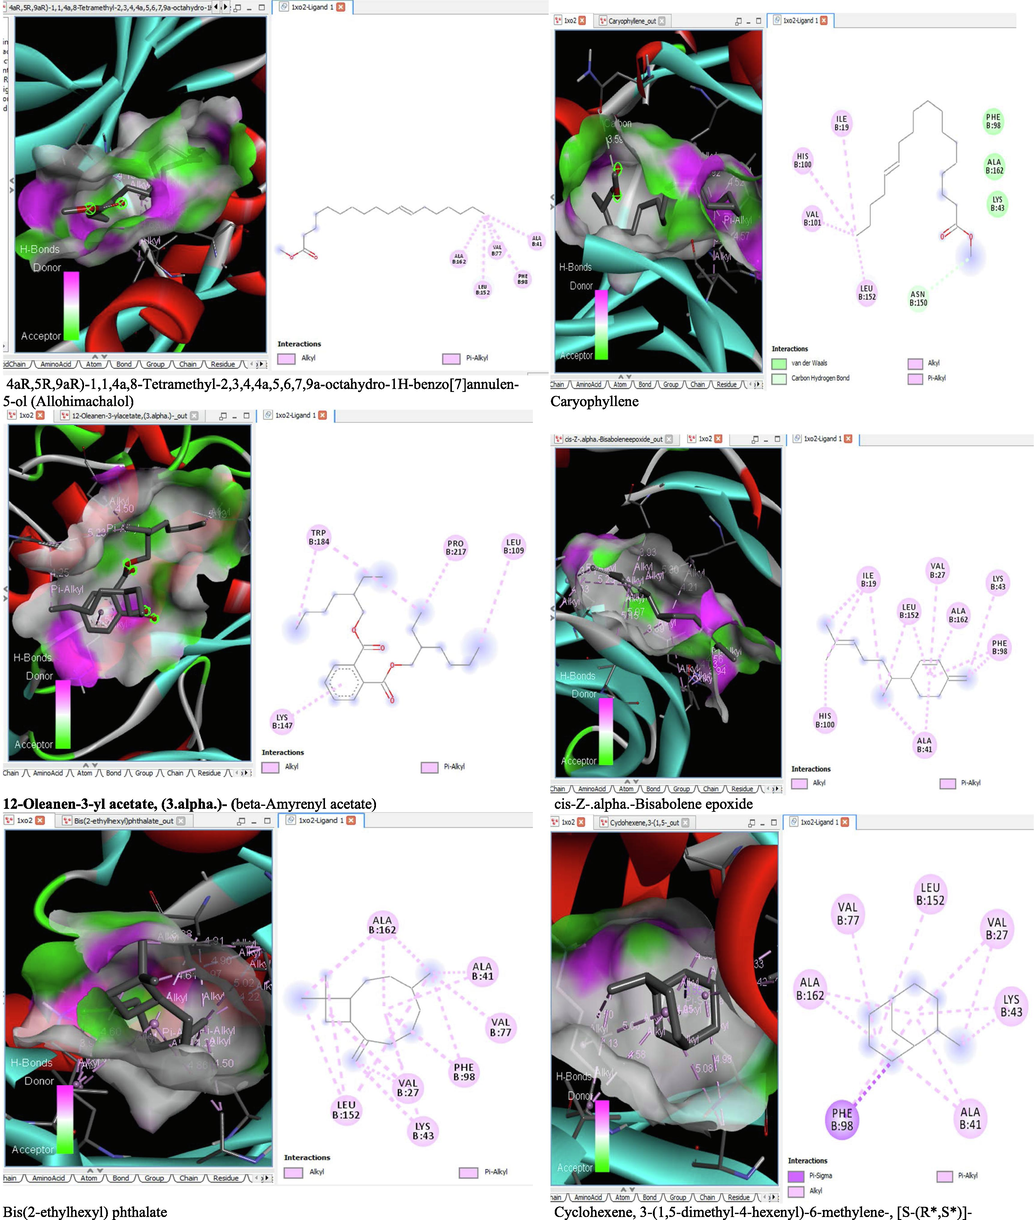
- 3D and 2D complex structure of binding Interaction between ligand and protein (PDB: 1XO2).
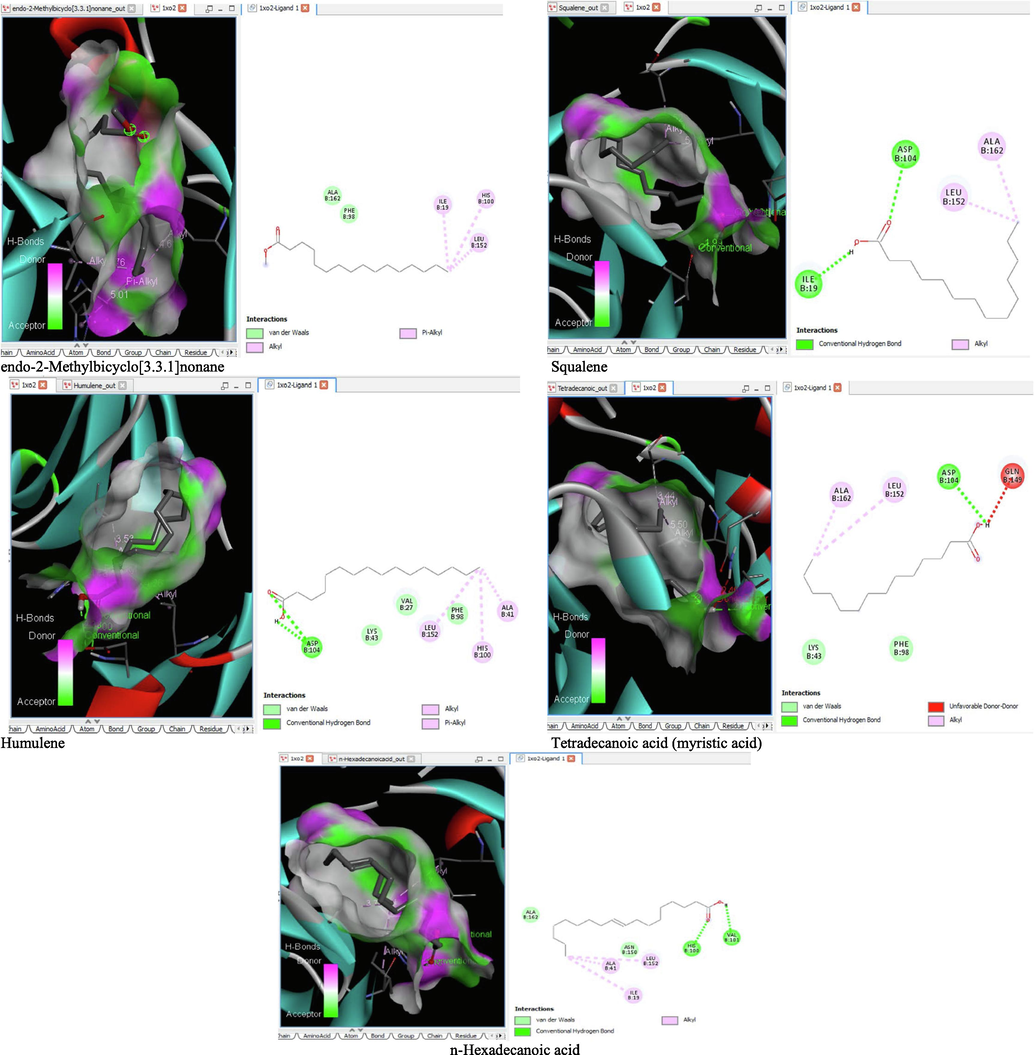
- 3D and 2D complex structure of binding Interaction between ligand and protein (PDB: 1XO2).
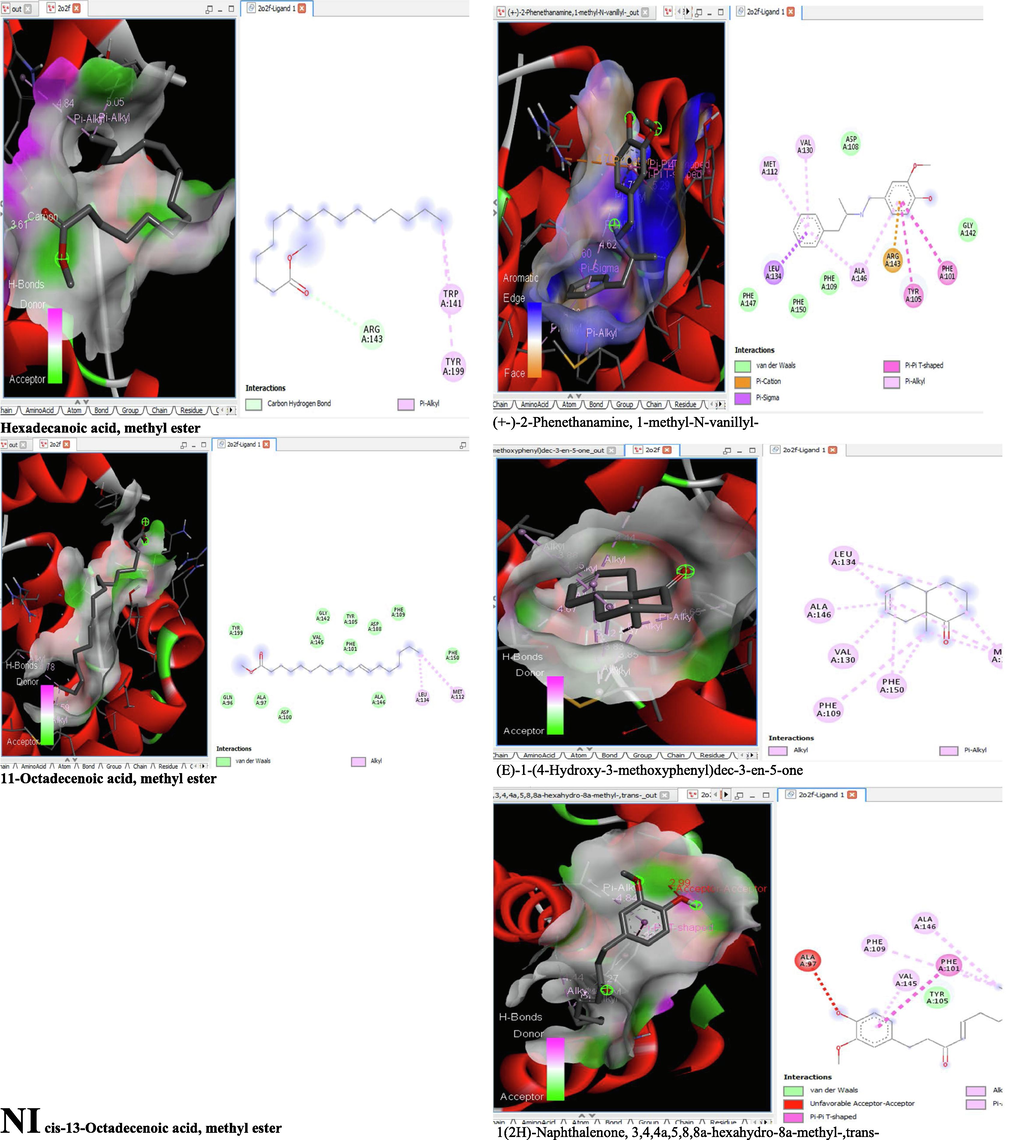
- 3D and 2D complex structure of binding Interaction between ligand and protein (PDB: 2O2F).
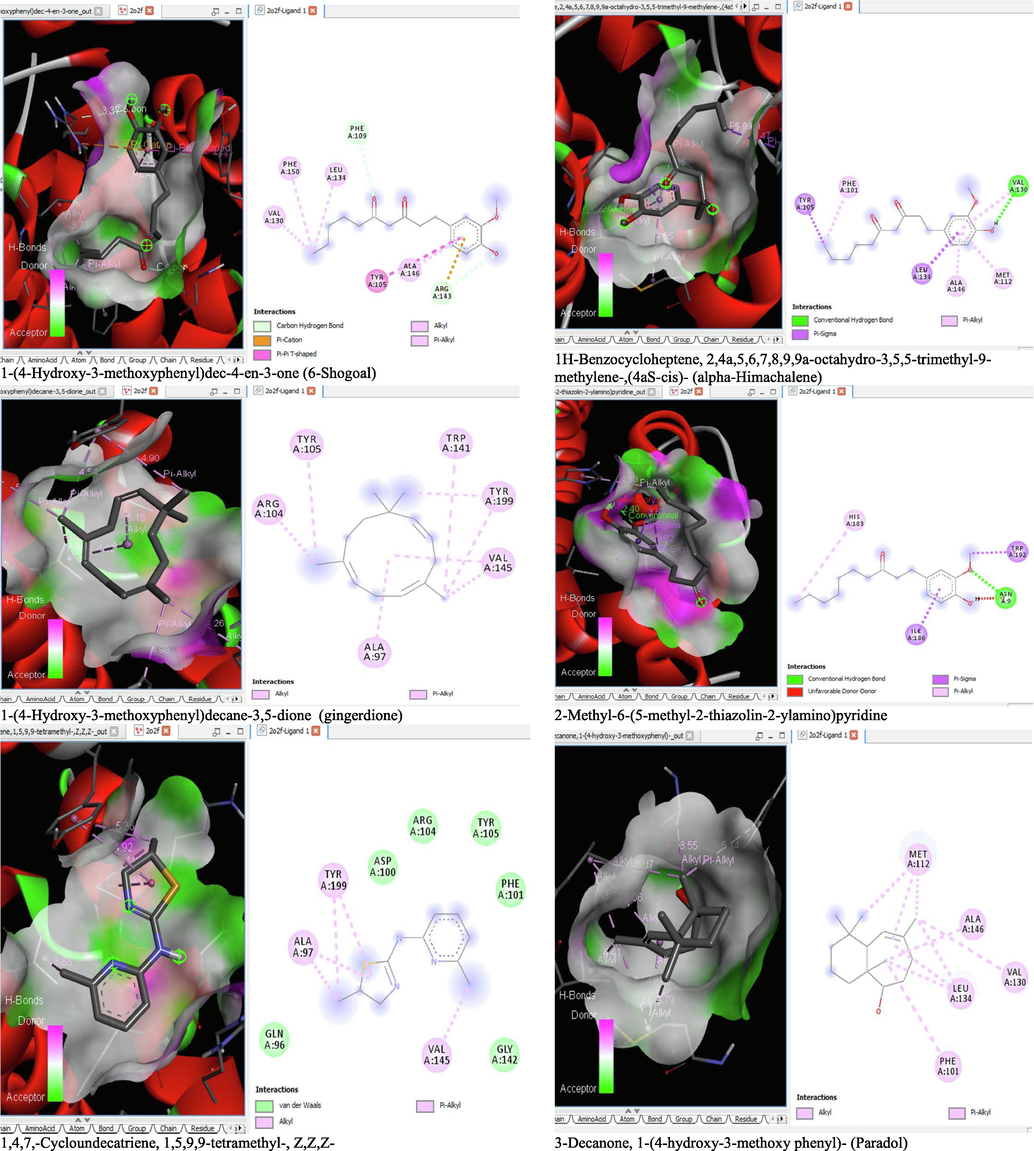
- 3D and 2D complex structure of binding Interaction between ligand and protein (PDB: 2O2F).
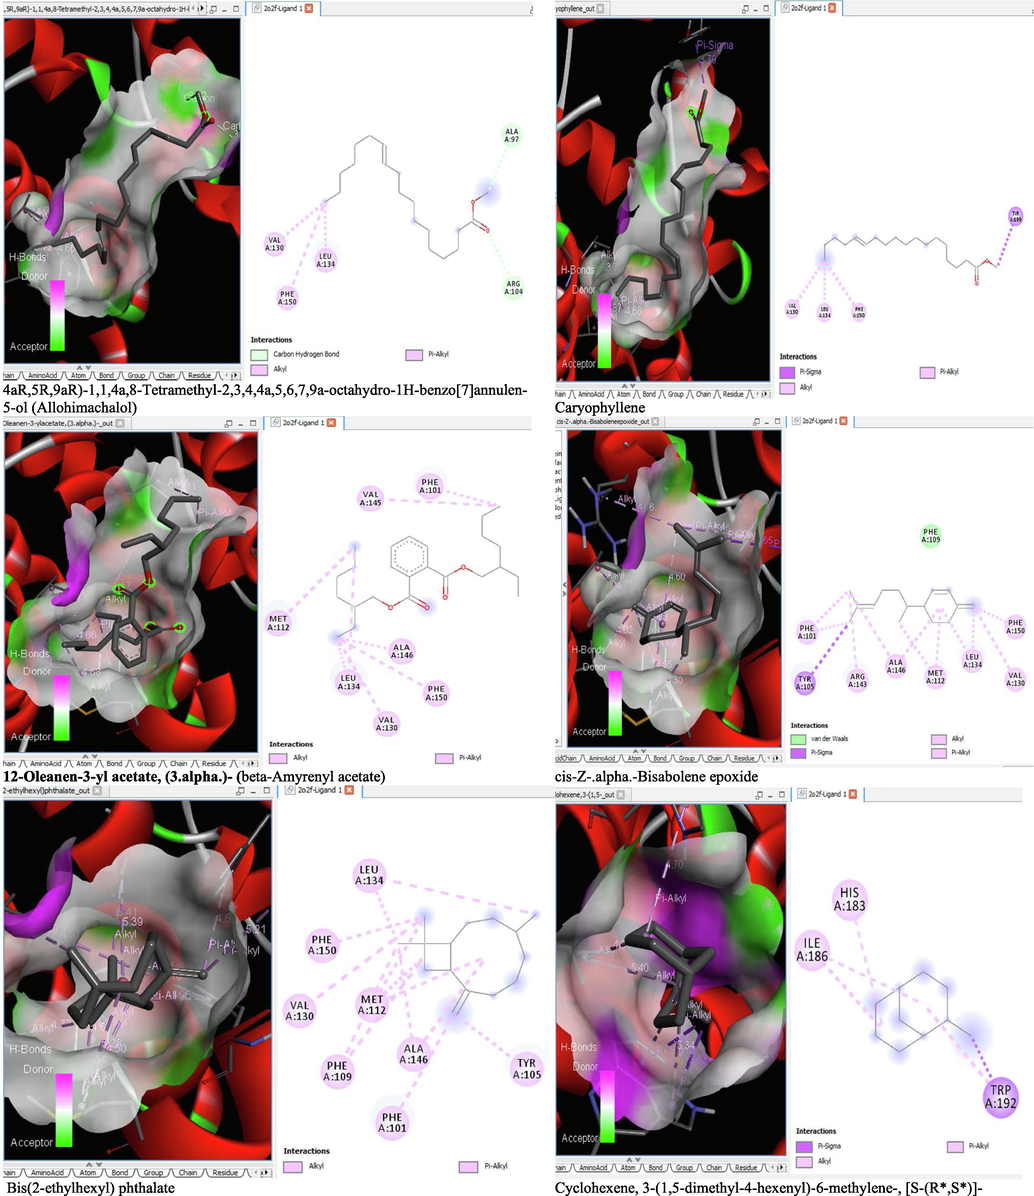
- 3D and 2D complex structure of binding Interaction between ligand and protein (PDB: 2O2F).
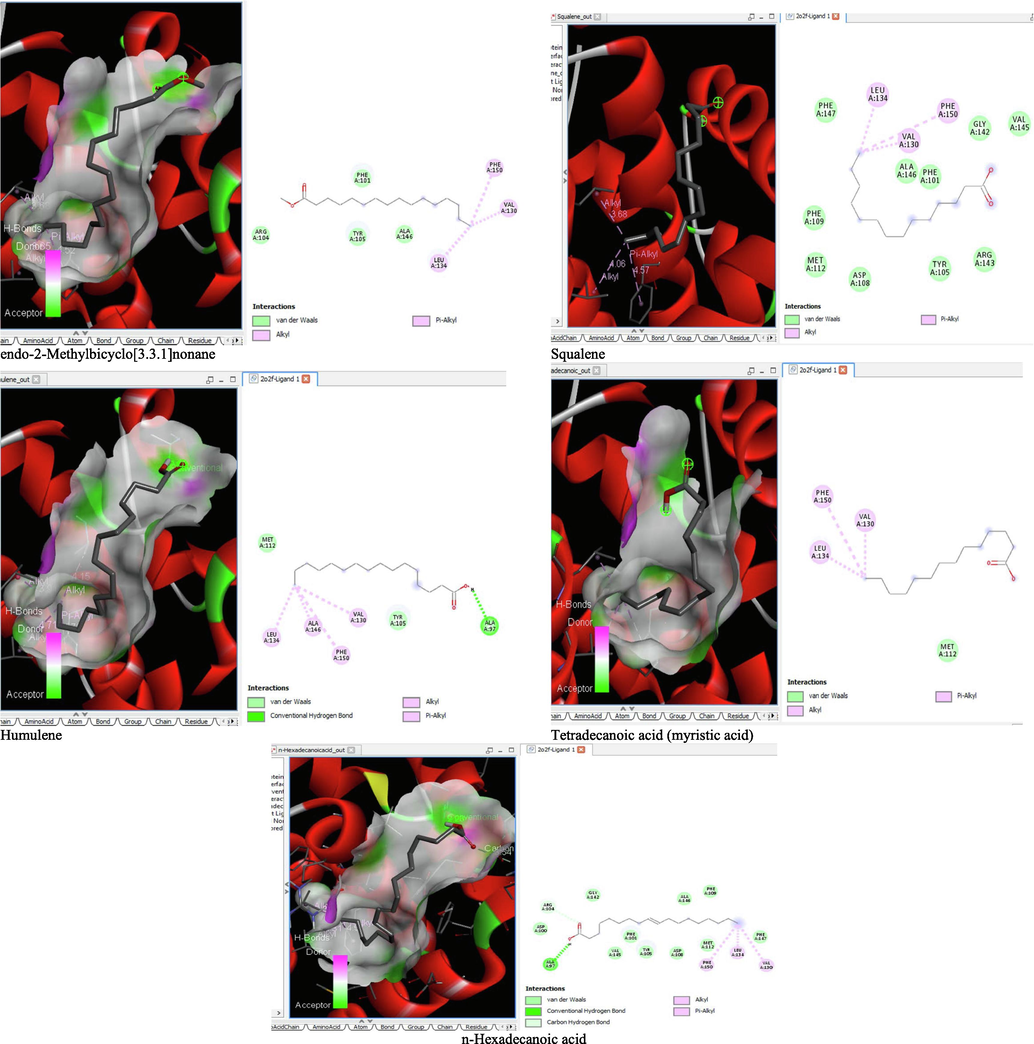
- 3D and 2D complex structure of binding Interaction between ligand and protein (PDB: 2O2F).
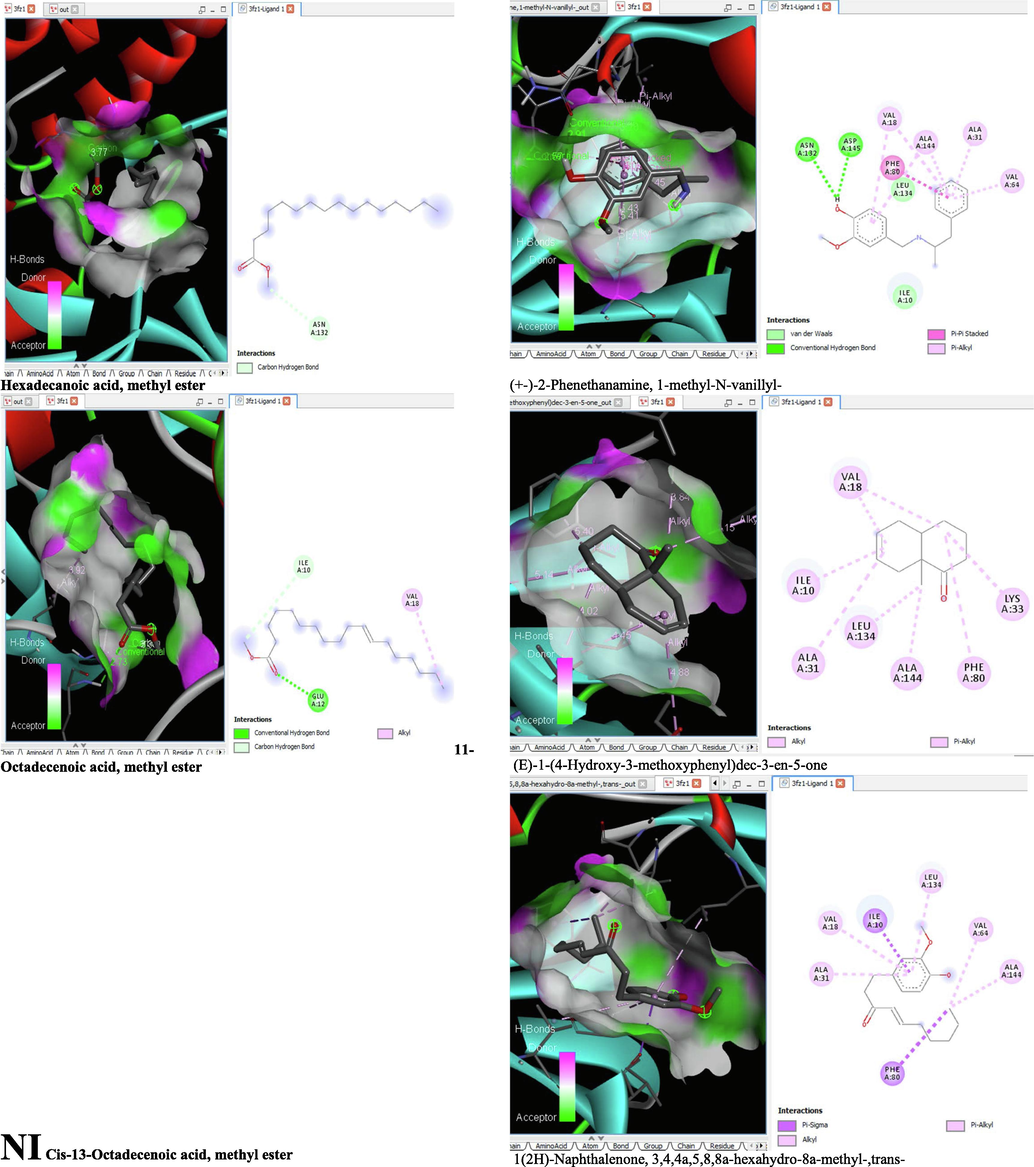
- 3D and 2D complex structure of binding Interaction between ligand and protein (PDB: 3FZ1).
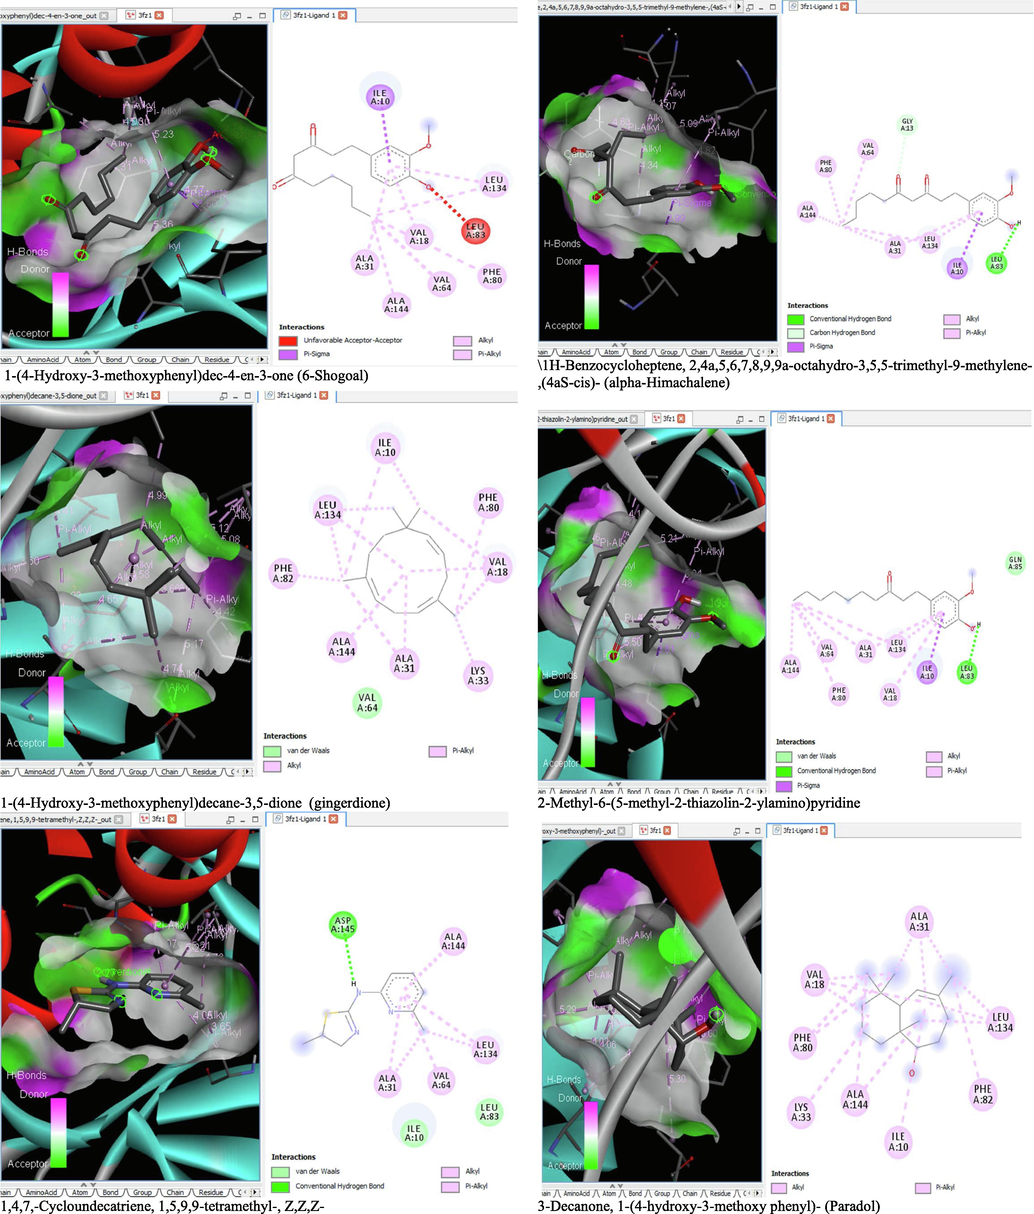
- 3D and 2D complex structure of binding Interaction between ligand and protein (PDB: 3FZ1).
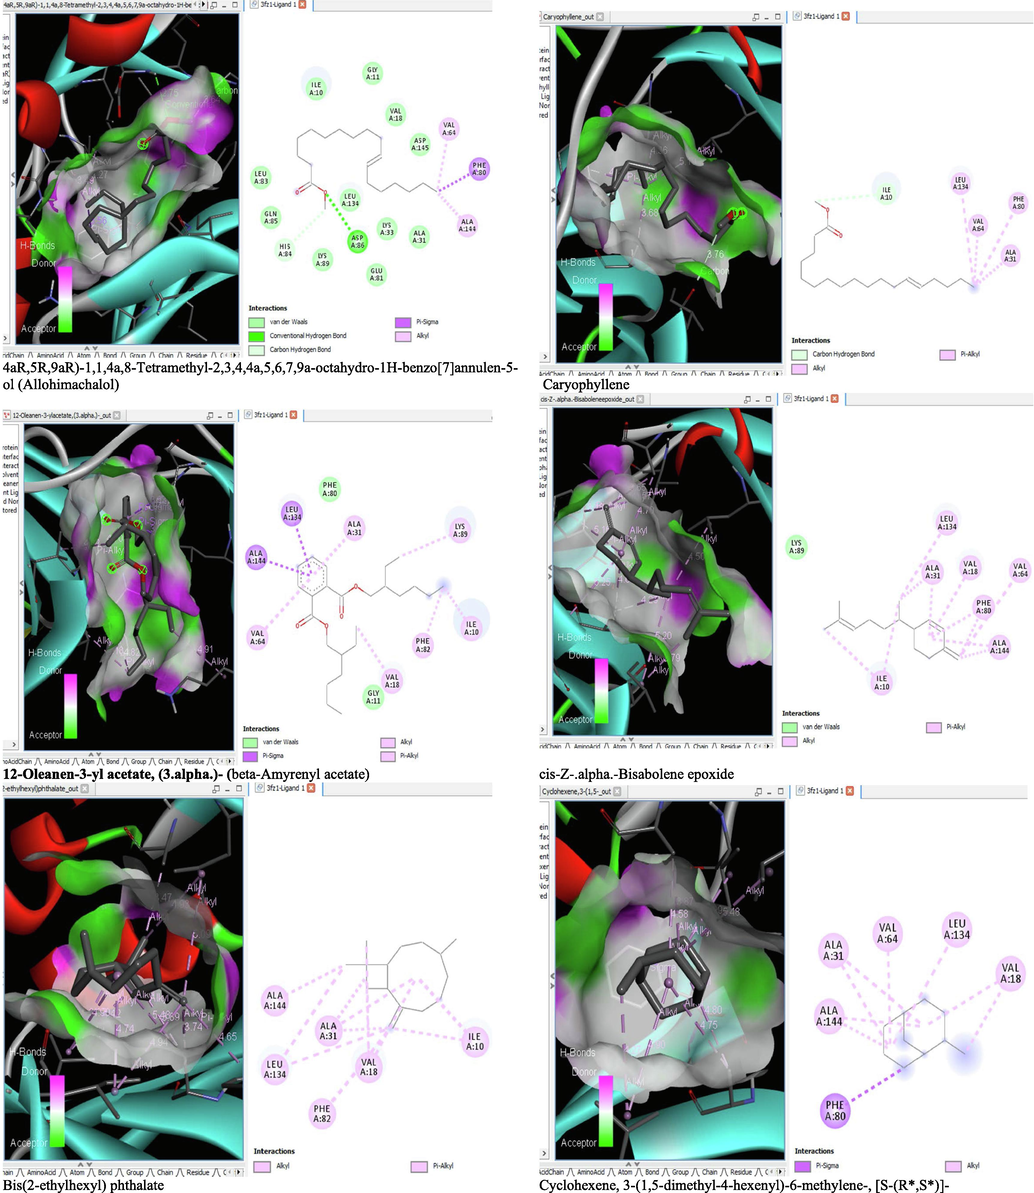
- 3D and 2D complex structure of binding Interaction between ligand and protein (PDB: 3FZ1).
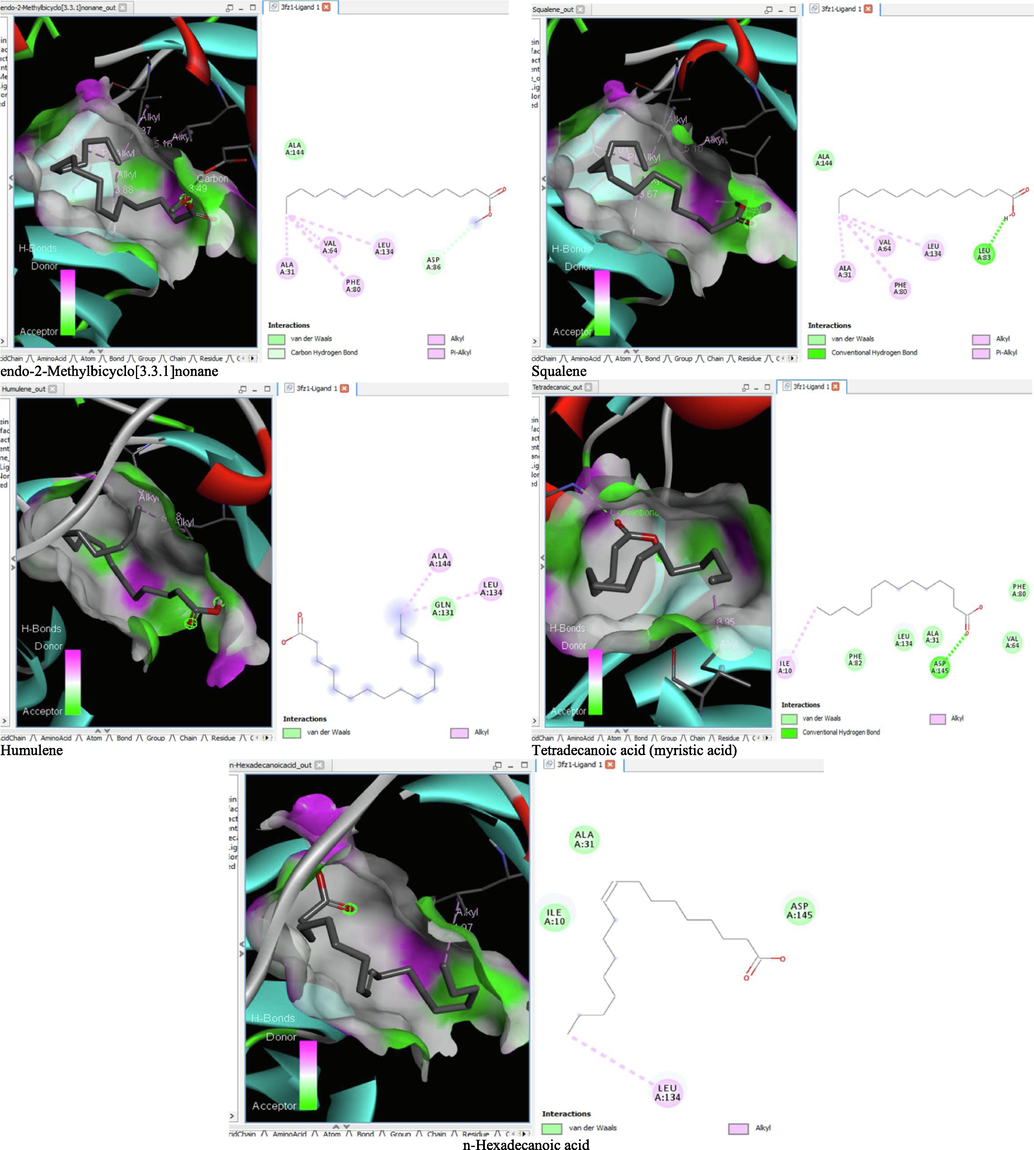
- 3D and 2D complex structure of binding Interaction between ligand and protein (PDB: 3FZ1).
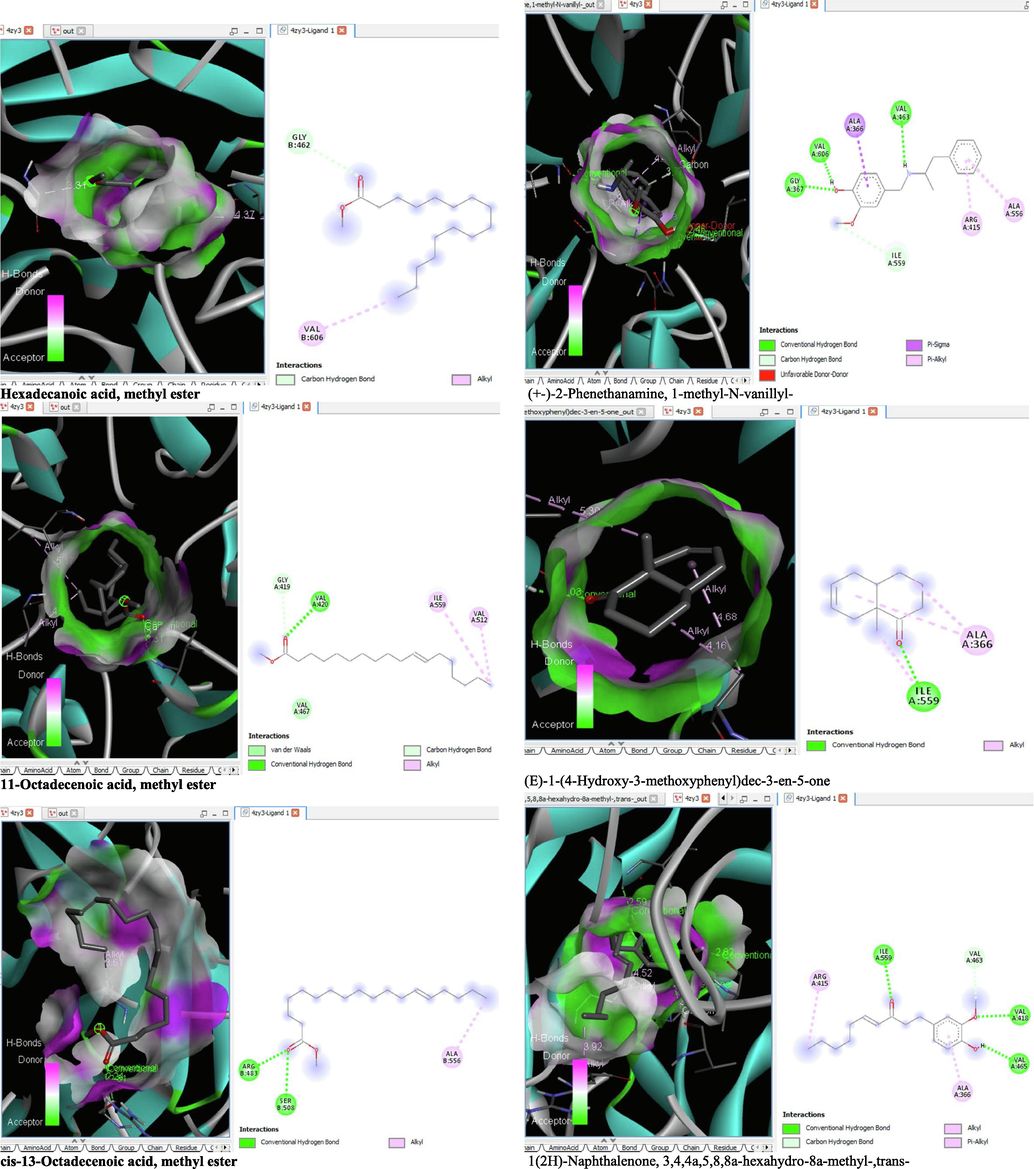
- 3D and 2D complex structure of binding Interaction between ligand and protein (PDB: 4ZY3).
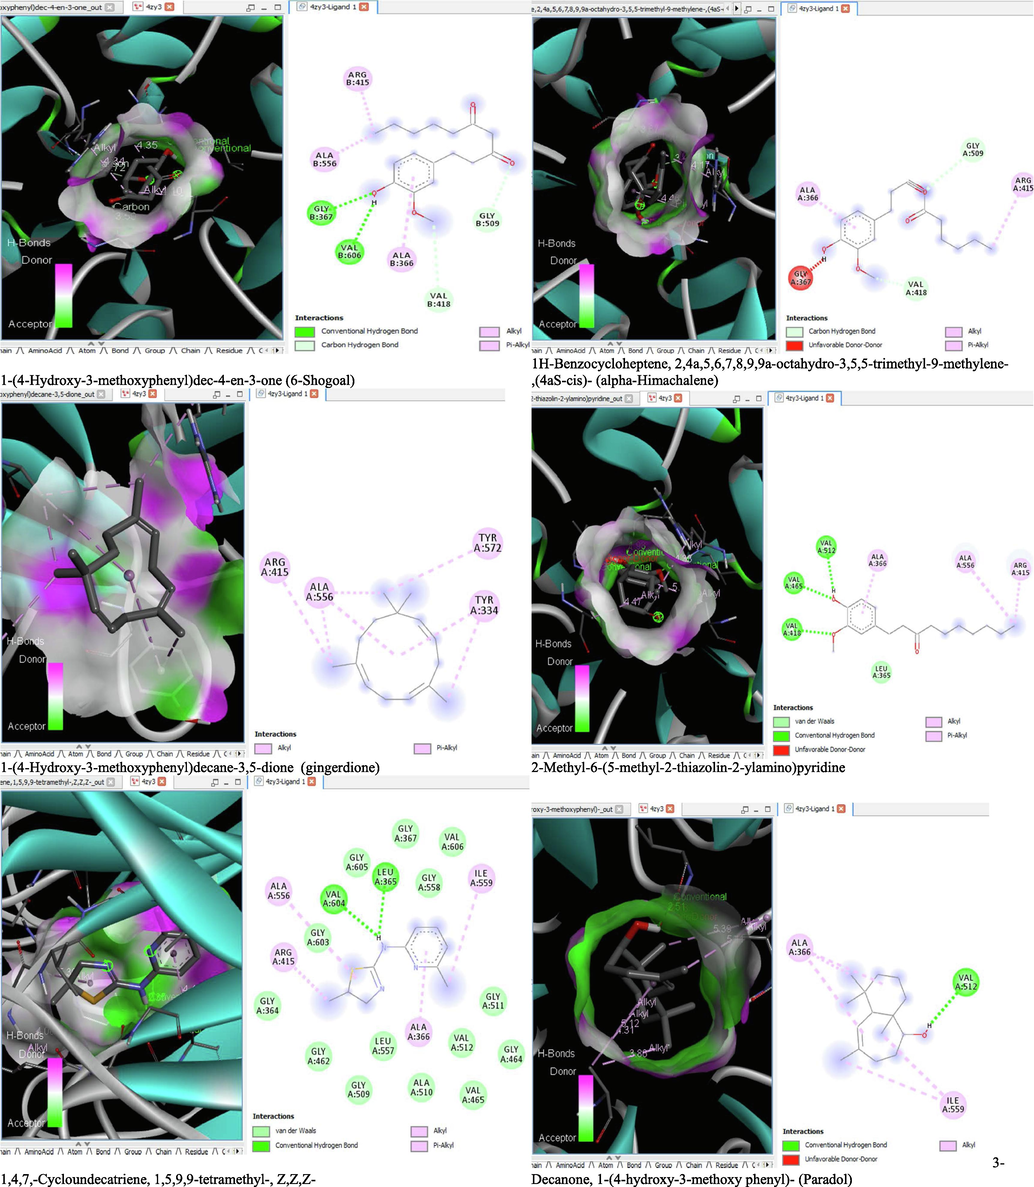
- 3D and 2D complex structure of binding Interaction between ligand and protein (PDB: 4ZY3).
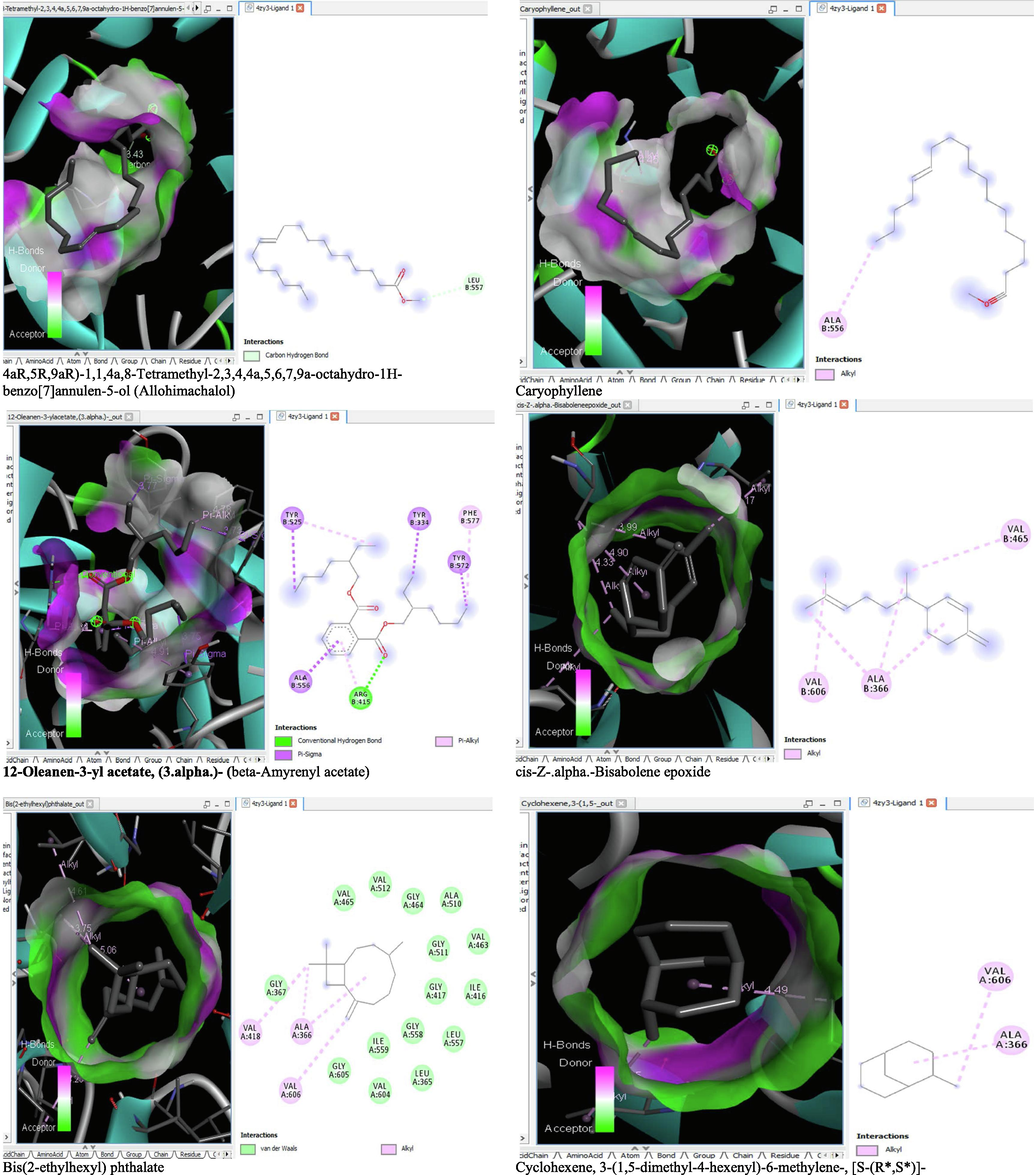
- 3D and 2D complex structure of binding Interaction between ligand and protein (PDB: 4ZY3).
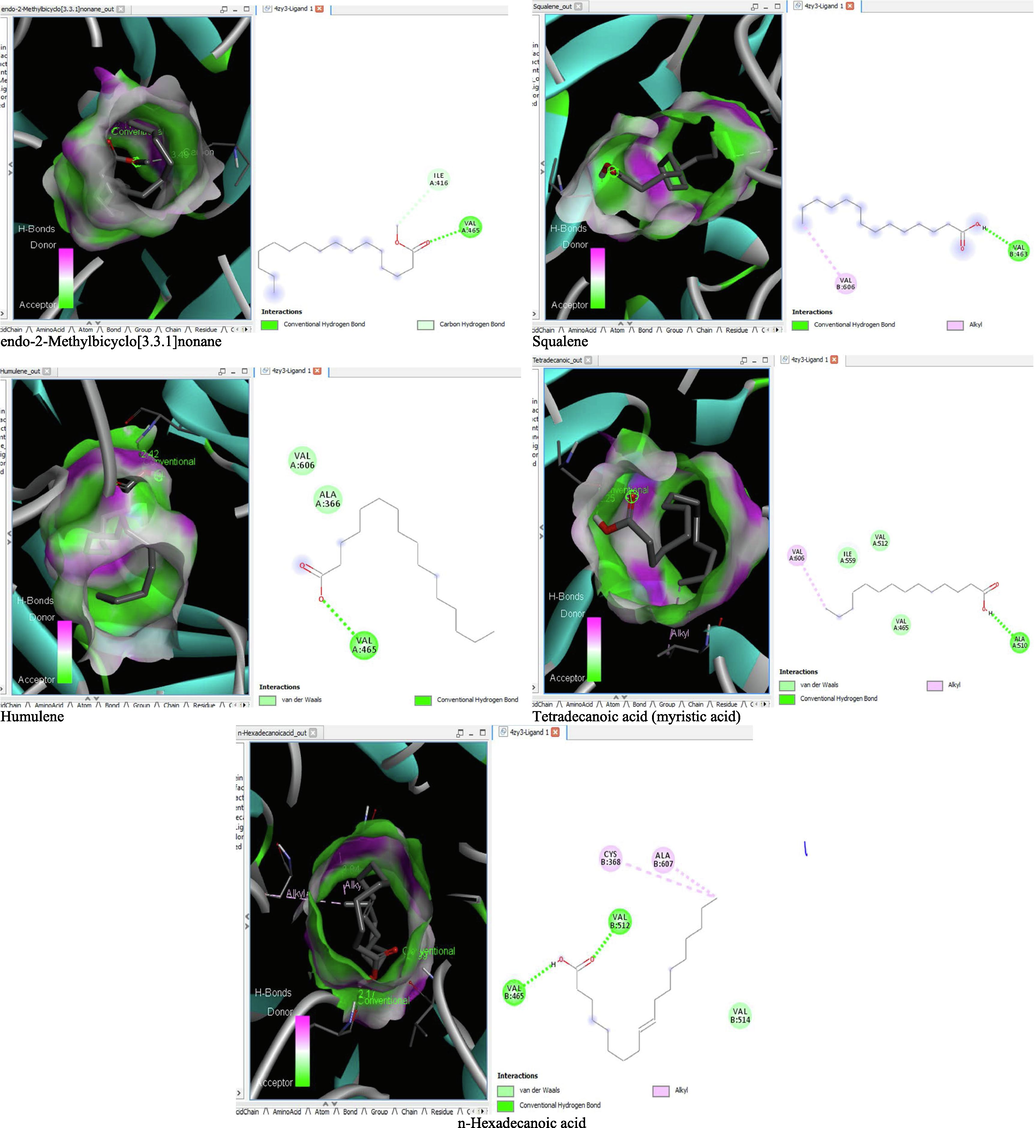
- 3D and 2D complex structure of binding Interaction between ligand and protein (PDB: 4ZY3).
7 Drug-likeness and ADME properties of the ligand
The drug-likeness property with respect to the molecular weight (MW ≤ 500), number of hydrogen bond acceptor (HBA ≤ 10), hydrogen bond donor (HBD ≤ 5), and lipophilicity expressed as LogP (≤5) of the test ligands is shown in Table 5. The Total Polarity Surface Area (TPSA) value is also reported in Table 5 and it should range between 20 and 130. According to the Linpiski’s rule of five, for a drug to be probable, it must not violate more than one of the aforementioned criteria. In this regard, all the tested ligands in this study have good absorption or permeation potential as none violated more than of the drug-likeness criteria listed in Table 5.
| Compounds | MW | #Heavy atoms | HBA | HBD | TPSA | LogP | Lipinski violations |
|---|---|---|---|---|---|---|---|
| 1,4,7,-Cycloundecatriene, 1,5,9,9-tetramethyl-, Z,Z,Z- | 204.35 | 15 | 0 | 0 | 0 | 4.32 | 1 |
| cis-Z-.alpha.-Bisabolene epoxide | 220.35 | 16 | 1 | 0 | 12.53 | 3.91 | 0 |
| Hexadecanoic acid, methyl ester | 270.45 | 19 | 2 | 0 | 26.3 | 5.54 | 1 |
| n-Hexadecanoic acid | 256.42 | 18 | 2 | 1 | 37.3 | 5.2 | 1 |
| 11-Octadecenoic acid, methyl ester | 296.49 | 21 | 2 | 0 | 26.3 | 5.95 | 1 |
| 1,4,7,-Cycloundecatriene, 1,5,9,9-tetramethyl-, Z,Z,Z- | 278.39 | 20 | 3 | 1 | 46.53 | 3.96 | 0 |
| 3-Decanone, 1-(4-hydroxy-3-methoxypheny- | 276.37 | 20 | 3 | 1 | 46.53 | 3.78 | 0 |
| (E)-1-(4-Hydroxy-3-methoxyphenyl)dec-3-en-5-one | 271.35 | 20 | 3 | 2 | 41.49 | 3 | 0 |
| (+-)-2-Phenethanamine, 1-methyl-N-vanillyl- | 276.37 | 20 | 3 | 1 | 46.53 | 3.76 | 0 |
| 1-(4-Hydroxy-3-methoxyphenyl)dec-4-en-3-one | 292.37 | 21 | 4 | 1 | 63.6 | 3.17 | 0 |
| 1-(4-Hydroxy-3-methoxyphenyl)decane-3,5-dione | 390.56 | 28 | 4 | 0 | 52.6 | 6.17 | 1 |
| Bis(2-ethylhexyl) phthalate | 207.3 | 14 | 2 | 1 | 62.58 | 1.98 | 0 |
| 2-Methyl-6-(5-methyl-2-thiazolin-2-ylamino)pyridine | 468.75 | 34 | 2 | 0 | 26.3 | 7.63 | 1 |
| Squalene | 410.72 | 30 | 0 | 0 | 0 | 9.38 | 1 |
| Caryophyllene | 204.35 | 15 | 0 | 0 | 0 | 4.24 | 1 |
| Humulene | 204.35 | 15 | 0 | 0 | 0 | 4.26 | 1 |
| 1H-Benzocycloheptene, 2,4a,5,6,7,8,9,9a-octahydro-3,5,5-trimethyl-9-methylene-,(4aS-cis)- | 204.35 | 15 | 0 | 0 | 0 | 4.25 | 1 |
| Cyclohexene, 3-(1,5-dimethyl-4-hexenyl)-6-methylene-, [S-(R*,S*)]- | 204.35 | 15 | 0 | 0 | 0 | 4.56 | 1 |
| 1(2H)-Naphthalenone, 3,4,4a,5,8,8a-hexahydro-8a-methyl-,trans- | 164.24 | 12 | 1 | 0 | 17.07 | 2.49 | 0 |
| endo-2-Methylbicyclo[3.3.1]nonane | 138.25 | 10 | 0 | 0 | 0 | 3.5 | 1 |
| Tetradecanoic acid | 228.37 | 16 | 2 | 1 | 37.3 | 4.45 | 0 |
| cis-13-Octadecenoic acid, methyl ester | 296.49 | 21 | 2 | 0 | 26.3 | 5.95 | 1 |
| 3-Decanone, 1-(4-hydroxy-3-methoxy phenyl)- | 278.39 | 20 | 3 | 1 | 46.53 | 3.96 | 0 |
| 4aR,5R,9aR)-1,1,4a,8-Tetramethyl-2,3,4,4a,5,6,7,9a-octahydro-1H-benzo[7]annulen-5-ol | 222.37 | 16 | 1 | 1 | 20.23 | 3.58 | 0 |
The ADME (Absorption, Distribution, Metabolism, and Excretion) property of the ligands is summarized in Table 6. All the ligands are capable of penetrating the blood brain barrier except 1,4,7,-Cycloundecatriene, 1,5,9,9-tetramethyl-, Z,Z,Z-, 11-Octadecenoic acid, methyl ester, 1-(4-Hydroxy-3-methoxyphenyl)decane-3,5-dione, 2-Methyl-6-(5-methyl-2-thiazolin-2-ylamino)pyridine, Caryophyllene, Humulene, 1H-Benzocycloheptene, 2,4a,5,6,7,8,9,9a-octahydro-3,5,5-trimethyl-9-methylene-,(4aS-cis)-, Cyclohexene, 3-(1,5-dimethyl-4-hexenyl)-6-methylene-, [S-(R*,S*)]- and cis-13-Octadecenoic acid, methyl ester. Some of these compounds equally have low human intestinal tissue absorption. Only (E)-1-(4-Hydroxy-3-methoxyphenyl)dec-3-en-5-one and 1-(4-Hydroxy-3-methoxyphenyl)decane-3,5-dione are non-substrate to the P-glycoprotein but inhibitors to CYP3A4. The ligands capable of inhibiting the other cytochrome P450 superfamily (CYP1A2, CYP2C1, CYP2C9 and CYP2D6) are shown in Table 6.
| Ligand | GI absorption | BBB permeant | Pgp substrate | CYP1A2 inhibitor | CYP2C19 inhibitor | CYP2C9 inhibitor | CYP2D6 inhibitor | CYP3A4 inhibitor | Bioavailability Score |
|---|---|---|---|---|---|---|---|---|---|
| 1,4,7,-Cycloundecatriene, 1,5,9,9-tetramethyl-, Z,Z,Z- | Low | No | No | No | No | Yes | No | No | 0.55 |
| cis-Z-.alpha.-Bisabolene epoxide | High | Yes | No | No | Yes | Yes | No | No | 0.55 |
| Hexadecanoic acid, methyl ester | High | Yes | No | Yes | No | No | No | No | 0.55 |
| n-Hexadecanoic acid | High | Yes | No | Yes | No | Yes | No | No | 0.85 |
| 11-Octadecenoic acid, methyl ester | High | No | No | Yes | No | No | No | No | 0.55 |
| 1,4,7,-Cycloundecatriene, 1,5,9,9-tetramethyl-, Z,Z,Z- | High | Yes | No | Yes | No | No | Yes | No | 0.55 |
| 3-Decanone, 1-(4-hydroxy-3-methoxypheny- | High | Yes | No | Yes | Yes | No | Yes | No | 0.55 |
| (E)-1-(4-Hydroxy-3-methoxyphenyl)dec-3-en-5-one | High | Yes | Yes | No | No | No | Yes | Yes | 0.55 |
| (+-)-2-Phenethanamine, 1-methyl-N-vanillyl- | High | Yes | No | Yes | Yes | No | Yes | No | 0.55 |
| 1-(4-Hydroxy-3-methoxyphenyl)dec-4-en-3-one | High | Yes | No | Yes | No | No | Yes | No | 0.55 |
| 1-(4-Hydroxy-3-methoxyphenyl)decane-3,5-dione | High | No | Yes | No | No | Yes | No | Yes | 0.55 |
| Bis(2-ethylhexyl) phthalate | High | Yes | No | Yes | No | No | No | No | 0.55 |
| 2-Methyl-6-(5-methyl-2-thiazolin-2-ylamino)pyridine | Low | No | No | No | No | No | No | No | 0.55 |
| Squalene | Low | No | No | No | No | No | No | No | 0.55 |
| Caryophyllene | Low | No | No | No | Yes | Yes | No | No | 0.55 |
| Humulene | Low | No | No | No | No | Yes | No | No | 0.55 |
| 1H-Benzocycloheptene, 2,4a,5,6,7,8,9,9a-octahydro-3,5,5-trimethyl-9-methylene-,(4aS-cis)- | Low | No | No | No | Yes | Yes | No | No | 0.55 |
| Cyclohexene, 3-(1,5-dimethyl-4-hexenyl)-6-methylene-, [S-(R*,S*)]- | Low | No | No | No | Yes | Yes | No | No | 0.55 |
| 1(2H)-Naphthalenone, 3,4,4a,5,8,8a-hexahydro-8a-methyl-,trans- | High | Yes | No | No | No | No | No | No | 0.55 |
| endo-2-Methylbicyclo[3.3.1]nonane | Low | Yes | No | No | No | Yes | No | No | 0.55 |
| Tetradecanoic acid | High | Yes | No | Yes | No | No | No | No | 0.85 |
| cis-13-Octadecenoic acid, methyl ester | High | No | No | Yes | No | No | No | No | 0.55 |
| 3-Decanone, 1-(4-hydroxy-3-methoxy phenyl)- | High | Yes | No | Yes | No | No | Yes | No | 0.55 |
| 4aR,5R,9aR)-1,1,4a,8-Tetramethyl-2,3,4,4a,5,6,7,9a-octahydro-1H-benzo[7]annulen-5-ol | High | Yes | No | No | No | Yes | No | No | 0.55 |
8 Discussion
M. lucida is used locally for the treatment of leukemia in some parts of Africa (Adeleye et al., 2018) and it create the prospect that M. lucida may have some chemo-preventive values for human leukemia. We had previously observed the in-vivo anti-leukaemic activity of M. lucida, whereas, Appiah-Opong et al. (2016) established the efficacy in-vitro. In this study, we examined the in-vivo anti-leukaemic activity of M. lucida fractions in mice and analysed the possible mode of activity. Benzene was selected for leukemia induction in mice because of its established clastogenic activity and ability to induce leukemia (Elsayed, 2017; Goldstein and Laskin, 1977; Lau et al., 2009a; 2009b).
The presence of leukemia blast cell in the peripheral blood and percentage greater than 20 in the bone marrow served as leukemia indices. In this study, only the ethyl acetate and n-butanol fractions of M. lucida showed anti-leukemic potential by reversing the incidence of blast cell in the blood and bone marrow of mice. In the principal component analysis both fractions were distributed within the same quadrant close to the normal control where blast cell formation was highly prevented by the treatment but different from the untreated leukemia group
In leukaemia, the transition of HSC to leukemic stem cell (LSC) occurs because of mutation in the critical genes of the HSC of which such mutation can be an implication of chromosomal damage. Therefore, this study further assessed the anti-chromosomal damage potentials of the fractions of M. lucida in mice.
Benzene is one of those chemicals that can cause chromosomal damage with associated risks such as aplastic anaemia, myelodysplasia and pre leukemia symptoms (Gross and Paustenbach, 2017). Interaction of benzene metabolite with important macromolecules such as DNA and consequent generation of oxygen radicals are responsible for the chromosomal damage that leads to leukemia developments (Austin, 2009; Battisti et al., 2008; Subrahmanyam et al., 1991). Micronucleus formation is one of the indicators of chromosomal damage (Lau et al., 2009a; 2009b). In this study, the anticlastogenic activity of M. lucida fraction was demonstrated in varying degrees of reduction in the percentage of micronucleated polychromatic erythrocytes. It was evidence from the principal component analysis that the extent of chromosomal damage was directly correlated to blast cell formation in both the blood and bone marrow. This anticlastogenic activity might be due to the ability of the fractions to disrupt the interaction of benzene metabolites with the DNA of mice. It may also be applied to the presence of bioactive compounds in the fractions responsible for scavenging oxygen radical. In this study, the inhibition of micronucleated cell formation might have reversed the key steps involved in benzene-induced leukaemia.
Depression of bone marrow function upon exposure to benzene has been showed to cause reduction in haematological parameters (Elsayed, 2017). The consequent haematotoxic effects of benzene were similarly demonstrated in this study by alteration of haematological parameters especially decreased nucleated cell area in BM (pancytopenia), and increased micro-nucleated erythrocytes which consequently altered the WBC and RBC count, HGB concentration, and PCV. In this study, fractions of M. lucida might have reversed the depressed bone marrow function to ameliorate anaemia and myelodysplasia common with benzene exposure.
The histopathological studies on the structural plans of the liver across the study groups focused on damages including severe hemorrhage, infiltration of red cells, inflammation, necrosis, as well as fibrosis with some degenerative changes in the walls of the vessels contained in the portal triad system. These lesions are associated with DNA damaging ability of benzene (Andrew and Janet, 1997). The ameliorative effect of M. lucida fractions is evidenced by the reversal of liver damage induced by benzene. The fractions of M. lucida might have exhibited antioxidant activity against the lesions associated with benzene induced DNA damage in the liver. Bioactivity study on M. lucida showed that the most active antileukaemic constituents are contained in the ethyl acetate and n-butanol fractions.
GC–MS analysis of the ethyl acetate and n-butanol fractions revealed key compounds that might be responsible for the observed pharmacological activity. Certain of the identified compounds have been reported with significant anticancer activity. Among these compounds are caryophyllene, humulene, hexadecanoic acid, Bis(2-ethylhexyl)phthalate, 3-decanone,1-(4-hydroxy-3-methoxyphenyl)- and 1-(4-Hydroxy-3-methoxyphenyl)dec-4-en-3-one. Interestingly, both the ethyl acetate and the n-butanol fractions contained some of these important compounds.
For instance, caryophyllenes mediate their anticancer activities by apoptosis induction (Carracedo et al., 2006), cell cycle inhibition (Alexander et al., 2009) and inhibition of metastasis (Casanova et al., 2003). Previous in-vitro leukemia studies have confirmed that caryophyllene and hexadecanoic acid showed selective apoptotic induction and cytotoxic effects on human leukemia cancer cells (Amiel et al., 2012; Ravi and Krishnan, 2017). In addition, Legault and Pichette, (2006) previously reported the antitumor activities of humulene through increase ROS production and depletion of cellular reduced glutathione. Therefore, anti-leukaemic activities exhibited by the ethyl acetate and n-butanol fractions of M. lucida may be through one or more mechanism viz apoptotic induction and cytotoxic effects of β-caryophyllene, isocaryophyllene, α-humulene and hexadecanoic acid that were identified.
3-decanone,1-(4-hydroxy-3-methoxyphenyl) (also called paradol) and 1-(4-Hydroxy-3-methoxyphenyl)dec-4-en-3-one (also known as shogoal) identified in the fractions of M. lucida are non-pungent phenolic that have been reported effective as anti-inflammatory and with oxidative stress reducing effects (Gaire et al., 2015; Wei et al., 2017). Paradol was the most abundant in the n-butanol fraction and the second most abundant in the ethyl acetate fraction. Oxidative stress reduction and anti-inflammatory activity may be one of the mechanisms by which M. lucida active fractions exhibited anti-chromosomal damage, hepatoprotective and antileukemic effects observed in this study.
Interplay between the processes mediating cell cycle, cell death and gene repair are the actor target during anti-cancer therapy and several developed leukemia regimen involve targeting the cancer cells for destruction (Jayaraman and Jamil, 2014). Among the therapeutic targets in cancer management is the inhibition of cell cycle control proteins such as the cyclin dependent kinases, regulation of apoptosis to commit cancer cells to suicide and ultimately, stimulation of sustainable antioxidant mechanism by the human cells to combat numerous forms of oxidative stress related genetic damage (Jayaraman and Jamil, 2014; Kuiper et al., 2007; Pui et al., 2011; Saito et al., 2016). In this study, we attempted to establish the likely mode of the anti-leukemic constituents identified in the ethyl acetate and n-n-butanol fractions of M. lucida, through In-silico molecular docking and the pharmacokinetic properties of this potential compounds.
The TGF β receptor kinase I is an activin receptor like kinase (ALK) that play important role in regulation of TGF β (a transforming growth factor) signaling pathway (Choodamani et al., 2021). The receptor promotes angiogenesis (Yingling et al., 2004) and inflammation (Swayer et al., 2004); therefore, it is an important target in therapy development. In cancer, increased expression of TGF β receptor kinase I is commonly observed and serve as hallmark of malignant cancer (Abramson, 2018; Fleuren et al., 2016). In addition, the cyclin dependent kinases (CDKs) 2 and 6 are rate limiting for cell progression through the G1 into the S-phase of the cell cycle (Hennecke and Amati, 1997). They serve as checkpoint protein whereas differential expression will lead to loss of checkpoint function, and consequent neoplastic transformation (Ahmed and Jamil, 2011; Jayaraman et al., 2011; Jayaraman and Jamil, 2012). Over expression of both the CDK-2 and CDK-6 has been reported in the pathogenesis of leukemia (Agirre et al., 2009; Chilosi et al., 1998) and the catalytic activity of the proteins could contribute to the retinoblastoma (Rb) inactivation in leukemic cells (Schmitz et al., 2005). In this study, (+-)-2-Phenethanamine, 1-methyl-N-vanillyl-, cis-Z-.alpha.-Bisabolene epoxide, 2-Methyl-6-(5-methyl-2-thiazolin-2-ylamino)pyridine, alpha-Himachalene, gingerdione, 6-Shogoal and 1(2H)-Naphthalenone, 3,4,4a,5,8,8a-hexahydro-8a-methyl-,trans-, paradol, Bis(2-ethylhexyl) phthalate were the most promising candidate with strong inhibitory potential against this transforming growth factor and the cyclin dependent kinases. The compounds interacts with one or more amino acid residues that have been reported to contributes majorly to the catalytic functions within the active site of the target proteins (Cho et al., 2010; Honda et al., 2005; Jayaraman and Jamil, 2014). The compounds exhibit strong affinity similarly reported for some standard anticancer drugs such as doxorubicin, Daunorubicin, Fisetin and phytochemicals including Flavopiridol (Wu et al., 2003), Curcumin and Quercetin (Gurung et al., 2020a, 2020b; Jayaraman and Jamil, 2014).
Apoptosis is a tightly regulated process and the fundamental hallmark of cancer cells is their ability to evade the physiological cues that will commit them to suicide (Hanahan and Weinberg, 2000). The pro-survival B-cell lymphoma 2 (Bcl-2) family of proteins is often over expressed in cancer cells to suppress apoptosis and confer resistance against chemotherapeutic agents (Amundson et al., 2000; Green and Evan, 2002). Accordingly, inhibition of Bcl-2 offers attractive therapeutic target to the abnormal cell death pathway commonly expressed by cancer cells. Together with the aforementioned inhibitors of the cell cycle proteins, allohimachalo, beta-Amyrenyl acetate, (E)-1-(4-Hydroxy-3-methoxyphenyl)dec-3-en-5-one, caryophyllene and n-Hexadecanoic acid identified in the ethyl acetate and n-butanol fractions of M. lucida might have exhibited anti-leukemic effects by inhibiting cancer cell survival through promotion of apoptosis. This observation is supported by experimental studies where caryophyllene and hexadecanoic acid induced apoptosis in leukemia cell lines (Amiel et al., 2012; Ravi and Krishnan, 2017). Finally, in our attempt to examine the possible antioxidant promoting property of the hit compounds, again, (+-)-2-Phenethanamine,1-methyl-N-vanillyl-, cis-Z-.alpha.-Bisabolene epoxide, 2-Methyl-6-(5-methyl-2-thiazolin-2-ylamino)pyridine, alpha-Himachalene, gingerdione, 6-Shogoal, 1(2H)-Naphthalenone,3,4,4a,5,8,8a-hexahydro-8a-methyl-,trans-, paradol, Bis(2-ethylhexyl)phthalate, allohimachalo, beta-Amyrenyl acetate, and 1,4,7,-Cycloundecatriene,1,5,9,9-tetramethyl-, Z,Z,Z- were promising inhibitors of human Kelch-like ECH–associated protein (keap-1). Keap-1 is a major repressor of Nuclear factor erythroid-2 related factor 2 (Nrf2), known to contribute to the regulation of the cellular antioxidant system through binding to the Antioxidant Response Element (ARE) and consequently promoting antioxidant enzyme production (Li et al., 2012; Tkachev et al., 2011). It is however plausible to postulate that the inhibition of Keap-1 that is known to sequester the Nrf-2 within the cytoplasm and prevent its translocation to the nucleus where it binds to the ARE for antioxidant promotion will be a huge success in the management of oxidative stress related disease like cancer.
Attrition of drugs in preclinical and clinical trials is quite an alarming event due to poor pharmacokinetic studies (Gurung et al., 2016). Therefore, screening of drug-like molecules can increase the chances of passing through the clinics (Gurung et al., 2020a, 2020b). The hit compounds in this study were subjected to pharmacokinetic screening. The drug-likeness test was based on the Lipinski’s Rule of Five (Lipinski et al., 1997). All the compounds showed drug-like property as none had more than one Lipinski’s violation. The cytochrome P450 enzymes (CYPs) are superfamily of proteins involved in the metabolism and detoxification of xenobiotics (Brown et al., 2008). Inhibition of any of the drug-metabolizing CYPs will elevate the concentration of the corresponding drug substrate and bring about drug overdose (Murray, 2006). Some of the compounds with drug likeliness were inhibitors to one or more of the metabolizing enzymes. Interestingly, 2-Methyl-6-(5-methyl-2-thiazolin-2-ylamino)pyridine, sqaulene, and 1(2H)-Naphthalenone, 3,4,4a,5,8,8a-hexahydro-8a-methyl-,trans- were the only non-inhibitor of the CYPs, and were as well non-substrate to P-glycoprotein (Pgp), a critical determinant of the pharmacokinetic properties of drugs as it functions to extracts foreign substances from the cell (Lee et al., 2015). Summarily, these compounds are potential drug candidates for cancer treatment.
9 Conclusion
Overall antileukaemic and anticlastogenic effects of M. lucida fractions may be attributed to the apoptotic induction, cytotoxicity, antichromosomal damaging and anti-inflammatory potentials of the identified compounds in the fractions of M. lucida. The observation of anti-leukaemic activities provided some scientific basis for the use of M. lucida in traditional system of medicine for the treatment of leukaemia. It is also clear from our study that the active constituents reside in the polar fractions of M. lucida and the resident phytochemicals might have inhibited abnormal cell cycle, promote apoptosis and antioxidants to show anti-leukaemic activity. Further studies will focus on the wet laboratory validation of the mode of anti-leukemic activity and isolate the bioactive compounds in the fractions.
Acknowledgement
We would like to express our gratitude to the Dr. Tolu of Heamatolgy Department, Bowen Teaching Hospital, Ogbomoso for providing technical assistance in staining of bone marrow and blood.
Conflict of Interest
The authors declare that there is no conflict of interest.
Summary
Morinda lucida extract is used to treat leukemia in Africa. This study screened fractions of M. lucida for anti-leukaemic activities. Ethylacetate and n-butanol fractions of M. lucida prevented leukemia formation in mice. The study showed that the anti-leukemic constituents of M. lucida might inhibit leukemia via cell cycle arrest, apoptosis and antioxidant stimulation.
References
- The multiple myeloma drug pipeline-2018: A review of small molecules and their therapeutic targets. Clin. Lymphoma Myeloma.. 2018;18:611-627.
- [Google Scholar]
- Phytochemical screening and antimicrobial study on the leaves of Morinda lucida (Rubiaceae) J. Nat. Sci. Res.. 2013;3(14):131-135.
- [Google Scholar]
- Adeleye, O.O., Ayeni, O.J., Ajamu, M.A., 2018. Journal of Medicinal Plants Studies. 6(2):249-254.
- Pharmacological evaluation of oral hypoglycemic and antidiabetic effects of fresh leaves ethanol extract of Morinda lucida benth. in normal and alloxan-induced diabetic rats. Afr. Jo. Biomed. Res... 2008;11:65-71.
- [Google Scholar]
- Ethnobotanical survey, anti-leukemia, and anti-clastogenic potential of medicinal plants used for treatment of leukemiain Oyo State Nigeria. J. of Complement. Alternative Med. Res.. 2020;10(3):31-51.
- [Google Scholar]
- Agirre, X., Vilas-Zornoza, A., Jiménez-Velasco, A., Martin-Subero, J.I., Cordeu, L, Gárate L, San José-Eneriz E, Abizanda G, Rodríguez-Otero P, Fortes P, Rifón J, Bandrés E, Calasanz MJ, Martín V, Heiniger A, Torres A, Siebert R, Román-Gomez J, Prósper F (2009) Epigenetic silencing of the tumor suppressor microRNA Hsa-miR- 124a regulates CDK6 expression and confers a poor prognosis in acute lymphoblastic leukemia. Can. Res. 69:4443–4453.
- Cytotoxicity of neoplastic drugs Gefitinib, Cisplatin, 5-FU, Gemcitabine, and Vinorelbine on human cervical cancer cells (HeLa) Biol. Med.. 2011;3:60-71.
- [Google Scholar]
- Antimicrobial activities of methanolic extract of carissa opaca roots and its fractions and compounds isolated from the most active ethyl acetate fraction. A. Pac. J. Tropi. Biomed.. 2015;5:541-545.
- [Google Scholar]
- In-vitro cytotoxicity studies of 20 Plants used in Nigerian Antimalarial Ethnomedicine. Phytomedicine. 2006;13:295-298.
- [Google Scholar]
- In vitro and in vivo anticancer activity of root extracts of Sansevieria liberica gerome and Labroy (Agavaceae) Evidence-Based Complement. Alternat. Med.. 2015;2015:1-11.
- [Google Scholar]
- β-caryophyllene, a compound isolated from the biblical balm of gilead (Commiphora gileadensis), is a selective apoptosis inducer for tumor cell lines. Evidence-Based Complement. Alternat. Med.. 2012;2012:1-8.
- [Google Scholar]
- An informatics approach identifying markers of chemosensitivity in human cancer cell lines. Can. Res.. 2000;60:6101-6110.
- [Google Scholar]
- Benzothiophene inhibitors of MK2. Part 2: Improvements in kinase selectivity and cell potency. Bioorg. Med. Chem. Lett.. 2009;19:4882-4884.
- [Google Scholar]
- Andrew, W. and Janet, S. (1997). Benzene Department of Human Services (USA); 1997.
- Antiproliferative, Antioxidant Activities and Apoptosis Induction by Morinda lucida and Taraxacum officinale in Human HL-60. Leukemia cells.. 2016;5(7):4281-4291.
- [Google Scholar]
- Does Oxidative Damage Contribute to the Generation of Leukemia? Leuk. Res.. 2009;33(10):1297.
- [Google Scholar]
- Effect of Different Solvent Extracted Sample of Allium sativum (Linn) on Bacteria and Fungi. Afri. J. Biotechno.. 2011;10:5910-5915.
- [Google Scholar]
- Measurement of Oxidative Stress and Antioxidant Status in Acute Lymphoblastic Leukemia Patients. Clin. Biochem.. 2008;41(7):511-518.
- [Google Scholar]
- Cytochromes P450: a structure-based summary of biotransformations using representative substrates. Drug. Metab Rev.. 2008;40:1-100.
- [Google Scholar]
- Bruncko, M., Oost, T.K., Belli, B.A., Ding, H., Joseph, M.K., Kunzer, A., Martineau, D., MMcClellan, W.J., Mitten, M., Ng, S., Nimmer, P.M., Oltersdorf, T., Park, C., Petros, A.M., Shoemaker, A.R., Song, X., Wang, X., Wendt, M.D., Zhang, H., Fesik, S.W., Rosenberg, S.H., Elmore, S.W. (2007). Studies Leading to Potent, Dual Inhibitors of Bcl-2 and Bcl-xL. J. Med. Chem. 50: 641-662.
- Carracedo, A., Gironella, M., Lorente, M., Garcia, S., Guzmán, M., Velasco, G. and Iovanna J.L. (2006). Cannabinoids induce Apoptosis of Pancreatic Tumor Cells via Endoplasmic Reticulum Stress- Related Genes. Cancer Research. 66:6748–6755.
- Inhibition of skin tumor growth and angiogenesis in-vivo by activation of cannabinoid receptors. J. Clin. Investigat.. 2003;2003(111):43-50.
- [Google Scholar]
- Differential expression of cyclin-dependent kinase 6 in cortical thymocytes and T-cell lymphoblastic lymphoma/leukemia. The American journal of pathology, 152(1), 209–217. (1998) Differential expression of cyclin-dependent kinase 6 in cortical thymocytes and T-cell lymphoblastic lymphoma/leukemia. Am. J. Pathol.. 1998;152:209-217.
- [Google Scholar]
- 4-(Pyrazol-4-yl)- pyrimidines as selective inhibitors of cyclin-dependent kinase 4/6. J. Med. Chem.. 2010;53:7938-7957.
- [Google Scholar]
- Synthesis, molecular docking and preliminary antileukemic activity of 4-methoxybenzyl derivatives bearing imidazo[2,1-b][1,3,4]thiadiazole. Chem Biodivers.. 2021;18(2):1-22.
- [Google Scholar]
- Induction of aplastic Anaemia in experimental model. Int. J. Appl. Biol. Pharmaceut. Technol.. 2017;7(1):182-195.
- [Google Scholar]
- Neuroprotective effect of 6-paradol in focal cerebral ischemia involves the attenuation of neuroinflammatory responses in activated microglia. PLoS ONE. 2015;10(3):1-17.
- [Google Scholar]
- Introduction of the world health organization project of the international classification of traditional medicine. Zhong Xi Yi Jie He Xue Bao.. 2011;9(11):1161-1164.
- [Google Scholar]
- Shanghai Health Study (2001–2009): What was learned about Benzene Health effects? Crit. Rev. Toxicol. 2017:1-31.
- [Google Scholar]
- Molecular docking of the anticancer bioactive compound proceraside with macromolecules involved in the cell cycle and DNA replication. Genet Mol. Res.. 2016;2016:15.
- [CrossRef] [Google Scholar]
- Molecular docking elucidates the plausible mechanisms underlying the anticancer properties of acetyldigitoxigenin from Adenium obesum. Saudi J. Biol. Sci.. 2020;27:1907-1911.
- [Google Scholar]
- Unravelling lead antiviral phytochemicals for the inhibition of SARS-CoV-2Mpro enzyme through in silico approach. Life Sci.. 2020;255:117831
- [Google Scholar]
- Phytochemicals of Aristolochia tagala and Curcuma caesia exert anticancer effect by tumor necrosis factor-α-mediated decrease in nuclear factor kappaB binding activity. J. Basic Clin. Pharmacol.. 2016;7:1-11.
- [Google Scholar]
- Cyclin E and c-Myc promote cell proliferation in the presence of p16 INK4a and of hypophosphorylated retinoblastoma family proteins, the best characterized substrates of cyclin? CDK com. The EMBO J.. 1997;16:5322-5333.
- [Google Scholar]
- The structure of cyclin E1/CDK2: implications for CDK2 activation and CDK2-independent roles. EMBO J.. 2005;24:452-463.
- [Google Scholar]
- Drug targets for cell cycle dysregulators in leukemogenesis: in silico docking studies. PLoS ONE. 2014;9(1):e86310
- [Google Scholar]
- The interaction of p53 and MDM2 genes in cancers, in silico studies and phylogenetic analysis. Biol. Med.. 2011;3:01-12.
- [Google Scholar]
- Clusters of CDK2, CCND1, and CMYC genes involved in cancers, Acute Lymphocytic Leukemia (ALL) as a model. Biol. Med.. 2012;4:37-50.
- [Google Scholar]
- Chemical derivatization and mass spectral libraries in metabolic profiling by GC/MS and LC/MS/MS. J. Exp. Bot.. 2005;56(410):219-243.
- [Google Scholar]
- High-resolution genomic profiling of childhood ALL reveals novel recurrent genetic lesions affecting pathways involved in lymphocyte differentiation and cell cycle progression. Leukemia. 2007;21:1258-1266.
- [Google Scholar]
- High expression FUT1 and B3GALT5 is an independent predictor of postoperative recurrence and survival in hepatocellular carcinoma. Nat. Scient. Rep.. 2017;7(10750):1-12.
- [Google Scholar]
- In utero and acute exposure to benzene: Investigation of DNA double-strand breaks and DNA recombination in mice. Mutat. Res./Genetic Toxicol. Environ. Mutagenesis.. 2009;676:74-82.
- [Google Scholar]
- Inhibitor recognition specificity of MERS-CoV papain-like protease may differ from that of SARS-CoV. A-J: Acs chemical biology; 2015.
- Potentiating Effect of b-caryophyllene on anticancer activity of a-humulene, isocaryophyllene and paclitaxel. J. Pharm. Pharmacol.. 2006;59:1643-1647.
- [Google Scholar]
- Experimental and computational approaches to estimate solubility and permeability in drug discovery and development settings. Adv. Drug Deliv. Rev.. 1997;23:3-25.
- [Google Scholar]
- Crystal structure of a human cyclin-dependent kinase 6 complex with a flavonol inhibitor, Fisetin. J. Med. Chem.. 2005;48(3):737-743.
- [Google Scholar]
- Qualitative assessment of sonicated apple juice during storage. J. Food Process. Preserv. 2014:1-10.
- [Google Scholar]
- Role of CYP pharmacogenetics and drug-drug interactions in the efficacy and safety of atypical and other antipsychotic agents. J. Pharm. Pharmacol.. 2006;58:871-885.
- [Google Scholar]
- TMED10 protein interferes with transforming growth factor (TGF)-beta signaling by disrupting TGF-beta receptor complex formation. J. Biol. Chem.. 2017;292:4099-4112.
- [Google Scholar]
- National Cancer Institute (2021): Cancer Stat Facts: Leukemia. Available Online. Accessed, 26/07/2021.
- Anti-diabetic effects of Morinda lucida stem Bark extracts on Alloxan-induced Diabetic Rats. Res. J. Pharmacol.. 2010;4(3):78-82.
- [Google Scholar]
- Cell cycle proteins as promising targets in cancer therapy. Nat Rev Can.. 2017;17(2):93-115.
- [Google Scholar]
- Biology, risk stratification, and therapy of pediatric acute leukemias: an update. J Clin Oncol. 2011;29:551-565.
- [Google Scholar]
- Antifungal anthraquinones from Morinda lucida. Int. J. Pharmacognosy.. 1995;33(21):107-114.
- [Google Scholar]
- Cytotoxic potential of N-hexadecanoic acid extracted from Kigelia pinnata leaves. Asian J. Cell Biol.. 2017;12:20-27.
- [Google Scholar]
- Assessment of the genotoxic and mutagenic properties of Himatanthus articulates bark extracts used as phytotherapeutic drug in the Amazon. J. Ethnopharmacol.. 2013;147:474-480.
- [Google Scholar]
- p62/Sqstm1 promotes malignancy of HCV-positive hepatocellular carcinoma through Nrf2-dependent metabolic reprogramming. Nat. Commun.. 2016;7(12030):1-16.
- [Google Scholar]
- Synthesis and activity of new aryl- and heteroaryl-substituted 5,6-dihydro-4H-pyrrolo[1,2-b]pyrazole inhibitors of the transforming growth factor-b type I receptor kinase domain. Bioorg. Med. Chem. Lett.. 2004;14:3581-3584.
- [Google Scholar]
- CDK2 catalytic activity and loss of nuclear tethering of retinoblastoma protein in childhood acute lymphoblastic leukemia. Leukemia. 2005;19:1783-1787.
- [Google Scholar]
- Selective Toxicity of Persian Gulf Sea Cucumber (Holothuria parva) and Sponge (Haliclona oculata) Methanolic Extracts on Liver Mitochondria Isolated from an Animal Model of Hepatocellular Carcinoma. Hepat Mon.. 2015;15(12):033-073.
- [Google Scholar]
- Potential Role of Free Radicals in Benzene-Induced Myelotoxicity and Leukemia. Free Rad. Biol. Med.. 1991;11:495-515.
- [Google Scholar]
- Mechanism of the Nrf2/Keap1/ ARE signaling system. Biochemistry (Mosc.). 2011;76(4):407-422.
- [Google Scholar]
- AutoDock Vina: improving the speed and accuracy of docking with a new scoring function, efficient optimization and multithreading. J. Comput. Chem.. 2010;31:455-461.
- [Google Scholar]
- Molecular docking and pharmacological property analysis of phytochemicals from clitoria ternatea as potent inhibitors of cell cycle checkpoint proteins in the Cyclin/CDK pathway in cancer cells. Computat. Mol. Biosci.. 2019;9:81-94.
- [Google Scholar]
- Antiplasmodial efficacy of methanolic root and leaf extracts of Morinda lucida. J. Nat. Sci. Res.. 2013;3(2):112-122.
- [Google Scholar]
- Suppressive, curative and prophylactic potentials of Morinda lucida (Benth) against erythrocytic stage of mice infective chloroquine sensitive Plasmodium berghei NK-65. Brit. J. Appl. Sci. Technol.. 2011;1(3):131-140.
- [Google Scholar]
- Medicinal properties of substances occurring in higher basidiomycetes mushrooms: current perspectives. Int. J. Med. Mushrooms.. 1999;1:31-62.
- [Google Scholar]
- 6-Paradol and 6-shogaol, the pungent compounds of ginger, promote glucose utilization in adipocytes and myotubes, and 6-paradol reduces blood glucose in high-fat diet-fed mice. Int. J. Mol. Sci.. 2017;18(168):2-18.
- [Google Scholar]
- Whitlock, J.A., Gaynon, P.S (2004). Acute Lymphoblastic Leukemia in Children. In: Greer JP, Rodgers GM, Foerster J, Paraskevas F, Lukens JN, et al. Windrobe’s Clinical Haematology (11th Ed.) 2014; by Lippincott and Wilkins: 2143-2167.
- Discovery of a novel family of CDK inhibitors with the program LIDAEUS: structural basis for ligand-induced disordering of the activation loop. Structure. 2003;11:399-410.
- [Google Scholar]
- Solannm lyratum extract affected immune response in normal and leukemia murine animal in vivo. Hum. Exp. Toxicol.. 2015;29(5):359-367.
- [Google Scholar]
- Development of TGF-beta signaling inhibitors for cancer therapy’. Nat. Rev. Drug Discovery.. 2004;3:1011-1022.
- [Google Scholar]
Appendix A
Supplementary material
Supplementary data to this article can be found online at https://doi.org/10.1016/j.arabjc.2022.103802.
Appendix A
Supplementary material
The following are the Supplementary data to this article:


