

Translate this page into:
Poly(diphenylamine-4-sulfonic acid) modified glassy carbon electrode for voltammetric determination of gallic acid in honey and peanut samples
⁎Corresponding author. zelabitew@gmail.com (Zelalem Bitew)
-
Received: ,
Accepted: ,
This article was originally published by Elsevier and was migrated to Scientific Scholar after the change of Publisher.
Peer review under responsibility of King Saud University.
Abstract
In this study, a sensitive and selective voltammetric method based on poly(diphenylamine-4-sulfonic acid) modified glassy carbon electrode (poly(DPASA)/GCE) was developed for determination of gallic acid. Appearance of an irreversible oxidative peak at both bare GCE and poly(DPASA)/GCE for gallic acid with about three folds current enhancement and much reduced potential at poly(DPASA)/GCE showed catalytic property of the modifier towards oxidation of gallic acid. Under optimized conditions, Adsorptive stripping square wave voltammetric peak current response of the poly(DPASA)/GCE showed linear dependence with gallic acid concentration in the range 5.00 × 10⁻⁷–3.00 × 10⁻⁴ mol L−1 with limit of detection of 4.35 × 10⁻⁹. Spike recovery results between 94.62 and 99.63, 95.00–99.80 and 97.25–103.20% of gallic acid in honey, raw peanut, and commercial peanut butter samples respectively, interference recovery results with less than 4.11% error in the presence of uric acid and ascorbic acid, lower LOD and relatively wider dynamic range than most of the previously reported methods validated the potential applicability of the method based on poly(DPASA)/GCE for determination of gallic acid real samples including in honey and peanut samples.
Keywords
Gallic acid
Diphenyl amine sulfonic acid
Adsorptive anodic striping square wave voltammetry
Honey
Peanut

1 Introduction
Honey, one of a sweeting food and flavorful natural product, has been consumed for its high nutritive value by humans for a long time (Puscas et al., 2013). Honey is a sugary natural product produced by honey bees from nectar of different flowers (nectar honey) and secretions of living parts of plants or excretions of plant-sucking insects on the living parts of plant (honeydew honey) (Honório et al., 2014). This natural product is mainly composed of carbohydrates including fructose, glucose, maltose, sucrose, and other oligosaccharides and polysaccharides, comprising about 95% of honey’s dry weight, lower amounts of water and a great number of minor components (Puscas et al., 2013; Honório et al., 2014; Escuredo et al., 2013; Bertoncelj et al., 2007; Anjos et al., 2015; de Oliveira Neto et al., 2017). In addition, honey also contains a wide range of minor constituents such as, phenolic compounds, minerals, proteins, flavonoids, organic acids, free amino acids, enzymes, and vitamins (Puscas et al., 2013; Honório et al., 2014; Escuredo et al., 2013; Bertoncelj et al., 2007; de Oliveira Neto et al., 2017; Pauliuc et al., 2020). The composition, taste, and color of different honey depend primarily on its floral and geographical source. Moreover, the composition of honey is influenced by certain external factors including processing, climate, packaging and storage conditions (Puscas et al., 2013; Estevinho et al., 2008; Cianciosi et al., 2018; Halagarda et al., 2020).
Honey has functional properties in human health promotion which depend largely on the floral source of honey including antimicrobial and antioxidant activities. It is often used as a sugar substitute, an ingredient or a natural preservative in hundreds of manufactured foods (Estevinho et al., 2008; Cianciosi et al., 2018). It has also been used for centuries as a traditional medicine due its antioxidant and antibacterial properties (Honório et al., 2014; Pauliuc et al., 2020). Studies have shown that honey serves as a source of natural antioxidants, which are effective in reducing the risk of heart disease, stimulation of wounds, cancer, immune-system, different inflammatory processes etc. (Puscas et al., 2013; Bertoncelj et al., 2007; Pauliuc et al., 2020).
Phenolic compounds are among the most important compounds contributed towards the antioxidant activity of honey (Cheung et al., 2019). Peanut is among a potential source of natural phenolic compounds and one of the most popular foods consumed worldwide. Reports showed that peanuts possess diverse pharmacological activities such as antiviral, antimicrobial, anti-inflammatory, anticancer, antihypertension and cardiovascular disease protection (Limmongkon et al., 2017; Adhikari et al., 2019). Gallic acid (3,4,5-trihydroxybenzoic acid, Scheme SM 1), is a naturally occurring phenolic acid found in honey, plants (like tea, grapes, peanut), fruits (such as strawberries) and wine (Cianciosi et al., 2018); Ciulu et al., 2016; Chikere et al., 2021, 2019, 2020; Badea et al., 2019). Gallic acid (GA) has been used widely in the food industry as a food additive and for different activities in the pharmaceutical industry (Badea et al., 2019). GA has received much attention because of its multiple biological and pharmaceutical properties such as anti-inflammatory, antihistaminic and antitumor activities, scavenging of free radicals and protection against cardiovascular diseases, antioxidant, anticancer as well as antidiabetic properties (Chikere et al., 2021, 2019, 2020; Badea et al., 2019). GA has been widely used as food additive in food industry and anti-inflammatory chemical compound in the pharmaceutical industry (Chikere et al., 2021). Thus, GA is seen as an important compound in human diets due to these properties. With these important uses of GA in the food, drink and pharmaceutical industries, it is essential to develop sensors with improved sensitivity for GA determination in real samples.
Various analytical techniques including chromatographic (Saraji and Mousavi, 2010; Porgalı and Büyüktuncel, 2012), spectrophotometric (Zheng et al., 2017; Šeruga et al., 2011) and flow injection chemiluminescence (Wang et al., 2007; Nalewajko-Sieliwoniuk et al., 2010) are among the commonly reported techniques for determination of GA. However, most of these methods need tedious sample pre-treatment, long analysis time, expensive instrumentation, require advanced expertise and environmental issues. In contrast to these analytical methods, electrochemical methods have recently been generating a lot of interest due to their advantages including low cost, high selectivity, short response time, environmentally friendly and require little or no sample pre-treatment(Chikere et al., 2021, 2019, 2020; Badea et al., 2019; Ghaani et al., 2016).
Attempts have been made on the application of voltammetric methods for determination of GA in different samples (Chikere et al., 2021, 2019; Badea et al., 2019; Ghaani et al., 2016). Modification of the electrode surface has been strategically employed for enhancing the electrochemical performance of conventional electrodes in recent years. The enhanced electrochemical performance of modified electrodes is partly due to improvement in kinetics of electron transfer (Gupta and Ganesan, 2015), CoO nanoparticles/CPE (Chikere et al., 2021), ZrO2 nanoparticles/CPE (Chikere et al., 2020), SiO2 nanoparticle/CPE (Tashkhourian and Nami-Ana, 2015), polyepinephrine/GCE (Abdel-Hamid and Newair, 2013), polyethyleneimine-functionalized graphene oxide/GCE (Luo et al., 2013) and gold microclusters/sulfonate functionalized graphene/GCE (Liang et al., 2016) are among the electrode materials reported for electrochemical determination of GA in different food matrices.
Conducting polymers (CPs) have gained considerable attention for electrochemical sensor assembly due to their good film-forming property, electrical conductivity, and excellent thermal and environmental stability. CPs are synthesized by chemically or electrochemically oxidizing monomers to initiate polymerization. Several electrochemical sensors based on conducting polymers have been developed with major contributions in electroanalytical and materials science aiming for the determination of a wide range of analytes (Geto and Brett, 2016; Terán-Alcocer et al., 2021). Poly(diphenylamine-4-sulfonic acid), one of the water soluble and electrical conductive polyaniline derivative, has gained considerable importance for modification of sensors because of a facile processability in aqueous media and environmental stability (Zor and Cankurtaran, 2017; Cankurtaran et al., 2013). Electrode surfaces are usually modified with thin conducting polymer films by a combination of adsorptive attraction and low solubility in the working solution, using pre-formed soluble polymers or electrochemical polymerization (Terán-Alcocer et al., 2021). In this work, poly(diphenylamine sulfonic acid), which is a water soluble conducting polymer, was synthesized by electropolymerization of diphenylamine-4-sulfonic acid. Thus, fabrication of poly(diphenylamine-4- sulfonic acid) modified glassy carbon electrode (poly(DPASA)/GCE) by electropolymerization of diphenylamine-4- sulfonic acid on the surface of glassy carbon electrode, characterization and electrochemical sensor application of poly(DPASA)/GCE for electrochemical determination of GA in real samples including honey and peanut samples is reported.
2 Materials and methods
2.1 Chemicals and apparatus
K3[Fe(CN)6] and K4[Fe(CN)6] (98.0%, BDH laboratories supplies, England), potassium chloride (99.5% Blulux laboratories (Pvt) Ltd), sodium dihydrogen phosphate and sodium hydrogen phosphate (≥98%, Blulux laboratories (Pvt) Ltd), hydrochloric acid (37%, Fisher Scientific), sodium hydroxide (Extra pure, Lab Tech Chemicals), gallic acid (≥98%, Carlo Erba reagents, Italy), diphenylamine-4-sulfonic acid barium salt (≥98%, Blulux laboratories (Pvt) Ltd), ascorbic acid (≥99%, Blulux laboratories (Pvt) Ltd), uric acid (≥98%, Labort Fine Chem (Pvt) Ltd, Surat), were among the chemicals used. All chemicals and reagents were of analytical grade and hence used without further purification.
CHI760E potentiostat (Austin, Texas, USA), pH meter (AD8000, Romania), refrigerator (Lec refrigeration PLC, England), deionizer (Evoqua water technologies), and electronic balance (Nimbus, ADAM equipment, USA) were among the equipment/instruments used.
2.2 Procedures
2.2.1 Preparation of supporting electrolyte
Phosphate buffer solutions (PBS) of various pHs (pH 1.5–5.0) were prepared by mixing 0.1 M sodiumdihydrogenphosphate and disodiumhydrogenphosphate solutions. The pHs of the PBS were adjusted to the required values by the addition of 0.1 M HCl and 0.1 M NaOH.
2.2.2 Preparation of standard GA solutions
A 10.0 mM stock solution of GA was prepared by dissolving accurately weighed 188.12 mg of GA in deionized water in 100 mL volumetric flask. Working solutions of GA were prepared from the stock solution by serial dilution with PBS of appropriate pH.
2.2.3 Real sample collection and preparation
Honey samples were collected directly from beekeepers/farmers/ during active season from October to January 2021 in three selected sampling kebeles (kebele 01, 04 and 14) in Gazo wereda, North Wollo zone, Amhara region, Ethiopia. About 500 g honey sample from each kebele was collected. The samples were kept in plastic bags separately and then transported to electroanalytical research laboratory, Bahir Dar University, Ethiopia for further treatment.
10.0 g of honey from each sample was dissolved in 10.0 mL deionized water and boiled at 80 °C for 12 min under continuous stirring using water bath. The honey sample was allowed to cool before filtrating through a Whatman filter paper and the filtrate was reconstituted in to 50 mL flask and filled up to the mark with deionized water. Honey sample for GA determination was then prepared by transferring 2.5 mL of the honey sample solution into 25 mL volumetric flask and filled up to the mark with pH 2.0 PBS.
Raw peanut and commercial peanut butter (AAF, Berejat) samples were purchased from a supermarket in Bahir Dar city, Ethiopia. 5.0 g of crushed peanut sample was dissolved in 50 mL deionized water and boiled at 60 °C for 10 min under continuous stirring using water bath. The peanut sample was allowed to cool and filtered through a Whatman filter paper. 1.0 mL of the filtrate was diluted with pH 2.0 PBS in 25 mL volumetric flask for voltammetric measurements.
2.2.4 Preparation of poly(DPASA)/(GCE)
Glassy carbon electrode (GCE) was first polished with alumina slurry of different sizes (1, 0.3, and 0.05 μm) until a mirror like surface was obtained and then rinsed with distilled water. The polished GCE was immersed in 1.0 mM DPASA containing 0.1 M KCl and scanned between an optimized potential window −1.0 to +2.0 V for 15 cycles at scan rate of 100 mV s−1. The modified GCE, after rinsed with deionized water, was stabilized in pH 7.0 PBS by scanning between −0.8 and +0.8 V range at 100 mV s−1.
2.3 Electrochemical measurements
A three electrode system with Ag/AgCl (3.0 M KCl) as a reference electrode, Pt coil as counter electrode, and bare GCE (diameter of 3 mm) or poly(DPASA)/GCE as working electrode was used for electrochemical measurements. Whereas electrochemical impedance spectroscopy and cyclic voltammetry techniques were used to characterize the surface of the modified electrode, cyclic voltammetry was used to investigate the electrochemical behavior of GA at the surface of the poly(DPASA)/GCE at various scan rates and pHs. Furthermore, Adsorptive stripping square wave voltammetric method was employed for the quantitative determination of GA in honey and peanut samples.
3 Results and discussion
3.1 Fabrication and electrochemical characterization of the modified electrode
3.1.1 Fabrication of poly(DPASA)/GCE
Poly(DPASA)/GCE was fabricated by scanning the potential of a polished GCE in 1.0 mM DPASA monomer containing 0.1 M KCl between −1.0 and 2.0 V for 15 cycles at 100 mV s−1 (Fig. 1). Fig. 1 presents cyclic voltammogram of 1.0 mM DPASA in 0.1 M KCl solution at GCE scanned between −1.0 and +2.0 V for 15 cycles. As can be seen from the figure, appearance of anodic peaks (a-c) and cathodic peaks (a’ & b’) with increasing current showed deposition of an electroactive polymer film on the electrode surface. Inset of Fig. 1 depicts the CVs of bare GCE (curve a) and stabilized poly(DPASA)/GCE (curve b) in in pH 7.0 PBS scanned between −0.8 to +0.8 V. In contrast to the broad reductive peak at bare GCE in pH 7.0 PBS (curve a of inset) assigned for reduction of oxygen, appearance of multiple oxidative and reductive peaks at poly(DPASA)/GCE (curve b of inset) further confirmed the deposition of an electroactive polymer film on the electrode surface.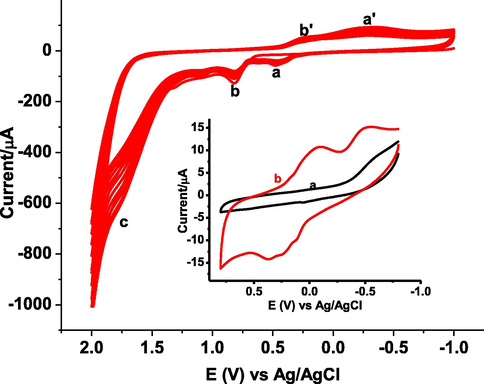
Cyclic voltammogram of 1.0 mM DPASA in 0.1 M KCl solution at GCE scanned between −1.0 and + 2.0 V for 15 cycles at 100 mV s−1. Inset: CVs of (a) bare GCE, and (b) poly(DPASA)/GCE in pH 7.0 PBS scanned between −0.8 and + 0.8 V at 100 mV s−1.
3.1.2 1 Cyclic voltammetric characterization
Cyclic voltammetry using Fe(CN)63−/4− as a probe was used to characterize the polymer film modified GCE. The cyclic voltammograms of both the bare GCE (curve a of Fig. 2) and poly(DPASA)/GCE (curve b of Fig. 2) in mixture of 10.0 mM of Fe(CN)63−/4− containing 0.1 M KCl solution are presented. In contrast to the two peaks with peak-to-peak separation (ΔE) of 444 mV at bare GCE, poly(DPASA)/GCE showed pair of peaks with over three folds of current and ΔE 146 mV demonstrating surface modification of the electrode by a material.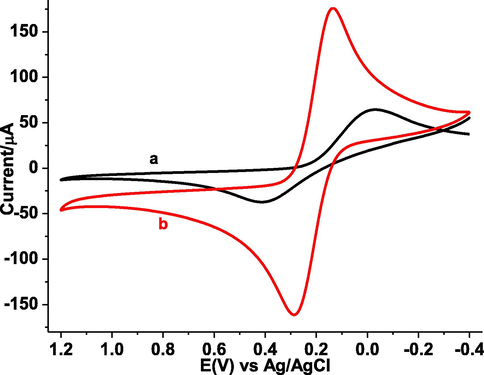
CVs of (a) bare GCE, and (b) poly(DPASA)/GCE in pH 7.0 PBS containing 10.0 mM (Fe(CN)6)3−/4− and 0.1 M KCl at 80 mV s−1 scan rate.
To investigate the effect of surface modification on the electrode surface area, cyclic voltammograms of poly(DPASA)/GCE in pH 7.0 PBS containing 10.0 mM (Fe(CN)6)3−/4− and 0.1 M KCl at different scan rates were recorded at various scan rates (Fig. 3). The active surface area of the working electrodes were estimated from the slope of the plot of Ipa versus ν1/2 of the cyclic voltammetry response of each electrode for Fe(CN)63−/4− using the Randles-Sevcik equation (eq. (1)) (Chikere et al., 2021).
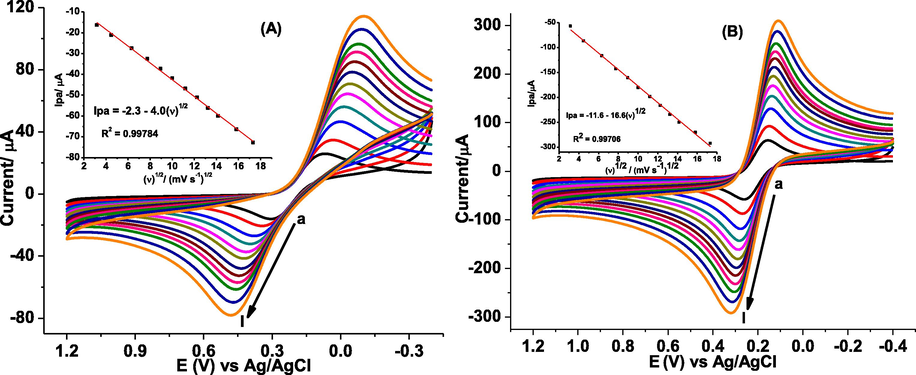
CVs of (A) bare GCE and (B) poly(DPASA)/GCE in pH 7.0 PBS containing 10.0 mM Fe(CN)63−/4− and 0.1 M KCl at various scan rates (a-l: 10, 20, 40, 60, 80, 100,125, 150, 175, 200, 250, and 300 mV s−1 respectively). Insets: plots of Ip vs ν1/2.
Where Ipa is the anodic peak current (µA), n is the number of electrons transferred, A is the active surface area of the electrode (cm2), D is the diffusion coefficient of Fe(CN)63−/4 (cm2 s−1), Co is the bulk concentration of the probe (M) and ν is the scan rate (V s−1). Taking n = 1, D = 7.6 × 10⁻⁶ cm2s−1, and C0 = 10.0 mM for the probe, the active surface area of bare GCE and poly(DPASA)/GCE were calculated to be 0.054 and 0.224 cm2, respectively demonstrating the poly(DPASA) served as an effective modifier that increased the surface area of the electrode. Thus, the observed current enhancement for Fe(CN)63−/4− at poly(DPASA)/GCE might be ascribed to the four folds of improved active surface area of the polymer modified electrode.
3.1.3 Electrochemical impedance spectroscopic characterization
Electrochemical impedance spectroscopy (EIS), an efficient tool to characterize the electrical properties of the surface of an electrode, was used to verify the electrode modification. Fig. 4 presents Nyquist plots of the bare GCE (curve a) and poly(DPASA)/GCE (curve b) in Fe(CN)63−/4− containing 0.1 M KCl. As can be seen from the figure, both the studied bare GCE and poly(DPASA)/GCE electrodes exhibited semicircles of different diameter at high frequency region and at low frequency region a line at about 45° (also known Warburg element) attributed to diffusion of the probe from the bulk solution towards electrode-solution interface. In contrast to the bare electrode (curve a), the poly(DPASA)/GCE (curve b) revealed a semi-circle with smaller diameter indicating that the surface of the electrode is modified with polymer film that improved the charge transfer conductivity of the electrode surface.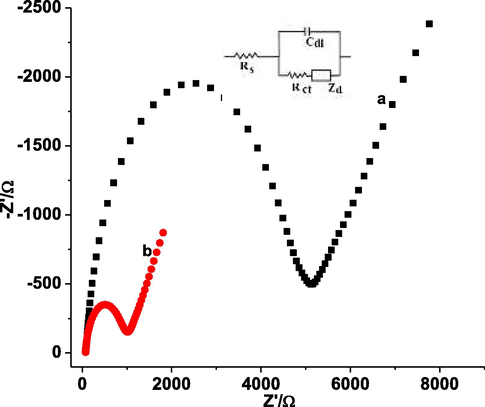
Nyquist plot of (a) bare GCE, and (b) poly(DPASA)/GCE in pH 7.0 PBS containing 10.0 mM Fe(CN)63−/4− and 0.1 M KCl. Frequency range: 0.01–100000 Hz, amplitude: 0.01 V, and potential: 0.23 V. Inset: proposed equivalent circuit where Zd stands for the Warburg diffusion constant.
Circuit elements including solution resistance (Rs), charge transfer resistance (Rct) and double layer capacitance (Cdl) for each studied electrode calculated from the respective Nyquist plot using eq. (2) are summarized (Table 1).
Electrode
Rs/Ω cm2
Rct/Ω cm2
Cdl/ F
f /Hz
GCE
16.8
5465
9.3 × 10⁻⁸
316.2
poly(DPASA)
16.8
1149
1.1 × 10⁻⁶
125.9
Where CdI – double layer capacitance, f – frequency corresponding to the maximum imaginary impedance (reactance) value on Nyquist plot, and, Rct – charge transfer resistance given by the diameter of the semi-circle at high frequency region.
Lower Rct value for poly(DPASA)/GCE (1149 Ω) (curve b) than the bare (5465 Ω) (curve a) demonstrated lower charge transfer resistance of the surface and hence faster electron transfer rate between the substrate and the analyte, which could be attributed to the conductive nature of the polymer film (Table 1). Table 1 presents values for selected circuit elements (Rct, Rs, and Cdl) for poly(DPASA)/GCE and bare GCE calculated using eq.(2).
3.2 Cyclic voltammetric investigation of GA
3.2.1 Electrochemical behavior of GA at poly(DPASA)/GCE
The electrochemical behavior of GA was evaluated using cyclic voltammetry at the surface of unmodified GCE and poly(DPASA)/GCE (Fig. 5). Fig. 5 presents cyclic voltammograms of GA at unmodified GCE, Poly(DPASA)/GCE A weak and broad oxidation peak (11.9 µA) without any peak in the reverse scan was observed at about + 0.640 V at the surface of bare GCE (curve a of inset). In contrast to the bare GCE, a well-defined oxidative peak (25.6 µA) centered at a peak potential (+0.520 V) at poly(DPASA)/GCE (curve b of inset) indicated that GA undergoes irreversible oxidation at both electrodes although with different sensitivity. While the observed catalytic effect of poly(DPASA)/GCE towards oxidation of GA as evidenced by enhanced current could be attributed to the improved surface area, the over-potential reduction may be accounted for the improved conductivity of the surface.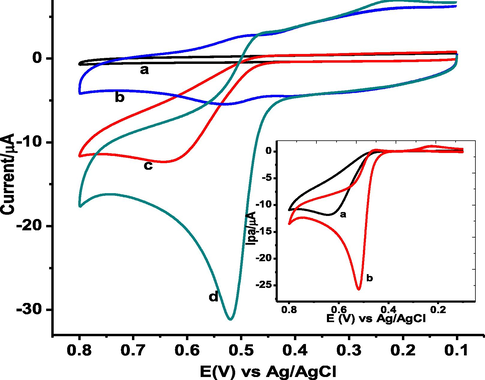
CVs of (a) bare GCE, (b) poly(DPASA)/GCE in pH 2.0 PBS containing no GA, (c) bare GCE and (d) poly(DPASA)/GCE containing 1.0 mM GA at scan rate of 100 mV s−1. Inset: blank subtracted CVs of (a) bare, and (b) poly(DPASA)/GCE.
3.2.2 Effect of pH
To investigate whether a proton has participated during oxidation of GA, the influence of pH of PBS on the oxidation peak current and peak potential response of poly(DPASA)/GCE was investigated over pH range 1.5 to 5.0. Cyclic voltammograms of poly(DPASA)/GCE in various pH values of PBS containing 1.0 mM GA are shown in Fig. 6A. The oxidative peak current of GA at the surface of poly(DPASA)/GCE is observed to increase with pH value from pH 1.5 to 2.0, which then decreased rapidly at pH values beyond 2.0 (Fig. 6B) making pH 2.0 the optimum. Accordingly, pH 2.0 was selected as an optimum pH of buffer solution for the subsequent experiments.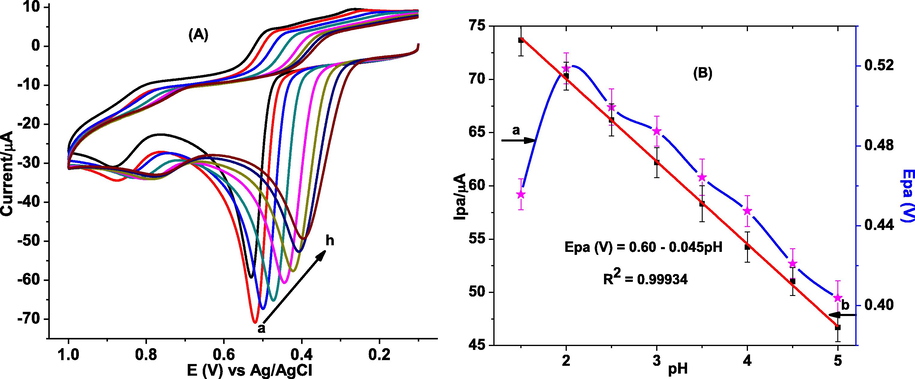
(A) CVs of poly(DPASA)/GCE in PBS of various pHs (a-h: 1.5, 2.0, 2.5, 3.0, 3.5, 4.0, 4.5, and 5.0 respectively) containing 1.0 mM GA. (B) plot of anodic peak current vs pH (a) and anodic peak potential vs pH (b).
Furthermore, the dependence of the peak potential on the pH for the oxidation of GA at poly(DPASA)/GCE was studied. While observed peak potential shift in the negative direction with pH variation from 1.5 to 5.0 (Fig. 6A) indicated proton participation during the oxidation of GA at the poly(DPASA)/GCE, slope of 0.045 V which is near to the Nernstian value of 0.059 V/pH (at 25 °C) for plot of oxidative peak potential versus pH of the PBS (Fig. 6B) showed involvement of equal number of protons and electrons in GA oxidation as described in the proposed mechanism (scheme 1) (Chikere et al., 2021; Luo et al., 2013; Liang et al., 2016).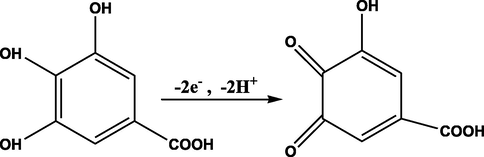
Proposed mechanism for GA oxidation.
3.2.3 Effect of scan rate
To investigate the reversibility and the type of reaction kinetics oxidation of GA followed at poly(DPASA)/GCE, the influence of scan rate (ν) on the oxidation peak current (Ipa) of GA was evaluated. Fig. 7A presents cyclic voltammograms of poly(DPASA)/GCE in pH 2.0 PBS containing 1.0 mM GA at different scan rates. The Ipa of GA in pH 2.0 PBS increased with increase in scan rate over the range of 20–300 mV s−1. As can be seen from Fig. 7A, at low scan rates GA shows an irreversible cyclic voltammograms, while at higher ones, the wave becomes quasi-reversible. At higher scan rates, the observed peak potential of GA at poly(DPASA)/GCE slightly shifted in the positive direction with increasing scan rate demonstrating that the oxidation of GA is quasi-reversible. Moreover, a better correlation coefficient for the dependence of peak current on the scan rate (R2 = 0.99192) (Fig. 7B) than on the square root of scan rate (R2 = 0.97471) (Fig. 7C) indicated that the oxidation of GA at poly(DPASA)/GCE is predominantly governed by adsorption controlled process(Abdel-Hamid and Newair, 2013; Lisnund et al., 2020).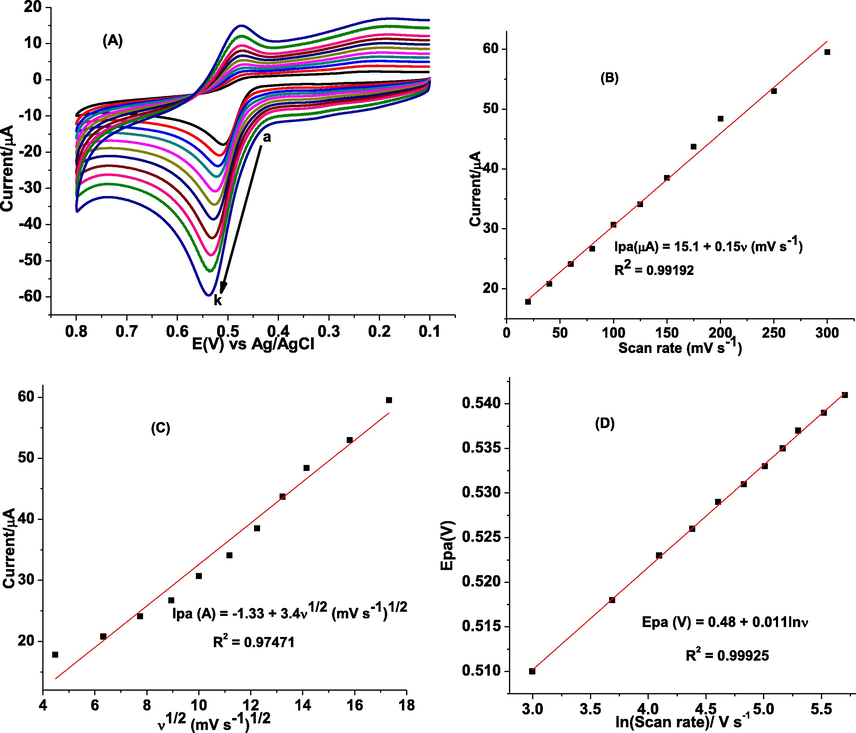
(A) CVs of poly(DPASA)/GCE in pH 2.0 PBS containing 1.0 mM GA at various scan rates (a–k: 20, 40, 60, 80, 100, 125, 150, 175, 200, 250, and 300 mV s– 1 respectively), (B) plot of Ip vs ν, (C) plot of Ip vs ν1/2, and (D) plot of log Ep vs lnν.
The number of electrons involved during oxidation of GA at the poly(DPASA)/GCE was determined from cyclic voltammetry data. (Fig. 7A). For an irreversible process, the value of αn was determined by the difference between the peak potential (Ep) and the half-wave potential (Ep1/2), employing eq. (3) (Bard and Faulkner, 2001).
Where α is the charge transfer coefficient and n is the number of electrons transferred.
Taking Ep and Ep1/2 for the cyclic voltammogram at scan rate of 100 mV s−1 (Fig. 7A) to be 524 and 478 mV respectively, the value of αn was calculated as 1.043. Considering α for irreversible electrode process to be 0.50 (Laviron, 1979), the number of electrons (n) transferred in the electro-oxidation of GA at the surface of poly(DPASA)/GCE was estimated 2.086 (∼2.0) which is in agreement with reported literatures (Tashkhourian and Nami-Ana, 2015; Luo et al., 2013; Liang et al., 2016).
The relationship between Ep and lnν for an irreversible process is governed by eq. (4) (Bard and Faulkner, 2001).
Where Ep is the peak potential, Eo is the formal potential, α is the electron transfer coefficient, K0 (s−1) is the electrochemical rate constant, and the other parameters with their usual meanings.
Plot of Ep against lnν for CVs of GA at various scan rates (Fig. 7A) gives a regression equation of Ep (V) = 0.48 + 0.011lnν (Fig. 7D) with a slope of 0.011. From the slope value of 0.011 (slope = RT/[2(1- α)nF] = 0.011) for the fitted line, the value of n(1–α) at the experimental temperature of 25 0C calculated using eq. (4) was 1.10. Considering the two electrons for oxidation of GA calculated using eq. (3), the electron transfer coefficient (α) was estimated to be 0.45, which is close to the ideal 0.50 for an irreversible system.
3.3 Adsorptive stripping square wave voltammetric investigation of GA
Adsorptive stripping square wave voltammetric (AdSSWV) method, which is effective and rapid electroanalytical technique due to its ability to discriminate against back ground currents, good sensitivity and low detection limits(Abdel-Hamid and Newair, 2013), was selected for the quantitative determination of GA in honey and peanut samples. Fig. 8 presents AdSSWV of 1.0 mM GA in pH 2.0 PBS at bare GCE and poly(DPASA)/GCE. In contrast to the oxidative peak at the bare GCE (curve a of inset), appearance of a well-shaped oxidative peak with much improved current at a reduced potential at the poly(DPASA)/GCE (curve b of inset) demonstrated the catalytic role of the poly (DPASA)/GCE film towards the oxidation of GA.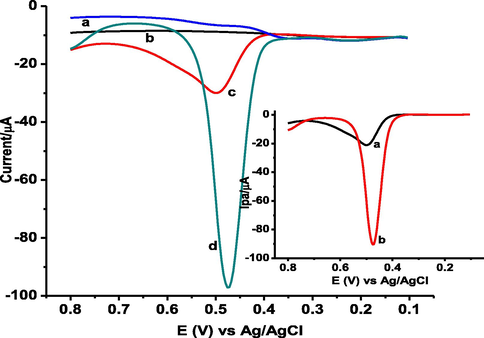
AdSSWVs of unmodified GCE (a & c) and poly(DPASA)/GCE (b & d) in pH 2.0 PBS containing no GA (a & b) and 1.0 mM GA (c & d) at accumulation time: 10 s, accumulation potential: 0.3 V, step potential: 4 mV, amplitude: 25 mV, and frequency: 15 Hz, Inset: background corrected ASSWVs of a) bare GCE b) poly(DPASA) /GCE.
3.3.1 Influence of accumulation potential and time
Since the electrochemical oxidation of GA at poly(DPASA)/GCE is governed predominantly by adsorption controlled process, the effects of accumulation time and accumulation potential on the magnitude of the peak current were investigated.
The effect of accumulation time (tacc) on anodic peak current of GA at poly(DPASA)/GCE was studied in the ranges from 0 to 40 s and the results are illustrated in Fig. SM1A. The peak current increased rapidly with increasing tacc in the range between 0 and 10 s due to the rapid adsorption of more GA at the surface of the modified electrode. Beyond 10 s, the peak current remained almost unchanged when the tacc was further increased due to surface saturation of the electrode. Thus, 10 s was thus selected as optimal accumulation time for subsequent experiments.
On the other hand, the effect of accumulation potential (Eacc) on the oxidation peak current of 1.0 mM GA in pH 2.0 PBS at poly(DPASA)/GCE was also investigated over the range 0.2 to 0.7 V (Fig. SM1B). A maximum peak current was observed at 0.3 V and then it decreased with increasing potential. Therefore, 0.3 V was taken as the optimal accumulation potential for further studies.
3.3.2 Optimization of AdSSWV parameters
For electrochemical determination of GA, AdSSWV parameters such as square wave frequency, amplitude, and step potential were optimized to investigate the effect of each parameter on the oxidative peak current of GA at poly(DPASA)/GCE keeping the remaining constant.
The effect of square wave voltammetric parameters such as step potential, pulse amplitude and frequency on the peak current response of poly(DPASA)/GCE for 1.0 mM GA in pH 2.0 PBS was investigated (Fig.SM2A-C). Fig SM2 (A-C) illustrates AdSSWVs of poly(DPASA)/GCE in pH 2.0 PBS containing 1.0 mM GA at various step potentials, amplitudes and frequencies, respectively. Although the oxidative peak current was increased with increasing all AdSSWV parameters, it is necessary to optimize these parameters by compromising the peak current enhancement with the accompanied peak broadening. Hence, taking both the peak current enhancement and peak shape broadening into consideration, 4 mV, 30 mV and 20 Hz were selected as the optimum square wave amplitude, step potential and frequency respectively.
3.3.3 Calibration curve and method detection limit
Under the optimal experimental conditions and method parameters, the dependence of oxidative peak current on the concentration of GA and inherited sensitivity of the method was investigated. Fig. 9 shows back ground corrected AdSSWVs of various concentrations of GA in pH 2.0 PBS at poly(DPASA)/GCE. The oxidation peak currents were linearly related with the concentration of GA ranged from 0.500 to 300 µM with RSD% below 3.5 (for n = 3) (inset of Fig. 9). The limit of detection (LOD = 3 s/m) and limit of quantification (LOQ = 10 s/m) for n = 7 were calculated to be 4.35 × 10⁻⁹, and 1.45 × 10⁻⁸ M, respectively.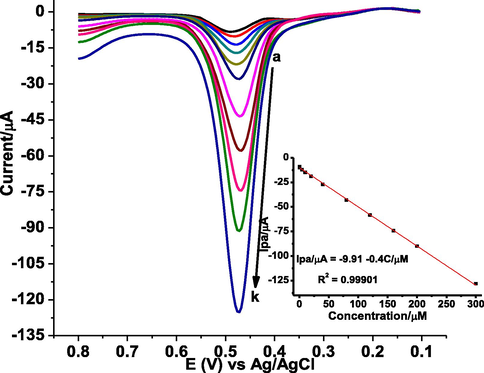
Back ground corrected AdSSWVs of poly(DPASA)/GCE in pH 2.0 PBS for different concentrations of GA (a–k: 0.5, 1.0, 5.0, 10.0, 20.0, 40.0, 80.0, 120.0, 160.0, 200.0, and 300.0 μM, respectively) at accumulation time: 10 s, accumulation potential: 0.3 V, step potential: 4 mV, amplitude: 30 mV, and frequency: 20 Hz. Inset: plot of oxidative peak current (mean±%RSD as error bar) vs concentration of GA.
3.3.4 AdSSWV determination of GA in honey and peanut samples
The applicability of poly(DPASA)/GCE for the determination of GA was tested by applying it to determine the GA content in real samples.
3.3.4.1 Honey samples
In this study, three honey samples taken from three different local honey producing areas were prepared to determine GA content following the procedure under the experimental part. Fig. 10 presents the AdSSWVs of poly(DPASA)/GCE in pH 2.0 PBS containing three honey samples collected from three different kebeles local areas of Gazo Wereda namely kebele 01, kebele 09, and kebele 14, North Wollo Zone, Ethiopia. The detected GA contents in the honey samples as calculated from the calibration regression equation are summarized in Table 2. The results showed that poly(DPASA)/GCE exhibited anodic peaks in the three honey samples. This suggested that poly(DPASA)/GCE detected GA in honey samples.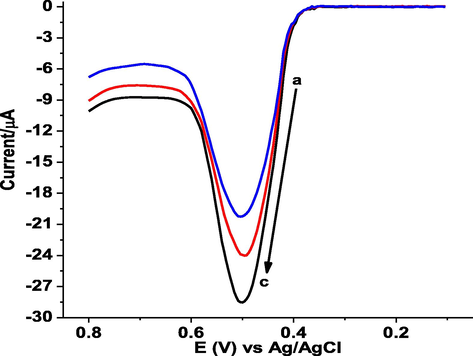
Background subtracted AdSSWVs of poly(DPASA)/GCE in pH 2.0 PBS containing honey samples collected from three local areas of Gazo Wereda (a-c: kebele 14, kebele 09, and kebele 01 respectively), North Wollo Zone, Ethiopia.
3.3.4.2 Peanut samples
The Applicability of the prepared modified electrode was also tested by determination of the content of GA in commercially available raw peanut samples and locally available processed peanut butter samples. Commercially available raw peanut samples (both the inside body and cover) and locally available processed commercial peanut butter sample solutions were also prepared as described under the experimental section. Fig SM 3 (A-D) presents AdSSWVs of poly(DPASA)/GCE in pH 2.0 PBS containing inside body of raw peanut, cover of raw peanut samples, AAF and Berejat brand locally available processed peanut butter samples, respectively. The detected GA content for each samples were calculated using the linear regression equation and the GA content of the peanut samples is summarized in Table 3. The results showed that the electrochemical sensor based on poly(DPASA)/GCE can be used successfully applied to give a good estimate of the GA content in foods.
Peanut sample
Current response (µA)
Detected GA in
Peanut sample (µM)a
Peanut sample
(mg/5g)
Inside body of raw peanut
14.60
11.73 ± 0.033
110.35
Cover of raw peanut
19.20
23.20 ± 0.029
218.20
Commercial butter (AAF)
12.50
6.50 ± 0.018
61.15
Commercial butter (Berejat) Detected mean GA ± RSD at)
12.08
5.43 ± 0.020
51.075
3.4 Validation of the developed method
Recovery of spiked standards, interference studies, and stability were used to validate the applicability of the developed method for determination of GA in real samples including honey and peanut samples.
3.4.1 Recovery study
3.4.1.1 Honey sample
The recovery study was carried out by spiking the analyzed honey sample solution with standard GA solutions of 60.0and 100.0 μM. The addition of standard GA to the honey samples caused an increase in peak current, which indicates that the peak observed was due to the oxidation of GA (Fig. 11). Fig. 11 shows the AdSSWVs of honey samples spiked with various concentrations of standard GA. The obtained very good recovery results in the range of 94.62 to 99.63% (Table 4) confirmed the applicability of the developed method for determination of GA in honey samples. aDetected mean GA ± RSD, b% Recovery GA ± %RSD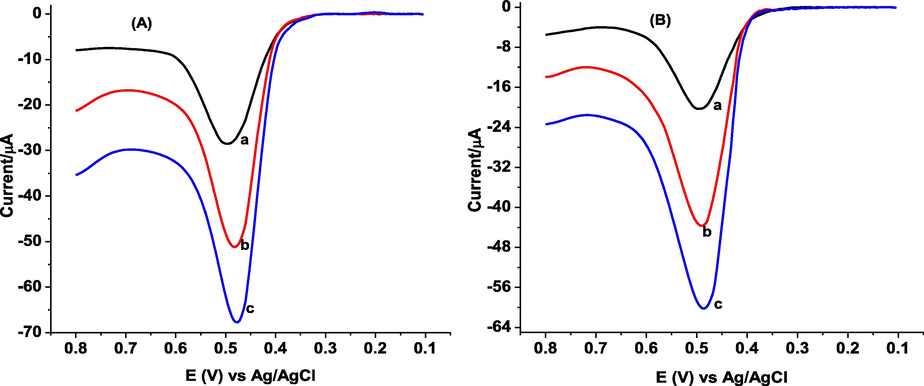
Background subtracted AdSSWVs of poly(DPASA)/GCE in pH 2.0 PBS containing (A) kebele 01, and (B) kebele 14 honey samples from Gazo Wereda, North wollo zone, Ethiopia spiked with various concentrations of standard GA (a-c: 0.0, 60.0, and 100.0 µM, respectively).
Honey sample
Initial GA content/ (µM)
Spiked GA (µM)
Detected GA (µM)a
Recovery (%)b
Kebele 01
46.73
–
46.73 ± 0.033
–
46.73
60.00
103.50 ± 0.023
94.62 ± 2.3
46.73
100.00
144.23 ± 0.022
97.50 ± 2.2
Kebele 14
26.10
–
26.10 ± 0.018
–
26.10
60.00
83.98 ± 0.028
96.47 ± 1.6
26.10
100.00
125.73 ± 0.023
99.63 ± 2.2
3.4.1.2 Peanut sample
Recovery of GA in spiked peanut sample was carried out by spiking the peanut sample analyzed under section 3.3.4.2 with 60.0 and 100.0 µM GA standard solutions (Fig. 12). Fig. 12 (A-D) presents AdSSWVs of poly(DPASA)/GCE in pH 2.0 PBS containing inside body of raw peanut sample, cover of raw peanut, AAF brand and Berejat brand commercial processed peanut butter samples spiked with different concentrations of standard GA, reactively. Percent spike recovery of GA in peanut in different parts: inside body of raw peanut, cover of raw peanut and commercial peanut butter of 95.00–99.77%, 97.87–99.80% and 97.25–103.20 respectively (Table SM1) with %RSD value below 3.4% confirming applicability of the method for determination of GA in peanut sample.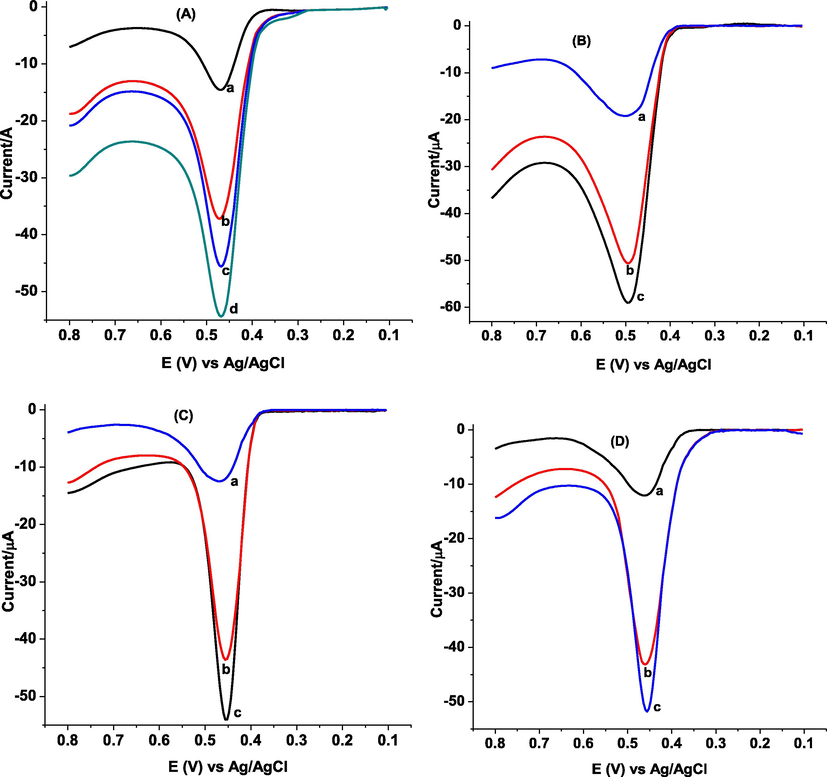
Background subtracted AdSSWVs of poly(DPASA)/GCE in pH 2.0 PBS containing (A) inside body of raw peanut sample spiked with different concentrations of standard GA (a-d: 0.0, 60.0, 80.0, and 100.0, respectively) (B) cover of raw peanut spiked with various standard GA concentrations (a-c: 0.0, 80.0, 100.0, respectively), (C) AAF brand and (D) Berejat brand commercial processed peanut butter samples spiked with various concentrations of standard GA (a-c: 0.0, 80.0, 100.0, respectively).
3.4.2 Interference study
3.4.2.1 Peanut samples
The selectivity of the method for GA determination in peanut samples was studied using AdSSWV measurements in the presence of selected potential interferents, ascorbic acid (AA) and uric acid (UA). The effect of the presence of various concentrations of each selected potential interferent (0–20 µM) on the signal for peanut samples was investigated (Fig. SM 4). The results in Table 5 showed relative standard deviation values of less than 5%, suggesting these selected interferents did not interfere with the determination of GA. Hence, detection of GA with as associated error less than 4.11% in the presence of AA and UA validated the selectivity and accuracy of the developed method (Table 5).
Interferent
Interferent added (µM)
Current response (µA)
Expected current (µA)
% error
AA0.0
14.60
14.60
–
5.0
14.20
14.60
2.74
10.0
14.40
14.60
1.37
15.0
14.70
14.60
0.68
20.0
15.20
14.60
4.11
UA
0.0
14.60
14.60
–
5.0
14.10
14.60
3.55
10.0
14.30
14.60
2.98
15.0
14.60
14.60
0.00
20.0
15.00
14.60
2.74
3.4.2.2 Honey sample
To further evaluate the selectivity of the method for GA determination in honey samples, the influence of selected potential interferents, AA and UA which may coexist with GA in real samples was also examined under the optimum conditions. The selectivity of the method was studied by comparing the response for honey samples in the absence of each selected potential interferent with the response recorded in the presence of selected interferents 0–40 µM (Fig. SM 5). As shown in Table SM 2about two folds of excess concentrations of AA and UA were shown no interference on the response current of GA (signal change below 2.18%), indicating that poly(DPASA)/GCE possessed excellent selectivity towards GA.
3.4.3 Stability studies
The repeatability of using poly(DPASA)/GCE for the electrochemical determination of GA was studied using AdSSWV measurements. This was carried out by taking of 1.0 mM GA in pH 2.0 PBS using poly(DPASA)/GCE with an error of only 1.96% and 2.2% (RSD) for five successive AdSSWV measurements recorded at an interval of two hrs in a day (Fig. SM 6A) and in fifteen days recorded at an interval of three days (Fig. SM 6B) showed repeatability of the method and hence the reproducibility of the results.
3.5 Comparison of the present method with previously reported methods
The performance of the developed method in this work was compared with previously reported methods for determination of GA. Here, the linear range and detection limit for GA at the poly (DPASA)/GCE were compared with previously reported electrodes (Table 6). The present method, which has simple modification process and not time consuming, showed the least detection limits with wider linear dynamic range than the other reported values. Therefore, the present method using this modifier showed better performance compared with the other reported methods.
Substrate
Modifier
Method
Dynamic range (µM)
LOD (µM)
Ref.
CPE
CoO-NPs
DPV
100–1000
1.52
(Chikere et al., 2021)
CPE
ZnO-NPs
DPV
1.0–50
0.186
(Chikere et al., 2019)
CPE
ZrO2-NPs
DPV
1.0–1000
0.124
(Chikere et al., 2020)
CPE
SiO2-NPs
DPV
0.8–100
0.25
(Tashkhourian and Nami-Ana, 2015)
GCE
Poly(epinephrine)
SWV
1.0–20.0
0.663
(Abdel-Hamid and Newair, 2013)
GCE
PEI-rGO
LSV
0.587–58.7
0.411
(Luo et al., 2013)
GCE
AuCMs/SF-GR
DPV
0.05–8.0
0.0107
(Liang et al., 2016)
GCE
Poly(DPASA)
AdSSWV
0.5–300
0.00435
This work
4 Conclusions
Poly(diphenyl amine sulfonic acid) modified glassy carbon electrode was successfully prepared and used as a sensor based on poly(DPASA)/GCE in PBS for characterization and quantification of GA using cyclic voltammetry and adsorptive anodic stripping square wave voltammetry techniques, respectively. In contrast to the bare GCE, the poly(DPASA)/GCE possessed pronounced catalytic property towards an oxidation of GA in PBS which might be due to the increased electrode effective surface area and electrical conductivity of the electrode surface. AdSSWV method based on poly(DPASA)/GCE was used for determination of GA in honey and peanut samples. The poly(DPASA)/GCE also showed remarkable electrochemical advantages such as low detection limit, high repeatability and wide linear range. Hence, high recovery results ranged from 94.62 to 99.63, 95.00 to 99.80, and 97.25 to 103.20% of gallic acid in honey, raw peanut, and commercial peanut butter samples respectively as well as high recovery results even in the presence of a potential interferents and hence its selectivity, low percent relative standard deviation values demonstrating its validated applicability of the developed method for determination of GA in honey and peanut samples. This result indicates that poly (DPASA)/GCE has good reliability for detecting GA in honey and peanut samples.
Funding
This research received no direct funding from funding agencies.
Declaration of Competing Interest
The authors declare that they have no known competing financial interests or personal relationships that could have appeared to influence the work reported in this paper.
References
- Adsorptive stripping voltammetric determination of gallic acid using an electrochemical sensor based on polyepinephrine/glassy carbon electrode and its determination in black tea sample. J. Electroanal. Chem.. 2013;704:32-37.
- [CrossRef] [Google Scholar]
- Antioxidant activities, polyphenol, flavonoid, and amino acid contents in peanut shell. J. Saudi Soc. Agric. Sci.. 2019;18(4):437-442.
- [CrossRef] [Google Scholar]
- Application of FTIR-ATR spectroscopy to the quantification of sugar in honey. Food Chem.. 2015;169:218-223.
- [CrossRef] [Google Scholar]
- Electrochemical strategies for gallic acid detection: Potential for application in clinical, food or environmental analyses. Sci. Total Environ.. 2019;672:129-140.
- [CrossRef] [Google Scholar]
- Electrochemical methods: Fundamentals and applications (second ed.). New York: John Wiley & Sons, Inc.; 2001.
- Evaluation of the phenolic content, antioxidant activity and colour of Slovenian honey. Food Chem.. 2007;105:822-828.
- [CrossRef] [Google Scholar]
- Humidity sensitive properties of electronically conductive poly (diphenylamine sulfonic acid) and its block copolymer and blends. Int. J. Electrochem. Sci.. 2013;8:3265-3278.
- [Google Scholar]
- Phenolic acids and flavonoids profiles of commercial honey from different floral sources and geographic sources. Int. J. Food Prop.. 2019;22:290-308.
- [CrossRef] [Google Scholar]
- Interaction between amorphous zirconia nanoparticles and graphite: Electrochemical applications for gallic acid sensing using carbon paste electrodes in wine. Nanomaterials. 2020;10:537.
- [CrossRef] [Google Scholar]
- Zinc oxide nanoparticles modified-carbon paste electrode used for the electrochemical determination of Gallic acid. J. Phys. Conf. Ser.. 2019;1310:012008
- [CrossRef] [Google Scholar]
- Electroanalytical determination of gallic acid in red and white wine samples using cobalt oxide nanoparticles-modified carbon-paste electrodes. Microchem. J.. 2021;160:105668
- [CrossRef] [Google Scholar]
- Phenolic compounds in honey and their associated health benefits: A review. Molecules. 2018;23(9):2322.
- [CrossRef] [Google Scholar]
- Recent advances in the analysis of phenolic compounds in unifloral honeys. Molecules. 2016;21(4):451.
- [CrossRef] [Google Scholar]
- Electroanalysis and laccase-based biosensor on the determination of phenolic content and antioxidant power of honey samples. Food Chem.. 2017;237:1118-1123.
- [CrossRef] [Google Scholar]
- Nutritional value and antioxidant activity of honeys produced in a European Atlantic area. Food Chem.. 2013;138:851-856.
- [CrossRef] [Google Scholar]
- Antioxidant and antimicrobial effects of phenolic compounds extracts of Northeast Portugal honey. Food Chem. Toxicol.. 2008;46:3774-3779.
- [CrossRef] [Google Scholar]
- Electrochemical synthesis, characterisation and comparative study of new conducting polymers from amino-substituted naphthalene sulfonic acids. J. Solid State Electrochem.. 2016;20(11):2969-2979.
- [Google Scholar]
- Development of an electrochemical nanosensor for the determination of gallic acid in food. Anal. Methods. 2016;8:1103-1110.
- [CrossRef] [Google Scholar]
- Gold nanoparticles impregnated mesoporous silica spheres for simultaneous and selective determination of uric acid and ascorbic acid. Sens. Actuators, B. 2015;219:139-145.
- [Google Scholar]
- Antioxidant activity and phenolic profile of selected organic and conventional honeys from Poland. Antioxidants. 2020;9(1):44.
- [CrossRef] [Google Scholar]
- Use of boron-doped diamond electrode pre-treated cathodically for the determination of trace metals in honey by differential pulse voltammetry. Food Control. 2014;36:42-48.
- [CrossRef] [Google Scholar]
- General expression of the linear potential sweep voltammogram in the case of diffusionless electrochemical systems. J. Electroanal. Chem. Interfacial Electrochem.. 1979;101:19-28.
- [CrossRef] [Google Scholar]
- A simple, ultrasensitive sensor for gallic acid and uric acid based on gold microclusters/sulfonate functionalized graphene modified glassy carbon electrode. Sens. Actuators, B. 2016;224:915-925.
- [Google Scholar]
- Antioxidant activity, total phenolic, and resveratrol content in five cultivars of peanut sprouts. Asian Pacific J. Trop. Biomed.. 2017;7(4):332-338.
- [CrossRef] [Google Scholar]
- Voltammetric determination of gallic acid with a glassy carbon electrode modified with reduced graphene oxide. Int. J. Electrochem. Sci. 2020;15:7214-7227.
- [CrossRef] [Google Scholar]
- Sensitive detection of gallic acid based on polyethyleneimine-functionalized graphene modified glassy carbon electrode. Sens. Actuators, B. 2013;186:84-89.
- [Google Scholar]
- Flow injection chemiluminescence determination of the total phenolics levels in plant-derived beverages using soluble manganese (IV) Anal. Chim. Acta. 2010;668:19-25.
- [CrossRef] [Google Scholar]
- Antioxidant activity, total phenolic content, individual phenolics and physicochemical parameters suitability for Romanian honey authentication. Foods. 2020;9:306.
- [CrossRef] [Google Scholar]
- Determination of phenolic composition and antioxidant capacity of native red wines by high performance liquid chromatography and spectrophotometric methods. Food Res. Int.. 2012;45:145-154.
- [CrossRef] [Google Scholar]
- Application of a newly developed and validated high-performance thin-layer chromatographic method to control honey adulteration. J. Chromatogr. A. 2013;1272:132-135.
- [CrossRef] [Google Scholar]
- Use of hollow fibre-based liquid–liquid–liquid microextraction and high-performance liquid chromatography–diode array detection for the determination of phenolic acids in fruit juices. Food Chem.. 2010;123:1310-1317.
- [CrossRef] [Google Scholar]
- Determination of polyphenols content and antioxidant activity of some red wines by differential pulse voltammetry, HPLC and spectrophotometric methods. Food Chem.. 2011;124:1208-1216.
- [CrossRef] [Google Scholar]
- A sensitive electrochemical sensor for determination of gallic acid based on SiO2 nanoparticle modified carbon paste electrode. Mater. Sci. Eng., C. 2015;52:103-110.
- [CrossRef] [Google Scholar]
- Electrochemical sensors based on conducting polymers for the aqueous detection of biologically relevant molecules. Nanomaterials. 2021;11(1):252.
- [CrossRef] [Google Scholar]
- Flow injection chemiluminescent detection of gallic acid in olive fruits. Food Chem.. 2007;105:340-345.
- [CrossRef] [Google Scholar]
- Determination of total phenolic content and antioxidant capacity of blueberries using Fourier transformed infrared (FT-IR) spectroscopy and Raman spectroscopy. J. Food Meas. Charact.. 2017;11:1909-1918.
- [CrossRef] [Google Scholar]
- Hybrid Composites of Poly (diphenylamine sulfonic acid) and nano-Alumina for Impedimetric Humidity Sensors. Int. J. Electrochem. Sci.. 2017;12:2272-2284.
- [CrossRef] [Google Scholar]
Appendix A
Supplementary data
Supplementary data to this article can be found online at https://doi.org/10.1016/j.arabjc.2022.103853.
Appendix A
Supplementary data
The following are the Supplementary data to this article:Supplementary data 1
Supplementary data 1


