

Translate this page into:
Mn, B, N co-doped graphene quantum dots for fluorescence sensing and biological imaging
⁎Corresponding authors. wangyanxin@qdu.edu.cn (Yanxin Wang), peymans@ece.ubc.ca (Peyman Servati), huanglinjun@qdu.edu.cn (Linjun Huang), tang@qdu.edu.cn (Jianguo Tang)
-
Received: ,
Accepted: ,
This article was originally published by Elsevier and was migrated to Scientific Scholar after the change of Publisher.
Abstract
The fluorescent and quantum yield (QY) of graphene quantum dots has been improved in recent years by doped atoms, which have good application prospects in fluorescence sensors and biological imaging. Here, a one-step hydrothermal synthesis method was used to synthesize manganese ions bonded with boron and nitrogen-doped graphene quantum dots (Mn-BN-GQDs). Compared with the boron and nitrogen co-doping graphene quantum dots (BN-GQDs), the fluorescence properties and quantum yield of Mn-BN-GQDs are significantly improved. Meanwhile, Mn-BN-GQDs exhibit low toxicity and good fluorescence imaging in living cells and has high selectivity to Fe3+ ions. Therefore, this experiment design Mn-BN-GQDs as a fluorescence sensor to detect Fe3+ ions, providing strong evidence for the advanced high sensitivity, selectivity and wide detection range of the Mn-BN-GQDs as a fluorescence sensor. These results indicate a dual linear relationship with good linear relationships in the 10–100 μM and 100–800 μM ranges, and limit of detection are 0.78 μM and 9.08 μM, respectively. Cellular imaging results demonstrate that Mn-BN-GQDs can be used as fluorescence sensors in biological imaging. Mn-BN-GQDs can be used for fluorescence sensing in biological imaging in combination with low toxicity, QY and quantum dot lifetime.
Keywords
Graphene quantum dots
Fluorescence sensors
Biological imaging
High selectivity

1 Introduction
Fe (III) ions is one of the indispensable trace elements in our living organisms. They are found primarily in the hemoglobin of human blood, responsible for the transport of oxygen and the removal of carbon dioxide (Shi et al., 2016, Xuan et al., 2017). However, either iron deficiency or iron overload causes disease, such as anemia, liver damage, diabetes, Parkinson's disease, etc. (Han et al., 2016, Li et al., 2018a, 2018b). Fe ion concentration in blood was detected and monitored by numerous feasible methods, including voltammetry, inductively coupled plasma mass spectrometry (ICP-MS), graphene oxide probe, gold nanoparticle probe, etc. (Zhu et al., 2017, Pincher et al., 2019, Wang et al., 2020). Nevertheless, such methods are severely limited in their practical applications because of their complex synthesis steps, complex structure, and toxicity. Fluorescence techniques, with their unique high-sensitivity features, ease of operation, convenience of monitoring and fast response, provide a better choice for detecting Fe3+ (Han et al., 2016, Masthoff et al., 2019).
Graphene quantum dots (GQDs), a type of promising carbon-based luminescent material, have become increasingly widely used in fluorescence sensors. The zero-dimensional nanometer material has good chemical inertness, biocompatibility, stable photoluminescence properties, low cytotoxicity and good water solution dispersion (Jia et al., 2020, Kaewprom et al., 2020, Xu et al., 2020, Zhang et al., 2021). So, GQDs are widely used in biological imaging, photocatalysis, ion detection, electrochemical sensing and other aspects, and as a fluorescence sensor to detect various substances (Yang et al., 2014, Li et al., 2018a, 2018b, Kadian and Manik 2020, Xu et al., 2020, Chen et al., 2021, Wang and Lu 2022). However, the low quantum yield and nonspecificity of GQDs limit the mass production and application of GQDs as fluorescence sensors. Previous work has demonstrated that doping nonmetallic atoms in GQDs can effectively modify specific binding, chemical activity, electronic structure and quantum yield, thereby leading to better photoluminescence properties of GQDs (Yang et al., 2017, Ru et al., 2020, Ai et al., 2021, Li et al., 2021a, 2021b). Apart from doping with non-metallic elements, doping of metallic elements has also been a concern (Hasan et al., 2020, Nair et al., 2020, Trung Viet et al., 2021).
Due to the relatively large surface volume of quantum dots, surface defects have a great influence on the optoelectronic properties of quantum dots. Doping transition metal ions can improve the photoluminescence quantum yield of quantum dots. Mn as a doping source is considered as a good prototype to study doping effects (Li et al., 2021a, 2021b). Mn can create impurity energy levels in the gaps between quantum dots and provide a new route for the recombination of photogenerated electrons, thereby reducing surface state-mediated exciton radiative recombination. This can greatly improve the optical performance and quantum yield of GQDs (Pradhan and Peng 2007, Deng et al., 2011). Wang et al. (Wang et al., 2018) prepared four kinds of Mn doped carbon quantum dots with different wavelengths, and confirmed that quantum yield was significantly improved after Mn doping. Ji et al. (Ji et al., 2018) synthesized Mn-CDs, The synthesized Mn-CDs has a very small size and has been used for magnetic resonance/optical dual-mode imaging of tiny gliomas.
In this work, we proposed a new method for the synthesis of Mn-BN-GQDs based fluorescence sensors by a simple and efficient one-step hydrothermal reaction. With high sensitivity, high selectivity and wide detection range for Fe3+, the Mn-BN-GQDs showed excellent accuracy and efficiency in detection of Fe3+ ions at 0.1–800 μM. The linear relationship is good in the range of 10–100 μM and 100–800 μM, with a wide-range detection limit from 0.78 μM to 9.08 μM. The as-prepared Mn-B and N-GQDs also showed low cytotoxicity and clear imaging in the cells, which indicated Mn-BN-GQDs can be used in fluorescence sensors and biological imaging applications.
2 Experimental section
Material: Urea (AR) was purchased from Hu Shi Chemical Plant (Shanghai, China). Citric acid (AR, ≥99.5 % MW = 192.12) and Sodium tetraborate (anhydrous, ≥99 % MW = 201.22) were purchased from China National Medicines Group (Beijing, China), Metal cationic aqueous solution of Mn2+, K+, Co2+, Ni+, Fe3+, Ca2+, Al3+, Zn2+, Cu2+, Cd2+, Eu2+, Tb2+, Fe2+, Li+, Mg2+ were prepared from MnCl2·4H2O (AR, 99.0%, MW = 197.91), KCl, CoCl2·6H2O, NiCl2·6H2O, FeCl3·6H2O, CaCl2, Al(NO3)3·9H2O, Zn(NO3)2·6H2O, CuCl2·2H2O, CdCl2, EuCl2, TbCl2, FeCl2·4H2O, LiCl, MgCl2·6H2O respectively. All reagents are analytical grade without further purification, and all aqueous solutions are prepared from ultrapure water.
Preparation of BN-GQDs and Mn-BN-GQDs: Mn-BN-GQDs were prepared as follows: citric acid (1 g), urea (0.12 g), sodium tetraborate (borax) (0.0662 g) and 0.08 mol (The fluorescence intensity of different concentrations of manganese chloride tetrahydrate is shown in Figure S1) of manganese chloride tetrahydrate were dissolved in distilled water and treated with ultrasound for 10 min to make the solution into a clear aqueous solution. The resulting solution was then transferred to a 25 mL Teflon-lined autoclave and heated at 180 °C for 8 h. Then, the autoclave was naturally cooled to room temperature, and the resulting pale yellow clarification solution was centrifuged at 10,000 rpm for 12 min before the precipitation was removed. Then, the obtained liquid was dialyzed in a dialysis bag for 48 h (molecular weight cut off, 3500 Da), and finally, after freeze-drying treatment, the brown-yellow solid powder was obtained for subsequent characterization analysis and application. BN-GQDs were synthesized using the same procedure without the addition of manganese chloride tetrahydrate.
Characterization: Fluorescence spectra, lifetime and quantum yield were recorded on the Edinburgh FLS1000 steady-state transient fluorescence spectrometer (Edinburgh Inc., Livingston, UK) with nanosecond pulse lamp as the excitation. Transmission electron microscopy (TEM) images were carried out using a JEM-1200EX transmission electron microscope (JEOL Ltd, Japan). The X-ray diffraction (XRD) of the sample with the crystal structure was characterized by X-ray diffractometer (Rigaku, Japan). High-resolution transmission electron microscopy (HRTEM) was performed using an FEI Talos F200i microscope (Thermo Fisher Scientific Inc., Waltham, MA, USA) operating at 20 kV. Fourier-transform infrared spectroscopy (FTIR, MAGNA-IR5700, Nicolet, Inc., Palo Alto, CA, USA) from 4,500 cm−1 to 500 cm−1 was used to analyze functional groups in the samples. X-ray photoelectron spectroscopy (XPS) was performed by using a VGESCA scientific theta probe spectrometer in constant analyzer energy mode with a pass energy of 28 eV and AlKα (1486.6 eV) radiation as the excitation source. Ultraviolet and visible absorption spectra (UV-Vis) were recorded on a UV-3200 spectrometer (Mapada, China), Confocal laser-scanning microscopy (CLSM Olympus, Model: FV1200).
Fluorescence detection of Fe3+ ions: In a typical experiment, 200 μL of Fe3+ of various concentrations and 200 μL of Mn-BN-GQDs solutions were mixed, and then the solution was mixed into 5 mL of distilled water (pH = 7). After being stored at room temperature for 10 min, the fluorescence spectra were measured at 345 nm.
Cellular toxicity test: The cytotoxicity of Mn-BN-GQDs was detected by MTT assay. HeLa cells, purchased from Shanghai Saibaekang Biology. They were divided into Sample 1 and Sample 2 group. The Sample 1 was added 100 μL into each well complete medium. Add 100 μL into each well Mn-BN-GQDs diluent (20 μg/mL, 40 μg/mL, 60 μg/mL, 80 μg/mL, 100 μg/mL, 200 μg/mL) to Sample group 2, respectively. Three duplicate wells were set for each concentration. HeLa cells in logarithmic growth phase were taken, counted, cell concentration was adjusted, and inoculated into 96-well plates according to 4 × 10⁴ cells in each well, incubated overnight in 5% CO2 and 37 °C constant temperature incubator. According to the group treatment above, the culture was conducted for 24 h and remove the medium. Next, the wells were washed three times with PBS, and 100 μL culture medium containing 0.5 mg/mL MTT was added to each well, and 5% CO2 was added to the culture box at 37 °C for 4 h. Add 100 μL DMSO to each well and discard supernatant. The absorbance at 570 nm was measured after shaking gently for 10 min.
Live cell imaging: HeLa cells, purchased from Shanghai Saibaekang Biology. The preparation was made according to the ratio of MEM medium to fetal bovine serum 9:1. 0.0297 g of solid powder was taken and sterilized under UV irradiation for 30 min, then 1.485 mL of PBS was added and dissolved by ultrasound to prepare 10 mg/mL of sample original solution for use. HeLa cells in logarithmic growth phase were taken, cell count was carried out, cell concentration was adjusted, 4 × 10⁴ cells in each well were seeded into confocal petri dish, then cultured in 5% CO2, 37 °C constant temperature incubator for 3 h, and then the results were observed by laser confocal microscope and photographed.
3 Results and discussion
3.1 Characterization analysis of Mn-BN-GQDs
The synthesis strategy of Mn-BN-GQDs is shown in Fig. 1a (The molecular structural formulas of citric acid, urea, borax, BN-GQDs and Mn-BN-GQDs are shown in Figure S2). Three synthetic materials and MnCl2 are dissolved in distilled water and then the obtained solution is transferred to Teflon-lined autoclave and heated at 180 °C for 8 h to obtain a kind of GQDs with photoluminescence properties. On the basis of this, the transparent electronic microscopy (TEM) was used to display the morphology and microscopic size of the synthesized doped GQDs. Compared with the TEM images of BN-GQDs in Fig. 1b, it can be illustrated from Fig. 1c that the synthesized Mn-BN-GQDs have better dispersion and more uniform particle size. By randomly sampling the sizes of 150 particles, the corresponding size square distribution map was obtained, as shown in Figure S3, through square distribution mathematical calculation, the particle size distribution of Mn-BN-GQDs is within the range of 1.5 ∼ 6.5 nm., with an average size of 3.7 nm. It is obvious that the doping of Mn2+ ions effectively change size of distribution of BN-GQDs. According to HRTEM image, as shown in Fig. 1 d and e, it can be seen that the synthesized BN-GQDs and Mn-BN-GQDs have clear lattice fringes, indicating that they have high crystallinity. Their lattice spacing is 0.232 nm and 0.272 nm respectively corresponding to the (1 0 0) and (0 2 0) planes of GQDs (Li et al., 2012, Ju and Chen 2014) this indicates that they have a good crystal structure, which can also be investigated by XRD pattern.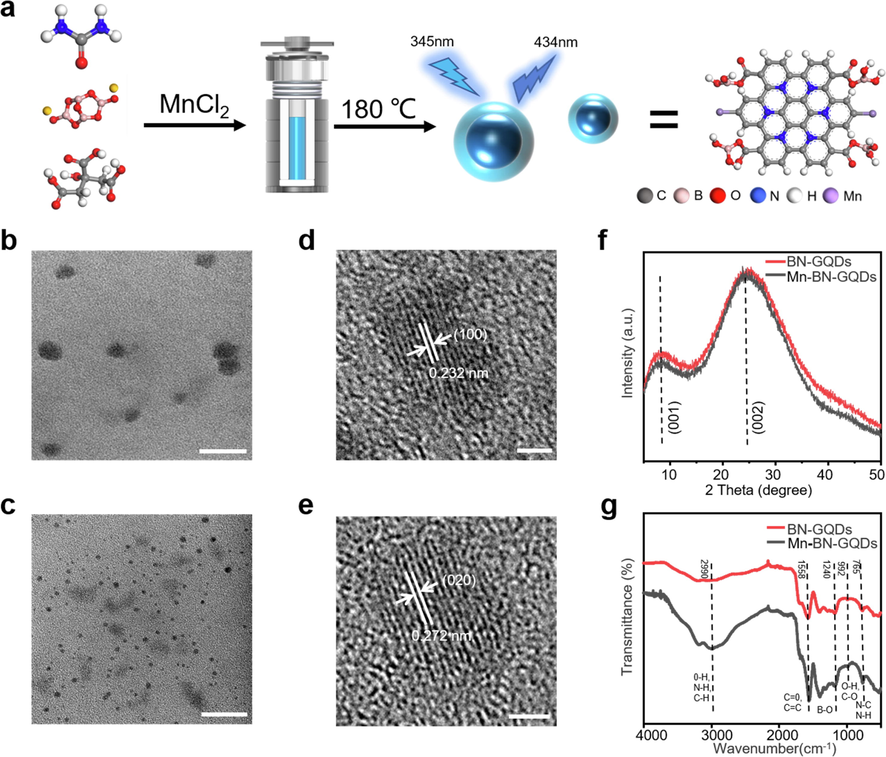
Preparation and characterization of Mn-BN-GQDs and BN-GQD. a. Schematic illustration of the synthesis of Mn-BN-GQDs as idealized model. b, d. TEM (scale bar: 50 nm) and HRTEM (scale bar: 2 nm) images of BN-GQDs. c, e. TEM (scale bar: 20 nm) and HRTEM (scale bar: 2 nm) images of Mn-BN-GQD. f. XRD pattern of the as-prepared BN-GQDs and Mn-BN-GQDs. g. FTIR spectra of BN-GQDs and Mn-BN-GQDs.
As shown in the figure S4a, b and c, we analyzed the X-ray Scattering (XRD) image of citric acid, urea and borax. By comparing with the synthesized BN-GQDs and Mn-BN-GQDs, a clear difference in the (0 0 2) of peak from the XRD image of BN-GQDs and Mn-BN-GQDs integrated the formation of new substance (Fig. 1f). Moreover, the XRD pattern of the synthesized BN-GQDs and Mn-BN-GQDs have two peaks at 8.4° (2θ) and 24.8° (2θ), corresponding to the plane of (0 0 1) and (0 0 2) of GQDs, respectively (Bao et al., 2015). According to the XRD image, the intensities of synthesized Mn-BN-GQDs at 8.4° (2θ) and 24.8° (2θ) are lower than those at BN-GQDs, indicating that manganese ions bind together with the functional groups at the edges of BN-GQDs, making the graphene sheets divided into smaller sheets.
In order for further analysis on chemical bonds and structure information of the synthesized BN-GQDs and Mn-BN-GQDs, the Fourier Transform Infrared Spectrometer (FTIR) have been applied on the as-prepared samples. As shown in Fig. 1g, the BN-GQDs and Mn-BN-GQDs show the vibrational absorption of 3182 cm−1 and 2990 cm−1 are related to O-H, N-H, C-H (unsaturated carbon) equivalent electron vibrations, indicating the presence of amino and hydroxyl groups on the GQDs. Besides, the characteristic absorption band from 1496 cm−1 to 1753 cm−1, and the peak at the 1558 cm−1 were due to the stretching vibration of the C = O and C = C double bonds in the aromatic ring, respectively. Meanwhile, the relatively small peaks at 1311 cm−1 and 1179 cm−1 proved the hydrogen bonds of B-O and B-O-H structure, indicating boron was present in GQDs. Notably, recent works in graphene-based ORR catalysis have revealed a strong coordination effect between the Nx molecular and Mn2+ (Zhou et al., 2014). Therefore, the detection of abnormal abundance of nitrogen bonding structure in the as-prepared GQDs is able to determine the existence of Mn ions in the structure reversely. Similarly, we compared the N 1 s of synthesized Mn-BN-GQDs with BN-GQDs, and found that the peak position was significantly shifted as shown in Figure S5, so there is a strong coordination effect between Nx molecule and Mn2+. According to the FTIR image, the C-N stretching vibration of Mn-BN-GQDs at 1396 cm−1 increases significantly as a result of the higher density of nitrogen elements on Mn-BN-GQDs in comparison to BN-GQDs, which provides evidence some element doping in BN-GQDs has an effect on the bond vibration. On the other hand, the reaction of Mn2+ with the carboxyl group on the residual citric acid would prevent the condensation reaction. Thereby, the suppression of carboxyl group from further condensation can be demonstrated by the significantly enhance of the peak value of Mn-BN-GQDs at 3000 cm−1, which led to more O-H bonds retained on Mn-BN-GQDs and proved Mn2+ has an effect on the bond vibration. We calculate the density of states of them later and combine the analysis of doping level with its properties.
Furthermore, we made X-ray Photoelectron Spectroscopy (XPS) for further analysis of the synthesized Mn-BN-GQDs, and get the proportion of each element and functional groups (Table S1). From the full spectrum in Fig. 2a, we can observe that the synthesized BN-GQDs and Mn-BN-GQDs all contain C, N, O, and B. As shown in Table S1, the contents of C, N, O, B and Mn in the synthesized Mn-BN-GQDs were 48.75%, 7.64%, 39.28%, 3.87% and 0.47%, respectively. The contents of C, N, O and B in the synthesized BN-GQDs were 37.73%, 9.63%, 46.62% and 6.03%, respectively. Fig. 2b shows the XPS spectra of C 1 s in Mn-BN-GQDs, with four adjacent peaks of 284.6 eV, 285.2 eV, 285.7 eV and 289.1 eV respectively corresponding to C-C/C = C, C-O, C-N and O-C = O bonds. Fig. 2c shows the XPS spectra of N 1 s in Mn-BN-GQDs, with two peaks of 400.9 eV and 401.9 eV respectively corresponding to N-(C)3 and C-N-C groups. The groups indicate that the N element has been successfully doped into the skeleton of GQDs. Fig. 2d shows the spectrum of O 1 s, which contains two peaks of 531.6 eV, 532.6 eV corresponding to C − OH/C − O − C and C = O bonds, respectively. Fig. 2e shows that Mn 2p has a dominant peak at 643.1 eV and a weak peak at 654.5 eV, corresponding to Mn2+ and Mn3+, respectively. This indicates that Mn exists on the surface of GQDs in the form of a mixture of Mn2+ and Mn3+, and the content of Mn2+ is higher. This indicates that Mn2+ ions have been successfully doped into the skeleton of GQDS (Ju and Chen 2014). Fig. 2f shows a spectrograph of B 1 s, with two peaks of 187.9 eV and 191.8 eV corresponding to B-O and B-C bonds, respectively. It shows that the B element is doped into the skeleton of GQDs. The above characterization analysis indicates the successful synthesis of Mn-BN-GQDs.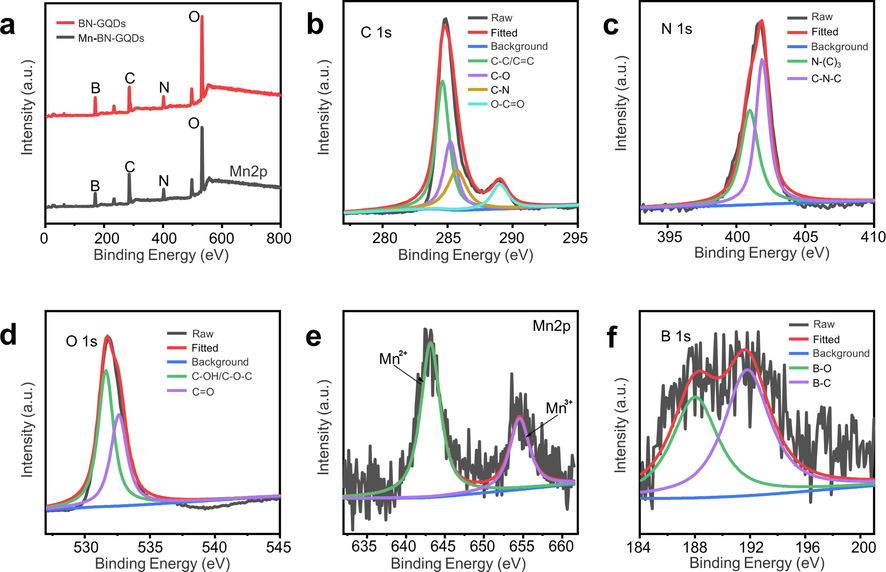
a. XPS survey spectra of Mn-BN-GQDs and BN-GQDs. b. C 1 s, c. N 1 s and d. O 1 s region of Mn-BN-GQDs. XPS high resolution of e. Mn 2p and f. B 1 s.
3.2 Characterization of optical properties of Mn-BN-GQDs
The optical properties of the synthesized Mn-BN-GQDs were analyzed. The Mn-BN-GQDs showed pale yellow solution under the sunlight and a bright blue light under the irradiation of the ultraviolet lamp, as shown in Fig. 3a, which indicated that the Mn-BN-GQDs has the characteristics of photoluminescence in ultraviolet range. The synthesized Mn-BN-GQDs luminance spectrum is clearly represented in the Figure S6. Mn-BN-GQDs were dissolved in distilled water and the excitation wavelength, emission wavelength, UV-Vis spectrum of the synthesized Mn-BN-GQDs were measured at pH = 7. As can be observed from the UV-Vis spectrum in the Fig. 3a, two obvious absorption peaks are 216 nm and 326 nm respectively. The peak value at 216 nm corresponds to the π-π* transition on the sp2 structure of the aromatic ring, the peak at 326 nm corresponds to the absorption band of n-π* (Jing et al., 2015). The excitation and emission peak wavelengths of the synthesized Mn-BN-GQDs are 345 nm and 434 nm, respectively. Compared with the UV-Vis spectrum, the absorption band is 326 nm, and the maximum excitation wavelength of Mn-BN-GQDs is 345 nm, which may be caused by the different distribution of GQDs energy traps in different signals (Liu et al., 2012, Ju and Chen 2014, Miao et al., 2020). As shown in Fig. 3b, we detected the change of emission wavelength under different excitation wavelength from 325 nm to 365 nm. When the excitation wavelength changes, the emission wavelength does not change at 434 nm, which indicates that the synthesized Mn-BN-GQDs have independent-excitation characteristics (Zhu et al., 2016, Li et al., 2019, Kaewprom et al., 2020). This is due to the uniform size of the synthesized Mn-BN-GQDs and the single photoluminescence process of the N element from n-p* in the aromatic hydrocarbon of Mn-BN-GQDs. This characteristic is beneficial to the practical application of Mn-BN-GQDs as fluorescence sensors, and avoids the phenomenon of automatic discoloration. From Fig. 3c, d, we compare the effects of doping of different ions on the fluorescence intensity and quantum yield of BN-GQDs. It can be clearly seen from the figure that Mn2+ enhances the fluorescence intensity of BN-GQDs better than other metal ions, and the QY of Mn-BN-GQDs is 30.52% (BN-GQDs = 20.12%). At the same time, we analyzed the fluorescence lifetime of Mn-BN-GQDs and BN-GQDs, As shown in Fig. 3e, its fluorescence intensity attenuation is fitted as a single exponential attenuation function and the results showed that the fluorescence lifetime of Mn-BN-GQDs was 7.444 ns, while that of BN-GQDs was 7.005 ns (Figure S7), and the fluorescence lifetime was improved. Thus, it can be further confirmed that Mn2+ ion is doped into BN-GQDs, and the optical properties of BN-GQDs are improved.![Optical properties of Mn-B, N-GQD and influence of pH. a. The fluorescence excitation (red), emission (blue) and UV-Vis (green) absorption spectra of Mn-BN-GQDs. Inset: photographs of the solution of the Mn-BN-GQDs taken under visible light (left) and 365 nm UV light (right). b. Fluorescence emission spectra of the Mn-BN-GQDs with different excitation wavelengths. c. The fluorescence intensity of BN-GQDs doped with different metal ions and the fluorescence intensity of BN-GQDs. d. The QY of different metal ions doped with BN-GQDs and the QY of BN-GQDs. e. Fitting curves of time-resolved fluorescence decay curve of Mn-BN-GQDs. f. Fluorescence intensities of synthesized Mn-BN-GQDs at different pH values at 434 nm (black) and in the presence of Fe3+ (red). [Fe3+] = 3.7 × 10⁻⁴ mol/L [Mn-BN-GQDs] = 0.054 mg/mL.](/content/184/2022/15/7/img/10.1016_j.arabjc.2022.103856-fig3.png)
Optical properties of Mn-B, N-GQD and influence of pH. a. The fluorescence excitation (red), emission (blue) and UV-Vis (green) absorption spectra of Mn-BN-GQDs. Inset: photographs of the solution of the Mn-BN-GQDs taken under visible light (left) and 365 nm UV light (right). b. Fluorescence emission spectra of the Mn-BN-GQDs with different excitation wavelengths. c. The fluorescence intensity of BN-GQDs doped with different metal ions and the fluorescence intensity of BN-GQDs. d. The QY of different metal ions doped with BN-GQDs and the QY of BN-GQDs. e. Fitting curves of time-resolved fluorescence decay curve of Mn-BN-GQDs. f. Fluorescence intensities of synthesized Mn-BN-GQDs at different pH values at 434 nm (black) and in the presence of Fe3+ (red). [Fe3+] = 3.7 × 10⁻⁴ mol/L [Mn-BN-GQDs] = 0.054 mg/mL.
The principle that manganese ions can enhance the fluorescence and QY of BN-GQDs is analyzed. During the synthesis of BN-GQDs, some carboxyl groups of citric acid will remain on the surface of BN-GQDs without being carbonized. These carboxyl groups can promote further condensation carbonization reaction of BN-GQDs, which leads to large irregular agglomerations of BN-GQDs samples in TEM. However, manganese ions can combine with the carboxyl group and other functional groups on the surface of BN-GQDs, thus preventing further condensation reaction of BN-GQDs, and thus preventing the growth of BN-GQDs particles. Thus, the synthesized Mn-BN-GQDs particles are smaller and more evenly distributed. Because of the quantum confining effect, the synthesized Mn-BN-GQDs have better optical properties (Li et al., 2011, Ananthanarayanan et al., 2014).
3.3 Effect of pH on fluorescence Influence
Fig. 3f shows the fluorescence intensity of Mn-BN-GQDs synthesized in the pH range of 2–12 (black) and the quenched fluorescence intensity in the presence of Fe3+ (red). From the difference between the two lines, we can see the fluorescence quenching effect of Fe3+ on Mn-BN-GQDs at different pH values. On the whole in the figure, we can see that Fe3+ has a good quenching effect in the pH range of 2–12. However, when the pH is 2–4, the fluorescence intensity is obviously the worst, so the synthesized Mn-BN-GQDs as fluorescence sensors are not suitable for application under acidic conditions. Secondly, when the pH is 9–12, the fluorescence quenching effect is good, but the quenching effect is not stable. Therefore, it is not suitable for the practical use of Mn-BN-GQDs as fluorescence sensors. Finally, the quenching efficiency is the highest and relatively stable when the pH is 6–8, which is suitable for the use of Mn-BN-GQDs, and the quenching effect is the best when the pH is 7. Therefore, the subsequent tests are carried out at pH = 7.
3.4 Mechanism of Mn-BN-GQDs and Fe3+ quenching
Then we studied and analyzed the quenching mechanism of Mn-BN-GQDs as fluorescence sensors. Generally speaking, there are three main forms of fluorescence quenching: (1) internal filtration effect (IFE), (2) electron transfer, and (3) conversion of fluorescent materials to non-fluorescent materials (Lin et al., 2015, Shi et al., 2020). To know whether the fluorescence quenching process is dynamic quenching process or static quenching process, we have carried out the characterization analysis of fluorescence decay. The fluorescence intensity attenuation fitting of synthesized Mn-BN-GQDs in the presence and absence of Fe3+ is a single exponential decay function, and the fluorescence lifetime was shortened with the increasing of Fe3+ ions. The average fluorescence lifetime of Mn-BN-GQDs is 7.444 ns. The average fluorescence lifetime of Mn-BN-GQDs (in the presence of 10 μM Fe3+) and Mn-BN-GQDs (in the presence of 100 μM Fe3+) are 7.355 ns in Fig. 4a, and 7.267 ns in Figure S8, as shown in the table S3, which indicates that the fluorescence quenching between Fe3+ and Mn-BN-GQDs is a dynamic quenching process. It is also indicated that the fluorescence resonance electron transfer occurs during the process, because the fluorescence lifetime of the fluorescent material does not change during the process of IFE. This may be due to the fact that Fe3+ is a paramagnetic ion with empty d shells, which can quench the fluorescence of the fluorophore by electron transfer, as shown in Figure S9. At the same time, since Fe3+ ion has three positive charges, the free amino group can provide electrons to iron ion, so it can have better coordination ability with the free amino group (Xu et al., 2015). In order to further explore the quenching mechanism of Mn-BN-GQDs as fluorescence sensors, we tested the ultraviolet absorption spectra of Mn-BN-GQDs in the absence and presence of Fe3+ ions. As shown in Fig. 4b, the peak value of absorption spectra decreased in the presence of Fe3+ ions. In addition, the absorption peak redshifted from 326 nm to 329 nm, indicating that new chelating substances may be generated to change the absorption peak. Meanwhile, according to previous literature reports, oxygen-containing functional groups such as hydroxyl (–OH) and carboxyl (–COOH) have a good affinity with Fe3+ ions and can chelate and form new complexes (Zhang et al., 2015, Liu et al., 2017, Zhu et al., 2017). Then, as shown in Figure S10, we tested the FTIR of Mn-BN-GQDs in the presence and absence of Fe3+ and it can be seen from the figure that the O-H vibration and O-H/C-O changes around 3000 cm−1 and 1000 cm−1, but other parts are basically unchanged, indicating that Fe3+ has a good affinity with hydroxyl carboxyl group. This indicates that a new non-fluorescent substance may be formed on the surface of Mn-BN-GQDs to quench the fluorescence. Finally, as shown in Figure S11 1 mM-1 M EDTA was added to the Mn-BN-GQDs solution of Fe3+, and the fluorescence intensity recovered was 47.2%. It can be inferred that Fe3+ chelates with the above functional groups to produce quenching effect. In summary, Mn-BN-GQDs, as the quenching mechanism of fluorescence sensing, takes place the electron transfer and conversion process from fluorescent materials to non-fluorescent materials.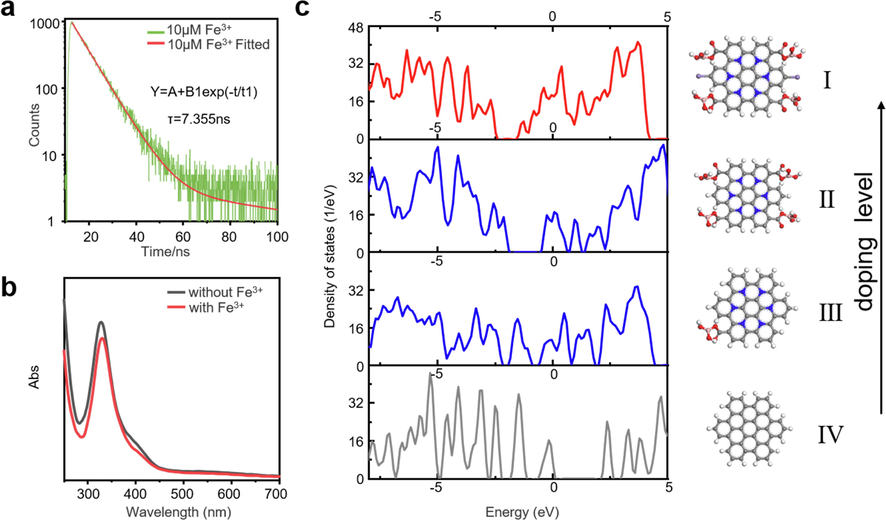
Mechanism of Mn-BN-GQDs and Fe3+ quenching. a. Fitting curves of time-resolved fluorescence decay curve of the Mn-BN-GQDs for the 10 μM Fe3+ analysis. b. The UV absorption spectra of Mn-BN-GQDs without Fe3+ and in the presence of Fe3+. c. Density of states for the Mn-BN-GQDs in different doping level.
In order to investigate the relation between GQDs electronical properties with the doping level density functional theory calculations were performed by Vienna ab Initio Simulation Package with Perdew − Burke − Ernzerhof (PBE) (Fig. 4c). The graphene quantum dot structure is simplified to 16 aromatic rings, which reduce the computational burden without losing generality to provide qualitative insights and comparisons (Jin et al., 2013, Yu et al., 2021). Then we add the doped nitrogen to the rings, boron and Mn2+ as functional groups, according to the FTIR we obtained above, as shown from top to bottom (Yan et al., 2020). The number of functional groups indicates the expansion of doping level. Compared with the Ⅳ structure, III structure has only one functional group with N doped, and the second structure has four functional groups with N doped, the Ⅰ structure has four functional groups with N, Mn doped, respectively. The graphene quantum dot benchmark shows a bandgap near 2.50 eV which in accordance with the previous reports (Jin et al., 2013). Meanwhile the location of Fermi energy from the density of states shows that GQD is a p-type semiconductor. With the increase of doping level, structure Ⅱ and structure III show a tendency of metallization, and Fermi energy level moves to the negative energy region. Continuous doping with N and B gives a narrower band and larger carrier density, which reflected in the good electronic properties. However, after doping with Mn, the structure has larger carrier density and lower barrier compared with the Ⅱ structure and the III structure. It donates electrons that works like a n-type semiconductor which is easily react with Fe3+ than undoped and unsaturated doped GQD, which is also proved in our experiment.
3.5 Detection of Fe3+ ions
In order to explore the sensitivity of Mn-BN-GQDs to detection of Fe3+, we designed Mn-BN-GQDs to detect their emission wavelengths at different concentrations of Fe3+ (0.1–800 μM) under the condition of excitation wavelength of 345 nm, as shown in Fig. 5a. With the increase of Fe3+ concentration, the fluorescence intensity of Mn-BN-GQDs decreased gradually, which indicated that Mn-BN-GQDs had very good sensitivity to Fe3+ ions, and the CIE chromaticity coordinates of the synthesized Mn-BN-GQDs correspond to the color filtered PL spectrum as shown in the Figure S12. And Fig. 5b shows the curve of quenching efficiency (F/F0) and Fe3+ concentration. It can be clearly seen from the figure that the quenching of Fe3+ by Mn-BN-GQDs shows a bilinear relationship and a good linear relationship. As shown in the illustration in Fig. 5b, the linear equation at 10–100 μM is
(R2 = 0.99757, where F0 and F correspond to the fluorescence intensities of Mn-BN-GQDs at 434 nm, with the 345 nm excitation wavelength, in the absence and presence of Fe3+ ions, respectively, and C is the concentration of Fe3+). Under this experimental condition, the limit of detection (LOD) is 0.78 μM according to the calculation formula
is the standard deviation of 11 blank samples and K is the slope of the linear coordinate curve). Similarly, as shown in the illustration in Fig. 5b, the linear equation in the range of 100–800 μM is
(R2 = 0.98256), and the LOD is 9.08 μM. As shown in the table S2, we compared the detection of Fe3+ by different fluorescence sensors.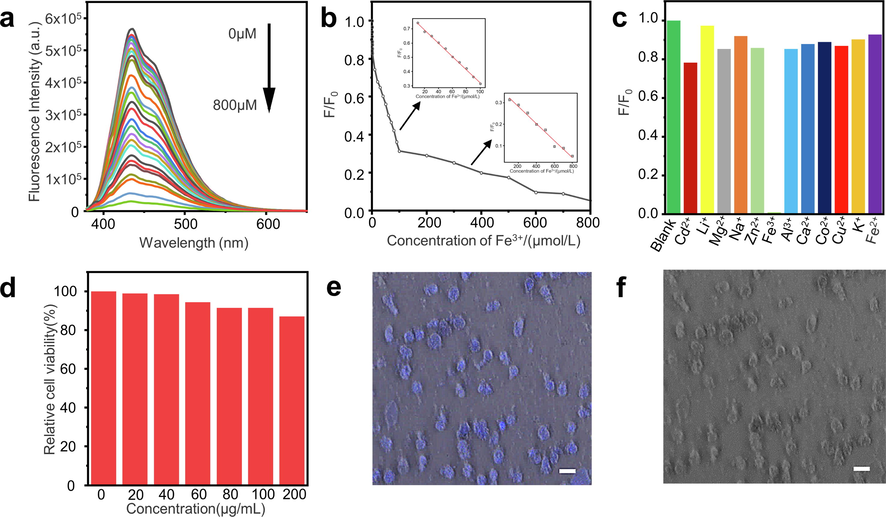
Fluorescence quenching of Fe3+ by Mn-BN-GQDs and its application in biological imaging. a. Emission spectra (λex = 345 nm) of in the presence of different concentrations of Fe3+ (from top to bottom:0.1, 0.2, 0.3, 0.4, 0.5, 0.6, 0.7, 10, 20, 30, 40, 50, 60, 70, 80, 90, 100, 200, 300, 400, 500, 600, 700, 800 μM). b. The relationship between F/F0 and Fe3+ ions concentrations range from 0 to 800 μM. (Insert: Linear relationship between F/F0 and Fe3+ concentrations 10 ∼ 100 μM. Linear relationship between F/F0 and Fe3+ concentrations 100 ∼ 800 μM.) c. Fluorescence responses of Mn-BN-GQDs to the different metal ions (pH = 7). The concentration of each metal ion is 800 μM. F0 and F correspond to the fluorescence intensities of Mn-BN-GQDs at 434 nm with the 345 nm excitation wavelength in the absence and presence of metal ions, respectively. d. Relative cell viability of HepG2 cells after incubation with Mn-BN-GQDs (0–200 mg/mL) for 24 h. e. CLSM images bright field of HepG2 cells incubated with Mn-BN-GQDs (40 mg/mL) for 3 h by excitation at 405 nm. (scale bar: 20 μM magnified 400 times by CLSM). f. Morphology of Mn-BN-GQDs and HepG2 cells cultured together (scale bar: 20 μM magnified 400 times by CLSM).
In order to further explore the selection characteristics of the synthesized Mn-BN-GQDs, we added the same concentration of metal ions to the synthesized Mn-BN-GQDs fluorescence sensor to observe the fluorescence quenching effect of different ions on Mn-BN-GQDs. As shown in Fig. 5c, Cd2+, Li+, Mg2+, Na+, Zn2+, Fe3+, Al3+, Ca2+, CO2+, Cu2+, K+ and Fe2+ ions were added into the fluorescence sensors of Mn-BN-GQDs, and it was found that besides Fe3+ had obvious quenching effect on the synthesized Mn-BN-GQDs. After the addition of other ions, the fluorescence intensity is basically unchanged, which fully demonstrates that the Mn-BN-GQDs synthesized by us have the characteristic of specific selection as fluorescence sensors, reflecting that Mn-BN-GQDs can detect Fe3+ in practical application as fluorescence sensors, so as to effectively control the pollution of Fe3+.
3.6 Cellular toxicity
In order to evaluate the application of Mn-BN-GQDs in bioimaging, we conducted cytotoxicity tests for its biocompatibility. HepG2 cells were cultured with different concentrations of Mn-BN-GQDs. After 24 h, the survival of HepG2 cells was calculated by using MTT cell relative viability method. As shown in the Fig. 5d, after cultured HepG2 cells for 24 h, the cell viability basically did not change when the concentration of Mn-BN-GQDs was 0–40 μg/mL, and the cell viability slightly decreased when the concentration was 60–200 μg/mL. By comparing the cytotoxicity test of Jiang et al. (Kai et al., 2015) at 0–50 μg/mL and Li et al. (Li et al., 2015) at 0–200 μg/mL, which indicates that the synthetic Mn-BN-GQDs have low cytotoxicity.
3.7 Cell fluorescent imaging
Confocal laser scanning microscope (CLSM) was used to observe the application of Mn-BN-GQDs imaging. Under the light confocal scanning microscope, we can see the blue fluorescence in Mn-BN-GQDs co-cultured with HepG2 cells at a concentration of 40 μg/mL, as shown in Fig. 5e, which indicates that Mn-BN-GQDs can enter the HepG2 cells and conduct cell imaging. Moreover, as shown in Fig. 5f, Mn-BN-GQDs and HepG2 cells were cultured together and HepG2 cells maintained their normal morphology and adhered to cell plates, indicating that Mn-BN-GQDs had good biocompatibility. Therefore, as a kind of low toxicity, Mn-BN-GQDs also has a good application prospect in the field of fluorescent biological imaging probes (Li et al., 2021a, 2021b).
4 Conclusion
In this article, an innovative method for doping Mn, B, N metallic elements and non-metallic elements into graphene quantum dots has been developed in simple and rapid one-step hydrothermal way. Then we calculate the density of states in combine with the analysis of doping level with its properties to prove the effect of the common doping of the three elements on GQDs. Compared with B, N-GQD, Mn-BN-GQDs have better dispersion, size distribution, smaller diameter and good water solubility, thus significantly improved fluorescence performance and QY. Then, on the basis of multi-functional characterizations, the article provided strong evidence for the high sensitivity and selectivity for Fe3+ on synthesized Mn-BN-GQDs, and showed a two-line relationship and good linear relationship for the detection of Fe3+. Similarly, the best pH value of Mn-BN-GQDs were measured, which better enables Mn-BN-GQDs to be practically applied as fluorescence sensors. Finally, Mn-BN-GQDs were tested to have low cytotoxicity and good biocompatibility, which demonstrated that the sensors would perform good fluorescence intensity in living cells, and indicates a good development prospect in biological imaging in the future.
Acknowledgements
Y. W, L. H. and J. T. acknowledge the Natural Scientific Foundation of China (Grant no.52070104, 51878361, 51503112), Natural Scientific Foundation of Shandong Province (Grant No. ZR2019MEM048), State Key Project of International Cooperation Research (2016YFE0110800, 2017YFE0108300), the National Program for Introducing Talents of Discipline to Universities (“111”plan), 1st class discipline program of Materials Science of Shandong Province, The Double-Hundred Foreign Expert Program of Shandong Province (2019-2021).
Author contributions
All authors contributed to literature research and manuscript writing.
Declaration of Competing Interest
The authors declare that they have no known competing financial interests or personal relationships that could have appeared to influence the work reported in this paper.
References
- Efficient Combination of G-C3N4 and CDs for Enhanced Photocatalytic Performance: A Review of Synthesis, Strategies, and Applications. Small. 2021;17:2007523.
- [Google Scholar]
- Facile synthesis of graphene quantum dots from 3D graphene and their application for Fe3+ sensing. Adv. Funct. Mater.. 2014;24:3021-3026.
- [Google Scholar]
- Photoluminescence-tunable carbon nanodots: surface-state energy-gap tuning. Adv. Mater.. 2015;27:1663-1667.
- [Google Scholar]
- Enhanced formaldehyde sensitivity of two-dimensional mesoporous SnO2 by nitrogen-doped graphene quantum dots. Rare Met.. 2021;40:1561-1570.
- [Google Scholar]
- High-Quality Manganese-Doped Zinc Sulfide Quantum Rods with Tunable Dual-Color and Multiphoton Emissions. J. Am. Chem. Soc.. 2011;133:5389-5396.
- [Google Scholar]
- Highly fluorescent carbon dots as selective and sensitive “on-off-on” probes for iron (III) ion and apoferritin detection and imaging in living cells. Biosens. Bioelectron.. 2016;83:229-236.
- [Google Scholar]
- Rare-Earth Metal Ions Doped Graphene Quantum Dots for Near-IR In Vitro/In Vivo/Ex Vivo Imaging Applications. Adv. Opt. Mater.. 2020;8
- [Google Scholar]
- Manganese-Doped Carbon Dots for Magnetic Resonance/Optical Dual-Modal Imaging of Tiny Brain Glioma. ACS Biomater. Sci. Eng.. 2018;4:2089-2094.
- [Google Scholar]
- Highly Luminescent and Stable Green Quasi-2D Perovskite-Embedded Polymer Sheets by Inkjet Printing. Adv. Funct. Mater.. 2020;30:1910817.
- [Google Scholar]
- Tuning the photoluminescence of graphene quantum dots through the charge transfer effect of functional groups. ACS Nano.. 2013;7:1239-1245.
- [Google Scholar]
- Magnetically Engineered Semiconductor Quantum Dots as Multimodal Imaging Probes. Adv. Mater.. 2015;26:6367-6386.
- [Google Scholar]
- Synthesis of highly fluorescent nitrogen-doped graphene quantum dots for sensitive, label-free detection of Fe (III) in aqueous media. Biosens. Bioelectron.. 2014;58:219-225.
- [Google Scholar]
- Sulfur doped graphene quantum dots as a potential sensitive fluorescent probe for the detection of quercetin. Food Chem.. 2020;317
- [Google Scholar]
- Simultaneous determination of Hg(II) and Cu(II) in water samples using fluorescence quenching sensor of N-doped and N, K co-doped graphene quantum dots. Arabian J. Chem.. 2020;13:3714-3723.
- [Google Scholar]
- Bright-Yellow-Emissive N-Doped Carbon Dots: Preparation, Cellular Imaging, and Bifunctional Sensing. ACS Appl. Mater. Interfaces. 2015;7:23231.
- [Google Scholar]
- Tunable light emission from carbon dots by controlling surface defects. Chin. Chem. Lett.. 2021;32:2887-2892.
- [Google Scholar]
- The scaling of the ligand concentration and Soret effect induced phase transition in CsPbBr 3 perovskite quantum dots. J. Mater. Chem. A. 2019;7:27241-27246.
- [Google Scholar]
- Metal–organic framework-based materials: superior adsorbents for the capture of toxic and radioactive metal ions. Chem. Soc. Rev.. 2018;47:2322-2356.
- [Google Scholar]
- Emancipating target-functionalized carbon dots from autophagy vesicles for a novel visualized tumor therapy. Adv. Funct. Mater.. 2018;28:1800881.
- [Google Scholar]
- Imaging cellular aerobic glycolysis using carbon dots for early warning of tumorigenesis. Adv. Mater.. 2021;33:2005096.
- [Google Scholar]
- Nitrogen and sulfur co-doped carbon dots for highly selective and sensitive detection of Hg (Ⅱ) ions. Biosens. Bioelectron.. 2015;74:263-269.
- [Google Scholar]
- A facile microwave avenue to electrochemiluminescent two-color graphene quantum dots. Adv. Funct. Mater.. 2012;22:2971-2979.
- [Google Scholar]
- An electrochemical avenue to green-luminescent graphene quantum dots as potential electron-acceptors for photovoltaics. Adv. Mater.. 2011;23:776-780.
- [Google Scholar]
- A facile synthesis of highly luminescent nitrogen-doped graphene quantum dots for the detection of 2, 4, 6-trinitrophenol in aqueous solution. Nanoscale.. 2015;7:1872-1878.
- [Google Scholar]
- Hydrothermal treatment of grass: a low-cost, green route to nitrogen-doped, carbon-rich, photoluminescent polymer nanodots as an effective fluorescent sensing platform for label-free detection of Cu (II) ions. Adv. Mater.. 2012;24:2037-2041.
- [Google Scholar]
- Red Emission B, N, S-co-Doped Carbon Dots for Colorimetric and Fluorescent Dual Mode Detection of Fe3+ Ions in Complex Biological Fluids and Living Cells. ACS Appl. Mater. Interfaces. 2017;9:12663-12672.
- [Google Scholar]
- Introducing specificity to iron oxide nanoparticle imaging by combining 57Fe-based MRI and mass spectrometry. Nano Lett.. 2019;19:7908-7917.
- [Google Scholar]
- Hetero-atom-doped carbon dots: Doping strategies, properties and applications. Nano Today. 2020;33
- [Google Scholar]
- In Situ Doping-Enabled Metal and Nonmetal Codoping in Graphene Quantum Dots: Synthesis and Application for Contaminant Sensing. ACS Sustain. Chem. Eng.. 2020;8:16565-16576.
- [Google Scholar]
- Graphene Quantum Dot Embedded Hydrogel for Dissolved Iron Sensing. Chemistryselect.. 2019;4:9640-9646.
- [Google Scholar]
- Efficient and color-tunable Mn-doped ZnSe nanocrystal emitters: Control of optical performance via greener synthetic chemistry. J. Am. Chem. Soc.. 2007;129:3339-3347.
- [Google Scholar]
- Recent advances in chiral carbonized polymer dots: from synthesis and properties to applications. Nano Today. 2020;34:100953
- [Google Scholar]
- Nitrogen and phosphorus co-doped carbon nanodots as a novel fluorescent probe for highly sensitive detection of Fe3+ in human serum and living cells. ACS Appl. Mater. Interfaces. 2016;8:10717-10725.
- [Google Scholar]
- Nitrogen-sulfur co-doped pH-insensitive fluorescent carbon dots for high sensitive and selective hypochlorite detection. Spectrochim. Acta Part A – Mol. Biomol. Spectrosc.. 2020;242
- [Google Scholar]
- Erbium-doped graphene quantum dots with up- and down-conversion luminescence for effective detection of ferric ions in water and human serum. Sens. Actuators B-Chem.. 2021;328
- [Google Scholar]
- Mn(II)-coordinated Fluorescent Carbon Dots: Preparation and Discrimination of Organic Solvents. Opt. Mater.. 2018;78:118-125.
- [Google Scholar]
- MXenes: Focus on optical and electronic properties and corresponding applications. Nanophotonics. 2020;9:1601-1620.
- [Google Scholar]
- Carbon-based quantum dots with solid-state photoluminescent: mechanism, implementation, and application. Small. 2020;16:2004621.
- [Google Scholar]
- Preparation of highly photoluminescent sulfur-doped carbon dots for Fe (III) detection. J. Mater. Chem. A. 2015;3:542-546.
- [Google Scholar]
- D-penicillamine-functionalized graphene quantum dots for f luorescent detection of Fe3+ in iron supplement oral liquids. Sens. Actuators, B. 2017;243:211-220.
- [Google Scholar]
- van der Waals heterojunction between a bottom-up grown doped graphene quantum dot and graphene for photoelectrochemical water splitting. ACS Nano. 2020;14:1185-1195.
- [Google Scholar]
- C3N-A 2D crystalline, hole-free, tunable-narrow-bandgap semiconductor with ferromagnetic properties. Adv. Mater.. 2017;29:1605625.
- [Google Scholar]
- Large-scale fabrication of heavy doped carbon quantum dots with tunable-photoluminescence and sensitive fluorescence detection. J. Mater. Chem. A. 2014;2:8660-8667.
- [Google Scholar]
- Computational studies on carbon dots electrocatalysis: a review. Adv. Funct. Mater.. 2021;31:2107196.
- [Google Scholar]
- ZnFe2O4 nanoparticles: Synthesis, characterization, and enhanced gas sensing property for acetone. Sens. Actuators B 2015
- [Google Scholar]
- Bioinspired graphene oxide membranes with pH-responsive nanochannels for high-performance nanofiltration. ACS Nano. 2021;15:13178-13187.
- [Google Scholar]
- A Review of Graphene-Based Nanostructural Materials for Both Catalyst Supports and Metal-Free Catalysts in PEM Fuel Cell Oxygen Reduction Reactions. Adv. Energy Mater.. 2014;4
- [Google Scholar]
- Understanding the Selective Detection of Fe3+ Based on Graphene Quantum Dots as Fluorescent Probes: The K-sp of a Metal Hydroxide-Assisted Mechanism. Anal. Chem.. 2017;89:12054-12058.
- [Google Scholar]
- Nitrogen-doped carbon nanoparticle modulated turn-on fluorescent probes for histidine detection and its imaging in living cells. Nanoscale. 2016;8:2205-2211.
- [Google Scholar]
Appendix A
Supplementary data
Supplementary data to this article can be found online at https://doi.org/10.1016/j.arabjc.2022.103856.
Appendix A
Supplementary data
The following are the Supplementary data to this article:Supplementary data 1
Supplementary data 1


