

Translate this page into:
Phenolic compounds of Solanum xanthocarpum play an important role in anti-inflammatory effects
⁎Corresponding authors. hxkuang@yahoo.com (Hai-Xue Kuang), ybywater@163.com (Bing-You Yang)
-
Received: ,
Accepted: ,
This article was originally published by Elsevier and was migrated to Scientific Scholar after the change of Publisher.
Abstract

Abstract
51 phenolic compounds including seven new compounds have been separated. 40 known compounds were isolated from Solanum xanthocarpum for the first time. The inhibitory activities of the NO release of LPS-induced RAW 264.7 cells were performed. The possible mechanism of NO inhibition was investigated using molecular docking. The bioinformatic analysis further revealed the potential anti-inflammatory targets.
Abstract
Solanum xanthocarpum is used for the treatment of rheumatic arthritis, toothache, sore throats, carbuncle, furuncle, and other inflammatory diseases in traditional Chinese medicine and Ayurvedic medical system, with the phenolic compounds being one of its principal components. In this study, 51 phenolic compounds including seven new compounds 1, 2, 9, 13, 17, 22, and 40 were isolated from the fruits of Solanum xanthocarpum. 40 known compounds 3–8, 10–12, 14–16, 18–21, 23–25, 28–32, 35–39, 41–51 were firstly isolated from Solanum xanthocarpum. Their structures were determined by comprehensive spectroscopic analyses, X-ray crystallography, NMR calculations, chemical methods, and comparisons of spectroscopic data. The results of anti-inflammatory assays indicated that most isolated compounds (3–7, 11–30, 32–37, 39, 40, 42, 43, 45, and 48–51) possessed significant inhibitory activities of the NO release of LPS-induced RAW 264.7 cells, with IC50 values ranging from 10.46 to 47.59 μM. Further analysis by molecular docking implied that most bioactive compounds could interact with the amino acid residues of iNOS proteins, supporting the anti-inflammatory activity of the compounds. Especially, compounds 17–20, 26–27, 32, and 34 showed strong affinities with iNOS proteins. The bioinformatic analysis further revealed the potential anti-inflammatory targets of the phenolic compounds isolated from the fruits of Solanum xanthocarpum.
Keywords
Solanum xanthocarpum
Anti-inflammatory
NO inhibitory effects
Phenolic compounds

1 Introduction
Solanum xanthocarpum is widely distributed in southern areas of China, India, Arabia, Sri Lanka, Malaysia, Vietnam, Thailand, and other tropical areas. Solanum xanthocarpum is used for the treatment of rheumatic arthritis, toothache, sore throats, carbuncle, furuncle, and other inflammatory diseases in traditional Chinese medicine and Ayurvedic medical system (Kar et al., 2006; More et al., 2013; Parmar et al., 2017; Periyannan et al., 2016; Shivnath et al., 2021). In a previous study, whole parts of Solanum xanthocarpum have shown anti-inflammatory activity against carrageenan and histamine-induced paw edema (More et al., 2013). In addition, Solanum xanthocarpum fruits extract has ameliorated osteoarthritis development in collagenase-induced osteoarthritic rats (Shivnath et al., 2021). The phenolic compounds are one of the principal components of Solanum xanthocarpum fruits. The total phenolic content of Solanum xanthocarpum fruits was found to be 462 mg per g dry weight of extract (Shivnath et al., 2021). Phenolic compounds could inhibit either the production or the action of pro-inflammatory mediators, resulting in anti-inflammatory capacity. And phenolic compounds have been shown to play important anti-inflammatory roles in some plants. (Ambriz-Pérez et al., 2016; Barakat et al., 2020). Hence, this research investigated the isolation, structural characterization, and anti-inflammatory effects assessments of the phenolic compounds from the Solanum xanthocarpum fruits.
2 Materials and methods
2.1 General experimental procedures
HRESIMS spectra were performed on an UHPLC-Orbitrap-MS instrument or an AB SCIEX Triple TOF 5600 instrument. NMR spectra were obtained on a Bruker DPX 600 instrument (600 MHz for 1H NMR and 150 MHz for 13C NMR) or a Bruker DPX 400 instrument (400 MHz for 1H NMR and 100 MHz for 13C NMR) with TMS as an internal standard. Optical rotations were measured by a JASCO P-2000 digital polarimeter. CD spectra were recorded on a Bio-Logic Science MOS-450 spectropolarimeter. IR spectra were recorded on a Thermo Scientific Nicolet FTIR-8400S spectrometer with KBr panels. X-ray data were obtained from a Bruker D8 Venture instrument. Preparative HPLC was performed on LC-20AR HPLC equipped with RID-20A detector (Shimadzu Corporation) coupled with a Waters SunFire C18 prep column (10 × 250 mm, 5 μm). Column chromatography was carried out using silica gel (200–300 mesh, Qingdao Marine Chemical Ltd., China), MCI gel (CHP 20, Mitsubishi Chemical Industries Ltd., Japan), and octadecyl silica gel (YMC Company Ltd., Japan). Fractions were monitored by TLC (silica gel GF254 plates) and HPLC performed on Waters e2695–2424–2998 system. GC–MS analysis was performed on an Agilent Technologies (7890A) system with a DB-5 capillary column.
2.2 Plant material
The fruits of Solanum xanthocarpum were collected from Guilin of Guangxi Province and identified by Prof. Rui-Feng Fan. A voucher specimen (No. 20160327) was deposited in the laboratory at the School of Pharmacy, Heilongjiang University of Chinese Medicine.
2.3 Extraction and isolation
The air-dried fruits of Solanum xanthocarpum (9 kg) were crushed and extracted with 70% ethanol (54 L × 3, each for 2 h) under reflux. The extract was filtered and then concentrated in vacuo to get the crude extract (2473.6 g). Then the crude extract was suspended in water and subsequently partitioned with petroleum ether, EtOAc, and n-BuOH to obtain 34.0, 150.1, 393.8, and 1605.0 g of extracts, respectively.
The crude EtOAc fraction (100.0 g) was separated by open silica gel column chromatography, ODS-MPLC, semipreparative HPLC, and preparative HPLC to yield 21–28, 32, 33, 37, and 40. The crude n-BuOH fraction (280.0 g) was separated by open silica gel column chromatography, ODS-MPLC, semipreparative HPLC, and preparative HPLC to yield 1, 2, 4–20, 29, 31, 34–36, 38, 39, 41–44, and 46–51. The crude water fraction (1000.0 g) was dissolved in water (2.0 L) and 95% alcohol (8.0 L) was added to it with full stirring. Then the supernatant was filtered after that the mixture was refrigerated at 4 °C for 12 h. The supernatant was concentrated in vacuo to get the crude extract (86.6 g). The crude extract was separated by AB-8 macroporous resin column chromatography, MCI column chromatography, and semipreparative HPLC to yield 3, 30, and 45. For the details of separation procedures for 1–51, see the “Extraction and isolation” section in the Supplementary material.
2.3.1 Chlorogenic acid ethyl ester-4′-O-β-D-glucopyranoside (1)
Colorless crystals (MeOH); [α]17 D −48.0 (c 0.10, MeOH); UV λmax (MeOH): 292 nm; IR νmax 3409, 2927, 1698, 1635, 1508, 1449, 1394, 1269, 1128, 1074, and 617 cm−1; HRESIMS m/z 543.1720 [M−H]− (calcd. 543.1719); 1H NMR (methanol‑d4, 400 MHz) and 13C NMR (methanol‑d4, 100 MHz) spectra data see Table 1. “o” means overlapped with other signals.
No.
1
2
δC
δH
δC
δH
1
75.8
75.9
2
37.9
2.01, dd (13.2, 6.9)
2.21, o38.0
2.01, dd (13.8,6.9)
2.20, o
3
70.5
4.14, m
70.4
4.11, m
4
72.7
3.73, o
72.7
3.72, o
5
72.3
5.28, m
72.3
5.28, m
6
38.0
2.13, o
2.18, o38.0
2.14, o
2.18, o
7
175.0
175.4
8
62.5
4.19, o
53.0
3.69, s
9
14.3
1.24, t (7.1)
1′
131.0
131.0
2′
115.9
7.10, d (2.0)
115.9
7.06, d (2.0)
3′
148.6
148.6
4′
149.0
149.0
5′
118.1
7.20, d (8.4)
118.1
7.20, d (8.4)
6′
122.2
7.04, dd (8.4, 2.0)
122.2
7.04, dd (8.4, 2.0)
7′
146.3
7.56, d (16.0)
146.4
7.55, d (16.0)
8′
117.3
6.32, d (16.0)
117.3
6.32, d (16.0)
9′
167.9
167.9
1″
103.5
4.85, o
103.5
4.84, o
2″
74.8
3.51, dd (9.1, 7.5)
74.8
3.50, o
3″
77.5
3.49, o
77.6
3.48, o
4″
71.3
3.42, o
71.3
3.40, o
5″
78.4
3.44, o
78.4
3.44, o
6″
62.4
3.72, dd (12.1,5.2)3.90, dd
(12.1,1.9)62.4
3.70, o3.90, dd
(12.0,1.7)
2.3.2 Chlorogenic acid methyl ester-4′-O-β-D-glucopyranoside (2)
White amorphous powder; [α]17 D −62.0 (c 0.10, MeOH); UV λmax (MeOH): 294 nm; IR νmax 3391, 2922, 1732, 1634, 1509, 1453, 1394, 1269, 1128, 1074, and 612 cm−1; HRESIMS m/z 529.1564 [M−H]− (calcd. 529.1563); 1H NMR (methanol‑d4, 400 MHz) and 13C NMR (methanol‑d4, 100 MHz) spectra data see Table 1.
2.3.3 (7R,8S)-threo-glehlinoside C (9)
White amorphous powder; [α]17 D −56.0 (c 0.10, MeOH); UV λmax (MeOH): 232, 322 nm; CD λmax (MeOH, c 0.91 mM) nm (Δε): 240 (+2.61), 302 (−0.43); IR νmax 3559, 3440, 3379, 3235, 1637, 1616, 1267, and 626 cm−1; HRESIMS m/z 551.1770 [M−H]− (calcd. 551.1770); 1H NMR (methanol‑d4, 400 MHz) and 13C NMR (methanol‑d4, 100 MHz) spectra data see Table 2. “o” means overlapped with other signals.
No.
9
10
13
δC
δH
δC
δH
δC
δH
1
137.3
137.5
137.9
2
112.5
7.12, d (1.2)
112.8
7.11, d (1.8)
111.2
7.02, d (1.8)
3
150.5
150.4
151.0
4
147.4
147.4
147.7
5
117.5
7.11, d (8.4)
117.5
7.09, d (8.4)
118.0
7.14, d (8.4)
6
120.6
6.97, dd (8.4,1.2)
121.1
6.96, dd (8.4,1.8)
119.4
6.93, dd (8.4,1.8)
7
73.5
4.94, d (4.8)
73.8
4.87, o
89.2
5.63, d (5.8)
8
85.9
4.47, m
85.3
4.49, m
55.2
3.48, o
9
61.9
3.52, dd (12.0,5.6)
3.80, o62.2
3.84, o
64.9
3.78, o
3.84, o
1′
129.8
129.7
130.3
2′
112.3
7.20, d (1.6)
112.3
7.15, d (1.9)
116.2
7.54, br. s
3′
151.7
151.8
144.9
4′
151.6
151.5
150.6
5′
117.4
7.03, d (8.4)
117.4
6.97, o
129.4
6′
123.5
7.09, dd (8.4,1.6)
123.4
7.06, o
121.4
7.20, br. s
7′
146.1
7.57, d (15.6)
146.3
7.57, d (15.9)
143.5
6.83, d (12.8)
8′
117.7
6.36, d (15.6)
117.4
6.34, d (15.9)
118.5
5.82, d (12.8)
9′
171.0
170.8
170.6
3-OCH3
56.6
3.82, s
56.6
3.80, s
56.7
3.83, s
3′-OCH3
56.7
3.88, s
56.7
3.81, s
56.7
3.87, s
1″
102.8
4.86, d (7.2)
102.9
4.83, d (7.4)
102.7
4.87, o
2″
74.9
3.48, m
74.9
3.47, o
74.9
3.48, o
3″
77.8
3.47, m
77.8
3.46, o
77.8
3.47, o
4″
71.3
3.39, o
71.3
3.39, o
71.3
3.39, o
5″
78.2
3.39, m
78.2
3.39, m
78.2
3.39, o
6″
62.5
3.68, dd (12.0,3.6)
3.86, o62.5
3.68, dd (12.2,2.6)
3.87, o62.5
3.85, o3.68, dd
(12.2,4.4)
2.3.4 2Z-(7S,8R)-aegineoside (13)
White amorphous powder; [α]18 D −6.0 (c 0.10, MeOH); UV λmax (MeOH): 207, 282 nm; CD λmax (MeOH, c 0.94 mM) nm (Δε): 238 (+2.20), 324 (+0.35); IR νmax 2930, 1701, 1599, 1514, 1267, 1220, 1073, and 548 cm−1; HRESIMS m/z 533.1664 [M−H]− (calcd. 533.1664); 1H NMR (methanol‑d4, 400 MHz) and 13C NMR (methanol‑d4, 100 MHz) spectra data see Table 2.
2.3.5 (7R,8R)-3,5-dimethoxy-8′-carboxy-7′-en-3′,8-epoxy-7,4′-oxyneolignan-4,9-diol (17)
White amorphous powder; [α]17 D –22.0 (c 0.10, MeOH); UV λmax (MeOH): 213, 288 nm; IR νmax 2027, 1637, 1616, 1119, and 622 cm−1; HRESIMS m/z 389.1240 [M+H]+ (calcd. 389.1231); 1H NMR (methanol‑d4, 400 MHz) and 13C NMR (methanol‑d4, 100 MHz) spectra data see Table 3. “o” means overlapped with other signals.
No.
17
22
40
δC
δH
δC
δH
δC
δH
1
128.3
127.9
126.2
2
106.0
6.74, br. s
132.4
7.39, d (8.6)
130.2
7.28, d (8.6)
3
149.5
116.0
6.72, d (8.6)
118.4
7.08, d (8.6)
4
137.4
159.3
158.6
5
149.5
116.0
6.72, d (8.6)
118.4
7.08, d (8.6)
6
106.0
6.74, br. s
132.4
7.39, d (8.6)
130.2
7.28, d (8.6)
7
78.3
4.94, d (8.1)
138.6
6.62, d (12.7)
22.7
3.83, s
8
79.9
4.09, m
121.1
5.82, d (12.7)
119.8
9
62.0
3.49, dd (12.4,4.3)3.72, dd
(12.4,2.4)170.5
1′
129.7
135.4
102.1
4.89, d (7.4)
2′
117.4
7.23, d (1.8)
110.8
6.97, d (1.6)
74.8
3.45, m
3′
145.2
148.9
77.8
3.45, m
4′
147.4
147.1
71.6
3.36, m
5′
118.5
6.94, d (8.4)
116.0
6.76, d (8.0)
75.3
3.64, m
6′
123.0
7.11, dd (8.4,1.8)
120.0
6.80, dd (8.0,1.6)
64.7
4.39, d (11.9,2.1)4.23, d
(11.9,6.5)
7′
145.6
7.56, d (15.9)
73.5
4.69, dd (7.7,5.1)
172.7
8′
118.1
6.34, d (15.9)
48.0
3.49, dd (13.6,5.1)3.40, dd
(13.6,7.7)20.7
2.04, s
9′
171.6
3-OCH3
56.9
3.86, s
5-OCH3
56.9
3.86, s
3′-OCH3
56.3
3.84, s
2.3.6 3-(4-hydroxy)-N-[2-(3-methoxyphenyl-4-hydroxyphenyl)-2- hydroxy]acrylamide (22)
White amorphous powder; [α]17 D −4.0 (c 0.10, MeOH); IR νmax 1638, 1617, 1515, and 622 cm−1; HRESIMS m/z 328.1183 [M−H]− (calcd. 328.1190); 1H NMR (methanol‑d4, 600 MHz) and 13C NMR (methanol‑d4, 150 MHz) spectra data see Table 3.
2.3.7 p-hydroxyphenylacetonitrile-O-(6′-O-acetyl)-β-D-glucopyranoside (40)
White amorphous powder; [α]20 D + 30.0 (c 0.10, MeOH); UV λmax (MeOH): 224, 291 nm; IR νmax 2027, 1639, 1617, 1235, 1077, and 626 cm−1; HRESIMS m/z 355.1493 [M+NH4]+ (calcd. 355.1500); 1H NMR (methanol‑d4, 600 MHz) and 13C NMR (methanol‑d4, 150 MHz) spectra data see Table 3.
2.4 X-ray crystallographic analysis
The crystals of 1 were recrystallized from methanol. X-ray analyses of 1 were carried out on a Bruker D8 Venture diffractometer with Cu Kα radiation. The crystallographic data for compounds 1 (deposition No. CCDC 2133149) has been deposited at the Cambridge Crystallographic Data Center.
chlorogenic acid ethyl ester-4′-O-β-D-glucopyranoside (1). 2(C24H32O14), 2(H2O), M = 1125.02, T = 193 K, V = 1452.84(14), Dcalcd = 1.286 g/cm3, Z = 1, monoclinic, p1211, a = 13.5031(9) Å, b = 6.1589(3) Å, c = 17.9871(9) Å, α = γ = 90°, β = 103.778(4)°, F(0 0 0) = 596.0, 2.529° ≤ θ ≤ 81.283°, −16 ≤ h ≤ 16, −7 ≤ k ≤ 7, −20 ≤ l ≤ 22, Flack parameter: 0.19(13).
2.5 NMR calculations
The theoretical calculations of 22 were performed by Gaussian 09. Conformation search was performed using the program Conflex 7 Rev. C. NMR calculations of 22 were calculated with the GIAO method at mPW1PW91/6-31G*//B3LYP/6-31G* (in the gas phase) and mPW1PW91/6-31G**//B3LYP/6-31G* levels (in methanol with PCM model). The shielding constants (13C and 1H) obtained were performed statistical analyses with experimental data by using DP4+ probability (Grimblat et al., 2015).
2.6 Acid hydrolysis and GC analysis
The compounds (1, 2, 9, 13, and 40) (1.0 mg each) were individually hydrolyzed and treated by the same method as described in the previous paper from this laboratory (Yin et al., 2019). The presence of D-glucose of compounds 1, 2, 9, 13, and 40 was finally confirmed by comparing the retention time with the authentic sample analyzed by Agilent 7890A GC–MS system using a DM-5 column (30 m × 0.25 mm, 0.25 μm).
2.7 Anti-inflammatory assays
The RAW 264.7 cells were cultured in the DMEM medium with 10% FBS in 96-well plates (5 × 10⁴/well) for 24 h. Then, the RAW264.7 cells were divided into four groups containing the control group, the model group (1 μg/mL LPS), the positive control group (1 μg/mL LPS and indomethacin at final concentrations of 1.25, 2.5, 5, 10, 20 μM/mL), and the sample group (1 μg/mL LPS and the test compounds at final concentrations of 5, 10, 20, 30, 50 μM/mL) for 24 h. The NO concentration in the culture medium was measured by the Griess reagent at 540 nm (Fu et al., 2021).
2.8 Molecular docking studies
Molecular docking simulations were performed by the software Autodock 4.2.6 using the hybrid Lamarckian Genetic Algorithm. The three-dimensional crystal structure of iNOS (PDB ID: 3E6T) was obtained from the RCSB Protein Data Bank (https://www.rcsb.org/) (Zhang et al., 2020). The three-dimensional structures (“pdb” format) of ligands were constructed and the energy was minimized by Chem3D Pro 14.0. The proteins and ligands were processed by AutoDockTools 1.5.6 and converted to “pdbqt” format. The search was extended over the whole receptor protein used as blind docking. Pymol 2.6.0 was applied to visualize the interactions between ligands and receptors.
2.9 Bioinformatic analysis
The database of UniProt (https://www.uniprot.org/) was used to construct inflammation-related target libraries by performing automated searches using keywords including “inflammation” and “inflammatory”. The molecular targets for the “Homo sapiens” species of all isolated compounds were predicted through SwissTargetPrediction (https://www.swisstargetprediction.ch/) web tool. The compound targets and inflammation-related targets were set as the background lists to get the overlapping targets using Venn diagrams (https://bioinformatics.psb.ugent.be/webtools/Venn/) web tool. Cytoscape3.7.2 software was used to import the data to construct and visualize the compound-target network.
3 Results and discussion
3.1 Isolation and identification of compounds
51 phenolic compounds (Fig. 1) including seven new compounds (1, 2, 9, 13, 17, 22, and 40) and 44 known compounds were isolated from Solanum xanthocarpum fruits. These structures of the new compounds were identified by NMR and HRESIMS, and their configurations were determined by CD spectra or X-ray diffraction data.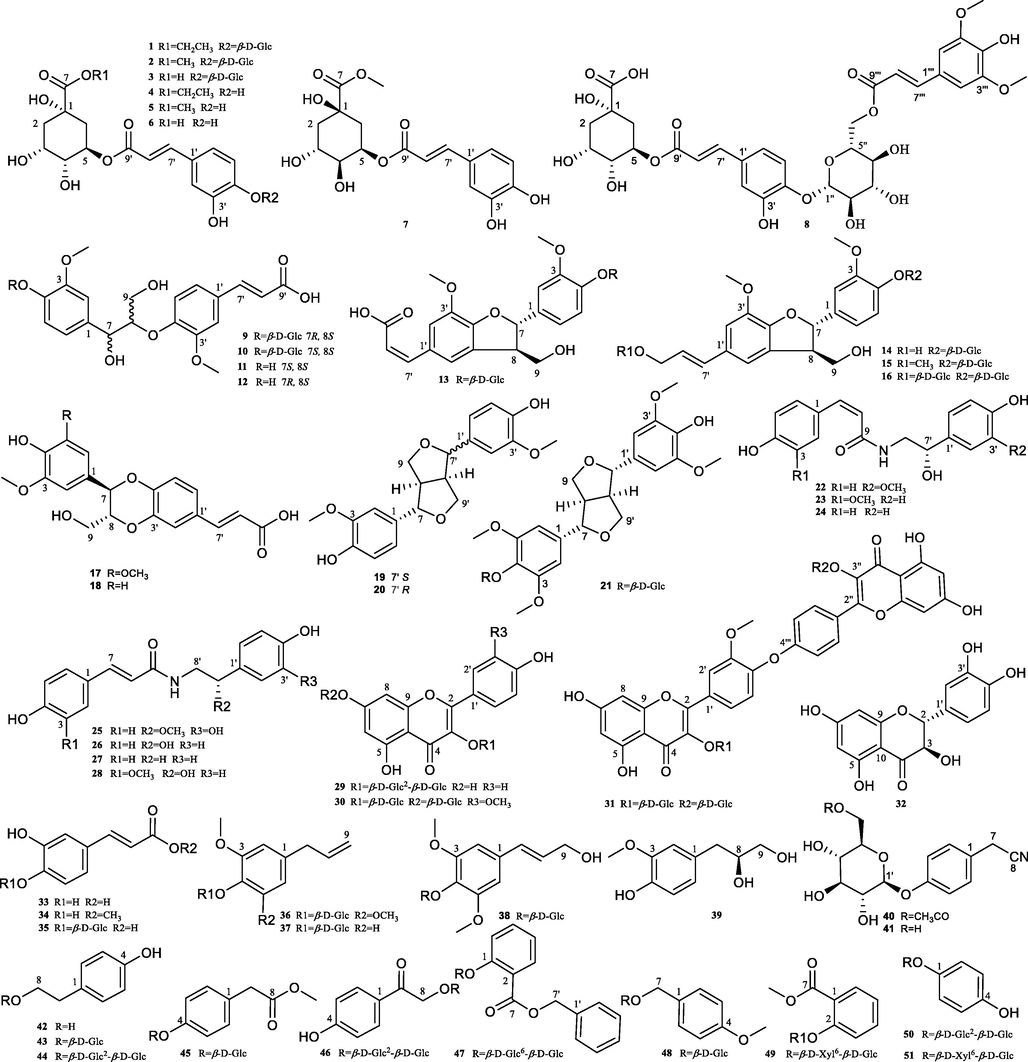
Chemical structures of compounds 1–51.
By comparison of their experimental and reported NMR data, the known compounds were identified as 5-O-(4′-O-caffeoyl glycosyl)-quinic acid (3) (Crupi et al., 2018), chlorogenic acid ethyl ester (4) (Li et al., 2017), chlorogenic acid methyl ester (5) (Zhang et al., 2013b), chlorogenic acid (6) (Lee et al., 2010), neochlorogenic acid methyl ester (7) (Zhu et al., 2005), 1β,3β,4β-trihydroxy-5α-[[3-[4-[1β-(6-O-(E)-sinapoyl-β-D- glucopyranosyl)oxy]-3-hydroxyphenyl]-(E)-1-oxo-2-propenyl]oxy] cyclohexanecarboxylic acid (8) (Ma et al., 2010), (7S,8S)-erythro-glehlinoside C (10) (Yuan et al., 2002), (7S,8S)-erythro-guaiacylglycerol-β-ferulic acid ether (11) (Liu et al., 2018), (7R,8S)-threo-guaiacylglycerol-β-ferulic acid ether (12) (Liu et al., 2018), dehydrodiconiferyl alcohol-4-O-β-D-glucopyranoside (14) (Iclal et al., 2003), dehydrodiconiferyl alcohol 9′-methyl ether-4-O-β-D-glucoside (15) (Xiao et al., 2017), (7S,8R)-dehydrodiconiferyl alcohol 4,9′-di-O-β-D-glucopyranoside (16) (Wang et al., 2017), (7R,8R)-3-methoxy-8′-carboxy-7′-en-3′,8-epoxy-7,4′-oxyneolignan- 4,9-diol (18) (Zhou et al., 2015), pinonesinol (19) (Zhou et al., 2004), epipinoresinol (20) (Yang et al., 2015), (−)-syringaresinol-4-O-β-D-glucopyranoside (21) (Ding et al., 2011), N-cis-feruloyloctopamine (23) (Yin et al., 2018), N-cis-p-coumaroyloctopamine (24) (Yang et al., 2018), melongenamide H (25) (Zhao et al., 2021), N-trans-p-coumaroyloctopamine (26) (Zhao et al., 2021), trans-N-coumaroyltyramine (27) (Al-Taweel et al., 2012), N-trans-feruloyloctopamine (28) (Li et al., 2009), sophoraflavonoloside (29) (Abdallah et al., 2014), isorhamnetin 3,7-O-di-β-D-glucopyranoside (30) (Sasaki and Takahashi, 2002), solanoflavone (31) (Shen et al., 2005), (+)-taxifolin (32) (Shen et al., 2010), caffeic acid (33) (Chen et al., 2008), caffeic acid methyl ester (34) (Zhao et al., 2002), caffeic acid 4-O-β-D-glucopyranoside (35) (Liang et al., 2010), 4-allyl-2,6-dimethoxyphenol glucoside (36) (Li et al., 2004), citrusin C (37) (Takeda et al., 1998), syringin (38) (Zhao et al., 2006), 3-(4-hydroxy-3-methoxy phenyl)propan-1,2-diol (39) (Uyang et al., 2007), hydranitriloside B2 (41) (Wang et al., 2011), 2-(4-hydroxyphenyl)-ethanol (42) (Lou et al., 2001), salidroside (43) (Saimaru and Orihara, 2010), 2-(4-hydroxyphenyl) ethanol-O-β-D-glucopyranosyl-(1 → 2)-O-β-D-glucopyranoside (44) (Kuang et al., 2018), (methoxycarbonylmethyl)phenyl-4-O-β-D-glucopyranoside (45) (Liang et al., 2013), 2-(sophorosyl)-1- (4-hydroxyphenyl) ethanone (46) (Jin et al., 2014), foliachinenosides A2 (47) (Nakamura et al., 2008), 4-methoxybenzyl-β-D-glucopyranoside (48) (Zhang et al., 2013a), gaultherin (49) (He et al., 2017), 4-hydroxyphenyl β-D-glucopyranosyl-(1 → 2)-β-D-glucopyranoside (50) (Ono et al., 2008), p-hydroxyphenyl-O-β-D-primeveroside (51) (Ralf et al., 1993). Among them, 40 compounds 3–8, 10–12, 14–16, 18–21, 23–25, 28–32, 35–39, 41–51 were isolated from Solanum xanthocarpum for the first time.
Compound 1, colorless crystals, gave the molecular formula of C24H32O14 based on its HRESIMS spectrum (m/z 543.1720 [M−H]−, calcd. 543.1719). The 1H NMR data (Table 1) showed the presence of a set of ABX systems at δH 7.20 (H-5′), 7.10 (H-2′), and 7.04 (H-6′), and two olefinic protons at δH 7.56 (H-7′) and 6.32 (H-8′). Two methylene signals at δH 2.21 (H-2a), 2.01 (H-2b), 2.18 (H-6a), and 2.13 (H-6b), and a methyl signal at δH 1.24 (H-9) were also observed. In addition, 12 proton signals at δH 3.42–5.28 implied the presence of a β-glucose and 3 oxo-methine signals, an oxo-methylene signals of the aglycone. Its 13C NMR spectrum (Table 1) indicated the presence of 24 carbons including a group of β-glucose at δC 103.5, 78.4, 77.5, 74.8, 71.3, 62.4, and an alcohol group at δC 62.5, 14.3. The remaining 16 carbons were consistent with those of chlorogenic acid (6) (Lee et al., 2010). The HMBC correlations from δH 4.85 (H-1″) to 149.0 (C-4′), δH 4.19 (H-8) to 175.0 (C-7) established the connection of the β-glucose and the alcohol group to the chlorogenic acid unit. Assignments of all groups of 1 were achieved by HSQC, 1H–1H COSY, and HMBC data (Fig. 2). A thin crystal of 1 was obtained from methanol, and X-ray diffraction analysis was performed with Cu Kα (Fig. 3). Hence, the absolute configurations of 1 were unambiguously determined to be 1S, 3R, 4R, and 5R consistent with them of chlorogenic acid. Therefore, the structure of 1 was identified as chlorogenic acid ethyl ester-4′-O-β-D-glucopyranoside. Compound 1 was confirmed to be an artificial product by analysis of the 70% methanol extract of Solanum xanthocarpum fruits by UHPLC-MS (Figs. S154–S155).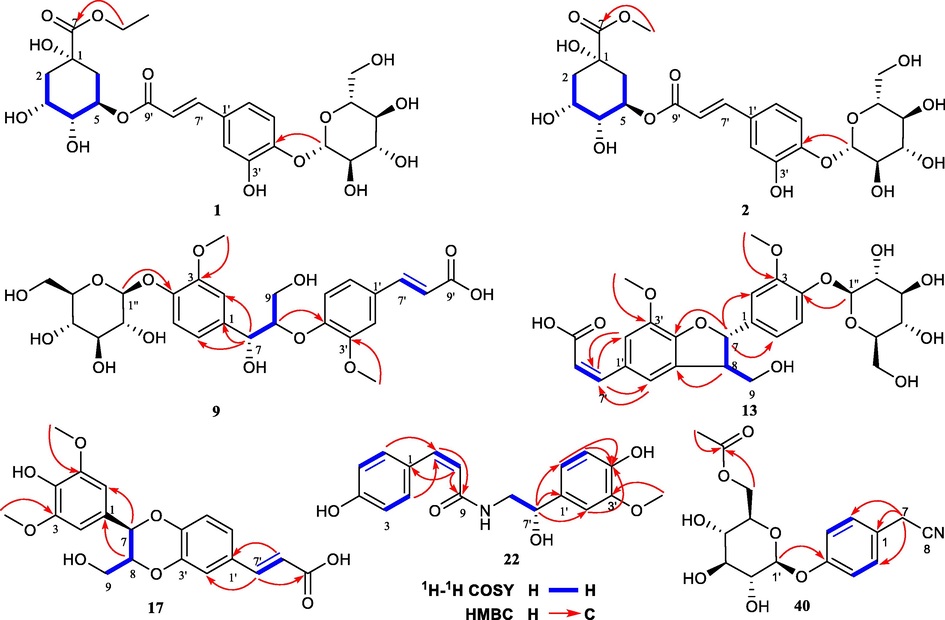
1H–1H COSY and key HMBC correlations of compounds 1, 2, 9, 13, 17, 22, and 40.
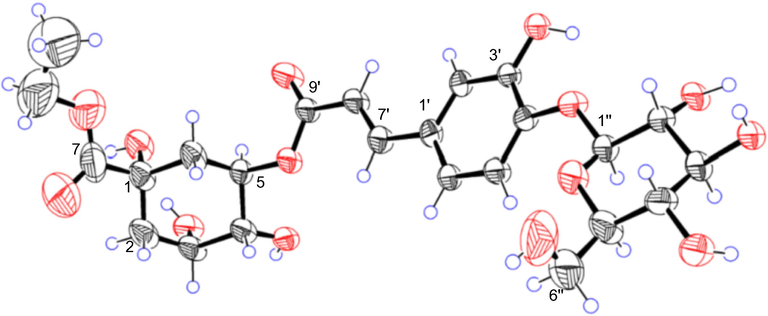
Single-crystal X-ray structure of 1.
Compound 2 was purified as a white amorphous powder with the molecular formula of C23H30O14, deduced from the HRESIMS data (m/z 529.1564 [M−H]−, calcd. 529.1563). The 1D NMR data (Table 1) of 2 were virtually identical to those of 1, apart from the extra methyl group instead of the alcohol group. The structure was supported by the key HMBC correlations (Fig. 2) from δH 3.69 (H-8) to 175.4 (C-7). The stereochemistry of 2 was determined to be the same as 1 based on the biogenetic considerations and by comparison the NMR spectra. Thus, the structure of 2 was established as chlorogenic acid methyl ester-4′-O-β-D-glucopyranoside.
Compound 9 was purified as a white amorphous powder with the molecular formula of C26H32O13, deduced from the positive HRESIMS data (m/z 551.1770 [M−H]−, calcd. 551.1770). The 1D NMR data (Table 2) showed high similarity to those of 10 with the main exception being at C-6 to C-9. Inspection of 1D and 2D NMR of 9 revealed that the compound possessed the same planar structure as that of 10 (Fig. 2). We could conclude that 9 and 10 are diastereomers with different configurations at C-7 and C-8. Compound 10 could be intended to be glehlinoside C (Yuan et al., 2002), but the configurations at C-7 and C-8 of glehlinoside C have not been identified in the literature. The relative configuration between C-7 and C-8 in 9 and 10 were determined by the well-established empirical rules in three different ways (Joon et al., 2021). First, the δH9a-H9b value of threo-isomers is larger than that of erythro-isomers. As shown in Table 2, we observed the bigger δH9a-H9b value in 9 (0.28 ppm) than that in 10 (signals of δH9a and δH9b are overlapped). Second, ΔδC8-C7 of threo-isomer (12.4 ppm of 9) was bigger than that of erythro-isomer (11.5 ppm of 10). Finally, the conventional method comparing coupling constants between H-7 and H-8 was applied to confirm their relative configuration (Antonio et al., 1984). Collectively, based on these three different empirical rules the relative configuration between C-7 and C-8 were assigned as threo for 9 and as erythro for 10. The absolute configurations of 9 and 10 were assigned by CD data analysis. The positive and negative Cotton effects at ∼230–240 nm indicate 8S and 8R configuration, respectively, in 8-O-4′ neolignan derivatives (Huo et al., 2008). Observing a positive Cotton effect at 240 nm from 9 (Fig. S25) and 238 nm from 10 (Fig. S73), we assigned the absolute configuration of 9 and 10 as 8S. Collectively, the structure of 9 was elucidated as (7R,8S)-threo-glehlinoside C, and the structure of 10 was further elucidated as (7S,8S)-erythro-glehlinoside C. Compounds 11 and 12 as the aglycone of compounds 10 and 9 respectively were further elucidated as (7S,8S)-erythro-guaiacylglycerol-β-ferulic acid ether (11) and (7R,8S)-threo-guaiacylglycerol-β-ferulic acid ether (12).
Compound 13 was obtained as a white amorphous powder with a molecular formula of C26H30O12 as determined by the HRESIMS (m/z 533.1664 [M−H]−, calcd. 533.1664). The 1H NMR data of 13 (Table 2) showed a set of ABX systems at δH 7.14 (H-5), 7.02 (H-2), and 6.93 (H-6), and two meta-aromatic protons at δH 7.54 (H-2′) and 7.20 (H-6′). Two olefinic protons at δH 6.83 (H-7′) and 5.82 (H-8′) were observed, and the Z stereochemistry was assigned based on the coupling constants between H-7′ and H-8′ (12.8 Hz). In addition, the presence of two methoxyl signals at δH 3.87 (3′-OCH3) and δH 3.83 (3-OCH3) was observed. The 13C NMR data of 13 (Table 2) showed 26 carbon signals including a group of β-glucose at δC 102.7, 78.2, 77.8, 74.9, 71.3, 62.5, and two methoxyl signals at δC 56.7 (3′-OCH3 and 3-OCH3). The remaining 18 carbons suggested that it may be a homodimer consisting of two phenylpropyl units. The 1H–1H COSY correlations (Fig. 2) of 13 established the connection of C-7—C-8—C-9. The HMBC correlations (Fig. 2) from δH 5.63 (H-7) to 111.2 (C-2), 119.4 (C-6), and 150.6 (C-4′), and from δH 3.48 (H-8) to 129.4 (C-5′) confirmed the presence of a pyranoid ring. Then 13 was elucidated as a benzofuran type neolignan. In addition, the HMBC correlations from δH 4.87 (H-1″) to 147.7 (C-4), δH 3.87 (3′-OCH3) to 144.9 (C-3′), and δH 3.83 (3-OCH3) to 151.0 (C-3) established the connection of the β-glucose and two methoxyl. From the JH7, H8 (5.8 Hz) coupling constant of 13, it was exhibited that the configurations of H-7 and H-8 were trans. Observing a positive Cotton effect at 238 nm from 13 (Fig. S34), the absolute configuration of 7S, 8R were assigned (Lemiére et al., 1995; Noriko et al., 1996). Therefore, compound 13 was identified as Z-(7S,8R)-aegineoside.
Compound 17 was obtained as a white amorphous powder with a molecular formula of C20H20O8 as determined by the HRESIMS (m/z 389.1240 [M+H]+, calcd. 389.1231). The 13C NMR spectroscopic features of 17 (Table 3) were similar to those of the known compound (7R, 8R)-3-methoxy-8′-carboxy-7′-en-3′, 8-epoxy-7, 4′-oxyneolignan-4, 9-diol (18), except for one more methoxy signal at δC 56.9 in 17. Moreover, the 1H NMR spectrum showed that two meta-aromatic protons at δH 6.74 (H-2 and H-6) appeared in 17 (Table 3) instead of a set of ABX systems at δH 7.01 (H-2′), 6.91 (H-6′), and 6.84 (H-5′) in 18 (Fig. S84). Therefore, 17 was speculated to have one more methoxy group at C-5, which was further confirmed by the HMBC correlation from δH 3.86 (5-OCH3) to δC 149.5 (C-5) (Fig. 2). From the NOESY correlations (Fig. 4) of H-7 (δH 4.94) / H-9a (δH 3.49) and H-7 (δH 4.94) / H-9b (δH 3.72), it was exhibited that the configurations of H-7 and H-8 were trans. The configurations of C-7 and C-8 of compound 17 were further determined to be 7R and 8R consistent with that of compound 18 based on NMR / OR data comparison and biosynthesis (Zhou et al., 2015). Accordingly, compound 17 was characterized as (7R,8R)-3,5-dimethoxy-8′-carboxy-7′-en-3′,8-epoxy-7,4′-oxyneolignan-4,9-diol.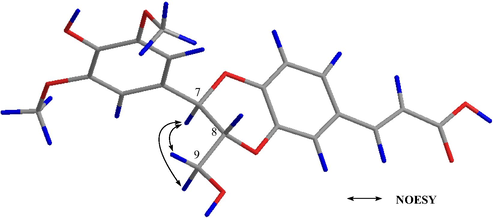
Key NOESY correlations of compound 17.
Compound 22 was obtained as a white amorphous powder. It showed an [M−H]− ion at m/z 328.1183 (calcd. 328.1190) in the HRESIMS spectrum, giving a molecular formula of C18H19NO5. The HMBC correlation from δH 3.84 (3′-OCH3) to δC 148.9 (C-3′) (Fig. 2), and comparison with the known compound N-cis-p-coumaroyloctopamine (24) confirmed that compound 22 had an extra methoxy group connected to C-3′.
The configurations of C-7′ of compound 22 were determined by an NMR calculation with DP4+ analysis. The shielding tensors of two possible isomers 7′R and 7′S were predicted using the GIAO method at the mPW1PW91/6-31G*//B3LYP/6-31G* (in the gas phase) and mPW1PW91/6-31G**//B3LYP/6-31G* (in methanol) levels. The results showed that 7′R was the most likely candidate structure (Fig. 5, Figs. S157-158). Thus, the configurations of C-7′ of compound 22 were determined to be 7′R. The structure of compound 22 was determined as 3-(4-hydroxy)-N-[2-(3-methoxyphenyl-4-hydroxyphenyl)-2- hydroxy]acrylamide.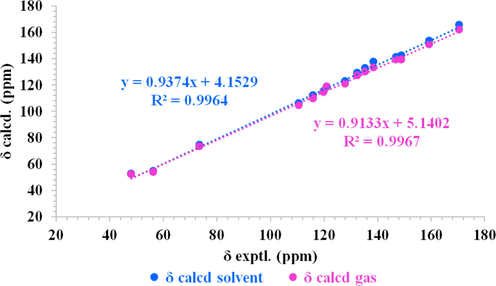
Linear correlation plots of calculated and experimental 13C NMR data of compound 22.
Compound 40, amorphous powder, possesses a molecular formula of C16H19NO7 based on its HRESIMS m/z 355.1493 [M+NH4]+ (calcd. 355.1500). According to the 1H and 13C NMR spectra, the aglycone of compound 40 is the same as that of hydranitriloside B2 (41). There is an extra acetyl group connected to the hydroxy group of C-6′ in 40, which was determined by the HMBC correlations from δH 4.23 (H-6′) to δC 172.7 (C-1″) (Fig. 2). Compound 40 was therefore identified as p-hydroxyphenylacetonitrile-O-(6′-O-acetyl)-β-D-glucopyranoside.
3.2 Anti-inflammatory effects
Nitric oxide (NO) is known to be a potent pro-inflammatory mediator and possesses a dual regulatory function in the inflammatory reaction (Lee et al., 2017a; Lee et al., 2018). NO plays anti-inflammatory roles under normal physiological conditions, however, excessive production of NO has been found associated with various inflammatory disorders (Hu et al., 2020; Tang et al., 2020). Considering the traditional efficacy of Solanum xanthocarpum and the goal to obtain NO inhibitors to treat the inflammatory disorder, the inhibitory effects of compounds 1–51 isolated from Solanum xanthocarpum fruits on NO production in LPS-induced RAW 264.7 macrophages were evaluated. Indomethacin, a non-steroidal anti-inflammatory drug, was selected as a standard control. As showed in Table 4, compounds 3–7, 11–30, 32–37, 39, 40, 42, 43, 45, and 48–51 exerted the significant inhibition of LPS-induced NO production in RAW 264.7 cells, with IC50 values ranging from 10.46 to 47.59 μM. New compounds 9, 13, 17, 22, and 40 showed outstanding activity, especially 13 (IC50 12.33 μM) and 22 (IC50 12.23 μM).
No.
IC50 (μM)
No.
IC50 (μM)
No.
IC50 (μM)
No.
IC50 (μM)
1
> 50
14
18.21 ± 1.93
27
17.52 ± 1.70
40
24.76 ± 1.97
2
> 50
15
22.57 ± 2.09
28
21.68 ± 2.35
41
>50
3
38.35 ± 4.01
16
34.68 ± 3.81
29
42.72 ± 4.31
42
25.78 ± 2.41
4
18.54 ± 1.94
17
19.69 ± 1.91
30
27.56 ± 2.62
43
47.59 ± 4.63
5
15.10 ± 1.59
18
14.73 ± 1.42
31
> 50
44
> 50
6
11.97 ± 1.25
19
21.63 ± 1.94
32
10.46 ± 1.13
45
30.07 ± 2.99
7
19.83 ± 1.83
20
24.75 ± 2.46
33
15.31 ± 1.52
46
> 50
8
> 50
21
29.74 ± 2.92
34
13.03 ± 1.32
47
> 50
9
> 50
22
12.23 ± 1.20
35
26.33 ± 2.76
48
20.86 ± 2.34
10
> 50
23
15.75 ± 1.34
36
40.87 ± 4.22
49
26.23 ± 2.87
11
19.72 ± 1.81
24
12.22 ± 1.19
37
28.14 ± 2.67
50
32.36 ± 3.12
12
15.03 ± 1.51
25
19.45 ± 1.84
38
> 50
51
38.44 ± 3.74
13
12.33 ± 1.21
26
16.32 ± 1.78
39
25.16 ± 2.63
indomethacin
2.24 ± 0.26
3.3 Molecular docking studies
The release of NO is mainly regulated by eNOS, nNOS, and iNOS, of which iNOS is vital to the release of NO and regulates the amount of NO in inflammatory processes (Lee et al., 2017b). To investigate the possible mechanism inhibiting NO production, molecular docking studies were conducted to investigate the interactions between the bioactive compounds and iNOS proteins. The bioactive compounds 3–7, 11–30, 32–37, 39, 40, 42, 43, 45, and 48–51 were selected for molecular docking studies, and the results revealed that almost all compounds had good affinities [Log (FBE) < -5 kJ/mol] with iNOS proteins (Table S2). Especially, compounds 17–20, 26–27, 32, and 34 showed strong affinities with iNOS proteins, with affinities comparable to indomethacin (Table S2 and Fig. 6).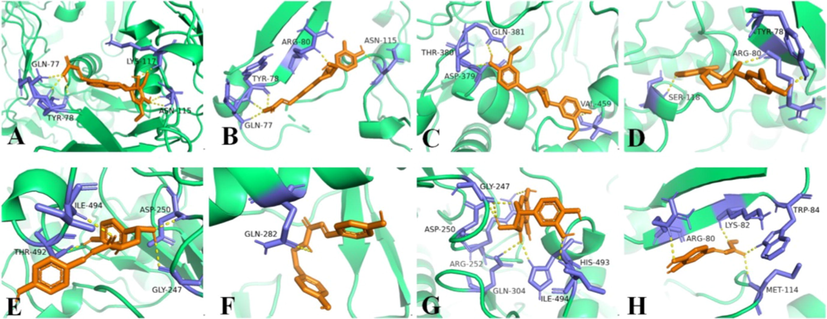
Molecular docking simulations of compounds 17 (A), 18 (B), 19 (C), 20 (D), 26 (E), 27 (F), 32 (G), and 34 (H) with iNOS (3HR4). The hydrogen bonds interactions are shown by yellow dashed lines.
3.4 Bioinformatic analysis
A total of 1958 inflammation-related targets were identified from UniProt. 398 possible targets for the “Homo sapiens” species of 42 compounds were attained by using SwissTargetPrediction to screen and remove repetition. Fig. 7 shows the Venn diagram of the compound and inflammation targets, such that the common part of the two was regarded as to include potential anti-inflammatory targets. There were 111 overlapping targets between the compound targets and inflammation-related targets. The correlations between the compound targets and overlapping targets were constructed and visualized by Cytoscape 3.7.2 software (Fig. 8 and Table S1). The results show that the 9 targets with a higher degree value among the anti-inflammatory targets are adenosine receptor A2a (P29274, degree = 18), adenosine receptor A1 (P30542, degree = 16), 72 kDa type IV collagenase (P08253, degree = 15), adenosine receptor A3 (P0DMS8, degree = 14), matrix metalloproteinase-9 (P14780, degree = 13), prostaglandin G/H synthase 2 (P35354, degree = 12), prostaglandin G/H synthase 1 (P23219, degree = 11), cannabinoid receptor 2 (P34972, degree = 10), and epidermal growth factor receptor (P00533, degree = 10), which play a major role in the network.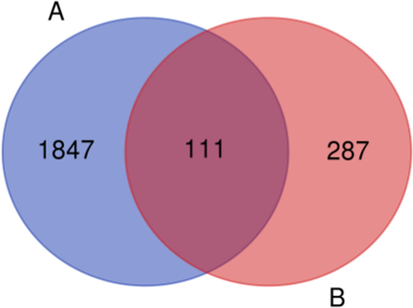
Venn diagram containing the inflammation-related targets (A) and compounds-related targets (B).
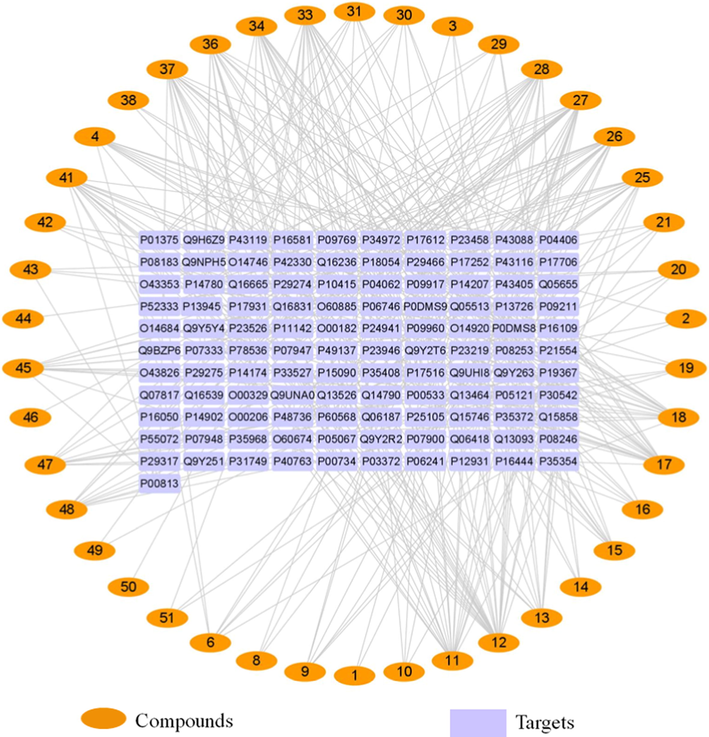
Compound-target network diagram.
4 Conclusions
The present work first systemically isolated and identified the phenolic compounds from the fruits of Solanum xanthocarpum. In conclusion, 51 phenolic compounds including seven new compounds 1, 2, 9, 13, 17, 22, and 40 and 40 known compounds 3–8, 10–12, 14–16, 18–21, 23–25, 28–32, 35–39, 41–51 firstly isolated from Solanum xanthocarpum. Biological studies disclosed that most isolates exhibited significant anti-inflammatory effects by inhibiting LPS-induced NO production, especially (+)-taxifolin (32), chlorogenic acid and its derivatives (4–7), caffeic acid and its derivatives (33–34), phenylacrylamides (22–28), and some lignans (11–14, 17, 18). Molecular docking revealed that compounds 17–20, 26–27, 32, and 34 showed strong affinities with iNOS proteins by targeting the residues of the active cavities of iNOS, with affinities comparable to the positive control indomethacin. In addition, bioinformatic analysis disclosed that phenolic compounds may act on many other inflammation-related targets, and adenosine receptor A2a, adenosine receptor A1, 72 kDa type IV collagenase, adenosine receptor A3, matrix metalloproteinase-9, prostaglandin G/H synthase 2, prostaglandin G/H synthase 1, cannabinoid receptor 2, and epidermal growth factor receptor may be the key anti-inflammatory targets. These findings supported the phenolic compounds as the important anti-inflammatory ingredients of Solanum xanthocarpum fruits, which provide the scientific basis for the sustainable development and usage of the resources of Solanum xanthocarpum.
Acknowledgments
This work was financially supported by the Heilongjiang Touyan Innovation Team Program.
Declaration of Competing Interest
The authors declare that they have no known competing financial interests or personal relationships that could have appeared to influence the work reported in this paper.
References
- Isolation of antiosteoporotic compounds from seeds of Sophora japonica. PLoS ONE. 2014;9(6):e98559.
- [CrossRef] [Google Scholar]
- Bioactive phenolic amides from Celtis africana. Molecules. 2012;17(3):2675-2682.
- [CrossRef] [Google Scholar]
- Phenolic compounds: Natural alternative in inflammation treatment. A Review, Cogent Food Agr.. 2016;2(1):1131412.
- [CrossRef] [Google Scholar]
- 13C NMR spectral and conformational analysis of 8-O-4′ neolignans. Phytochemistry. 1984;23(9):2025-2028.
- [CrossRef] [Google Scholar]
- Date palm and saw palmetto seeds functional properties: antioxidant, anti-inflammatory and antimicrobial activities. J. Food Meas. Charact.. 2020;14:1064-1072.
- [CrossRef] [Google Scholar]
- Identification of phenolic antioxidants from Sword Brake fern (Pteris ensiformis Burm.) Food Chem.. 2008;105(1):48-56.
- [CrossRef] [Google Scholar]
- Comprehensive identification and quantification of chlorogenic acids in sweet cherry by tandem mass spectrometry techniques. J. Food Compos. Anal.. 2018;73:103-111.
- [CrossRef] [Google Scholar]
- Chemical constituents from Artemisia iwayomogi increase the function of osteoblastic MC3T3-E1 cells. Nat. Prod. Sci.. 2011;15(4):92-197.
- [Google Scholar]
- Water-soluble alkaloids isolated from Portulaca oleracea L. Bioorg. Chem.. 2021;113:105023.
- [CrossRef] [Google Scholar]
- Beyond DP4: an Improved Probability for the Stereochemical Assignment of Isomeric Compounds using Quantum Chemical Calculations of NMR Shifts. J. Org. Chem.. 2015;80:12526-12534.
- [CrossRef] [Google Scholar]
- Chemical constituents from anti-inflammatory and analgesic active fraction of Gaultheria leucocarpa var. yunnanensis. Chinese Trad. Herbal Drugs. 2017;48(17):3469-3474.
- [CrossRef] [Google Scholar]
- Novel paeonol derivatives: Design, synthesis and anti-inflammatory activity in vitro and in vivo. Bioorg. Chem.. 2020;98:103735.
- [CrossRef] [Google Scholar]
- Neolignan glycosides from Symplocos caudata. Phytochemistry. 2008;69(3):788-795.
- [CrossRef] [Google Scholar]
- Neolignan, Flavonoid, Phenylethanoid and Iriloid Glycosides from Phlomis integrifolia. Turk. J. Chem.. 2003;27(6):739-747.
- [Google Scholar]
- A new phenyl glycoside from the aerial parts of Equisetum hyemale. Nat. Prod. Res.. 2014;28(21):1813-1818.
- [CrossRef] [Google Scholar]
- Isolation and structural characterization of four diastereomeric lignan glycosides from Abies holophylla and their neuroprotective activity. Tetrahedron. 2021;77:131735.
- [CrossRef] [Google Scholar]
- Studies on hypoglycaemic activity of Solanum xanthocarpum Schrad. & Wendl. fruit extract in rats. J. Ethnopharmacol.. 2006;108(2):251-256.
- [CrossRef] [Google Scholar]
- Chemical constituents from Sambucus williamsii Hance fruits and hepatoprotective effects in mouse hepatocytes. Nat. Prod. Res.. 2018;32(17):2008-2016.
- [CrossRef] [Google Scholar]
- Phenolic constituents from the flower buds of Lonicera japonica and their 5-lipoxygenase inhibitory activities. Food Chem.. 2010;120(1):134-139.
- [CrossRef] [Google Scholar]
- Bioactivity-guided Isolation of Anti-inflammatory Constituents of the Rare Mushroom Calvatia nipponica in LPS-stimulated RAW264.7 Macrophages. Chem. Biodivers.. 2018;15(9):e1800203.
- [CrossRef] [Google Scholar]
- Anti-inflammatory activity of the sclerotia of edible fungus, Poria cocos Wolf and their active lanostane triterpenoids. J. Funct. Foods. 2017;32:27-36.
- [CrossRef] [Google Scholar]
- Bioactivity-guided isolation of anti-inflammatory triterpenoids from the sclerotia of Poria cocos using LPS-stimulated Raw264.7 cells. Bioorg. Chem.. 2017;70:94-99.
- [CrossRef] [Google Scholar]
- 3′,4-Di-O-methylcedrusin: synthesis, resolution and absolute configuration. J. Chem. Soc., Perkin Trans.. 1995;1(13):1775-1779.
- [CrossRef] [Google Scholar]
- New homoisoflavanones from Polygonatum odoratum (Mill.) Druce, Acta. Pharm. Sin. B. 2009;44(7):764-767.
- [Google Scholar]
- Chemical constituents from leaves of Uncaria rhynchophylla. Chinese Trad. Herbal Drugs. 2017;48(8):1499-1505.
- [CrossRef] [Google Scholar]
- Study on the chemical constituents of Saussurea lappa. Chin. J. Nat. Med.. 2004;2(1):62-64.
- [Google Scholar]
- Bioactive carboxylic acids from Lysimachia clethroides. J. Asian Nat. Prod. Res.. 2013;15(1):59-66.
- [CrossRef] [Google Scholar]
- Two new phenolic acids from Drynariae rhizoma. Yao Xue Xue Bao. 2010;45(7):874-878.
- [Google Scholar]
- Chemical constituents from Gueldenstaedtia verna and their anti-inflammatory activity. Nat. Prod. Res.. 2018;32(10):1145-1149.
- [CrossRef] [Google Scholar]
- Alkaloids and flavonoids from peanut skins. Planta Med.. 2001;67(4):345-349.
- [CrossRef] [Google Scholar]
- New 5-O-Caffeoylquinic Acid Derivatives in Fruit of the Wild Eggplant Relative Solanum viarum. J. Agr. Food. Chem.. 2010;58(20):11036-11042.
- [CrossRef] [Google Scholar]
- Evaluation of anti-inflammatory activity of Solanum xanthocarpum Schrad and Wendl (Kaṇṭakāri) extract in laboratory animals. Anc. Sci. Life. 2013;32(4):222-226.
- [CrossRef] [Google Scholar]
- New phenolic glycosides from the leaves of Salacia chinensis. Heterocycles. 2008;75(6):1435-1446.
- [CrossRef] [Google Scholar]
- Isolation and absolute structures of the neolignan glycosides with the enantiometric aglycones from the leaves of Viburnum awabuki K. KOCH. Chem. Pharm. Bull.. 1996;44(5):1122-1123.
- [CrossRef] [Google Scholar]
- A new steroidal glycoside and a new phenyl glycoside from a ripe cherry tomato. Chem. Pharm. Bull.. 2008;56(10):1499-1501.
- [CrossRef] [Google Scholar]
- Anti-psoriatic potential of Solanum xanthocarpum stem in Imiquimod-induced psoriatic mice model. J. Ethnopharmacol.. 2017;198:158-166.
- [CrossRef] [Google Scholar]
- Evaluation of antioxidant and stabilizing lipid peroxidation nature of Solanum xanthocarpum leaves in experimentally diethylnitrosamine induced hepatocellular carcinogenesis. Biomed. Pharmacother.. 2016;84(1):430-437.
- [CrossRef] [Google Scholar]
- p-Hydroxyphenyl-O-β-D-primeveroside, a Novel Glycoside Formed from Hydroquinone by Cell Suspension Cultures of Rauwolfia serpentina. J. Nat. Prod.. 1993;56(8):1421-1422.
- [CrossRef] [Google Scholar]
- Biosynthesis of acteoside in cultured cells of Olea europaea. J. Nat. Med.-Tokyo. 2010;64(2):139-145.
- [CrossRef] [Google Scholar]
- A flavonoid from Brassica rapa flower as the UV-absorbing nectar guide. Phytochemistry. 2002;61(3):339-343.
- [CrossRef] [Google Scholar]
- Solanoflavone, a new biflavonol glycoside from Solanum melongena: Seeking for anti-inflammatory components. Arch. Pharm. Res.. 2005;28(6):657-659.
- [CrossRef] [Google Scholar]
- A new chromone derivative from Berchemia lineata. Yao Xue Xue Bao. 2010;45(9):1139-1143.
- [Google Scholar]
- Solanum xanthocarpum fruit extract promotes chondrocyte proliferation in vitro and protects cartilage damage in collagenase induced osteoarthritic rats. J. Ethnopharmacol.. 2021;274:114028.
- [CrossRef] [Google Scholar]
- Iridoid and eugenol glycosides from Nepeta cadmea. Phytochemistry. 1998;49(3):787-791.
- [CrossRef] [Google Scholar]
- Synthesis and anti-inflammatory evaluation of new chalcone derivatives bearing bispiperazine linker as IL-1β inhibitors. Bioorg. Chem.. 2020;98:103748.
- [CrossRef] [Google Scholar]
- Water-soluble phenylpropanoid constituents from aerial roots of Ficus microcarpa. Nat. Prod. Res.. 2007;21(9):769-774.
- [CrossRef] [Google Scholar]
- Water soluble constituents from the twigs of Litsea cubeba. China J. Chinese Materia Medica. 2017;42(14):2704-2713.
- [Google Scholar]
- Novel Cyanoglucosides from the Leaves of Hydrangea macrophylla. Helv. Chim. Acta. 2011;94(5):847-852.
- [CrossRef] [Google Scholar]
- Phenylpropanoids from Lentopodium lenotopodioides. J. Trop. Subtropical Botany. 2017;25(2):195-201.
- [Google Scholar]
- New lignans from the roots of Datura metel L. Phytochem. Lett.. 2018;28:8-12.
- [CrossRef] [Google Scholar]
- Chemical constituents from Lindera caudata (Nees) Hook. f. Chinese Trad. Patent Med.. 2015;37(11):2455-2458.
- [CrossRef] [Google Scholar]
- Melongenaterpenes A-L, Vetispirane-Type Sesquiterpenoids from the Roots of Solanum melongena. J. Nat. Prod.. 2019;82(12):3242-3248.
- [CrossRef] [Google Scholar]
- Chemical constituents from a Tibetan herbal medicine Corydalis hendersonii. China J. Chinese Materia Medica. 2018;43(9):1758-1763.
- [Google Scholar]
- Constituents of the Underground Parts of Glehnia littoralis. Chem. Pharm. Bull.. 2002;50(1):73-77.
- [CrossRef] [Google Scholar]
- Isolation and identification of chemical constituents from Althaea rosea (Linn.) Cavan. (I) J. Shenyang Pharm. Univ.. 2013;30(5):335-341.
- [Google Scholar]
- Bioactive quinic acid derivatives from Ageratina adenophora. Molecules. 2013;18(11):14096-14104.
- [CrossRef] [Google Scholar]
- Five new compounds from Hosta plantaginea flowers and their anti-inflammatory activities. Bioorg. Chem.. 2020;95:103494.
- [CrossRef] [Google Scholar]
- Studies on chemical constituents of Acroptilon repens. Zhongguo Zhong Yao Za Zhi. 2006;31(22):1869-1872.
- [Google Scholar]
- Two new alkaloids from the sepals of Solanum melongena L. Nat. Prod. Res.. 2021;35(21):3569-3577.
- [CrossRef] [Google Scholar]
- Studies on the phenolic acid constituents from Chinese medicine sheng-ma, rhizome of Cimicifuga foetida L. Yao Xue Xue Bao. 2002;37(7):535-538.
- [Google Scholar]
- The lignins from Torreya grandis cv. Merrilli. Acta. Pharm. Sin. B. 2004;39(4):269-271.
- [Google Scholar]
- Phenolic Compounds from the Roots of Rhodiola crenulata and Their Antioxidant and Inducing IFN-γ Production Activities. Molecules. 2015;20(8):13725-13739.
- [CrossRef] [Google Scholar]
- Phenolic compounds from Viburnum cylindricum. Helv. Chim. Acta. 2005;88(2):339-342.
- [CrossRef] [Google Scholar]
Appendix A
Supplementary material
Supplementary data to this article can be found online at https://doi.org/10.1016/j.arabjc.2022.103877.
Appendix A
Supplementary material
The following are the Supplementary data to this article:Supplementary data 1
Supplementary data 1


