

Evaluation of the chronic intoxication of fluoride on human serum metabolome using untargeted metabolomics
⁎Corresponding author at: H.E.J. Research Institute of Chemistry, International Center for Chemical and Biological Sciences, University of Karachi, Karachi 75270, Pakistan. musharraf1977@yahoo.com (Syed Ghulam Musharraf)
-
Received: ,
Accepted: ,
This article was originally published by Elsevier and was migrated to Scientific Scholar after the change of Publisher.
Peer review under responsibility of King Saud University.
Abstract
Drinking water is the main source of fluoride intake for the human body and its regulated consumption helps in decreasing dental caries. However, excessive fluoride consumption over a prolonged time period causes fluorosis disease which adversely affects many tissues and organs of the body. This paper describes the evaluation of chronic intoxication of fluoride on human serum metabolome. The untargeted metabolomics approach using UPLC-QTOF-MS/MS is applied for metabolomic profiling, whereas the estimation of fluoride in serum samples was carried out using the ion-selective electrode (ISE). Fluoride concentration was found to be 0.16–1.25 mg/L in serum samples of 39 fluorosis patients and 0.008–0.045 mg/L in 20 healthy samples. A total of 47 metabolites were identified based on the high-resolution mass spectrometry analysis. A volcano plot was generated to discriminate features that are significantly different between the fluorosis and healthy groups at the probability of 0.05 and fold change ≥ 2. Among all identified metabolites, intensities of ten differential identified metabolites including inosine, α-linolenic acid, guanosine, octanoyl-L-carnitine, His-Trp, phytosphingosine, lauroyl-L-carnitine, hydrocortisone, deoxyinosine and dodecanedioic acid have been found altered in disease samples compared to healthy controls. Major pathways identified based on these metabolites include energy metabolism, fatty acid oxidation, purine degradation pathway, elevated protein degradation, and increased ω-6 fatty acid linoleate signatures were observed.
Keywords
Fluorosis
Metabolomics
UPLC-QTOF-MS/MS
Ion-selective electrode (ISE)
Serum

1 Introduction
Drinking water is the main source of fluoride intake for the human body (Roy & Dass, 2013). According to the World Health Organization (WHO), the permissible limit of fluoride ion concentration in water is 1.5 mg/L (Kumar & Puri, 2012). Fluoride toxicity greatly impacts human health and causes many diseases including dental and skeletal fluorosis (Strunecka & Strunecky, 2020). In skeletal fluorosis, the bones become fragile and at the severe stages, leading to a crippling disorder (Ayoob & Gupta, 2006; Ozsvath, 2009).
Around 200 million people all over the world are affected by fluorosis. It is endemic to mostly third-world countries including India, China, and Pakistan (Jacks et al., 2005). In Pakistan, fluorosis is a considerable problem in many areas, especially in the Mithi sub-district of the Thar Desert. These areas have a high concentration of fluoride in groundwater. Fluoride-containing minerals and the tropical desert climate expedites the leaching of fluoride in water (Rafique et al., 2008). Due to poor infrastructure and the unavailability of water filtration plants, people rely on groundwater for their daily use and as a consequence suffer from chronic intoxication of fluoride leading to fluorosis.
Although several perturbed mechanisms due to fluorosis are proposed in the literature yet it remains unclear, (Everett et al., 2002). Enamel development and bone metabolism could be affected by excessive consumption of fluoride which ultimately results in dental and skeletal fluorosis (Everett, 2011). It is known that mineralization is extremely sensitive to free fluoride ions. These ions greatly affect the mineralization of bones and teeth by decreasing the solubility of minerals (Aoba & Fejerskov, 2002). The minerals in bones and teeth enamel are mainly composed of hydroxyapatite, where fluoride by displacing hydroxide, forms fluorapatite. Fluoroapatite formation slows down the rebuilding of bones as it is more stable and less soluble. Therefore, enamel development and bone metabolism could be affected by excessive consumption of fluoride which ultimately results in dental and skeletal fluorosis (Everett, 2011). Chronic exposure to fluoride causes metabolic, structural, and functional damage in many tissues, e.g., gonadal, neurological, renal, and endothelial (Doull et al., 2006). Fluoride ions can attach to functional amino acid groups that are present inside and surrounding the active sites of enzymes and proteins (Edwards et al., 1984). This attachment of fluoride ions affect the production of Adenosine triphosphate (ATP) and inhibition of cellular respiration can occur (Eva Adamek 2005). Reactive oxygen species (ROS) induction, production of nitric oxide, and reduction in cellular antioxidant defenses against oxidative damage are also linked with fluoride toxicity (Barbier et al., 2010; Strunecka & Strunecky, 2020).
Metabolomics is an established field to study physiological and pathological diseases and can provide an extensive chemical fingerprint of cell metabolism (Xie et al., 2017). Metabolomics offers quick and in-depth observations of any perturbations in the phenotype of a biological system (Dunn et al., 2011). Thus it is widely being used for biomarker discovery, diagnostic and prognostic purposes (Florian et al., 1995a; Florian et al., 1995b; Lokhov et al., 2010). However, metabolomics studies of fluorosis are very scarce. Metabolomic analysis was performed to study NaF-induced cytotoxicity in the HSC-2 human oral squamous cell carcinoma cell line (Sakagami et al., 2014) and, more recently, serum metabolite profiling of rats exposed to fluoride (Yue et al., 2020). To author's knowledge, metabolomics analysis of fluorosis patients has not been reported yet. Hence, the present study is focused on evaluating the chronic intoxication of fluoride on the serum metabolome of fluorosis patients in comparison with healthy controls using ultra-performance liquid chromatography-quadrupole time-of-flight tandem mass spectrometry (UPLC-QTOF-MS/MS) analysis.
2 Materials and methods
2.1 Ethical considerations and patient selection
A total of 39 blood samples were collected from patients with a mean age of 35.21 ± 7.85 years from different villages (Dabi, Pabe Jo Thar, Misri Memon, Arab Memon, Sakrio, Kakrario, Mau, Mithi city) of the Mithi sub-district, Tharparkar, Sindh, Pakistan. Samples were collected from those villages where the high concentration of fluoride is present in ground water (Rafique et al., 2015; Rafique et al., 2009) and people are relying to use it without any treatment process. The Mithi sub-district is approximately located between N24◦ 44ꞌ 11ꞌꞌ and E69◦ 47ꞌ 50ꞌꞌ in the Thar Desert. Fluorosis patients with clear dental and skeletal abnormalities (identified by a physician) were included in this study; and any type of therapy was discontinued prior to 15 days of sample collection. Additionally, 20 healthy samples with the age range of 30.75 ± 2.65 years were also collected from other villages of Sindh where people are using clean water. The approval of this study was taken by the Independent Ethics Committee, International Center for Chemical and Biological Sciences, University of Karachi. Before the collection of samples, a written informed agreement was taken from all healthy individuals and patients.
2.2 Sample collection
About 5 mL of 8 h fasting blood was taken from patients by venipuncture and immediately transferred to BD SST tube with silica clot activator, polymer gel, silicone-coated interior (BD Franklin Lakes NJ, USA, REF: 367977). The blood samples were brought to the laboratory for serum separation, centrifuged at 2000 rpm for 5 min and immediately stored at −80 ℃.
2.3 Chemicals and reagents
Analytical grade solvents were used for all experiments unless otherwise noted. 1 and 10 ppm fluoride standard solutions were purchased from HANNA Instruments, (Woonsocket, USA). Glacial acetic acid was purchased from Lab- Scan limited (Bangkok 10330, Thailand). Sodium hydroxide was purchased from Uni-Chem Chemical Reagents. Acetonitrile and methanol were purchased from Merck KGaA, 64,271 (Darmstadt Germany). Formic acid was purchased from Daejung, chemicals and metals, Co. (Daejung, Korea). Standard N-Fmoc-L-serine (OtBu) was purchased from GL Biochem (Shanghai, China) Ltd and N-Fmoc-L-alanine was purchased from Chem-Impex International Inc and. Deionized water (Milli-Q) was used throughout the study (Millipore, Billerica, MA, USA).
2.4 Estimation of fluoride in serum
Estimation of the concentration of fluoride ion was performed according to the reported method with slight modifications (Kissa, 1987). The ion-selective electrode (ISE) (HI4110 fluoride combination, HANNA, USA) was used for the determination of fluoride in serum. Total Ionic Strength Adjustable Buffer (TISAB) was used to obtain the pH range of 5–6. By using commercially available 1 and 10 ppm fluoride standard solutions, the slope was set at −56 ± 4 for two-point calibration. After adjusting the slope, 20 mL of 0.05 ppm fluoride standard solution in TISAB was analyzed through ISE before and after the addition of 0.5 mL serum sample.
The concentration of fluoride in serum was determined using the following formula,
Where Cs = F- ion concentration after serum addition, Co = Concentration of standard solution Vo = Volume of standard solution, Vb = Volume of blood sample,
Cb = Concentration of F- ion in serum sample.
2.5 Sample preparation and UPLC-QTOF-MS analysis
Serum sample having the volume of 100 µL was added to 100 µL volume of Milli-Q (containing 5 µg/mL N-Fmoc-L-serine (OtBu) and 5 µg/mL N-Fmoc-L-alanine as internal standards) and then added a mixture of 400 µL of acetonitrile and methanol (3:5), vortexed for 2 min and left for 10 min at room temperature. The supernatant was separated after centrifugation at 12,000 rpm for 20 min and stored at −80 °C after vacuum drying until analysis. Dried samples were reconstituted in 200 µL volume of water: methanol (70:30) and transferred into an auto-sampler vial for analysis after vortexing for 2 min and centrifuged at 12,000 rpm for 20 min.
Samples were analyzed on UPLC (Thermo Scientific Dionex 3000) online linked with QTOF (HRMS) mass spectrometer (maxis II Bruker, Daltonic Bremen, Germany). An RP-C18 column (100 × 2.0 mm, 1.8 µm, Macherey-Nagel, Düren, Germany) was used for separation. The temperature of the column compartment was 40 °C and the injection volume was 5 µL. A = 0.1% formic acid and B = methanol with 0.1 % formic acid were used as mobile phases at 0.5 mL/min of flow rate. Linear gradient starting at 1–5% B for 0–1 min, from 5 to 95% B for 1–9 min, 95% B for 9–10.5 min, 5% B over 10.7 min, 5% B over 10.7–13 min was used.
All samples were analyzed in positive ion mode with the following parameters for MS and MS/MS; drying gas temperature 270 ℃, drying gas flow 12.0 L/min, the capillary voltage 4500 V, 100–1200 m/z mass range, and 3.1 bars nebulizer pressure. Data was recorded using Compass HyStar 4.1 Acquisition (Bruker, Germany). Multiple collison energies of 20, 25, and 30 eV were used for MS/MS analysis.
1 N Na-formate solution was used as a mass calibrant before each sample injection. A separate pool was made by adding 10 μL from each sample, referred to as quality control (QC), given the same treatments as other samples. QC sample was subjected to analysis to provide robust quality assurance (QA) for each metabolic feature detected periodically after every 6 samples. To ensure data quality and to check instrument stability, QC samples were injected 10 times at the beginning of the batch.
2.6 Data processing and statistical analysis
After calibration of all LC-MS spectra, features were generated by Bruker’s MetaboScape (version 3.0) software using the following parameters; intensity threshold 2000 counts, minimum peak length 16 spectra, minimum peak length (recursive) 13 spectra, feature signal intensity, minimum numbers of features for extraction (30% of analyses), presence of features in minimum numbers of analyses (30% of analyses), mass range 100–1500 m/z, retention-time range (0.3–12) min, primary ion [M + H]+, extracted ion chromatogram (EIC) correlation 0.7. Data was normalized using internal standards mentioned in the previous section. Statistical significance was calculated using the student‘s t-test and features with p-value < 0.05, after Benjamini-Hochberg corrections, were considered as significant features. Fold change in intensity of features from case to control was also calculated with the threshold of ≥ 2. The generated features were imported to SIMCA software (version 14.1, Umetrics, Umeå, Sweden) for chemometric analysis. The distribution of distinct groups and detection of outlier by principal component analysis (PCA) was performed after mean centering and Pareto scaling to equalize weight to all variables despite their all absolute values. It was done for non-averaged samples to obtain cumulative variance which is represented by first two components on X and Y axis for measuring the differences. Prediction model was built using orthogonal partial least squares discriminant analysis (OPLS-DA). It is a supervised multivariate data analysis and was constructed using four parameters including auto scaling, N fold validation type, three numbers of fold and with ten numbers of repeats. The classes in the input data are randomly divided into three equal parts; two parts were used for training, and the remaining part was used for testing. The process was repeated ten times with a different part that is used for testing in each iteration. Thus each row is used at least once in training and testing.
3 Results
3.1 Estimation of fluoride in serum
Total 59 samples were collected including disease and healthy individuals. A picture of a patient suffering from fluorosis is taken during sample collection represented in supplementary Fig. 1. Patients had abnormalities related to dental and skeletal fluorosis and a history of exposure to high fluoride concentrations in drinking water. In addition to the disease symptoms, the classification of healthy and diseased individuals was further supported by the estimation of fluoride.
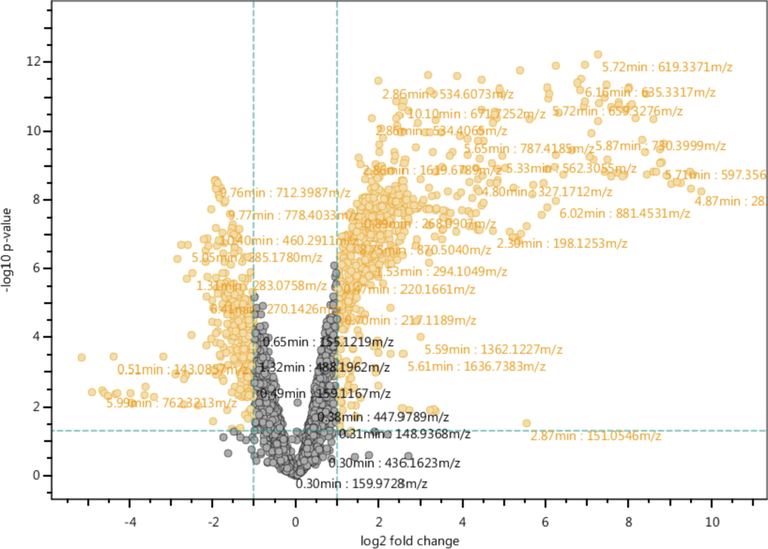
- Volcano plot shows significantly different variables in serum among normal individuals and fluorosis patients in orange color dots. Significance of variable was calculated using student‘s t-test at 5% alpha and fold change in normalized intensity of feature in case vs control.
Fluorosis samples have been successfully differentiated from healthy controls. The concentration of fluoride in disease serum samples was found to be in the range of 0.16–1.25 ppm with 0.753 ± 0.29 (Mean ± S.D) and 0.82 ± 0.29 (Median ± S.D) while in healthy samples were found to be in the normal range i.e. 0.03–0.007 ppm with 0.0229 ± 0.01 (Mean ± S.D) and 0.023 ± 0.01(Median ± S.D). Results are summarized in supplementary Table 1.
| Sr.No | Name | RT | Adducts | Formula | Observed mass | Calculated mass | ppm error | P value (FDR) | Fold change |
|---|---|---|---|---|---|---|---|---|---|
| 1 | Inosinea | 1.27 | [M + H]+ | C10H12N4O5 | 269.0888 | 269.0888 | <1 | 0.000255 | −3.734 |
| 2 | α-linolenic acida | 10.4 | [M + H]+ | C18H30O2 | 279.2317 | 279.2319 | <-1 | 0.000166 | −2.667 |
| 3 | Guanosinea | 1.30 | [M + H]+ | C10H13N5O5 | 284.0987 | 284.0989 | <1 | 0.000032 | −5.537 |
| 4 | Octanoyl-L-Carnitinea | 5.79 | [M + H]+ | C15H29NO4 | 288.2167 | 288.2169 | <-1 | 0.001222 | −3.558 |
| 5 | Phytosphingosinea | 7.17 | [M + H]+ | C18H39NO3 | 318.3008 | 318.3002 | 2 | 0.016185 | −2.049 |
| 6 | His-Trpa | 1.04 | [M + H]+ | C17H19N5O3 | 342.1565 | 342.1561 | 2 | 0.000063 | 2.188 |
| 7 | Lauroyl L-carnitinea | 7.65 | [M + H]+ | C19H37NO4 | 344.2798 | 344.2795 | <1 | 0.013752 | −2.657 |
| 8 | Hydrocortisonea | 7.15 | [M + H]+ | C21H30O5 | 363.2167 | 363.2166 | −2 | 0.000055 | −3.307 |
| 9 | Deoxyinosineb | 7.15 | [M + H]+ | C10H12N4O4 | 253.0928 | 253.0913 | 6 | 0 | 6.665 |
| 10 | Dodecanedioic acidb | 9.26 | [M + H]+ | C12H22O4 | 231.1614 | 231.1591 | 10 | 0.007518 | −6.878 |
a = Level 2-putative identification, b = Level 3-Tentative structure (Schymanski et al., 2014).
3.2 Profiling and identification of metabolites
Optimization of the LC-MS method was done using the RP-C18 column on pooled samples. A linear gradient system was applied for the effective separation of metabolites. After method optimization, 5337 features (selected chromatogram within the selected retention time range) were generated. Among these features, thirty-nine compounds were annotated through exact mass measurement and are presented in supplementary Table 3 (identification level 3 of metabolomic). Student s t-test for significance resulted in 10 annotated compounds and 8 out of those 10 were identified by comparing experimental MS/MS spectra with available mass spectral databases such as Mass bank of Europe, Mass bank of North America (MoNA) and NIST tandem mass spectral library (Table 1 (identification level 2 of metabolomic). Moreover, MS/MS fragments of each identified metabolite are presented in supplementary Table 2.
3.3 Chemometric analysis
Univariate data analysis was performed for the differentiation of significantly different features between healthy and fluorosis groups, the volcano plot was graphed against log of mean fold change ≥ 2 vs –log p-value (using student t-test), resulting in 1099 differentiative features either up or down-regulated (Fig. 1). Heatmap was generated using log2 normalized intensities of ten significant identified features. It has been clearly shown that the concentration of identified metabolites either increased or decreased in disease samples in comparison with healthy controls (Fig. 2). Inosine, α-linolenic acid, guanosine, octanoyl-l-Carnitine, dodecanoylcarnitine, dodecanedioic acid, hydrocortisone and phytosphingosine were down-regulated compared to healthy individuals. Histidinyltryptophan and deoxyinosine were up-regulated in fluorosis samples as compared to healthy individuals.
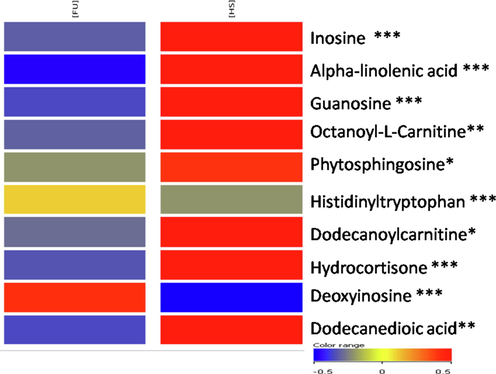
- Heatmap visualization in the serum of ten identified and significant metabolites based on their normalized intensities. The red indicates the significantly up-regulated metabolites and blue represents the significantly down-regulated metabolites. p-values *=<0.05; **=≤0.01; ***=≤0.001.
Multivariate statistical data analysis was also performed to identify the overall separation between the groups. Outliers were removed by using Hotelling’s T2 plot represented in Fig. 3. The principal component analysis provides useful information that helps in the understanding of the differences within and between the groups. OPLS-DA is a discriminant analysis that uses a PLS algorithm to establish the predictive ability of the data. Moreover, R2X and R2Y are the prediction parameters in which R2Y and R2X show the interpretation rate of the established model to Y and X matrix respectively and Q2 shows the prediction ability of the model.
![Hotelling’s T2 plot with confidence limits 99% and 95 %Hotelling’s showing three outliers [healthy (green) and fluorosis (red)].](/content/184/2022/15/7/img/10.1016_j.arabjc.2022.103928-fig3.png)
- Hotelling’s T2 plot with confidence limits 99% and 95 %Hotelling’s showing three outliers [healthy (green) and fluorosis (red)].
After removing outliers, PCA was generated and the score plot showed fine separation as shown in Fig. 4. OPLS-DA was constructed for establishing a model for the discrimination between healthy and disease groups as shown in Fig. 5. VIP values of ten significantly different metabolites were found to be greater than 1. The OPLS-DA model showed fine separation between disease and healthy groups with sensitivity (95%), specificity (100%) and 98.64% classification rate. For validation, permutation tests (5 0 0) on OPLS-DA model were performed. The intercept (Q2 and R2 when the correlation coefficient is zero) for HS and FU shows that model is satisfactory as shown in Fig. 6.
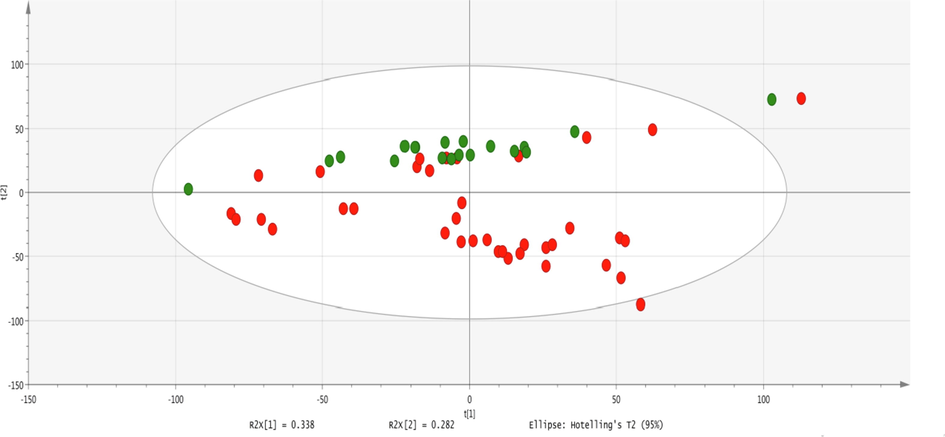
- PCA scores scatter plot of 39 diseases and 20 healthy samples using a normalized intensity of all features extracted from mass spectra. Boundary showed the 95% of confidence limit of Hotelling‘s T2 test. Each dot represents a sample and each color represents the type of the sample. Red = fluorosis samples; green = healthy.
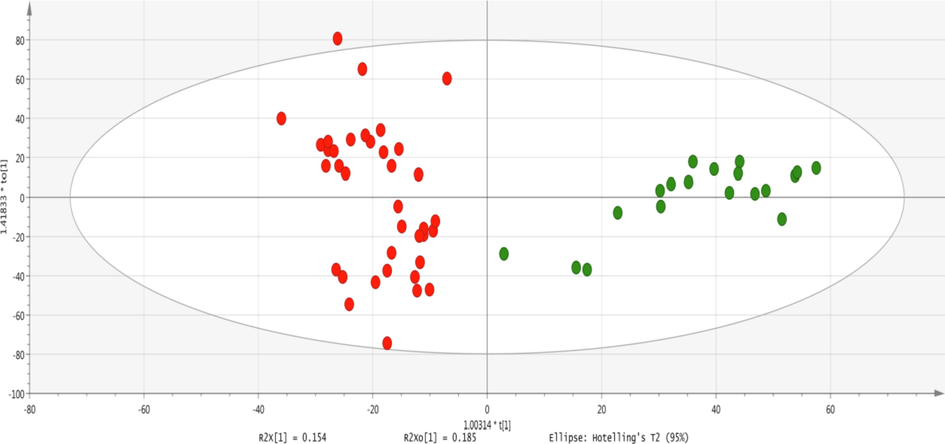
- Two-dimensional OPLSDA score plot of a total of 59 samples from disease and healthy individuals showing the separation of a study group on the x-axis and variations within the group on the y-axis. Each dot represents a sample and each color represents the study group. Red = fluorosis samples; green = healthy.
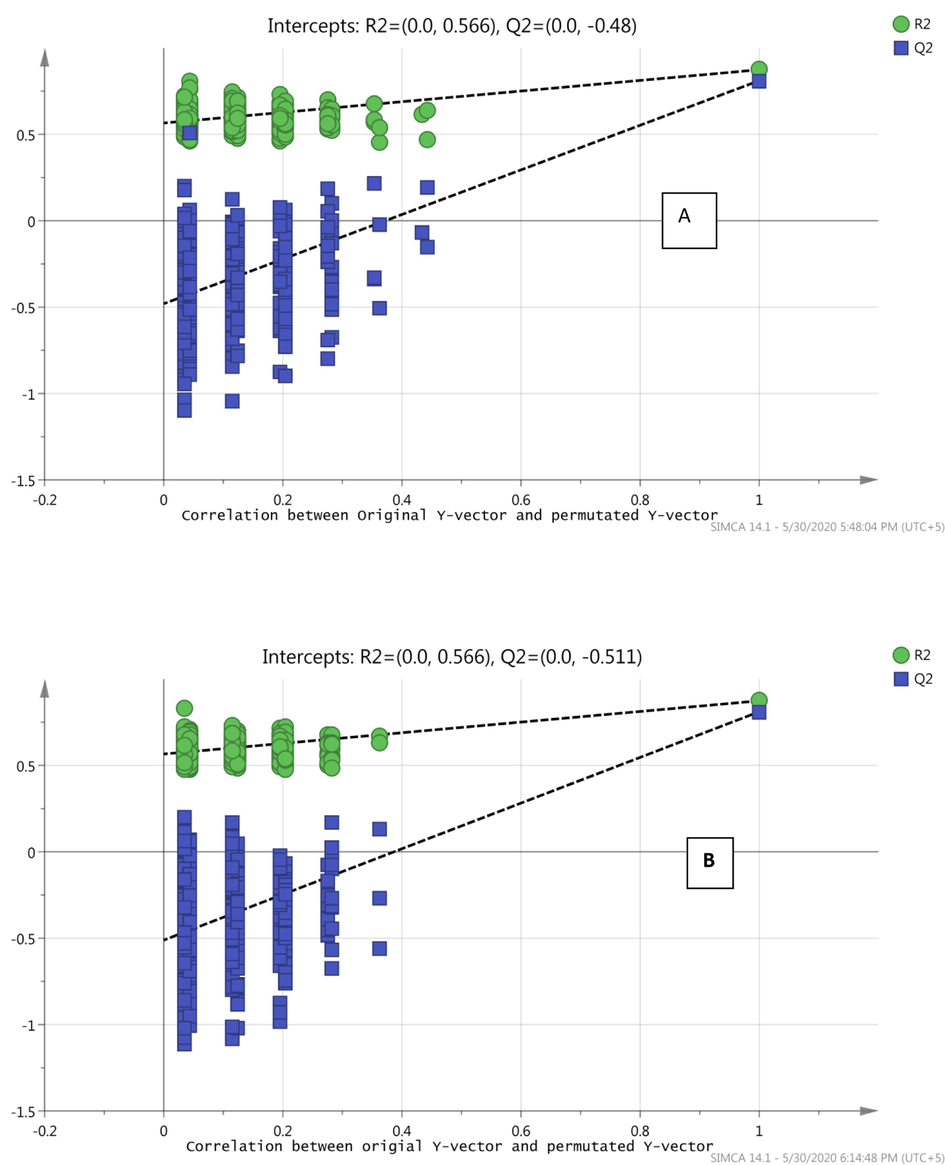
- Permutation (500 times) tests for OPLS-DA model showing R2 (goodness of fit) and Q2 (predictive ability) values, A; Healthy, B; Fluorosis.
4 Discussion
A wide range of normal concentrations (0.008–0.045 mg/L) of fluoride in plasma has been reported in the literature. In comparison, our study shows that the concentration of fluoride was found to be 0.16–1.25 mg/L in 39 disease samples and 0.03–0.007 mg/L in 20 healthy samples. Fluoride ion concentrations were found to agree with the reported data from healthy (Şener et al., 2007) and disease (Rafique et al., 2015) samples. The toxic levels of fluoride are the root cause of many pathological problems as they cause the inhibition of metalloproteinase within the organelles or different physiological pathways (Agalakova & Gusev, 2012). The sporadic nature of the disease roots in the lack of complete understanding of the metabolomics of fluorosis. Long-term exposure to fluorine and its associated metabolites results in a wide array of toxicity traits including oxidative stress, DNA damage, cell cycle arrest, apoptosis, skeletal and soft tissue degradation (Johnston & Strobel, 2020). Therefore, this study mainly focuses on the investigation of alteration of key metabolites responsible for the progression of the disease and the identification of possible therapeutic approaches for better disease management.
In this study, a comparison of fluorosis and healthy samples showed metabolites perturbation of purine degradation pathway (e.g., guanosine and inosine), decreased levels of corticosteroids, elevated protein degradation indicated by the increased level of dipeptides (His-Trp), increased ω-6 fatty acid linoleate signatures, and decreased mitochondrial activity.
As mentioned in table 1, two of the significantly identified metabolites are L-carnitine with different fatty acid chains. L-carnitine is an important factor involved in the normal function of mitochondria. L-carnitine (D-isomer is toxic and not present in humans) is actively involved in energy metabolism, beta-oxidation regulation, and maintenance of the endogenous antioxidant defense system (Reuter & Evans, 2012). In a recent study, it was reported that circulating mitochondrial DNA content is negatively correlated with low-to-moderate fluoride exposure to dental fluorosis in Chinese school-age children (Zhou et al., 2019). Hence reduced levels of L-carnitine in this study would be due to reduced mitochondrial DNA content which might be a causal intermediate in biological mechanisms linking fluoride exposure to dental fluorosis. Another effect of chronic fluoride intoxication on disturbed energy metabolism is due to the loss of mitochondrial transmembrane potential, as fluoride has a high charge density (Gutowska et al., 2010). This perturbed the mitochondrial membrane function of ATP synthesis, and this is well known that low ATP synthesis is linked to increased ROS production (Strunecka & Strunecky, 2020).
Due to the lesser levels of L-carnitine in fluorosis, it would also suggest that the patient might suffer from decreased carnitine palmitoyltransferase 1A (CPT1A) activity (van der Leij et al., 2000). CPT1A deficiency is characterized by hypoketotic dicarboxylic aciduria with high urinary levels of dodecanedioic acid (Scaglia et al., 1998). Moreover, it was observed in a study that dodecanedioic acid is an indicator of CPT1A deficiency (Korman et al., 2005). However, the contradicting results from these two studies were observed in our case, where dodecanedioic acid was found to be decreased in fluorosis patients when compared to healthy individuals. It can be hypothesized for this anomaly that higher excretion of dodecanedioic acid results in lower serum levels. A validation study is needed for dodecanedioic acid to affirm the observations of this study.
Another identified metabolite was α-linolenic acid (ALA), a poly-unsaturated fatty acid, an exogenous metabolite that belongs to the omega-3 fatty acid class. ALA works as the precursor metabolite for long-chain unsaturated fatty acids by a series of alternating desaturation and elongation reactions. ALA is observed more than 2.5 times decreased in patients as compared to healthy individuals. The lower levels of ALA ultimately cause a decrease in the concentration of eicosapentaenoic acid (EPA) and docosahexaenoic acid (DHA) which are the common products of ALA metabolism and help to reduce inflammation and may help in lowering the risk of chronic diseases (Chen & Nilsson, 1993). It was also reported for different mammals that higher fluorine content decreases the fatty acid composition in biological samples (Wang et al., 2012). Therefore, deficient ALA intake and higher fluorine content collectively make the situation worse for normal regulation of the fatty acid metabolic pathway.
Phytosphingosine (PHS) is one of the most widely distributed natural sphingoid bases. It metabolizes to odd-numbered fatty acids and is incorporated into glycerophospholipids (Kondo et al., 2014). Higher fluoride levels elevate the pH (Sharma et al., 2010) which ultimately causes dental erosion and dental fluorosis. PHS and other sphingoid bases with their anti-erosive properties form layers on the surface of enamel and act as diffusion barriers against H + ions (Valentijn-Benz et al., 2015). Decreased levels of PHS indicate the increased susceptibility to enamel erosion.
In our study, significant changes are found in functionally diverse metabolites of the purine degradation pathway which are concomitant with oxidative stress and compromised anti-oxidant capacity. Particularly, the reduction of an oxygen molecule by xanthine oxide and the production of the superoxides (O2−) results in decreased intrinsic radical scavengers (Rzeuski, 1998), with an increased vulnerability to the generation of free oxygen radicals (Quinlan et al., 1997). This is reflected in this study as guanosine and inosine were found to be down-regulated while deoxyinosine levels were found to be up-regulated. The perturbation in these metabolites is similar to the previous study (Li et al., 2020). The lower levels of guanosine and inosine, with increased levels of deoxyinosine in the fluorosis sample, indicate that interconversion of inosine and adenosine occurs to replenish cellular energy levels in stress conditions by increasing the metabolic flux to regenerate ATP through purine nucleotide cycle (PNC) (Takahashi & Sato, 2014) or hypoxanthine-IMP-AMP pathway (Shafy et al., 2012). These pathways utilize the intermediate of purine degradation metabolites to regenerate AMP from IMP via AMP deaminase, adenylosuccinate synthetase (ADSS), and adenylosuccinate lyase (ADSL) and phosphoribosyl pyrophosphate (PRPP) enzymes, respectively (Simoni et al., 2007). However, further investigation of these interconnected pathways is essential for evaluating the role of purine degradation metabolites in fluorosis in meeting the energy requirement of the body.
The significant change in hydrocortisone (cortisol) level in fluorosis patients defines one of the suggestive physiological links between corticosteroids and calcium complexes, as excessive fluoride causes calcium overload, which in turn modulates physiochemical properties of corticosteroids (Monder et al., 1988; Reid et al., 1986). A previous study has shown that excessive fluoride exposure can cause calcium overload by exerting endoplasmic reticulum stress, which disrupts mitochondrial oxidative phosphorylation, decreases ATP level, and causes an increase in intracellular Ca + thus resulting in calcium overload (Pandya et al., 2013; Zhang et al., 2016). But this demands further exploration to critically describe potential relationships between calcium-related disease conditions in fluorosis and the calcium chelation capabilities of the corticosteroids.
5 Conclusion
Evaluation of the chronic intoxication of fluoride on human serum metabolome has shown that the concentration of identified metabolites either increased or decreased in patients as compared to healthy. All metabolites identified in this study have clear connection to main physiological reactions of human body. The possible mechanisms involved different key metabolites and molecular pathways associated with the pathogenesis of fluorosis have been proposed, as like purine degradation pathway, decreased levels of corticosteroids, elevated protein degradation, increased ω-6 fatty acid linoleate signatures, and decreased mitochondrial activity in fluorosis individuals. The identified metabolites could be helpful for a better understanding of the disease progression and diagnosis. These identified metabolites could be useful biomarkers for fluorosis however, an extensive study is needed for the validation of these biomarkers in population of different origins.
Acknowledgments
The authors are thankful to all individuals who provided their samples on a voluntary basis. The authors are also thankful to Mr. Fayaz Ahmed for helping during sample collection, Prof. Dr. Muhammad Iqbal Bhanger, Dr. Imran Malik and Dr. Sofia Khalique for helping during the estimation of fluoride. We also acknowledged the financial support from the Pakistan Academy of Sciences (grant # 5-9/PAS/535) for funding this project. The author Jalal Uddin would also like to gratefully acknowledge the support from the Deanship of Scientific Research at King Khalid University (Grant No. RGP.2/117/42).
Author Contributions
S.G.M. proposed the subject, designed the study and actively participated in manuscript writing; M.U. performed the experiments, interpreted the data and actively involved in the write-up of the manuscript; A.A. actively participated in results, discussion and manuscript checking; T.R. and S.S.H. involved in the estimation of fluoride; S.K. assisted in sample preparation, statistical analysis and reviewing the manuscript; R.J actively participated in sample collection; A.J.S. and F.I. involved in statistical analysis and interpretation of results. J.U actively participated in the manuscript writting and revision. All authors reviewed and approved the manuscript.
Declaration of Competing Interest
The authors declare that they have no known competing financial interests or personal relationships that could have appeared to influence the work reported in this paper.
References
- 2012. ISRN Cell biology: Molecular mechanisms of cytotoxicity and apoptosis induced by inorganic fluoride; 2012.
- Dental fluorosis: chemistry and biology. Crit. Rev. Oral Biol. Med.. 2002;13(2):155-170.
- [Google Scholar]
- Fluoride in drinking water: a review on the status and stress effects. Critical reviews in environmental science and technology. 2006;36(6):433-487.
- [Google Scholar]
- Molecular mechanisms of fluoride toxicity. Chem. Biol. Interact.. 2010;188(2):319-333.
- [Google Scholar]
- Desaturation and chain elongation of n - 3 and n - 6 polyunsaturated fatty acids in the human CaCo-2 cell line. BBA. 1993;1166(2–3):193-201.
- [CrossRef] [Google Scholar]
- Fluoride in drinking water: a scientific review of EPA’s standards. Washington: National Academies; 2006. p. :205-223.
- Procedures for large-scale metabolic profiling of serum and plasma using gas chromatography and liquid chromatography coupled to mass spectrometry. Nat. Protoc.. 2011;6(7):1060.
- [Google Scholar]
- The crystal structure of fluoride-inhibited cytochrome c peroxidase. J. Biol. Chem.. 1984;259(21):12984-12988.
- [Google Scholar]
- Eva Adamek , K. P.-G., Katarzyna Bober (2005). In Vitro and in vivo effects of fluoride ions on enzyme activity Paper presented at the Annales academiae medicae stetinensis.
- Fluoride’s effects on the formation of teeth and bones, and the influence of genetics. J. Dent. Res.. 2011;90(5):552-560.
- [Google Scholar]
- Dental fluorosis: variability among different inbred mouse strains. J. Dent. Res.. 2002;81(11):794-798.
- [Google Scholar]
- Characteristic metabolic profiles revealed by 1H NMR spectroscopy for three types of human brain and nervous system tumours. NMR Biomed.. 1995;8(6):253-264.
- [Google Scholar]
- Cell type-specific fingerprinting of meningioma and meningeal cells by proton nuclear magnetic resonance spectroscopy. Cancer Res.. 1995;55(2):420-427.
- [Google Scholar]
- Fluoride as a pro-inflammatory factor and inhibitor of ATP bioavailability in differentiated human THP1 monocytic cells. Toxicol. Lett.. 2010;196(2):74-79.
- [CrossRef] [Google Scholar]
- Controls on the genesis of some high-fluoride groundwaters in India. Appl. Geochem.. 2005;20(2):221-228.
- [Google Scholar]
- Principles of fluoride toxicity and the cellular response: a review. Arch. Toxicol. 2020:1-19.
- [Google Scholar]
- Determination of inorganic fluoride in blood with a fluoride ion-selective electrode. Clin. Chem.. 1987;33(2):253-255.
- [Google Scholar]
- Identification of the phytosphingosine metabolic pathway leading to odd-numbered fatty acids. Nat. Commun.. 2014;5(1):5338.
- [CrossRef] [Google Scholar]
- Novel metabolic and molecular findings in hepatic carnitine palmitoyltransferase I deficiency. Mol. Genet. Metab.. 2005;86(3):337-343.
- [CrossRef] [Google Scholar]
- A review of permissible limits of drinking water. Indian journal of occupational and environmental medicine. 2012;16(1):40-44.
- [CrossRef] [Google Scholar]
- Gas Chromatography-Mass Spectrometry Based Midgut Metabolomics Reveals the Metabolic Perturbations under NaF Stress in Bombyx mori. Insects. 2020;11(1):17.
- [Google Scholar]
- Metabolite profiling of blood plasma of patients with prostate cancer. Metabolomics. 2010;6(1):156-163.
- [Google Scholar]
- Fluoride and environmental health: a review. Reviews in Environmental Science and Bio/Technology. 2009;8(1):59-79.
- [Google Scholar]
- Concentration dependent effect of calcium on brain mitochondrial bioenergetics and oxidative stress parameters. Front. Neuroenerg.. 2013;5:10.
- [Google Scholar]
- Plasma hypoxanthine levels in ARDS: implications for oxidative stress, morbidity, and mortality. Am. J. Respir. Crit. Care Med.. 1997;155(2):479-484.
- [Google Scholar]
- Fluoride Levels in Urine, Blood Plasma and Serum of People Living in an Endemic Fluorosis Area in the Thar Desert, Pakistan. J. Chem. Soc. Pak.. 2015;37(6)
- [Google Scholar]
- Fluoride ion contamination in the groundwater of Mithi sub-district, the Thar Desert. Pakistan. Environmental Geology. 2008;56(2):317-326.
- [Google Scholar]
- Geochemical controls of high fluoride groundwater in Umarkot Sub-District, Thar Desert, Pakistan. Sci. Total Environ.. 2015;530–531:271-278.
- [CrossRef] [Google Scholar]
- Geochemical factors controlling the occurrence of high fluoride groundwater in the Nagar Parkar area, Sindh. Pakistan. Journal of Hazardous Materials. 2009;171(1):424-430.
- [CrossRef] [Google Scholar]
- The effects of hydrocortisone, parathyroid hormone and the bisphosphonate, APD, on bone resorption in neonatal mouse calvaria. Calcif. Tissue Int.. 1986;38(1):38-43.
- [Google Scholar]
- Fluoride contamination in drinking water–a review. Resour. Environ. 2013;3(3):53-58.
- [Google Scholar]
- Interactions between fluoride and biological free radical reactions. Fluoride. 1998;31:43-45.
- [Google Scholar]
- Metabolomic profiling of sodium fluoride-induced cytotoxicity in an oral squamous cell carcinoma cell line. Metabolomics. 2014;10(2):270-279.
- [Google Scholar]
- Defective urinary carnitine transport in heterozygotes for primary carnitine deficiency. Genet. Med.. 1998;1(1):34-39.
- [CrossRef] [Google Scholar]
- Schymanski, E. L., Jeon, J., Gulde, R., Fenner, K., Ruff, M., Singer, H. P., & Hollender, J. (2014). Identifying small molecules via high resolution mass spectrometry: communicating confidence: ACS Publications.
- Fluoride levels of human plasma and breast milk. European journal of dentistry. 2007;1(01):021-024.
- [Google Scholar]
- Shafy, A., Molinié, V., Cortes-Morichetti, M., Hupertan, V., Lila, N., & Chachques, J. C. (2012). Comparison of the effects of adenosine, inosine, and their combination as an adjunct to reperfusion in the treatment of acute myocardial infarction. Isrn Cardiology, 2012.
- The acid test of fluoride: how pH modulates toxicity. PLoS ONE. 2010;5(5):e10895.
- [CrossRef] [Google Scholar]
- Uric acid changes in urine and plasma: an effective tool in screening for purine inborn errors of metabolism and other pathological conditions. J. Inherit. Metab. Dis.. 2007;30(3):295-309.
- [Google Scholar]
- Mechanisms of Fluoride Toxicity: From Enzymes to Underlying Integrative Networks. Applied Sciences. 2020;10(20):7100.
- [Google Scholar]
- Anaerobic respiration sustains mitochondrial membrane potential in a prolyl hydroxylase pathway-activated cancer cell line in a hypoxic microenvironment. American Journal of Physiology-Cell Physiology. 2014;306(4):C334-C342.
- [Google Scholar]
- Valentijn-Benz, M., van ''t Hof, W., Bikker, F. J., Nazmi, K., Brand, H. S., Sotres, J., . . . Veerman, E. C. I. (2015). Sphingoid Bases Inhibit Acid-Induced Demineralization of Hydroxyapatite. Caries Research, 49(1), 9-17. doi: 10.1159/000362096.
- Genomics of the human carnitine acyltransferase genes. Mol. Genet. Metab.. 2000;71(1–2):139-153.
- [CrossRef] [Google Scholar]
- Effects of high dietary fluorine on fatty acid composition in breast muscle of broilers. Fluoride. 2012;45(2):100.
- [Google Scholar]
- Metabolomic applications in hepatocellular carcinoma: toward the exploration of therapeutics and diagnosis through small molecules. RSC Adv.. 2017;7(28):17217-17226.
- [Google Scholar]
- Fluoride exposure altered metabolomic profile in rat serum. Chemosphere. 2020;127387
- [Google Scholar]
- Fluoride induced endoplasmic reticulum stress and calcium overload in ameloblasts. Arch. Oral Biol.. 2016;69:95-101.
- [Google Scholar]
- Low-to-moderate fluoride exposure, relative mitochondrial DNA levels, and dental fluorosis in Chinese children. Environ. Int.. 2019;127:70-77.
- [CrossRef] [Google Scholar]
Appendix A
Supplementary data
Supplementary data to this article can be found online at https://doi.org/10.1016/j.arabjc.2022.103928.
Appendix A
Supplementary data
The following are the Supplementary data to this article:


