

Translate this page into:
Studies on the removal of phosphate in water through adsorption using a novel Zn-MOF and its derived materials
⁎Corresponding authors. navytan@glut.edu.cn (Haijun Tan), Zhangshuhua@gdupt.edu.cn (Shu-Hua Zhang)
-
Received: ,
Accepted: ,
This article was originally published by Elsevier and was migrated to Scientific Scholar after the change of Publisher.
Peer review under responsibility of King Saud University.
Abstract
A novel zinc-based metal–organic framework, {[Zn3(atz)2(pda)2]·2(H2O)}n (Zn-MOF; Hatz is 5-aminote-1H-terazole; H2pda is malonic acid), was prepared using the solvothermal method. Carbonization of the prepared Zn-MOF was conducted under elevated temperatures to investigate its phosphate adsorption performance. Through pre-adsorption experiments, the optimal carbonization temperature of 500 °C was determined, yielding Zn-MOF-500. Besides, multiple characterization methods were used to analyze the properties of Zn-MOF and Zn-MOF-500 materials before and after the adsorption of phosphate ions. The results showed that the BET surface area of Zn-MOF-500 was 18.57 m2/g, which was 16.37 times larger than that of the BET surface area of Zn-MOF. At 25 °C, Zn-MOF and Zn-MOF-500 exhibited an adsorption capacity of 123.44 and 226.07 mg/g, respectively. Based on the adsorption isotherms and the adsorption kinetics, the adsorption of PO43- occurs via monolayer. X-ray diffractometry (XRD) and X-ray photoelectron spectroscopy (XPS) analysis showed that P was adsorbed on Zn-MOF and Zn-MOF-500 as the zinc hydrogen phosphate and zinc phosphate ions, respectively.
Keywords
MOFs
Carbonization
Phosphate
Adsorption performance

1 Introduction
Phosphorus, a mineral nutrient, plays a vital role in plant growth. However, it can also cause serious eutrophication of water bodies when its concentration exceeds the permissible limit (Bacelo et al., 2020). Therefore, it is imperative to develop efficient and eco-friendly water dephosphorization methods. One of the most important strategies developed for dephosphorization is adsorption. However, traditional adsorption materials suffer from limitations such as low adsorption capacity (Nuryadin et al., 2021) and difficult regeneration (Lin et al., 2015).
Metal-organic frameworks (MOFs), a new type of porous adsorption material (Wu et al., 2021a), have widely attracted the attention of researchers due to their compositional and structural variety, which has been realized by designing appropriate organic ligands and metal entities (Chen et al., 2019; Chen et al., 2020; Guan et al., 2018; Solanki and Borah, 2019; Wu et al., 2021b; Wang et al., 2021; Zhang et al., 2019; Zhang et al., 2020; Zhang et al., 2022). Since the initial report by the Kitagawa research group on the adsorption properties of MOFs in 1997, researchers began to explore the possibility of applying them more widely, especially in the field of wastewater treatment (Sumida et al., 2012; Zhang et al., 2021a). For example, Wang Yifei et al. prepared a composite of ZIF-8@MWCNT120 by growing ZIF-8 on hydroxylated multiwalled carbon nanotubes; the composite was found to have a maximum phosphate adsorption capacity of 203.0 mg/g (pH = 7) in water (Wang et al., 2020). Kun-Yi Andrew Lin et al. reported UiO-66-NH2, which showed a maximum adsorption capacity of 92 mg/g at 20 °C (Lin et al., 2015). Arnab Ghosh and Gopal Das synthesized Sn(II)-MOF, which had a maximum adsorption capacity of 126.58 mg/g (Ghosh and Das, 2021). Although recent years have witnessed an increasing interest in the research on MOFs as adsorbents in wastewater treatment, their application is still restricted because of their low stability in aqueous media (Eltaweil et al., 2020). Because of the advantages of the traditional carbon-based materials (Karimi et al., 2020), MOF-derived carbon-containing composite materials obtained by high-temperature carbonization of MOFs are being applied widely in the field of wastewater treatment.
In this study, zinc acetate, malonic acid (H2pda), and 5-amino-1H-tetrazole were used as the starting materials to synthesize a novel Zn(II)-MOF, which was post-synthetically treated under elevated temperatures to obtain MOF-derived carbon-containing materials. The properties of the synthesized materials were investigated using XRD, XPS, and SEM (Scanning electron microscope). Furthermore, studies on the removal of phosphate ions through adsorption from water and the corresponding reaction mechanism were conducted.
2 Experimental
2.1 Synthesis of Zn-MOF and Zn-MOF-n (n = 300, 400, 500, 600, 700, and 800 °C)
The information on the reagents and instruments in this study is listed in Supporting Information 1.1.
A mixture of Hatz (17 mg, 0.2 mmol), H2pda (41.6 mg, 0.4 mmol), Zn(OAc)2·2H2O (0.0872 mg, 0.4 mmol), absolute ethanol (3.0 mL), acetonitrile (1.0 mL), and ultrapure water (4.0 mL) was placed in a 20 mL reactor and heated at 80–100 °C for 4–12 h. Colorless, long strip crystals of Zn-MOF were obtained by cooling the reactor to room temperature (yield: 0.0475 g, ca. 78.5% based on Hatz). Anal. Calc. for Zn-MOF: C8H12N10O10Zn3 (Mr = 604.45), calc.: C, 15.90; H, 2.00; N, 23.18%; found: C, 15.82; H, 2.07; N, 23.26%. IR data for Zn-MOF (KBr, cm−1, Fig. S1): 3396 s, 3242 s,1578 s, 1639 s, 1566 s, 1321 s, 1129 m, 969 m, 825 m, 763 s, 578 m, 463 w.
Due to the large amount of material required in the subsequent experiments, to facilitate the rapid synthesis of a large amount of Zn-MOF at one time in the subsequent experiments, a batch production experiment of Zn-MOF was carried out. In the experiment, raw materials whose dosage was increased by 10 times, and solution whose amount was increased by 7 times, were put into a 100 mL polytetrafluoroethylene reactor and placed in a 100 °C oven for 12 h. Colorless, long strip crystals of Zn-MOF were obtained by cooling the reactor to room temperature. Another method was that the raw materials and solutions which were in the same proportions were added into a 100 mL flask, and heated in a water bath at 80 °C for 12 h to produce Zn-MOF. After washing with absolute ethanol 3 times and drying, 3 reactors were chosen and calculated the average value to know that the average yield of Zn-MOF was 0.45 g. The purity of Zn-MOF was verified by XRD, the results are shown in Fig S3.
Zn-MOF-n was obtained by carbonizing the obtained Zn-MOF in a tube furnace at corresponding temperatures (300, 400, 500, 600, 700, and 800 °C) for 240 min and naturally cooling to room temperature.
2.2 Single-Crystal X-ray crystallography
Single-crystal X-ray diffraction data of Zn-MOF was collected on an Agilent G8910A CCD diffractometer with graphite monochromated Mo-Kα radiation (λ = 0.71073 Å) at 20 ± 1 °C by using the ω scan mode. Raw frame data were integrated with the SAINT program. The structure was solved by direct methods using SHELXT (Sheldrick, 2008, 2015) and refined by full-matrix least-squares on F2 using SHELXL-2018 within the OLEX-2 GUI (Dolomanov et al., 2009). An empirical absorption correction was applied with spherical harmonics, implemented in SCALE3 ABSPACK scaling algorithm. All non-hydrogen atoms were refined anisotropically. All hydrogen atoms were positioned geometrically and refined as riding. Calculations and graphics were performed with SHELXTL (Sheldrick, 2008, 2015). The crystallographic details were provided in Table S1. Selected bond lengths and angles for Zn-MOF were listed in Table S2.
2.3 Adsorption experiment and characterization
The adsorption experiment, characterization methods, and calculation methods are detailed in Supporting Information 1.2.
3 Results and discussion
3.1 Description of the crystal structure
Single-crystal X-ray diffraction data of Zn-MOF revealed that the compound crystallizes in the monoclinic crystal system with the I2/a space group (Fig. 1 and Table S1). The asymmetric unit of the Zn-MOF was found to consist of a [Zn3(atz)2(pda)2] unit, with the two zinc atoms having different coordination environments. The Zn1 atom was coordinated with four O atoms from two different pda molecules [Zn1–O2 = 2.088(2) Å; Zn1–O3 = 2.045(2) Å; Zn1–O2A = 2.088(2) Å; Zn1–O3A = 2.045(2) Å] and two N atoms from two different atz molecules [Zn1–N3B = 2.158(2) Å; Zn1–N3C = 2.158(2) Å] (Fig. S2a and Table S2). The coordination configuration was found to be octahedron (label, OC-6; symmetry, Oh) using SHAPE 2.1 (Table S3). The Zn2 atom also displayed tetrahedron coordination (label, T-4; symmetry, Td) by two O atoms from different pda molecules [Zn2–O4 = 1.948(2) Å; Zn2–O2D = 1.977(2) Å] and two N atoms from different atz molecules [Zn2–N1 = 2.006(2) Å; Zn2–N4E = 2.023(2) Å] (Fig. S2b and Table S2).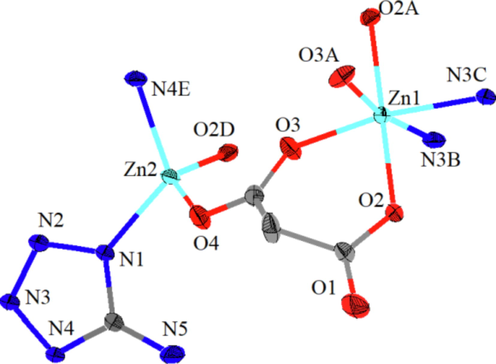
Zn-MOF asymmetric unit structure diagram with 30% ellipsoid rate (symmetry: (A) -x + 3/2, y, -z + 2; (B) x-1 /2, y-1/2, z + 1/2; (C) -x + 2, y-1/2, -z + 3/2; (D) x + 1/2, -y + 1, z; (E) ×, -y + 3/2, z + 1/2).
Two adjacent crystallographically independent Zn2+ atoms were connected through the carboxyl group on H2pda, whose coordination mode was μ2-η2:η1. Zn-MOF consists of the tortuous plane formed by Hatz, pda, and zinc atom, and then the longitudinal axis was connected to the two planes by pda to form a bridge (Fig. S2c). The stacking diagram had larger pores in the a-direction and diamond-like and elliptical pores in the c-direction (Fig. S2d and S2e). Based on PLATON calculations, each unit cell (1822.5 Å3) of Zn-MOF was found to have a solvent-passable volume of 230.3 Å3 and a porosity of 12.6% (excluding the solvent molecules). By comparing the actual measured XRD data and the results simulated by Mercury (Zhang et al., 2021b), the purity of the obtained sample was found to be sufficiently high (Fig. S3), and, therefore, could be used for subsequent carbonization experiments. IR data of Zn-MOF (KBr, cm−1, Fig. S1): 3396 br, 3242 s, 1639 s, 1566 s, 1321 s, 1129 s, 969 m, 825 m, 763 s, 578 m, and 463 m.
3.2 Selecting the best carbonized material for phosphate adsorption
The phosphate adsorption capacity, qe, of Zn-MOF-n (n = 300. 400, 500, 600, 700, and 800 °C) was found to increase with the increase in the feeding concentration, C0 (Fig. 2a). The results indicated that the performance of Zn-MOF-700 is slightly better than that of Zn-MOF-500, however, the preparation of zn-mof-700 needs more energy. So Zn-MOF-500 was selected as the representative sample for use in subsequent experiments. In additional, the results also indicate that the material of Zn-MOF-600 and Zn-MOF-700 is just zinc oxide (PDF#89–0511, Fig. 2b) which is a known material. Therefore, we choose the carbonization temperature of 500 °C.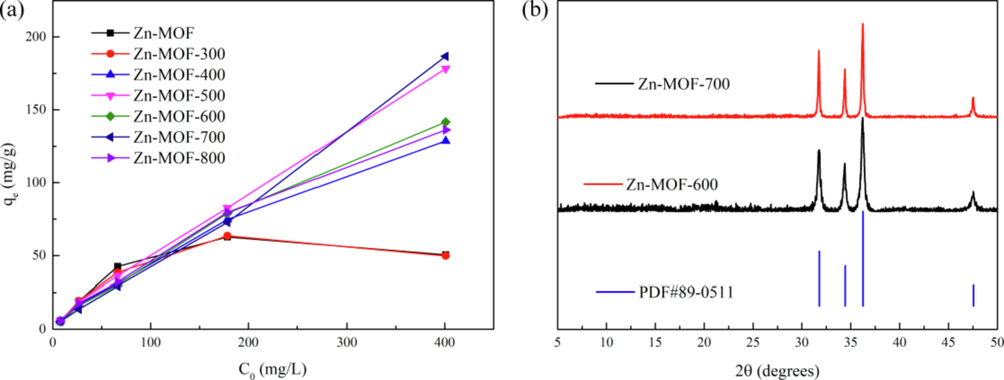
(a)Phosphate adsorption performance of Zn-MOF and Zn-MOF-n at different feeding concentrations C0; (b)The PXRD patterns of Zn-MOF-600, Zn-MOF-700 and PDF card.
3.3 Selecting the optimized experimental conditions
As shown in Fig. 3c, the phosphate adsorption capacity and removal rate of Zn-MOF-500 decreased with increasing pH. A pH value of 3 was considered to be the optimal pH. As shown in Table S4, when the temperature was 298.15 K and pH was 3, the phosphate ion existed mainly in the form of H2PO4– (87.985%) and H3PO4 (12.036%). As can be seen in Fig. 3a, the Zeta potential of Zn-MOF-500 reduced with the decrease in pH. When the pH = 3, the Zeta potential was positive, which was beneficial for the electrostatic adsorption of phosphate (Liu et al., 2020).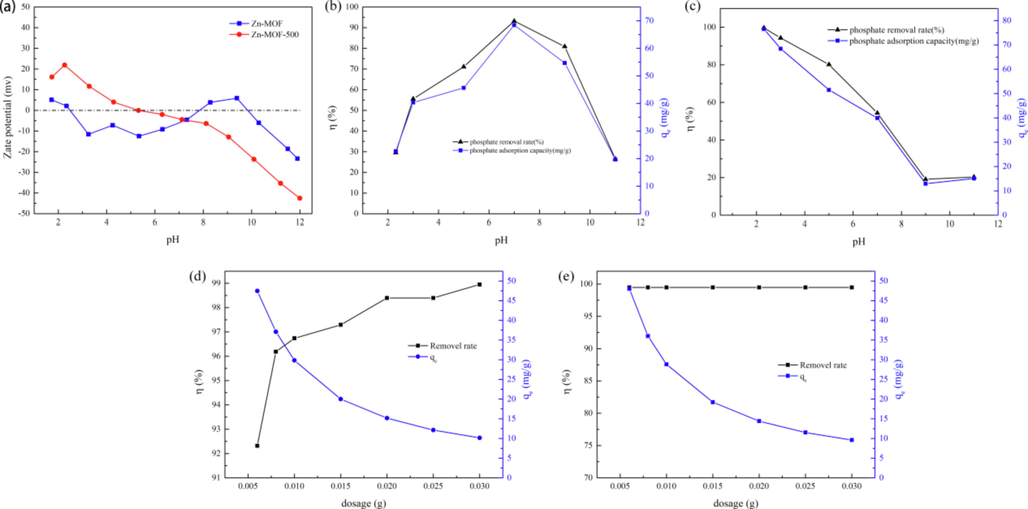
(a) Zeta potential diagram of Zn-MOF and Zn-MOF-500; (b, c) Diagram of phosphate absorption rate and equilibrium adsorption capacity of Zn-MOF and Zn-MOF-500 as a function of pH; (d, e) The absorption rate and equilibrium adsorption capacity of Zn-MOF and Zn-MOF-500.
When the pH was between 2 and 11 (Fig. 3b), the removal rate of Zn-MOF was very limited, approximately 30 mg/g. Zn-MOF showed maximum adsorption capacity and removal rate at pH = 7 when the phosphate ions existed mainly in the form of HPO42– (39.687%) and H2PO4– (60.312%) (Table S4). The Zeta potential of Zn-MOF was negative at pH = 7 and positive at pH = 9 (Fig. 3a). The results revealed that the adsorption of phosphate on Zn-MOF was mainly by the functional groups (Tang et al., 2021).
As can be seen in Fig. 3d, the phosphate removal rate of Zn-MOF gradually increased with the increase in dosage, finally reaching equilibrium. The removal rate was found to increase with the increase in the Zn-MOF dosing. The reason for the observation may be attributed to the following: the number of adsorption sited gradually increase with the increase in the quantity of the additive, which further led to the gradual increase in the removal rate because the concentration of the solution was fixed. Therefore, when the dosing quantity reached a certain volume and because the concentration of phosphate in the solution remains constant, the removal rate started increasing, resulting in a gradual decrease in the adsorption capacity. When the dosage was 0.020 g, the phosphate removal rate of Zn-MOF reached 98.40%, and the remaining concentration of phosphate was 0.330 mg/L.
Zn-MOF-500 had far more active sites than the original Zn-MOF, which resulted in a 99.47% removal rate of phosphate from a solution containing 20 mg/L of the ion, even when the dosage of the adsorbent was only 0.005 g (Fig. 3e). The phosphate remaining concentration of Zn-MOF-500 was only 0.102 mg/L. For the convenience of subsequent experiments and comparing the performance of the two materials, the dosage of the two materials was maintained at 0.020 g.
3.4 Adsorption isotherms
Isothermal adsorption research is used to study the adsorption mechanism and is one of the important methods to obtain adsorption capacity. The adsorption isotherms of Zn-MOF and Zn-MOF-500 under different temperatures were shown in Fig. 4, and the data on fitting were shown in Table 1 (Lian et al., 2021; Zhang et al., 2021c). In this study, all data of Zn-MOF-500 fitted the Langmuir model better than the Freundlich model based on the R2 values (Table 1), which indicated that the adsorption on Zn-MOF-500 was mainly monolayer adsorption. All of the Langmuir model and Freundlich model were fitted well by comparing the R2 values of Zn-MOF; the data fitted the Langmuir model better than the Freundlich model at 298.15 and 308.15 K (Table 1) and fitted the Freundlich model better than the Langmuir model at 288.15 K. Therefore, it could be ascertained that the adsorption that occurred at the surface of the Zn-MOF was monolayer adsorption at 298.15 and 308.15 K and the adsorption that occurred in the pores of Zn-MOF was multilayer adsorption at 288.15 K. Both Zn-MOF and Zn-MOF-500 were found to exhibit good performance when the adsorbed phosphate material was the same (Tables 2 and 3). Zn-MOF-500 is second only to CM-300(R) in Table 3. However, since hydrazine hydrate, which is harmful to the environment, was used in the preparation of CM-300(R), Zn-MOF-500 was found to be more suitable for practical use. Furthermore, the n values of Zn-MOF and Zn-MOF-500 in the Freundlich model were more than 1, which showed that adsorption occurred easily (Table 1) (Rukayat et al., 2021).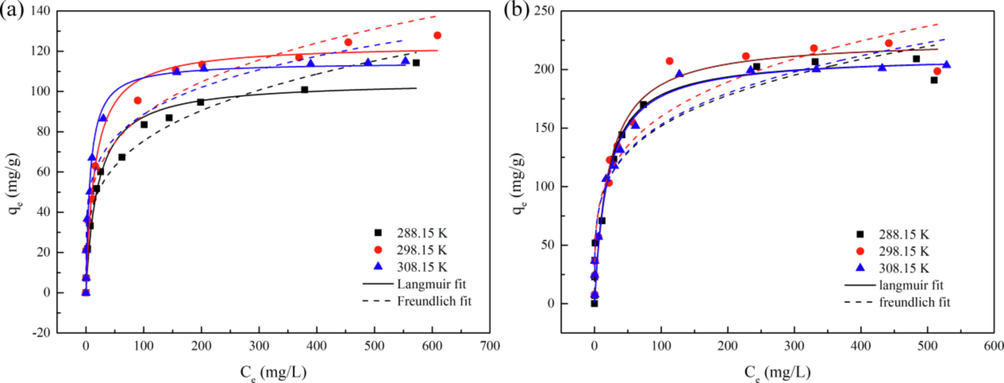
(a, b) Langmuir and Freundlich nonlinear fitting of Zn-MOF and Zn-MOF-500 at 288.15 K, 298.15 K, 308.15 K.
Complexes
T/K
Langmuir
Freundlich
qmax/ (mg/g)
B/(L/mg)
R2
KF
n
R2
Zn-MOF
288.15
105.20
0.049
0.967
22.47
3.80
0.970
298.15
123.44
0.065
0.967
28.72
4.09
0.966
308.15
114.53
0.138
0.983
34.74
4.92
0.929
Zn-MOF-500
288.15
211.90
0.052
0.950
52.45
4.34
0.944
298.15
226.07
0.048
0.965
51.92
4.09
0.914
308.15
212.23
0.050
0.962
52.10
4.27
0.935
Adsorbents
Reaction conditions
qmax/(mg/g)
Ref.
Al-PMA
c0 = 10–100 mg/L, [Ads.] = 0.2 g/L, pH = 7.0, T = 298.15 K
43.38
(Li et al., 2021)
Al-BPDC
c0 = 10–100 mg/L, [Ads.] = 0.2 g/L, pH = 7.0, T = 298.15 K
55.46
(Li et al., 2021)
Al-BHTA
c0 = 10–100 mg/L, [Ads.] = 0.2 g/L, pH = 7.0, T = 298.15 K
74.02
(Li et al., 2021)
UIO-66
c0 = 1010 mg/L, [Ads.] = 1.5–18 g/L, pH = 4.0, T = 298.15 K
74.50
(Guan et al., 2020)
Al-BDC-NH2
c0 = 10–100 mg/L, [Ads.] = 0.2 g/L, pH = 7.0, T = 298.15 K
92.34
(Li et al., 2021)
Al-BDC
c0 = 10–100 mg/L, [Ads.] = 0.2 g/L, pH = 7.0, T = 298.15 K
100.00
(Li et al., 2021)
Fe-MIL-88B
c0 = 50–150 mg/L, [Ads.] = 1 g/L, T = 298.15 K
103.09
(Pandi and Choi 2021)
CMa
c0 = 25–1000 mg/L, [Ads.] = 1 g/L, pH = 6.0, T = 298.15 K
105.00
(He et al., 2020a)
MIL-101(Fe)
c0 = 0.6–60 mg/L, [Ads.] = 0.06 g/L, T = 293 K
107.70
(Xie et al. 2017)
UIO-66-NO3
c0 = 1010 mg/L, [Ads.] = 1.5–18 g/L, pH = 4.0, T = 298.15 K
117.70
(Guan et al., 2020)
Zn-MOF
c0 = 10–600 mg/L, [Ads.] = 1.33 g/L, pH = 7.0, T = 298.15 K
123.44
This work
NH2-MIL-101(Fe)
c0 = 0.6–60 mg/L, [Ads.] = 0.06 g/L, T = 293 K
124.38
(Xie et al. 2017)
UIO-66-Br
c0 = 1010 mg/L, [Ads.] = 1.5–18 g/L, pH = 4.0, T = 298.15 K
132.50
(Guan et al., 2020)
UIO-66-NH2
c0 = 1010 mg/L, [Ads.] = 1.5–18 g/L, pH = 4.0, T = 298.15 K
153.90
(Guan et al., 2020)
Adsorbents
Reaction conditions
qmax/(mg/g)
Ref.
Ce-MOF-500(U)a
c0 = 50–500 mg/L, [Ads.] = 1 g/L, pH = 6.0, T = 298.15 K
82.30
(He et al., 2020b)
La-MOF-500
c0 = 40–100 mg/L, [Ads.] = 0.2 g/L, T = 298.15 K
173.80
(Zhang et al., 2017)
Ce-MOF-500(S)b
c0 = 50–500 mg/L, [Ads.] = 1 g/L, pH = 6.0, T = 298.15 K
189.40
(He et al., 2020b)
CM-150(R)c
c0 = 25–1000 mg/L, [Ads.] = 1 g/L, pH = 6.0, T = 298.15 K
204.00
(He et al., 2020a)
Zn-MOF-500
c0 = 10–500 mg/L, [Ads.] = 1.33 g/L, pH = 3.0, T = 298.15 K
226.07
This work
CM-300(R)c
c0 = 25–1000 mg/L, [Ads.] = 1 g/L, pH = 6.0, T = 298.15 K
273.00
(He et al., 2020a)
3.5 Adsorption kinetics
The pseudo-first-order and pseudo-second-order kinetics are used to fit the nonlinear dynamics of Zn-MOF and Zn-MOF-500 at 288.15 K, 298.15 K, and 308.15 K (Fig. 5). All experimental data fitted the pseudo-second-order kinetics better than the pseudo-first-order kinetics, based on the R2 values (Table 4). The results indicated that the adsorption capacity was proportional to the square of the driving force and that chemical adsorption took place on both materials (Lian et al., 2021). At 308.15 K, the reaction rate constant k2 of Zn-MOF-500 was higher than that at 288.15 K, but its equilibrium adsorption capacity was less than that at 288.15 K.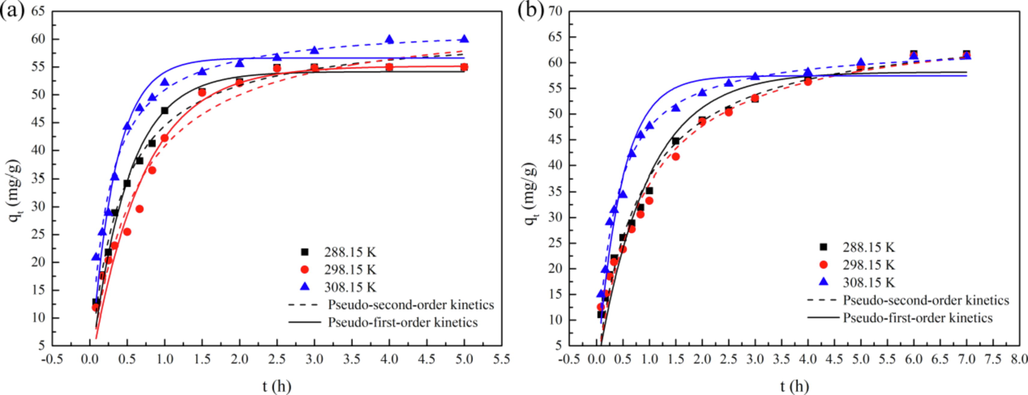
Pseudo-first-order kinetic (a) and pseudo-second-order kinetic (b) nonlinear dynamics fitting of Zn-MOF and Zn-MOF-500 at 288.15 K, 298.15 K and 308.15 K.
Complex
T/K
qe,exp
Pseudo-first-order kinetics
Pseudo-second-order kinetics
qeq/(mg/g)
k1/h−1
R2
qeq
k2/(g/[(mg·h)])
R2
Zn-MOF
288.15
54.98
54.16
2.04
0.982
61.73
0.042
0.989
298.15
54.98
55.25
1.45
0.962
64.78
0.026
0.966
308.15
59.92
56.74
3.07
0.942
62.85
0.068
0.980
Zn-MOF-500
288.15
61.71
58.18
1.06
0.957
68.10
0.018
0.985
298.15
61.37
58.37
0.973
0.947
68.60
0.010
0.975
308.15
61.20
57.45
2.14
0.951
63.72
0.046
0.991
To determine whether the intraparticle diffusion was the rate-limiting step in the adsorption process, the data of Zn-MOF and Zn-MOF-500 were fitted to the intraparticle diffusion model (Table 5).
Complexes
T/K
The first stage
The second stage
Kp
C
R2
Kp
C
R2
Zn-MOF
288.15
47.80
−0.88
0.987
34.29
12.97
0.988
298.15
40.60
−0.491
0.976
9.51
38.84
0.890
308.15
47.12
7.29
0.968
7.04
45.42
0.986
Zn-MOF-500
288.15
35.09
0.824
0.994
13.47
29.24
0.969
298.15
31.84
2.32
0.994
12.65
30.72
0.994
308.15
46.69
2.76
0.971
8.85
40.57
0.929
As shown in Fig. S4 and Table 5, the adsorption of phosphate on Zn-MOF and Zn-MOF-500 was divided into two stages where each fitting point had a linear relationship in multiple segments. In addition, since the fitting curves of the three adsorption stages did not pass through the origin, it indicated that the intraparticle diffusion rate was not the only parameter that controlled the adsorption of phosphate on Zn-MOF and Zn-MOF-500 (Gao et al., 2021).
3.6 Regeneration of adsorbents and anti-interference
The regeneration efficiency of Zn-MOF and Zn-MOF-500 when 0.1 mol/L NaCl solution was employed is depicted in Fig. S5 (Wang et al., 2020). When Zn-MOF-500 was used as the adsorbent, the removal rate remained consistently above 80% even after 6 cycles; however, the removal rate dropped sharply after the first cycle itself when Zn-MOF was used as the adsorbent. When compared with that of Zn-MOF-500, the cycling performance of Zn-MOF was not appreciable. It was observed that carbonization improved the cycling performance of Zn-MOF because its removal rate dropped to less than 50% only after the second cycle.
To study the effect of competitive ions in the adsorption of phosphate, coexisting anions were focused, such as NO3–, Cl–, SO42–, and CO32– in a 10 mg/L phosphate solution (Fig. 6). No obvious effect was observed in the case of Zn-MOF-500 in a 0.1 mol/L solution of coexisting anions and Zn-MOF was observed to perform better with a higher removal rate than the blank in a solution containing NO3– or Cl–. Thus, it was concluded that Zn-MOF-500 performed better in terms of adsorption capacity and anti-interference than Zn-MOF.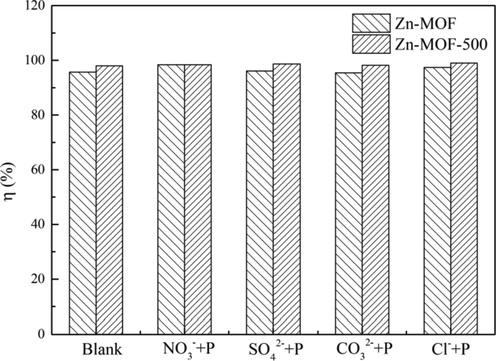
Effect of co-existed anions on Zn-MOF and Zn-MOF-500.
3.7 BET (Brunauer-Emmet-Teller)
The BET-specific surface area of Zn-MOF was 1.11 m2/g and that of Zn-MOF-500 was 18.57 m2/g (Table 6). The BET-specific surface area of Zn-MOF-500 was 16.73 times that of Zn-MOF.
Complexes
SSA(Langmuir)
/g·m−2
SSA(BET) /g·m−2
Pore Volume(BJH)
/g·cm−2
Pore size
/nm
Zn-MOF
2.28
1.11
0.0031
12.12
Zn-MOF-500
88.41
18.57
0.0677
15.52
The pore properties of Zn-MOF and Zn-MOF-500 were obtained using the N2 desorption test (Fig. S6). It was observed that Zn-MOF had no hysteresis loop and that the material was mainly concentrated in the micropores; however, the isotherm of Zn-MOF-500 had an obvious hysteresis loop, it had no obvious saturated adsorption platform, indicating that the pore structure of Zn-MOF-500 was highly irregular.
3.8 Thermogravimetric
The thermogravimetric data of Zn-MOF and Zn-MOF-500 are shown in Fig. S7. From Fig. S7a, the structure of Zn-MOF began to collapse at 322.3 °C and ended when heated to 368.8 °C, and then the remaining mass remains relatively stable until 700 °C, and the final production was zinc oxide. From Fig. S7b, Zn-MOF-500 begins to lose weight at 620.6 °C. It observed that Zn-MOF and Zn-MOF-500 had different weight loss trends, which indicated that the structure of Zn-MOF was destroyed after modification and that Zn-MOF-500 exhibits strong thermal stability.
3.9 XRD and FT-IR (Fourier transform Infrared) spectra
The XRD data and FT-IR spectra of Zn-MOF, Zn-MOF-500, Zn-MOF-500-P (Zn-MOF-500-P is Zn-MOF-500 after adsorption of phosphate), and Zn-MOF-P (Zn-MOF-P is Zn-MOF after adsorption of phosphate) were shown in Fig. 7. Comparing the XRD peak position and peak value of Zn-MOF and Zn-MOF-P (Fig. 7a), we found that the XRD peak position and peak value of Zn-MOF-P were significantly different from the Zn-MOF, indicating that the structures of the two materials are different. This result implies that Zn-MOF is unstable in aqueous solution. Comparing the XRD peak position and peak value of Zn-MOF-500 and Zn-MOF-500-P (Fig. 7b), we found that the XRD peaks positions and peak value of the two materials were basically unchanged. This result implies that Zn-MOF-500 is stable in aqueous solution. By comparing the FT-IR spectra of Zn-MOF and Zn-MOF-500 with those of Zn-MOF-P and Zn-MOF-500-P, it was found that Zn-MOF-P and Zn-MOF-500-P showed strong peaks at 1058 and 1056 cm−1 (Fig. 7c,d), respectively, which proved that C—O (Acharya et al., 2020) underwent a stretching motion during the adsorption process and participated in the process.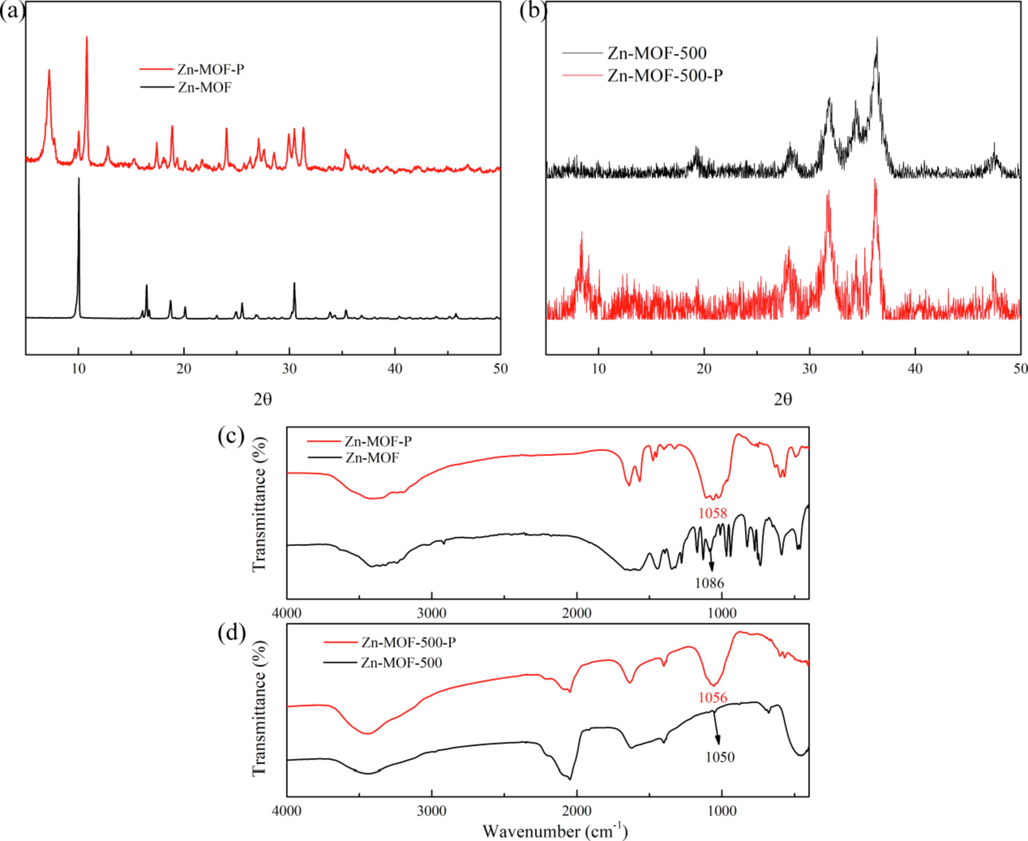
(a, b) XRD peaks of Zn-MOF and Zn-MOF-500 before and after adsorption; (c, d) FT-IR spectra of Zn-MOF and Zn-MOF-500 before and after adsorption.
3.10 Xps
To obtain further information on the mechanism of phosphate adsorption, the XPS spectra of Zn-MOF, Zn-MOF-500, Zn-MOF-P, and Zn-MOF-500-P were obtained (He et al., 2020b; Liu et al., 2021) (Fig. 8). The peak positions of the main elements were found to remain unchanged before and after carbonization (Fig. 8b). When compared with the XPS survey spectra of Zn-MOF and Zn-MOF-500, it was found that a new peak corresponding to the P 2p XP spectral region appeared in the XPS survey spectra of Zn-MOF-P and Zn-MOF-500-P, indicating that the material adsorbs and fixes phosphate very well (Fig. 8a and b). By comparing the XPS N1s and O1s of Zn-MOF (Fig. 8c and d), the binding energy of N1s in Zn-MOF-500 and the binding energy of O1s in Zn-MOF-500 appear a new peak. This is because the structure of Zn-MOF was partially destroyed and some zinc oxide was produced during carbonization.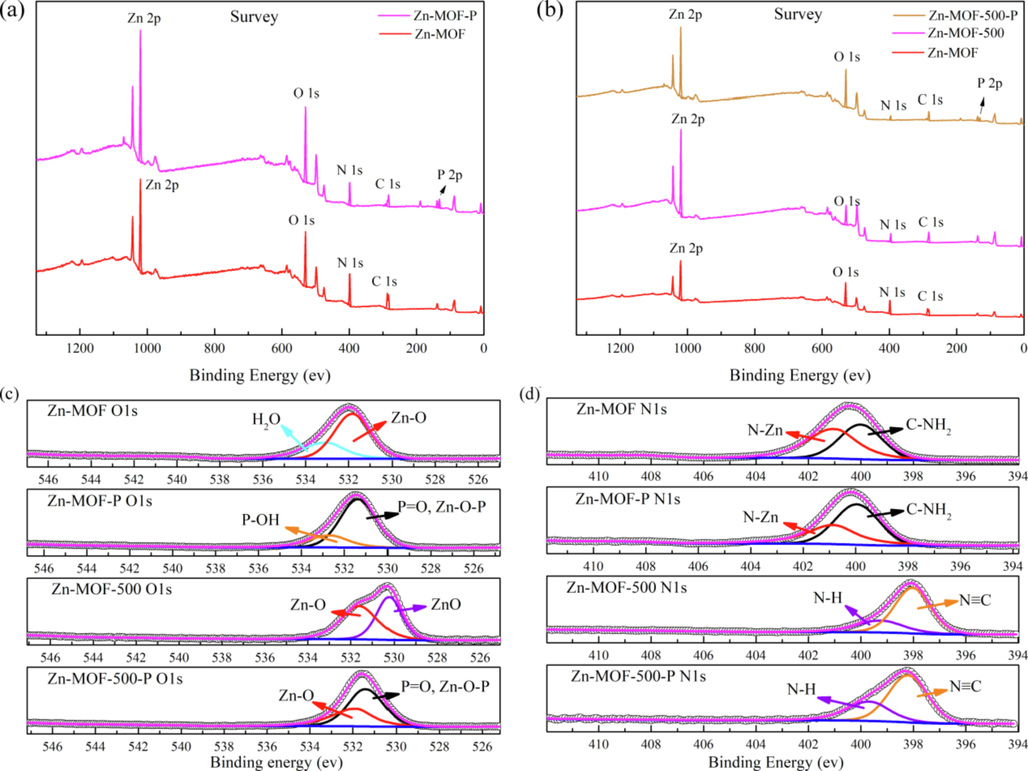
(a, b) XPS survey spectrum of Zn-MOF, Zn-MOF-P, Zn-MOF-500 and Zn-MOF-500-P; (c) Comparison of XPS O1s of Zn-MOF, Zn-MOF-P, Zn-MOF-500 and Zn-MOF-500-P; (d) Comparison of XPS N1s of Zn-MOF, Zn-MOF-P, Zn-MOF-500 and Zn-MOF-500-P.
By comparing Fig. 8c Zn-MOF O1s with Fig. 8c Zn-MOF-P O1s, the lattice water peak (533.00 eV) (Huang et al., 2021) disappeared after adsorption of phosphate, the peak at 523.60 eV in Zn-MOF-P O1s was assigned to the hydroxyl group (P-OH) in HPO42- (Huang et al., 2021), and the peak at 531.40 eV was assigned to Zn-O-P/P = O group (Huang et al., 2021), which indicated that Zn of Zn-MOF forms a strong Zn-O-P bond with phosphate.
In Fig. 8c Zn-MOF-500 O1s, the ZnO peak appeared at 530.20 eV, which indicated that a part of zinc oxide was produced after carbonization. Comparing Zn-MOF-500-P O1s with Zn-MOF-500, the amount of Zn-O peak (531.60 eV) (Zhang et al., 2021a, 2021b, 2021c) was greatly reduced, and Zn—O—P, P⚌O groups peak (531.40 eV) (Huang et al., 2021) appeared, which indicated the Zn on the undamaged part of the Zn-MOF produced Zn—O—P strong bonds with the phosphate. Moreover, the ZnO peak disappeared in Fig. 8c Zn-MOF-500-P which indicated that all ZnO of Zn-MOF-500 participated in the adsorption. In Fig. 8d, the peaks did not have any change after adsorption, indicating that N did not participate in the phosphate adsorption.
In conclusion, according to the results of XPS O1s analysis (Fig. 8c), a large number of Zn—O—P peaks appeared in Zn-MOF and Zn-MOF-500 after adsorption, which mainly indicates Zn—O—P links played a major role in adsorption (Wang et al., 2020). Moreover, another key interaction was the electrostatic attraction between phosphate anions and Zn-MOF-500 (Fig. 3a).
By analyzing the P2p XPS spectral regions of the phosphate ion of Zn-MOF-P and Zn-MOF-500-P (Fig. S8), it was found that the P2p3/2 position in Zn-MOF-P and Zn-MOF-500-P was at 133.14 and 133.34 eV, respectively, which indicated that phosphate was mainly present in the form of zinc hydrogen phosphate or zinc phosphate in the material.
3.11 SEM and EDS (Energy dispersive Spectrometer)
A comparison of the morphologies of Zn-MOF and Zn-MOF-500 in Fig. 9a and b, respectively, showed that there was a change in the surface morphology of the material. It was observed that several obvious pores and gullies appear, the pores were connective (Fig. S9), and the surface roughness was enhanced after carbonization. From the morphology of Zn-MOF-P (Fig. 9c) and the analysis of its EDS spectrum (Fig. S10c), phosphate was found to be adsorbed on the surface of Zn-MOF and the surface roughness of the material was changed to a certain extent. At the same magnification (3000 times), we found that the morphology of the material changed from regular block crystals of Zn-MOF to cluster-shaped crystal structure of Zn-MOF-P (Fig. 9a and 9c). For clearer observation the Zn-MOF-P, the magnification is adjusted to 7000 times (Fig. 9e). From Fig. 9e, it can be found that the cluster-shaped crystals of Zn-MOF-P observed at 3000 times (Fig. 9c) are actually formed by the stacking of many small strip crystals at 7000 times (Fig. 9e). The results show that the stability of Zn-MOF in the adsorption process is not good, but it still has high crystallinity, which is consistent with the experimental results of XRD above (Fig. 7a). The mass fraction of phosphate in Zn-MOF-P was 9.40% (Table S5), which was lower than the phosphate content when the adsorbent was saturated (qmax = 123.44 mg/g, which is 12.344%), indicating that a part of the phosphate was adsorbed in the pores of the Zn-MOF.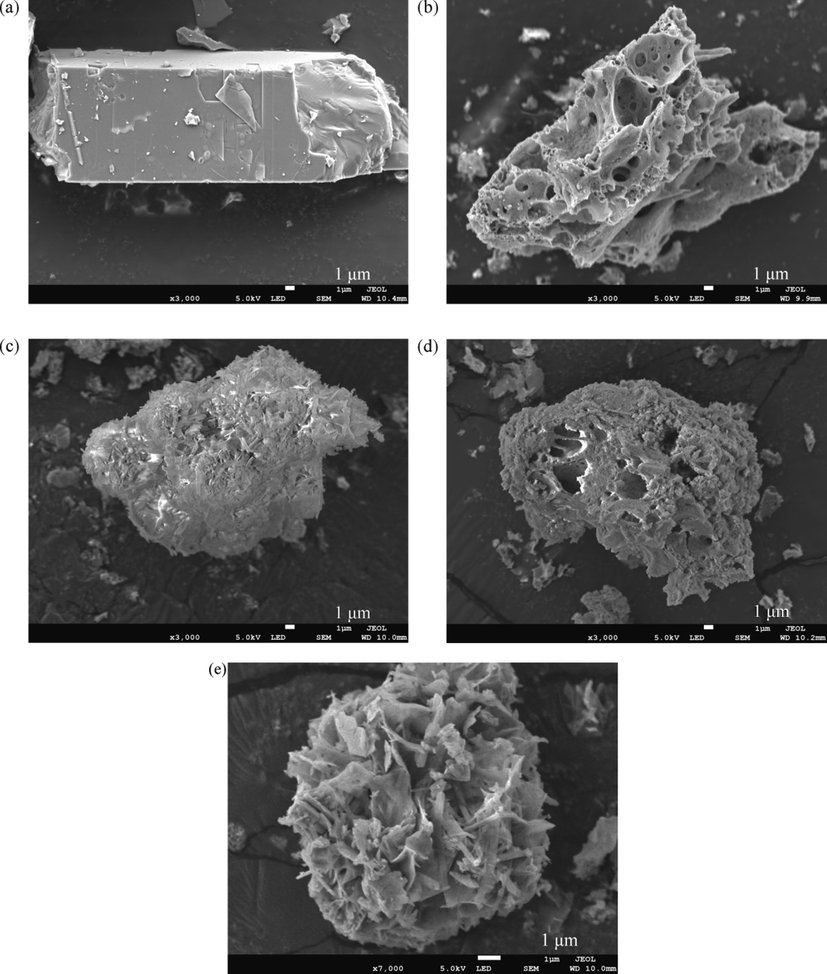
SEM images of (a) Zn-MOF, (b) Zn-MOF-500, (c) Zn-MOF-P and (d) Zn-MOF-500-P in 3000 times; (e) Zn-MOF-P in 7000 times.
The surface roughness of the Zn-MOF-500 is improved after adsorbed the phosphate by comparing Fig. 9b and d, but the physical state of the Zn-MOF-500 before and after adsorption did not change to a large extent. According to Fig. 9d, the Phosphate was adsorbed on the surface of Zn-MOF-500. The mass fraction of phosphate in Zn-MOF-500-P was 1.08% (Table S5), which was much lower than the adsorption saturation of the adsorbent; when the phosphate content (qmax = 226.07 mg/g, 22.607%), it shows that most of the phosphate in the Zn-MOF-500-P was adsorbed in the pores.
Compared with Zn-MOF, the appearance of Zn-MOF-500 has changed greatly and many pores have appeared on the surface of Zn-MOF-500 (Fig. 9a, and b). The result was consistent with the findings of the previous BET characterization, which states that the specific surface area was expanded by 16.73 times. As a result, most of the phosphate was adsorbed in the pores of Zn-MOF-500-P.
4 Conclusion
In this study, a novel zinc-based MOF (Zn-MOF) was synthesized using low-cost, low-toxic zinc acetate dihydrate metal salt as the metal source, and inexpensive H2pda and 5-amino-1H-tetrazolium as the organic ligands; mass production of Zn-MOF was achieved. To further expand the adsorption capacity, Zn-MOF-500 was prepared by carbonization. The two materials were mainly chemical adsorption through kinetic fitting; the maximum adsorption capacity of Zn-MOF-500 was found to be 226.07 mg/g through isothermal fitting. However, this value of Zn-MOF-500 was second only to that of CM-300(R). Because CM-300(R) was prepared using poisonous hydrazine hydrate, Zn-MOF-500 was more suitable for practical purposes.
Acknowledgements
This work was supported by the Nature Science Foundation of China (No. 21861014), the Program of the Collaborative Innovation Center for Exploration of Hidden Nonferrous Metal Deposits and Development of New Materials in Guangxi (No. GXYSXTZX2017-II-3), the Talent introduction program of Guangdong Institute of Petrochemical Technology (No. 2020rc033).
References
- Resurrection of boron nitride in p-n type-II boron nitride/B-doped-g-C3N4 nanocomposite during solid-state Z-scheme charge transfer path for the degradation of tetracycline hydrochloride. J. Colloid Interf. Sci.. 2020;566:211-223.
- [CrossRef] [Google Scholar]
- Performance and prospects of different adsorbents for phosphate uptake and recovery from water. Chem. Eng. J.. 2020;381:12256.
- [CrossRef] [Google Scholar]
- Ti4(embonate)6 Based Cage-Cluster Construction in a Stable Metal−Organic Framework for Gas Sorption and Separation. Cryst. Growth. Des.. 2020;20:29-32.
- [CrossRef] [Google Scholar]
- Reticular access to highly porous acs -MOFs with rigid trigonal prismatic linkers for water sorption. J. Am. Chem. Soc.. 2019;141:2900-2905.
- [CrossRef] [Google Scholar]
- OLEX2: A complete structure solution, refinement and analysis program. J. Appl. Cryst.. 2009;42:339-341.
- [CrossRef] [Google Scholar]
- Ultra-high adsorption capacity and selective removal of Congo red over aminated graphene oxide modified Mn-doped UiO-66 MOF. Powder Technol.. 2020;379:407-416.
- [CrossRef] [Google Scholar]
- Impacts of pyrolysis temperature on lead adsorption by cotton stalk-derived biochar and related mechanisms. J. Environ. Chem. Eng.. 2021;9:105602
- [CrossRef] [Google Scholar]
- Recent progress in the syntheses of mesoporous metal–organic framework materials. Coordin. Chem. Rev.. 2018;369:76-90.
- [CrossRef] [Google Scholar]
- Efficient removal of phosphate from acidified urine using UiO-66 metal organic frameworks with varying functional group. App. Surf. Sci.. 2020;501:144074
- [CrossRef] [Google Scholar]
- Facile synthesis of Sn(II)-MOF using waste PET bottles as an organic precursor and its derivative SnO2 NPs: Role of surface charge reversal in adsorption of toxic ions. J. Environ. Chem. Eng.. 2021;9:105288
- [CrossRef] [Google Scholar]
- Modulation of coordinative unsaturation degree and valence state for cerium-based adsorbent to boost phosphate adsorption. Chem. Eng. J.. 2020;394:124912
- [CrossRef] [Google Scholar]
- Ce(III) nanocomposites by partial thermal decomposition of Ce-MOF for effective phosphate adsorption in a wide H range. Chem. Eng. J.. 2020;379:122431
- [CrossRef] [Google Scholar]
- Two-dimensional hydrophilic ZIF-L as a highly-selective adsorbent for rapid phosphate removal from wastewater. Sci. Total Environ.. 2021;785:147382
- [CrossRef] [Google Scholar]
- Carbonization temperature effects on adsorption performance of metal-organic framework derived nanoporous carbon for removal of methylene blue from wastewater; experimental and spectrometry study. Diam. Relat. Mater.. 2020;108:107999
- [CrossRef] [Google Scholar]
- Enhanced adsorption of resorcinol onto phosphate functionalized graphene oxide synthesized via Arbuzov Reaction: A proposed mechanism of hydrogen bonding and π-π interactions. Chemosphere. 2021;280:130730
- [CrossRef] [Google Scholar]
- Tuning microscopic structure of Al-based metal-organic frameworks by changing organic linkers for efficient phosphate removal. J. Clean. Prod.. 2021;292:125998
- [CrossRef] [Google Scholar]
- Zirconium-based metal organic frameworks: Highly selective adsorbents for removal of phosphate from water and urine. Mater. Chem. Phys.. 2015;160:168-176.
- [CrossRef] [Google Scholar]
- Efficient and selective adsorption of dye in aqueous environment employing a functional Zn(II)-based metal organic framework. J. Solid State Chem.. 2020;292:121740
- [CrossRef] [Google Scholar]
- Orderly Porous Covalent Organic Frameworks-based Materials: Superior Adsorbents for Pollutants Removal from Aqueous Solutions. The innovation. 2021;2:100076
- [CrossRef] [Google Scholar]
- Phosphate adsorption and desorption on two-stage synthesized amorphous-ZrO2/Mg–Fe layered double hydroxide composite. Mater. Chem. Phys.. 2021;266:124559
- [CrossRef] [Google Scholar]
- Selective removal of anionic ions from aqueous environment using iron-based metal-organic frameworks and their mechanistic investigations. J. Mol. Liq.. 2021;329:115367
- [CrossRef] [Google Scholar]
- Kinetic Adsorption of Heavy Metal (Copper) On Rubber (Hevea Brasiliensis) Leaf Powder. South African J. Chem. Eng.. 2021;37:74-80.
- [CrossRef] [Google Scholar]
- Crystal structure refinement with SHELXL. Acta. Crystallogr. C. Struct. Chem.. 2015;71:3-8.
- [CrossRef] [Google Scholar]
- Ranking of Metal-Organic Frameworks (MOFs) for separation of Hexane Isomers by Selective Adsorption. Ind. Eng. Chem. Res.. 2019;58:20047-20065.
- [CrossRef] [Google Scholar]
- Carbon dioxide capture in metal-organic frameworks. Chem. Rev.. 2012;112:724-781.
- [CrossRef] [Google Scholar]
- Effects of functional groups of –NH2 and –NO2 on water adsorption ability of Zr-based MOFs (UiO-66) Chem. Phys.. 2021;543:111093
- [CrossRef] [Google Scholar]
- Study of GUPT-2, a Water-Stable Zinc-based Metal-Organic Framework as a Highly Selective and Sensitive Fluorescence Sensor in the Detection of Al3+ and Fe3+ Ions. CrystEngComm.. 2021;23:4059-4068.
- [CrossRef] [Google Scholar]
- Designing ZIF-8/hydroxylated MWCNT nanocomposites for phosphate adsorption from water: Capability and mechanism. Chem. Eng. J.. 2020;394:124992
- [CrossRef] [Google Scholar]
- Supramolecular control of MOF pore properties for the tailored guest adsorption/separation applications. Coordin. Chem. Rev.. 2021;434
- [CrossRef] [Google Scholar]
- Design and preparation of new luminescent metal–organic frameworks and different doped isomers: sensing pollution ions and enhancement of gas capture capacity. Inorg. Chem. Front. 2021;8:286.
- [CrossRef] [Google Scholar]
- Effective Adsorption and removal of phosphate from aqueous solutions and eutrophic water by Fe-based MOFs of MIL-101. Sci. Rep.-UK. 2017;7:3316.
- [CrossRef] [Google Scholar]
- Improving the hydrostability of ZIF-8 membrane by biomolecule towards enhanced nanofiltration performance for dye removal. J. Membrane Sci.. 2021;618:118630
- [CrossRef] [Google Scholar]
- Zn Metal-Organic Framework with High Stability and Sorption Selectivity for CO2. Organometallics.. 2022;41:829-835.
- [CrossRef] [Google Scholar]
- Robust phosphate capture over inorganic adsorbents derived from lanthanum metal organic frameworks. Chem. Eng. J.. 2017;326:1086-1094.
- [CrossRef] [Google Scholar]
- Dependence of Dye Molecules Adsorption Behaviors on Pore Characteristics of Mesostructured MOFs Fabricated by Surfactant Template. ACS Appl. Mater. Inter.. 2019;11:31441-31451.
- [CrossRef] [Google Scholar]
- Efficient SO2 removal using a microporous metal−organic framework with molecular sieving effect. Ind. Eng. Chem. Res.. 2020;59:874-882.
- [CrossRef] [Google Scholar]
- Study of the dynamic adsorption and the effect of the presence of different cations and anions on the adsorption of As(V) on GUT-3. Appl. Organomet. Chem.. 2021;35:e6289
- [CrossRef] [Google Scholar]
- Molecular study of heterogeneous mercury conversion mechanism over Cu-MOFs: Oxidation pathway and effect of halogen. Fuel. 2021;290:120030
- [CrossRef] [Google Scholar]
- Effective and structure-controlled adsorption of tetracycline hydrochloride from aqueous solution by using Fe-based metal-organic frameworks. Appl. Surf. Sci.. 2021;542:148662
- [CrossRef] [Google Scholar]
Appendix A
Supplementary material
Deposition Number 2153990 was the CCDC numbers for Zn-MOF. The data for Zn-MOF is available for free at http://www.ccdc.cam.ac.uk, or by contacting The Cambridge Crystallographic Data Centre, 12 Union Road, Cambridge CB2 1EZ, UK; fax: +44 1223 336033. Electronic supplementary information (ESI) available: Materials and chemicals, Scheme and characterization of adsorption experiment, crystallographic details, selected bond lengths and angles, SHAPE data of Zn-MOF, FTIR curves, Zn-MOF stacking diagram, XRD spactra of Zn-MOF, Distribution of various forms of phosphate in water at different temperatures, Adsorption kinetics of phosphate onto (a) Zn-MOF and (b) Zn-MOF-500, Recyclability test of Zn-MOF and Zn-MOF-500 in water at 25 oC, Nitrogen adsorption-desorption isotherm and pore size distribution of Zn-MOF (a,b) and Zn-MOF-500(c,d), TGA of Zn-MOF and Zn-MOF-500, Comparison of XPS P2p of the (a) Zn-MOF-P and (b) Zn-MOF-500-P. SEM images of Zn-MOF-500 before the adsorption of phosphate under 20000 times, The EDS energy spectrum, EDS Energy Spectrum Data Sheet. Supplementary data to this article can be found online at https://doi.org/10.1016/j.arabjc.2022.103955.
Appendix A
Supplementary material
The following are the Supplementary data to this article:Supplementary data 1
Supplementary data 1
Supplementary data 2
Supplementary data 2


