

Translate this page into:
Liquid chromatographic determination of per- and polyfluoroalkyl substances in environmental river water samples
⁎Corresponding author. pnnomngongo@uj.ac.za (Philiswa Nosizo Nomngongo)
-
Received: ,
Accepted: ,
This article was originally published by Elsevier and was migrated to Scientific Scholar after the change of Publisher.
Peer review under responsibility of King Saud University.
Abstract
Contaminants of emerging concern (CECs) such as per- and polyfluoroalkyl substances (PFAS) have attracted significant interest from researchers, policymakers, and water treatment facilities. This is because PFAS are highly persistent in the environment and tend to be bio-accumulative thus causing adverse effects on terrestrial and aquatic life. Therefore, there is a need for simpler and fast methods for the determination of PFAS in water sources. This work aims at the application of dispersive magnetic solid-phase extraction (DMSPE) for the enrichment of PFAS in various surface water samples. Magnetic Fe3O4@MIL-101 (Cr) was used as an adsorbent in MSPE. Fe3O4@MIL-101(Cr) was used for the first time for the preconcentration and extraction of PFAS in various river water samples. The concentrations of target analytes in water samples were determined using high performance liquid chromatography-diode array detector and ultra-high performance liquid chromatography-tandem mass spectrometry analysis. The combination of optimized DMSPE with HPLC-DAD and UHPLC-MS/MS provided wide linear range (1–5000 ng/L and 0.05–2000 ng/L, low limits of detection (0.3–0.66 ng/L and 0.011–0.04 ng/L) and limits of quantification (1.0–2.2 ng/L and 0.04–0.12 ng/L). Moreover, acceptable intraday and interday precision based on the relative standard deviation (RSD) lower than 5% were obtained. The developed method showed remarkable practicability for the analysis of ultra-trace PFAS in water samples.
Keywords
Per- and polyfluoroalkyl substances
Magnetic solid phase extraction
Emerging pollutants
Metal-organic frameworks
Liquid chromatography

1 Introduction
Per- and polyfluoroalkyl substances (PFAS) represent a group of compounds consisting of acidic functional groups and perfluorinated akyl chains (Maizel et al., 2021). These PFAS poses attractive features such as good chemical stability, excellent hydrophobicity, excellent thermal stability, and high surface activity (Feng et al., 2019), hence their wide application in the industrial production of pharmaceuticals, and pesticides. During the application and production of PFAS, they are likely to leach out to the environmental compartments and living organisms through multiple pathways (Domingo and Nadal, 2019). The chemical compositions of PFAS consist of strong carbon–fluorine (C-F) bonds which makes them unaffected by natural processes such as hydrolysis, biological degradation, and photolysis, which leads to their environmental persistence and bio-accumulation (Maizel et al., 2021). Recently, PFAS have been detected in environmental bodies (Ghisi et al., 2019), living organisms (Feng et al., 2019), sediments (Nakayama et al., 2019), and aquatic organisms (Zhang et al., 2011). The potential health risks of these compounds on human bodies and other living organisms have raised much attention (Zhang et al., 2019). Studies have reported that too much exposure to PFAS may lead to hepatocyte damage (Bassler et al., 2019), affect reproduction organs (Jin et al., 2020), tamper with gene expression and could cause cancer (Wilkinson et al., 2017). Therefore, the development and design of advanced methods for monitoring and detection of PFAS in environmental matrices are of great significance.
Various emerging contaminants including PFAS have been detected, separated, identified and quantified at trace levels using chromatographic techniques such as liquid or gas chromatography coupled with mass spectrometry (GC/LC-MS/MS) (Marra et al., 2020; Xian et al., 2020). However, direct analysis of PFAS is challenging because of the complexity of sample matrices and their low concentration in various environmental samples (Aryal et al., 2020; Zhang et al., 2018). Sample preparation methods such as solid-phase extraction (SPE) (Deng et al., 2018), liquid–liquid extraction (LLE) (Wang et al., 2018), dispersive solid-phase extraction (DSPE) (Jiang et al., 2021), magnetic solid-phase extraction (MSPE) (Xian et al., 2020), amongst others, have been utilised for extraction and enrichment of trace PFAS in environmental water samples before analytical detection. Studies have indicated that sample preparation is crucial for the satisfactory analysis of emerging pollutants since it leads to better analytical results (Dimpe and Nomngongo, 2016; Xu et al., 2022).
Solid phase extraction methods are widely used as compared to traditional LLE because of their attractive features such as s simple operation, reliability, sensitivity, and low organic solvent usage, use of different adsorbents, high enrichment factors (Azizi and Bottaro, 2020). On the other hand, traditional LLE methods are reported not to be preferable sample preparation since they required the use of a large volume of toxic solvents (Selahle et al., 2021; Ghamat et al., 2019). Even though SPE is the most preferred sample preparation method, column-SPE is reported to have insufficient in retaining some hydrophilic short-chain PFAS thus resulting in poor extraction efficiency (Li et al., 2022). The sorbents that are widely utilized in column-SPE for extraction and enrichment of PFAS from water matrices include Oasis WAX sorbent, C18 and HLB polymer (Brumovský et al., 2018; Munoz et al., 2019), among others. The disadvantage of using these commercial sorbents is that they are expensive, and they require to be operated in an SPE manifold which can be time-consuming (Speltini et al., 2016; Souza-Silva et al., 2015).
Magnetic solid phase, a new method of SPE was then introduced to overcome all the drawbacks brought by commercial sorbents (Ren et al., 2018). Magnetic solid phase extraction needs only an external magnet to isolate magnetic sorbents after they have been dispersed in the sample solution to preconcentrate the analytes (Ren et al., 2018; Wang et al., 2020; An et al., 2022). In comparison with traditional SPE, MSPE has many advantages, such as the use small amount of adsorbent (in milligrams) and ease of use. The choice of adsorbent is crucial in SPE based techniques (Selahle et al., 2020). Among other widely used adsorbents, metal–organic frameworks (MOFs) have gained much attention because of their good characteristics such as tuneable structure and large porosity (Wang et al., 2020; Zhang et al., 2016; Xu et al., 2021). The large high surface area, pore-volume, good chemical and thermal stability as well as flexibility, make MOFs be alternative adsorbents for various applications such as gas storage (Li et al., 2019), luminescence (Chen et al., 2017), electrode materials (Zhao et al., 2018), catalysis (Wen et al., 2018), sensing (Dong et al., 2019), biomedicine (Velásquez-Hernández et al., 2020), drug delivery (Lazaro and Forgan, 2019), energy storage (Duan et al., 2021)and environmental analysis (Jia et al., 2021; Fan et al., 2021; Zhang et al., 2021). Furthermore, the incorporation of magnetic (Fe3O4) nanoparticles into the MOF matrix enables easy magnetic separation, reasonable reusability and recovery of the absorbents from the aqueous sample (Wang et al., 2020; Omer et al., 2021).
In this study, MIL-101(Cr) was modified with Fe3O4 nanoparticles via a coprecipitation method and subsequently used for DMSPE of PFAS in river water prior to HPLC-DAD and UHPLC-MS/MS determination. The incorporation of Fe3O4 into MOF material resulted in an adsorbent with improved separability and recyclability. It has been reported in the literature that, the incorporation of the Fe3O4 can reduce the surface area of the MOF materials, leading to lower adsorption capacities (Akawa et al., 2021). Even so, the Fe3O4@MIL-101(Cr) nanocomposite showed great potential in the extraction of PFAS. This is because Fe3O4@MIL-101(Cr) offered several interactions with the analytes. These include acid-base, π–CF and electrostatic interactions as well as hydrogen bonding Fe3O4@MIL-101(Cr) and PFAS. The influential extraction parameters were optimized using a design of experiments. For this purpose, fractional factorial design (FFD) and central composite designs (CCD) were chosen because they save time compared to the traditional one factor at a time (OFAT) optimization process. Lastly, the developed method was validated and applied for the analysis of the PFAS in river water samples.
2 Experimental
2.1 Chemicals and reagents
Chemicals and reagents were commercially obtainable, and they were not modified before use. Chromium nitrate nanohydrate (99.9%), terephthalic acid, sodium acetate (98%), ferric trichloride hexahydrate (99%), polypyrrolidone (99.9%), tetraethyl orthosilicate (TEOS)(99%), polyvinylpyrrolidone (PVP) (98%), sodium borohydride (NaBH4)(99.9%), ammonium acetate, were all bought from Sigma-Aldrich (St Louis, MO, USA). HPLC grade acetonitrile, methanol and ethanol were bought from Sigma-Aldrich. The analytes of interest namely, perfluorooctanoic acid (PFOA)(97%), perfluorodecanoic acid (PFDA)(96%), perfluorooctanesulfonic acid (PFOS)(96%) and perfluorotetradecanoic acid (PFTeDA)(96%) also were bought from Sigma-Aldrich. A certified reference material (IRMM-428 water) containing six PFAS that is, perfluorohexane sulfonate (PFHxS), perfluorohexanoic acid (PFHxA), linear perfluorooctane sulfonate (L-PFOS), perfluorobutane sulfonate (PFBS), perfluoroheptanoic acid (PFHpA), and perfluoropentanoic acid (PFPeA), was used to investigate the accuracy of the method.
2.2 Instrumentation
X-ray diffraction (XRD) spectroscopy, Surface Area and Porosity Analyzer (ASAP2020 V3. 00H, Micromeritics Instrument Corporation, Norcross, USA), Transmission electron microscope (TEM JOEL JEM-2100, Japan), FTIR Perkin-Elmer Spectrum 100 spectrometer (Perkin-Elmer, USA), Waldbronn Germany, OHAUS starter 2100 pH meter (Pine Brook, NJ, USA), ultrasound bath (Bandelin Sonorex Digitec, Bandelin electronic GmbH&Co. KG, Berlin, Germany).
The detection and quantification of the analytes were carried out by two chromatographic analyses. Firstly, an Agilent HPLC 1200 infinity series, equipped with a diode array detector (Agilent Technologies, Waldbronn Germany). An Agilent Zorbax Eclipse Plus C18 column (3.5 µm × 150 mm × 4.6 mm) (Agilent Newport, CA, USA) for separation of PFAS using a sing a binary isocratic mobile phase. The mobile phase consisted of 10 mM ammonium acetate and methanol mixture, mobile phase A: 30% ammonium acetate and mobile phase B: 70% methanol. A flow rate of 0.100 mL/min was used for the entire analysis (isocratic). Secondly, a UHPLC-MS/MS quantification of PFAS was performed using the Shimadzu Nexera X2 Series UHPLC system (Shimadzu Corp., Kyoto, Japan) coupled with Shimadzu 8040 mass spectrometer. Optimized chromatographic separations of PFAS were conducted with a Zorbax Eclipse Plus C18 column (3.5 µm × 150 mm × 4.6 mm) sing a binary gradient mobile phase. The mobile phase was composed of 20 mM of ammonium acetate and methanol mixture (45% ammonium acetate and 55% methanol) at a flow rate of 0.5 mL/min.
2.3 Sample collection
River water samples were collected from Apies River, Hennops River and Pienaars River Pretoria, (Pretoria, Gauteng). The samples were obtained in cleaned glass bottles and were kept at 4–8 °C for 5 days until the analysis.
2.4 Preparation of Fe3O4, MIL-101 (Cr), Fe3O4@MIL-101(Cr)
2.4.1 Preparation of Fe3O4
The magnetic ferrous ferric oxide nanoparticles were prepared by the co-precipitation method previously reported by (Munonde et al., 2018). A mixture composed of 10.00 g of FeCl3·6H2O and 5.00 g of FeCl2·4H2O was dispersed in 200 mL of deionized water under a nitrogen environment with vigorous mechanical stirring at 90 °C. 50 mL of ammonia solution was added to the solution and the colour of the solution transformed from dark yellow to black. The mixture was stirred for 30 min then it was cooled at room temperature. Fe3O4 solids were isolated from the supernatant with an aid of a magnetic and then washed several times with deionized water. The obtained Fe3O4 was dried in an oven at 50 °C for 10 h and the powder was finely crushed.
2.4.2 Preparation of MIL-101 (Cr)
The MIL-101(Cr) was made by a modified method informed by (Gao et al., 2018; Zhou et al., 2017). Chromium nitrate nanohydrate, sodium acetate and terephthalic acid were dispersed in deionized water and transferred to a Teflon-lined stainless-steel reactor and put in an oven set at 250 °C for 12 h. Fine greenish crystals were obtained by filtration with a vacuum pump and washed thoroughly with dimethylformamide (DMF) and ultrapure water. The crystals were further immersed in 200 mL of ethanol in the Teflon-lined stainless steel and kept at 110 °C for 12 h in a vacuum oven. The obtained product was filtered again, washed repeatedly with ultrapure water, and allowed to dry in an oven at 80 °C.
2.4.3 Preparation of Fe3O4@MIL-101(Cr) nanocomposite
The synthesis of Fe3O4@MIL-101(Cr) was prepared via a conventional co-precipitation method as illustrated in Fig. 1. Briefly, 1.0 g of MIL-101(Cr) was added into a 50 mL solution of Fe(II) and Fe(III) mixed at a mole ratio of 2:3. This was followed by the slow addition of ammonia solution with stirring. The mixture was allowed to react under constant stirring in an inert environment for 2 h to form black precipitate. The obtained product was washed with ultrapure water and ethanol repeatedly and then dried in an oven at 60 °C for 12 h. It should be noted that the amounts stated in this method were scaled up to achieve about 5.0 g of the materials which were then used throughout the experiments.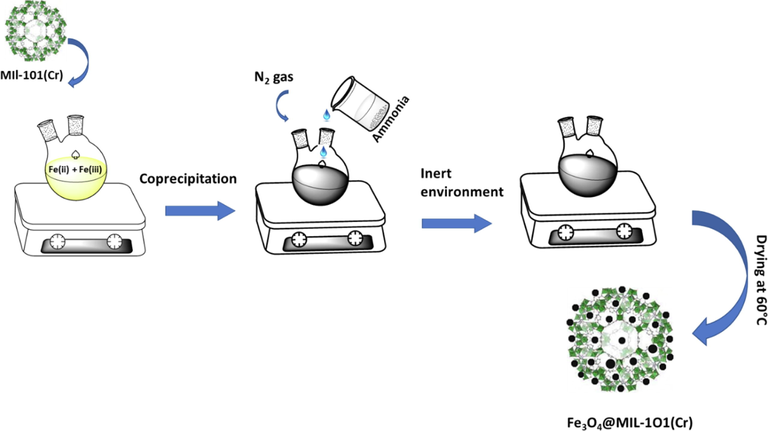
A schematic diagram illustrating the synthesis of FeO4@MIL-101(Cr).
2.5 Dispersive magnetic solid phase microextraction
The enrichment of PFAS was carried out using a DMSPE procedure reported by Ref (Mpupa et al., 2018). Briefly, 23 mg of Fe3O4@MIL-101(Cr) was accurately weighed into glass sample bottles. Into each respective sample bottle, 5 mL of the sample containing 50 ng/L of analytes was added. To disperse the sorbent in the sample accordingly, the mixture of the sorbent and sample was placed in an ultrasound water bath for 33 min. After sonication, the sorbent and supernatant were isolated with the aid of a magnet. After which, 1000 µL of eluent (methanol) was then sonicated for 30 min and the eluent-sorbent was isolated by magnetic decantation. The eluent was filtered by 0.22 µm syringe filters before instrumental analysis.
2.6 Optimization of dispersive magnetic solid phase microextraction technique
The optimisation of the enrichment procedure was carried out in two ways. Firstly, screening of the parameters was carried out using multivariate optimisation. Secondly, a central composite design (CCD) was used to determine the optimum conditions, and the parameters used in the design are illustrated in Table S1.
2.7 Method validation and quality assurance/quality control (QA/QC)
The DMSPE method was validated by investigating different analytical parameters such as the linear range, the limit of quantification (LOQ) and limit of detection (LOD), precision (interday and intraday articulated as relative standard deviation, (% RSD), accuracy, following the modified procedures reported by Ghaemi and Amiri (2020) and Lekota et al. (2020). The interday (n = 5 working days) and intraday (n = 10 measurements) precisions of the developed DMSPE method were evaluated by analysing a model solution composed of 50 ng/L of each analyte. The method accuracy (expressed as percentage recoveries) was evaluated by spiking river water samples. River water samples were spiked at three concentration levels (10, 100, and 300 ng/L) and analysed in triplicate. The method linearity was evaluated by spiking blank river water samples to prepare seven standard solutions having 0–10,000 ng/L of each analyte. The standards were extracted and preconcentrated with the proposed method and a seven-point calibration plot was created. For each standard prepared, three replicates were analysed with HPLC-DAD and UHPLC-MS/MS. The LOD and LOQ were estimated as LOD = and LOQ = , respectively. Where ‘sd’ is the standard deviation of peak areas often replicates measurements of the lowest concentration (1.0 ng/L) of the calibration curve and ‘m’ is the slope of the linear plot.
The repeatability and reproducibility of the developed method were calculated from several measurements of 5.0, 100, and 500 μg L−1 in river water samples. This was carried out to assess the matrix effect on the extraction efficiency of the developed method. The matrix factor and matrix effect were calculated by comparison of the calibration curve slopes of each analyte prepared in spiked river water and ultrapure water samples processed using the DMSPE method. Matrix factor (MF) and matrix effect (%ME) were calculated using equations (1) and (2), respectively.
%ME values <−50% or >+50%, they are considered to have a strong effect (Szarka et al., 2022). Furthermore, %MEs are described as soft if they are within the range of –20% < %MEs < 20%. The enhancement factor (EF), expressed as the proportion of the slopes of the calibration plots before and after preconcentration. EF is denoted by Equation (3).
Subsequently, the relative recoveries (RR) are calculated using equation (4):
To ensure that the results obtained were accurate and reliable, (QA/QC) guidelines were followed. This was done by injecting blanks to the HPLC-DAD/ UHPLC-MS/Ms system before the introduction of the samples. The chromatograms had no peaks that correspond to the target analytes, suggesting that the blank correction was not required. Additionally, Standard solutions of neonicotinoid insecticides at concentration of 50 ng/L and 500 ng/L As well as IRMM-428 water (CRM) were used as QA/QC samples. During sample analysis, blank samples that are treated the same way as samples and QA/QC samples were analyzed after every five samples.
2.8 Determination of point of zero charge Fe3O4@MIL-101(Cr)
The point of zero charge of the nanocomposite was examined by a previously reported modified method (Biata et al., 2020). 0.10 g of Fe3O4@MIL-101(Cr) was placed into a glass bottle, and then solutions of adjusted pH in the range of 2 to 10 using acetic acid and ammonium hydroxide solutions were added into the glass bottles having adsorbents. Subsequently, the solutions were dispersed for 48 h. The final pHs of the solutions were measured. The point of zero charge was taken from a plot of (pHf–pHi) versus pHi.
2.9 Reusability, regeneration, and stability studies
Reusability and regeneration studies of Fe3O4@MIL-101(Cr) were assessed by performing several adsorption–desorption cycles. Briefly, 5 mL of the synthetic sample solution composed of target analytes were placed in glass bottles containing 23 mg of Fe3O4@MIL-101(Cr) nanocomposite. The mixture of the sorbent and model samples was sonicated for 30 min and eluted with methanol. The eluent having the target analytes was analysed using HPLC-DAD and UHPLC-MS/MS. The sorbent used was washed with water, then rinsed with ethanol and dried in an oven at 60 °C for 1–2 h. The sorbent was then used for the succeeding extraction and elution cycles. At the end of each extraction, the percentage recoveries of the analytes were calculated.
3 Results and discussion
3.1 Characterizations
The functional groups of the nanocomposite were examined using FTIR spectroscopy and the results are presented in Fig. 2. This analytical technique was also used to confirm the successful incorporation of Fe3O4 onto MIL-101 (Cr). The broad peak at around 3400 cm−1 (a) from the three spectra was due to the existence of the O—H bond. Another peak at around 1698 cm−1 (b) was denoted to C⚌O stretching of the carboxylic acids found in MIL-101(Cr). C⚌C stretching of the aromatic compounds was observed at around 1621 cm−1 (c). The small band at approximately 1404 cm−1 were assigned to O—C—O symmetrical stretching vibration. The sharp long peak at 1396 cm−1(d) was due to the alkane C—H and followed by the C—O peak was found at around 1008 cm−1 (e) which forms the MIL-101(Cr) composite. The last two bands observed at around 746 cm−1 (f) and 582 cm−1 (g) were attributed to Cr and Fe. The functional groups of Fe3O4 and MIL-101(Cr) were both present in the theFe3O4@MIL-101 spectra, which confirms a successful synthesis of the Fe3O4@MIL-101(Cr).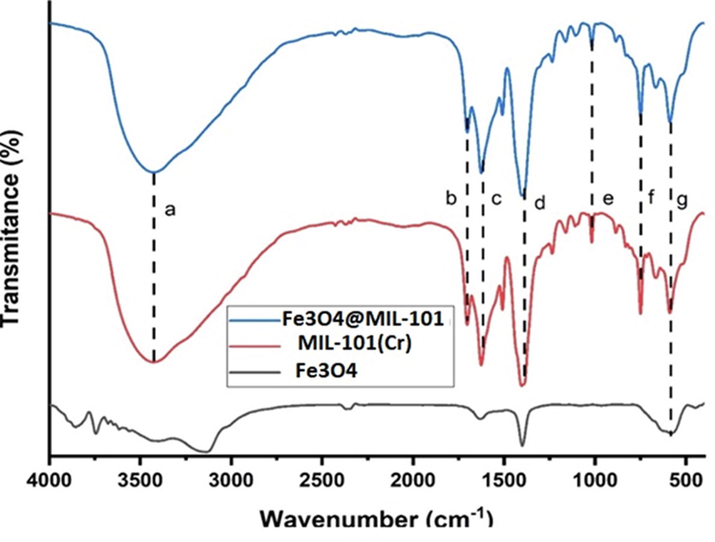
FTIR spectra of Fe3O4, MIL-101(Cr) and Fe3O4@MIL-101(Cr).
Transmission Electron Microscopy (TEM) was used to investigate the morphology of Fe3O4, MIL-101(Cr), and Fe3O4@MIL-101(Cr) nanocomposite. The TEM image (Fig. 3a) revealed that Fe3O4 was composed of small spherical particles which were uniform in size (Munonde et al., 2018). Fig. 3 indicated that MIL-101(Cr) was made of cubic porous particles which were not uniform in size. (Gao et al., 2018; Tan and Lee, 2019). Fig. 3c showed that the small spherical Fe3O4 nanoparticles were encapsulated by the MIL-101(Cr). The Fe3O4 nanoparticles created a nuclear on the centre of the MIL-101(Cr) forming the Fe3O4@MIL-101(Cr) nanocomposite. These findings were comparable to a study by (Zhou et al., 2017).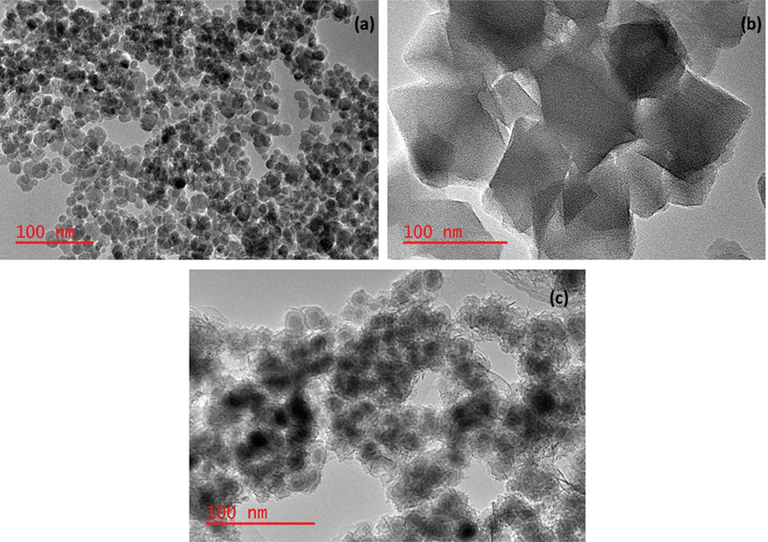
TEM images of (a) Fe3O4, (b) MIL-101(Cr), and (c)Fe3O4@MIL-101(Cr).
Mapping scanning was employed as part of characterization to assess the distribution of the elements in the nanocomposite. Fig. S1 shows the distribution of the elements iron (Fe), carbon (C), oxygen (O) and chromium (Cr), respectively. The images exhibited that C and O were uniformly distributed, which indicated a good dispersion of Fe nanoparticles in the nanocomposite formed.
X-ray diffraction (XRD) was carried out to investigate if the nanocomposite was amorphous or crystalline. Fig. S2a presented the XRD patterns of MIL-101(Cr) and the characteristic peaks are similar to those reported by Zorainy and co-workers (Zorainy et al., 2021), who also reported a crystalline MIL-101(Cr). Fig. S2b displayed that Fe3O4 was highly crystalline and the prominent diffraction peaks around 29.5°, 30.8°, 41.6°, 58.7° and 65.5° matched the crystalline structure of Fe3O4 (JCPDS file 19–0629). Fig. S2c exhibited that the formed nanocomposite was crystalline. The peaks found in the MIL-101(Cr) and the Fe3O4 were all present in the XRD of the nanocomposite. Fe3O4 peaks are indicated to be dominant in the nanocomposite according to Fig. S2c. This proved that the Fe3O4 was encapsulating the MIL-101(Cr) similar to TEM results. Moreover, Fig. S2c showed that most peaks of MIL-101(Cr) were suppressed from the nanocomposite.
The nitrogen adsorption–desorption isotherms of Fe3O4, MIL-101 (Cr) andFe3O4@MIL-101(Cr) composites measured at 77 K are presented in Fig. 4. According to Fig. 4, the nanocomposite was composed of mesoporous structures which were confirmed by the type IV N2 adsorption–desorption isotherms. The Brunauer–Emmett–Teller (BET) specific surface area of Fe3O4, MIL-101(Cr) andFe3O4@MIL-101(Cr) were calculated to be 182 m2 g−1, 2794 m2 g−1 and 1582 m2 g−1, respectively. The pore volumes of Fe3O4, MIL-101(Cr) and Fe3O4@MIL-101(Cr) were determined to be 0.412 cm3 g−1, 1.46 cm3 g−1 and 0.82 cm3 g−1, respectively. The pore sizes were examined by the Barrett–Joyner–Halenda (BJH) method and they were found to be 2.36 nm, 1.32 nm and 2,08 nm respectively. After the filling of Fe3O4 nanoparticles in the pores of MIL-101(Cr), the BET surface area and pore volume of the Fe3O4@MIL-101(Cr) indicated a significant reduction. This provided a prove that Fe3O4 nanoparticles were embedded in the pores of MIL-101(Cr) to form the desired nanocomposite (Zhou et al., 2017).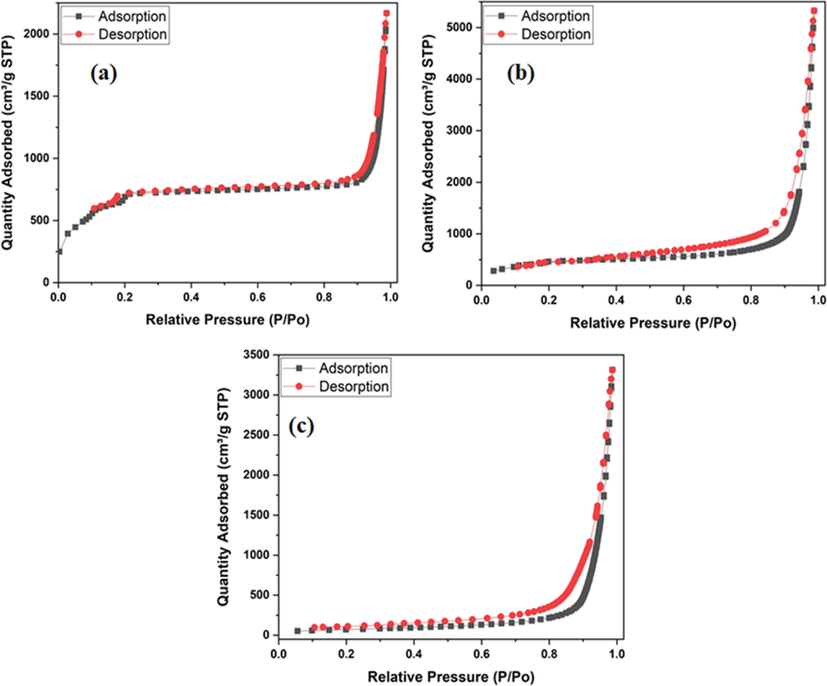
The nitrogen adsorption–desorption isotherms of (a) Fe3O4, (b) MIL-101 (Cr) and (c) Fe3O4@MIL-101(Cr).
The magnetic properties of Fe3O4 and Fe3O4@MIL-101(Cr) nanocomposite were investigated by vibrating sample magnetometry (VSM). The results obtained are depicted in Fig. S3. Based on Fig. S3, the saturation magnetization values of the Fe3O4 and Fe3O4@MIL-101(Cr) were approximately 40 and 7.48 emu·g−1, respectively. As seen in Fig. S3B, the magnetic property of the nanocomposite has decreased significantly in comparison to F3O4. This decrease in the magnetic property indicated the successful incorporation of Fe3O4 into MIL-101(Cr). Nonetheless, the magnetization value of the nanocomposite is enough for magnetic separation via the application of an external magnetic field. Similar findings have been reported in the literature.
3.2 Point of zero charge
Point of zero charge experiments was performed to get an insight into the surface science of the synthesized Fe3O4@MIL-101(Cr). The results obtained are illustrated in Fig. S4. The surface charge of Fe3O4@MIL-101(Cr) was found to be positively charged from low pH values up to pH 4.4 and negatively charge above pH 4.4.
3.3 Univariate optimisation
3.3.1 Selection of sorbent material
The synthesized Fe3O4, MIL-101 (Cr) and Fe3O4@MIL-101 (Cr) materials were tested to investigate whether the composite material performed better than its components. This was done by evaluating extraction efficiency in terms of the percent recovery (%R) of each material and the results are shown in Fig. S5. These results showed that the composite material that is, Fe3O4@MIL-101 (Cr) resulted in a significantly higher %R for all the investigated analytes in comparison to its components with recoveries. MIL-101 (Cr) also resulted in a relatively high %R but the disadvantage is difficult to separate from aqueous solutions. Consequently, the composite material could be used for all further experimentation.
3.3.2 Selection of eluent type
To select a suitable eluent for elution of PFAS from the surface of Fe3O4@MIL-101(Cr), different organic solvents were assessed, and the results are shown in Fig. 5. Methanol was found to be the most suitable solvent for eluting the analytes based on the percentage recoveries obtained. It was used for further studies. This suggested that PFAS were highly soluble in methanol.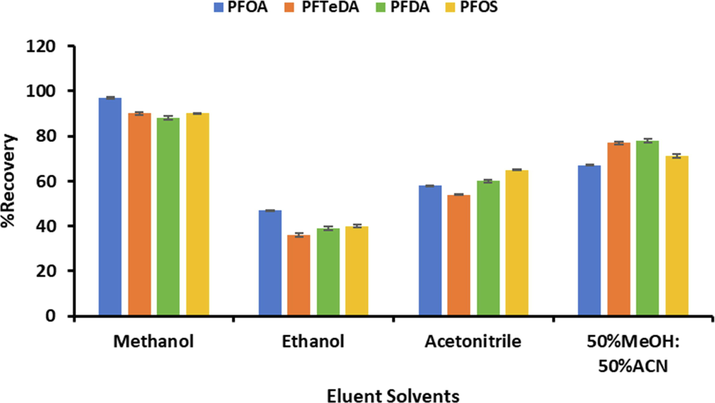
Selection of suitable eluent.
3.4 Optimization of dispersive magnetic solid phase extraction
3.4.1 Two-level fractional factorial design
A two-level FrFD was used for simultaneous screening of five experimental parameters that could be influential for extraction and precontraction of PFAS. These parameters included the mass of the adsorbent (MA), sample pH, extraction time (ET), eluent volume (EV) and elution time (ELT). The design matrix and respective analytical response (%R) are presented in Table S2. The resulting data were subjected to analysis of variance (ANOVA) and expressed as Pareto Charts (Fig. S6). Fig. S6 revealed that sample pH was significant at 95 confidence level for the investigated analytes. According to Deng and coworkers (Deng et al., 2018), the extraction of PFAS is driven by pH. This is since under acidic conditions PFAS remain unionised, while they exist ionized in an alkaline medium. Furthermore, according to Fig. S4, the surface charge of Fe3O4@MIL-101(Cr) could also be influenced by the sample pH.
In Fig. S6a, b and d revealed that elution time and mass of adsorbent (MA) were significant at a 95% confidence level. The two parameters have a positive effect suggesting that increasing MA and ELT lead to high recoveries. Figures S6b and c show that the extraction time was statistically significant and had a negative effect suggesting that a shorter extraction time is sufficient for quantitative extraction of PFAS on the surface of the sorbent. Fig. S5b indicated that for desorption of PFOA, the interaction between MA and EV plays a significant role in the enrichment of the target analytes. Based on the results in Fig. S6, MA, ELT and sample pH were further optimised using RSM based on CCD while extraction time and eluent volume were kept fixed at 30 min and 1000 µL.
3.4.2 Response surface methodology
To qualify and estimate the effect of MA, pH and ELT on the extraction and preconcentration of the target analytes was investigated using RSM based on CCD. The CCD matrix and respective analytical responses are presented in Table S3. The data in Table S3 were analysed. The results show that the determination coefficients (R2) were 0.9856, 0.9811, 0.9901 and 0.9876. The R2 values of the RSM model revealed that more than 98% of the total change in results was due to the change in research or experimental factors. Additionally, the adjusted R2 ranged from 0.9658 to 0.9801 and they are close to the R2. Therefore, the closeness of the R2 values suggests that only important terms form part of the model. Moreover, the ANOVA results show that the effect of each independent variable on the extraction and preconcentration of PFAS by Fe3O4@MIL-101(Cr) adsorbent follows an order: pH > ELT > MA for PFD and PFTeDA; pH > MA > ELT for PFOA and PFOS.
The 3D response surface plots of the analytical response as a function of two variables, while other independent factors are fixed central point level. The RSM plots were used to visualize the main effect of the independent variables and their interactive effects. The 3D response surface plots are presented in Fig. S7. Fig. S6a shows the interaction between the mass of adsorbent and elution at a pH value of 6.5. This Fig. Shows that the analytical response increased with the increasing mass of adsorbent and elution time. Suggesting that there was a strong interaction between the mass of adsorbent and the analytes, thus, more time is required to desorb the adsorbed PFAS. Fig. S7b shows that the pH and elution time were significant. However, the interaction between these two parameters was not easy to explain because there are not expected to interact. The changes in analytical response are due to the effect of independent variables. Fig. S7c show that the influence of pH and mass of adsorbent had a great influence on the extraction of PFAS by Fe3O4@MIL-101(Cr) material. According to Fig. S7c, when the pH of the solution decreases and the mass of the adsorbent increases, the extraction of PFAS by the adsorbent increases significantly. It was observed that the influence of pH on PFAS adsorption was greater than that of mass of adsorbent and elution time and these were consistent with the ANOVA results in Fig. S6 which confirmed the significance of pH for the extraction of the analytes. The favoured acidic sample pH shown by S7c was also in agreement with the expected behaviour of PFAS (Deng et al., 2018) and the adsorbent’s surface charge (Liu et al., 2015).
3.4.3 Desirability functions
The profile for predicted values that leads to maximum recoveries of the analytes is depicted in Fig. 6. This function permits the simultaneous prediction of optimum values for all the examined influential parameters. Desirability functions take values in the range of 0–1, where 0 presents the least desired percentage recovery (28.11%), 0.5 presents the middle percentage recovery (64.64%) and 1 is the maximum percentage recovery (101.17%). According to Fig. 6, the optimum conditions for the enrichment procedure of the PFAS were pH of 6.5, 23 mg, 30 min, 33 min and 1000 µL for sample pH, the mass of adsorbent, extraction time, elution time and eluent volume, respectively. The obtained predicted optimum conditions were then used for further experimental procedures. The results found for extraction and preconcentration of PFAS ranged from 97.8 to 99.5%. The experimental results obtained agreed with the desirability function with the predicted optimum values. This indicated that the chosen FFD and CCD were reliable for the optimization of the extraction method.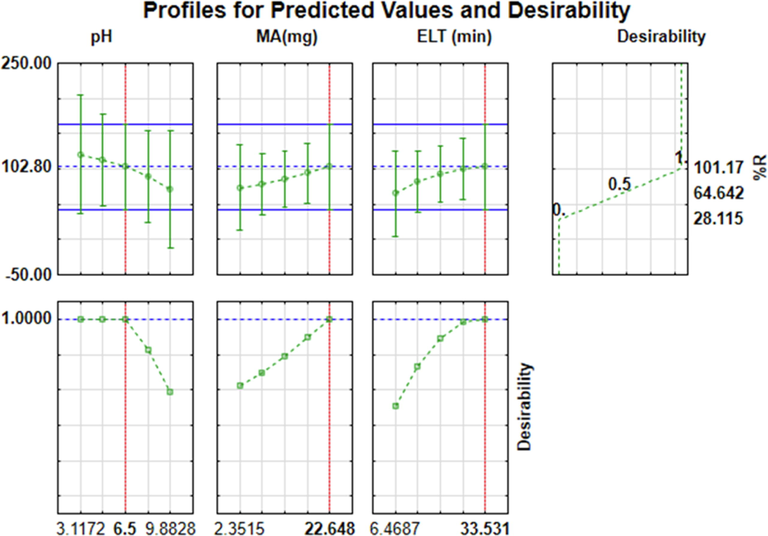
Profile for predicted values and desirability.
3.5 Adsorption studies
The equilibrium adsorption isotherms have a major role in the explanation of the interactive behaviour between the sorbent and the target analytes. Equilibrium adsorption studies were performed to investigate the potential sorption mechanism that occurs during the interaction of PFAS with the Fe3O4@MIL-101(Cr) nanocomposite. The equilibrium data were examined using non-linear isotherms models. The data were fitted to two-parameter (Freundlich and Langmuir) and three-parameter (Sips and Redlich-Peterson) models. The non-linear adsorption isotherm equations are also shown in Table 1. Kyplot 6.0 software was used to estimate the constants and parameters of adjusted non-linear adsorption isotherms (Table 1).
Isotherms
Parameters
PFOA
PFDA
PFTeDA
PFOS
Langmuir
qmax (mg/g)
59.5
72.4
45.1
80.4
KL (L/mg)
0.041
0.681
0.089
4.35
RSE
1.789
0.707
0.839
1.79
R2
0.974
0.996
0.916
0.974
Adjusted R2
0.939
0.991
0.812
0.939
RL
0.05
0.10
0.29
1.04
Freundlich
KF (L/mg)
14.4
32.26
22.367
45.07
n
1.89
1.21
0.501
1.56
RSE
2.40
0.899
1.004
2.10
R2
0.952
0.993
0.991
0.685
Adjusted R2
0.891.
0.986
0.979
0.764
Redlich-Peterson
KR
28.6
22.2
37.9
19.5
ᾳ
0.66
0.18
0.78
0.04
β
0.98
1.1
1.7
1.2
RSE
4.79
7.31
3.09
1.86
R2
0.789
0.978
0.958
0.977
Adjusted R2
0.863
0.891
0.871
0.935
Sips
qms (mg/g)
57.7
72.4
77.6
69.4
KS (L/g)
0.25
0.16
0.34
1.45
nS
1.7
1.6
1.01
1.34
RSE
4.79
7.31
3.09
1.86
R2
0.789
0.978
0.958
0.977
Adjusted R2
0.863
0.891
0.871
0.935
3.5.1 Two-parameter adsorption isotherms
The correlation coefficients (R2) of the two models (Langmuir and Freundlich) were evaluated to find out which model was favoured by the adsorption experimental data. The correlation coefficient of PFOA, PFDA and PFOS for the Langmuir isotherms (0.9737, 0.99628 and 0.9737) were observed to be greater than the Freundlich correlation coefficient. However, PFTTA favoured Freundlich over the Langmuir since it had a lower R2 value for PFTeDA (0.9910). This indicated that the adsorption of PFOA, PFDA and PFOS on the surface of Fe3O4@MIL-101(Cr) occurred homogeneously and the type of adsorption was a monolayer. The adsorption of PFTTA favoured Freundlich since its R2 value was higher than Langmuir. This showed that the adsorption of PFTTA on the surface of the sorbent was a multilayer and it occurred heterogeneously. When RSE is interpreted, the best-fit isotherm for the adsorption is the one with a lower RSE. According to the experimental data obtained, all the analytes of interest (PFOA, PFDA, PFTeDA and PFOS) exhibited lower RSE values for Langmuir (1.879, 0.71, 0.84 and 1.8) as compared to RSE values for Freundlich (2.4, 0.90, 1.09 and 3.4). Therefore, RSE values showed that the Langmuir model best fitted the experimental data even for the PFTeDA.
3.5.2 Three parameter adsorption isotherms
The three-parameter adsorption isotherms involve the comparison of Redlich- Peterson and Sips adsorption isotherms (Table 1). Redlich- Peterson and Sips models are used to validate the results obtained from Langmuir and Freundlich in two-parameter adsorption isotherms. For the Redlich- Peterson if the β value is equal to 1, it implies that the adsorption data reduces to Langmuir. If the β value is equal to 0 the adsorption data reduces to Freundlich (Khare et al., 2018). The β value for PFOA, PFTeDA, PFDA and PFOS were obtained to be 0.98, 1.1, 1.7 and 1.2, respectively. This meant that the adsorption experimental data reduces to Langmuir isotherms. When interpreting the experimental data based on Sips isotherm, the focus was on the nS value. If the nS value is equal to 1, the adsorption best fits Langmuir., and if the nS value is greater than 1, it means the data best fit Freundlich (Liang Liang et al., 2018). In this study, the ns values for all the PFAS were approaching 1, showing that the Langmuir isotherms were favoured by the experimental adsorption data, and this demonstrated monolayer adsorption that occurred homogeneously. The three-parameter isotherm models confirmed that the Langmuir isotherm best fitted the experimental data. This showed that all the adsorption between the PFAS and the surface of Fe3O4@MIL-101(Cr) occurred homogeneously. Langmuir's maximum adsorption capacities for the PFOA, PFDA, PFTeDA and PFOS were obtained as 59.2 mg/g, 72.4 mg/g, 45.1 mg/g and 80.4 mg/g respectively.
3.6 Analytical characteristics
The analytical performance of the developed method for the simultaneous extraction and preconcentration of PFAS was studied under the optimum conditions. The outcomes indicated wide linearity ranging from 1.0 to 5000 ng/L and 0.05–2000 ng/L for DMSPE /HPLC-DAD and DMSPE /UHPLC-MS/MS with correlation coefficients greater than 0.99 (Table 2). The LODs and LOQs for DMSE/HPLC-DAD were in the range of 0.3–0.66 ng/L and 1.0–2.2 ng/L. While for DMSPE/LC-MS/MS, the LODs and LOQs were 0.011–0.04 ng/L and 0.05–0.12 ng/L. The reproducibility (interday) and repeatability (intraday) shown in terms of %RSD were <5%, implying that the developed extraction method had a good precision. The matrix effects observed for PFDA, PFTeDA and PFOS were suppression (0.9–8.4%) and enhancement (<8.4%) for PFOA in river water samples. As seen, %ME was within ± 20% which is an adequate range for water samples. These results show that the developed method is applicable for the analysis of PFAS in complex matrices.
Parameters
PFOA
PFDA
PFTeDA
PFOS
HPLC-DAD
UHPLC-MS/MS
HPLC-DAD
UHPLC-MS/MS
HPLC-DAD
UHPLC-MS/MS
HPLC-DAD
UHPLC-MS/MS
Linearity (ng/L)
1.0–3000
0.1–1500
1.5–3000
0.07–2000
1.5–4000
0.05–1500
2–5000
0.1–2000
R2
0.9975
0.9983
0.9984
0.9991
0.9965
0.9978
0.9989
0.9987
LOD (ng/L)
0.3
0.04
0.41
0.02
0.46
0.011
0.66
0.03
LOQ (ng/L)
1.0
0.12
1.4
0.07
1.5
0.037
2.2
0.10
Interday (%RSD)a
2.4
1.5
1.9
1.4
3.2
2.4
2.9
2.5
Intraday (%RSD)b
3.5
2.6
4.3
3.3
3.4
3.5
4.5
3.3
EFc
92
112
101
125
96
120
104
115
%ME
4.4
3.4
−1.3
−0.9
−8.4
−6.6
−7.9
−8.1
The trueness of the developed method was assessed using a spike recovery approach. This was performed by analysing spiked river water samples at three concentration points. The river water samples were spiked with target analytes at three points (10, 100, and 300 ng/L) and processed using the developed methods. As shown in Table 3, the trueness in terms of relative recoveries (%RR) for the analytes ranged from 90.8 to 99.1% and 94.1–99.8 for DMSE/HPLC-DAD and DMSE/UHPLC-MS/MS. The %RSD values ranged from 1.4 to 4.2 and %relative error values (%RE) were below ± 10%. The relative recoveries (%RR) revealed that the matrix effects did not affect the performance of the DMSPE method. This DMSPE method combined with HPLC-DAD or UHPLC-MS/MS was considered suitable and reliable for preconcentration of the PFAS in river water samples. Typical chromatograms of spiked river water samples for HPLC-DAD and UHPLC-MS/MS are presented in Fig. S8. These chromatograms reveal an acceptable separation of target analytes with no possible interfering ions. This suggests that the developed DMSPE method could simultaneously clean up the sample matrix, and extract and preconcentrate the target analytes. %RE (%relative error) =
, where CM and CE are the measured and expected analyte concentrations.
Perfluoroalkyl acids
DMSPE/HPLC-DAD
DMSPE/UHPLC-LC-MS/MS
Added (ng/L)
%RR
%RSD
%RE
%RR
%RSD
%RE
PFOA
10
91.8
3.1
−8.2
96.7
2.8
−3.3
100
96.3
3.6
−3.7
98.6
3.6
−1.4
300
98.3
3.1
−1.7
99.3
3.1
−0.7
PFDA
10
90.8
4.2
−9.2
96.4
1.7
−3.6
100
95.2
3.1
−4.8
98.2
1.8
−1.8
300
98.4
2.4
−1.6
99.4
1.4
−0.6
PFTeDA
10
92.1
3.6
−7.9
95.1
1.6
−4.9
100
95.1
3.2
−4.9
98.1
2.2
−1.9
300
99.1
2.6
−0.9
99.8
2.6
−0.2
PFOS
10
94.1
3.5
−5.9
94.1
1.5
−5.9
100
96.0
2.9
−4.0
97.3
1.9
−2.7
300
98.9
2.5
−1.1
97.9
1.5
−2.1
3.7 Comparison of the developed method with other reported methods
A comparison study between the previously reported methods and the current procedures for the extraction and preconcentration of PFAS in water samples is presented in Table 4. This was done to evaluate the analytical performance of the developed methods in terms of linearity, LOD and RSD. According to Table 4, Refs (Jia et al., 2021; Huang et al., 2020) reported a method that had lower LODs compared to the developed DMSPE/DAD method but comparable to DMSPE/UHPLC-MS/MS. This was expected since they employed a more sensitive analytical instrument compared to HPLC-DAD. However, the DMSPE/DAD method showed lower %RSDs as compared to the procedure reported by (Jia et al., 2021; Huang et al., 2020). The methods developed in this study had a better or comparable overall analytical performance as compared to (Ren et al., 2018; Aparicio et al., 2017; Xie et al., 2020). As seen in Table 4, LC-MS/MS is the most widely used analytical detection technique for the analysis of PFAS due to its sensitivity (Jiang et al., 2021; Huang et al., 2020; Aparicio et al., 2017; Xie et al., 2020). Moreover, magnetic adsorbents reported by (Jiang et al., 2021; Huang et al., 2020) exhibited lower LODs which are of the same magnitude as the developed method. In contrast, (Ye and Chen, 2018) had not satisfactory LODs even though the magnetic adsorbent was used. These results confirmed that the DMSPE method using the Fe3O4@MIL-101(Cr) was efficient and reliable for extracting and enriching PFAS in water samples. PFBA: Perfluorobutanoic acid; PFHxA: Perfluorohexanoic acid; PFOA: Perfluorooctanoic acid; PFDA: Perfluorodecanoic acid; PFDoA: Perfluorododecanoic acid; PFBS: Perfluorobutanesulfonic acid; PFHxS: Perfluorohexanesulfonic acid; PFOS: Perfluorooctanesulfonic acid; PFOPA: Perfluorooctane phosphonic acid.
Analytes
Sorbents
Linearity (ng/L)
LOD (ng/L)
%RSD
Analytical instruments
Refs
PFBA, PFHpA, PFNA, PFOA, PFDA
CTF/Fe2O3
5–4000 ng L-1
0.62–1.39
1.1–9.7
LC-MS/MS
(Munoz et al., 2019)
PFNA, PFDA, PFuDA, PFDoA
Fe3O4@EB-iCOFs
1–1000
0.1–0.8
1.4–5.8
HPLC-MS/MS
(Wang et al., 2018)
PFBA, PFHxA, PFOA, PFDA, PFDoA, PFBS, PFHxS, PFOS, PFOPA
Dual-Functionalized MIL-101(Cr)
0.5–1500
0.004–0.12
<11.6
UHPLC–MS/MS
(Chen et al., 2017)
PFBUA, PFHxA, PFHPA, PFOA, PFOS
Ethylene glycol modified silicone
10–1000
4.7–29
–
HPLC-MS/MS
(Mpupa et al., 2018)
PFOA, PHNA, PFDOA
Decyl-perluorinated magnetic mesoporous nanocomposite
200–200000
55–86
<7.8%
GC–MS
(Lekota et al., 2020)
PFBS, PFHxS, PFOS, PFDS, PFNA
Magnetic fluorinated carbon nanotubes
0.4–10000
0.010–0.036
3.5–10%
HPLC-MS/MS
(Zhou et al., 2017)
PFBA, PFHPA, PFOA, PFNA
ZIF67/g-C3N4
1–2000
0.3–2.0
< 15
HPLC-MS/MS
(Ghaemi and Amiri, 2020)
PFOA, PFDA, PFTeDA, PFOS
Fe3O4@MIL-101(Cr)
0.05–2000
0.02–0.04
1.4–3.3
UHPLC-MS/MS
This study
PFOA, PFDA, PFTeDA, PFOS
Fe3O4@MIL-101(Cr)
1–5000
0.3–0.66
2.4–4.5
HPLC-DAD
This study
3.8 Application to real samples and certified reference material
The applicability of the developed DMSPE method based on Fe3O4@MIL-101(Cr) nanocomposite for extraction and simultaneous enrichment of PFAS in different local river water was assessed. The results in Table 5 revealed the presence of some of the investigated PFAS at concentration levels ranging from 0 to 41.2 ng/L. The DMSPE combined with HPLC–DAD exhibited acceptable performance quantification of PFAS in river water samples. Furthermore, the reliability of the results obtained using DMSPE/HPLC-DAD was validated by analysing the same river water samples with DMSPE/UHPLC-ESI-MS/MS. The results obtained from a UHPLC-ESI-MS/MS confirmed that the DMSPE/HPLC-DAD method could be used for the detection of the target analyte. However, the results from Table 5 indicated that HPLC-DAD was less sensitive to some of the analytes that are present in ultra-trace levels. The respective mass spectra for selected analytes are presented in Figs. S8–S10 and they proved that the analytes detected were PFOA, PFDA, PFTTA and PFOS. Furthermore, it can be concluded that the application of DMSPE based on Fe3O4@MIL-101(Cr) improved the detection capabilities of HPLC-DAD. <LOQ: concentrations value lower than LOQ, AP: Apies River samples, HP: Hennops River, and PI: Pienaars River samples.
Sample ID
PFOA
PFDA
PFTeDA
PFOS
DMSPE/HPLC-DAD
DMSPE/UHPLC-MS/MS
DMSPE/HPLC-DAD
DMSPE/UHPLC-MS/MS
DMSPE/HPLC-DAD
DMSPE/UHPLC-MS/MS
DMSPE/HPLC-DAD
DMSPE/UHPLC-MS/MS
AP1
15.5 ± 0.7
15.7 ± 0.6
9.21 ± 0.41
9.28 ± 0.33
7.94 ± 0.04
7.98 ± 0.07
15.1 ± 0.4
14.9 ± 0.9
AP2
17.8 ± 0.5
17.9 ± 0.7
8.97 ± 0.02
9.02 ± 0.05
10.9 ± 0.7
11.2 ± 0.06
37.6 ± 0.9
38.2 ± 0.5
HP1
6.23 ± 0.20
6.28 ± 0.11
<LOQ
1.21 ± 0.02
<LOQ
<LOQ
7.45 ± 0.33
7.63 ± 0.15
HP2
3.58 ± 0.13
3.54 ± 0.14
<LOQ
1.18 ± 0.03
<LOQ
<LOQ
<LOD
1.33 ± 0.04
PI1
33.7 ± 0.6
34.1 ± 0.8
7.69 ± 0.08
8.09 ± 0.05
4.94 ± 0.23
5.01 ± 0.33
<LOQ
0.51 ± 0.02
PI2
41.2 ± 0.5
42.3 ± 0.7
<LOQ
<LOQ
<LOQ
<LOQ
<LOQ
1.78 ± 0.09
The possibility of extending the application of the developed method for the analysis of other PFAS was assessed by analysing PFHxS, PFHxA, L-PFOS, PFBS, PFHpA, and PFPeA in CRM IRMM-428 water. The results obtained are presented in Table 6 and the results obtained agreed with the certified values. These findings reveal that the developed method could be used for a wide range of PFAS. PFHxS: perfluorohexane sulfonate; PFHxA: perfluorohexanoic acid L-PFOS: linear perfluorooctane sulfonate; PFBS: perfluorobutane sulfonate; PFHpA: perfluoroheptanoic acid; PFPeA, perfluoropentanoic acid.
Analytes
Certified values (ng/L)
Obtained values (ng/L)
%R
Obtained values (ng/L)
%R
DMSPE/HPLC-DAD
DMSPE/HPLC-MS/MS
PFBS
5.5 ± 1.4
5.27 ± 0.0.23
95.9
5.42 ± 0.18
98.5
PFHxS
3.6 ± 1.0
3.43 ± 0.12
95.3
3.47 ± 0.11
96.4
L-PFOS
9.6 ± 1.7
9.39 ± 0.46
97.8
9.51 ± 0.43
99.1
PFPeA
4.0 ± 1.0
3.87 ± 0.15
95.5
3.91 ± 0.12
97.7
PFHxA
7.4 ± 1.0
7.23 ± 0.33
97.7
7.30 ± 0.31
98.7
PFHpA
3.7 ± 0.7
3.50 ± 0.13
94.6
3.54 ± 0.13
95.6
3.9 Global concentrations of PFAS in water systems
Table S4 present a comparison of the concentrations of PFAS measured in the current study to other studies conducted in different parts of South Africa and the rest of the world. As seen in the table, the concentrations detected in this study were lower than the levels reported in China by (Deng et al., 2018), Australia (de Vega et al., 2021) and some parts of South Africa (Khare et al., 2018; de Vega et al., 2021). United States (Mottaleb et al., 2021) reported the least concentrations of all the PFAS compared to other concentrations obtained from different other countries. In South Africa, Refs (Khare et al., 2018; de Vega et al., 2021) reported higher concentrations of PFOA than the current study. Moreover, the concentration of PFAS reported by Refs (Liang Liang et al., 2018; Huang et al., 2020; Xie et al., 2020; Ye and Chen, 2018; Deng et al., 2018) is almost having the same magnitude as the current study.
3.10 Reusability and regeneration
Reusability and regeneration studies discovered that Fe3O4@MIL-101(Cr) nanocomposite had the capability of being reused up to the 5th adsorption–desorption cycle without expressing any decrease in percentage recoveries (analytical response) after the extraction. After the 6th cycle was performed, a significant reduction of almost 10% was noted in the percentage recoveries Fig. S11. Furthermore, the recurring washing, elution and drying caused the loss of binding sites on the Fe3O4@MIL-101(Cr) nanocomposite. The nanocomposite could be used up to the fifth adsorption–desorption cycle without loss of affinity, this indicated that Fe3O4@MIL-101(Cr) was considered to have good reusability and regeneration properties and was stable.
4 Conclusion
An efficient and effective Fe3O4@MIL-101(Cr) was successfully synthesized and used as an adsorbent in the DMSPE method for the extraction and enrichment of PFAS in river water. The magnetic properties enabled easy separation of Fe3O4@MIL-101(Cr) nanocomposite from the aqueous water samples, thus eliminating the centrifugation step, which makes the method to be rapid and simple. HPLC-DAD was used for the analysis of the target analytes and LC-MS was used to validate and confirm the results. The validated DMSPE method was robust, sensitive, effective, reproducible and suitable for analysis of various PFAS in river water samples. Moreover, the Fe3O4@MIL-101(Cr) adsorbent could be used up to the fifth adsorption–desorption cycle without losing its adsorption capabilities. Lastly, the extraction method was used for the extraction and enrichment of PFAS in river water and CRM samples.
CRediT authorship contribution statement
Shirley Kholofelo Selahle: Conceptualization, Methodology, Writing – original draft, Validation, Formal analysis, Investigation. Anele Mpupa: Formal analysis, Investigation, Methodology, Validation, Writing – review & editing. Philiswa Nosizo Nomngongo: Conceptualization, Data curation, Funding acquisition, Project administration, Resources, Software, Supervision, Visualization, Writing – review & editing.
Acknowledgements
The authors would like to thank the University of Johannesburg (Chemical sciences department) for providing lab facilities. The authors are also grateful to Mr Siyasanga Mpelane and Mrs Orienda Sebabi Molahlegi for their assistance in characterization techniques. This article is based upon work from the Sample Preparation Study Group and Network, supported by the Division of Analytical Chemistry of the European Chemical Society.
Funding statement
This work was supported financially by the Department of Science and Innovation-National Research Foundation South African Research Chairs Initiative (DSI/NRF SARChI) (grant no. 91230)
Availability of data and material
The raw data supporting the conclusions of this article will be made available by the authors, without undue reservation. Processed data is included as supplementary material.
Declaration of Competing Interest
The authors declare that they have no known competing financial interests or personal relationships that could have appeared to influence the work reported in this paper.
References
- Ultrasonic assisted magnetic solid phase extraction based on the use of magnetic waste-tyre derived activated carbon modified with methyltrioctylammonium chloride adsorbent for the preconcentration and analysis of non-steroidal anti-inflammatory drugs in. Arab. J. Chem.. 2021;14:103329
- [Google Scholar]
- Synthesis of natural proanthocyanidin based novel magnetic nanoporous organic polymer as advanced sorbent for neonicotinoid insecticides. Food Chem.. 2022;373:131572
- [Google Scholar]
- Stir bar sorptive extraction and liquid chromatography–tandem mass spectrometry determination of polar and non-polar emerging and priority pollutants in environmental waters. J. Chromatogr. A. 2017;1500:43-52.
- [Google Scholar]
- Fate of environmental pollutants: A review. Water Environ. Res.. 2020;92:1587-1594.
- [Google Scholar]
- A critical review of molecularly imprinted polymers for the analysis of organic pollutants in environmental water samples. J. Chromatogr. A. 2020;1614:460603
- [CrossRef] [Google Scholar]
- Environmental perfluoroalkyl acid exposures are associated with liver disease characterized by apoptosis and altered serum adipocytokines. Environ. Pollut.. 2019;247:1055-1063.
- [Google Scholar]
- Recovery of gold(III) and iridium(IV) using magnetic layered double hydroxide (Fe3O4/Mg-Al-LDH) nanocomposite: Equilibrium studies and application to real samples. Hydrometallurgy. 2020;197:105447
- [CrossRef] [Google Scholar]
- Retention performance of three widely used SPE sorbents for the extraction of perfluoroalkyl substances from seawater. Chemosphere. 2018;193:259-269.
- [Google Scholar]
- Ultrafast water sensing and thermal imaging by a metal-organic framework with switchable luminescence. Nat. Commun.. 2017;8:1-10.
- [Google Scholar]
- Simultaneous targeted and non-targeted analysis of per-and polyfluoroalkyl substances in environmental samples by liquid chromatography-ion mobility-quadrupole time of flight-mass spectrometry and mass defect analysis. J. Chromatogr. A. 2021;1653:462423
- [Google Scholar]
- Preconcentration and determination of perfluoroalkyl substances (PFASs) in water samples by bamboo charcoal-based solid-phase extraction prior to liquid chromatography–tandem mass spectrometry. Molecules. 2018;23
- [CrossRef] [Google Scholar]
- Preconcentration and determination of perfluoroalkyl substances (PFASs) in water samples by bamboo charcoal-based solid-phase extraction prior to liquid chromatography–tandem mass spectrometry. Molecules. 2018;23:902.
- [Google Scholar]
- Current sample preparation methodologies for analysis of emerging pollutants in different environmental matrices. TrAC Trends Anal. Chem.. 2016;82:199-207.
- [Google Scholar]
- Human exposure to per- and polyfluoroalkyl substances (PFAS) through drinking water: A review of the recent scientific literature. Environ. Res.. 2019;177
- [CrossRef] [Google Scholar]
- Photoluminescent metal–organic frameworks and their application for sensing biomolecules. J. Mater. Chem. A.. 2019;7:22744-22767.
- [Google Scholar]
- When Conductive MOFs Meet MnO2: High Electrochemical Energy Storage Performance in an Aqueous Asymmetric Supercapacitor. ACS Appl. Mater. Interfaces. 2021;13:33083-33090.
- [Google Scholar]
- Preparation of fluorinated covalent organic polymers at room temperature for removal and detection of perfluorinated compounds. J. Hazard. Mater.. 2021;420:126659
- [Google Scholar]
- Current analytical methodologies and gaps for per- and polyfluoroalkyl substances determination in the marine environment. TrAC – Trends Anal. Chem.. 2019;121:115372
- [CrossRef] [Google Scholar]
- A combination of computational−experimental study on metal-organic frameworks MIL-53(Al) as sorbent for simultaneous determination of estrogens and glucocorticoids in water and urine samples by dispersive micro-solid-phase extraction coupled to UPLC-MS/MS. Talanta. 2018;180:358-367.
- [CrossRef] [Google Scholar]
- Microcrystalline cellulose/metal− organic framework hybrid as a sorbent for dispersive micro-solid phase extraction of chlorophenols in water samples. J. Chromatogr. A. 2020;1626:461386
- [Google Scholar]
- Click reactions: Recent trends in preparation of new sorbents and stationary phases for extraction and chromatographic applications. TrAC – Trends Anal. Chem.. 2019;118:556-573.
- [CrossRef] [Google Scholar]
- Accumulation of perfluorinated alkyl substances (PFAS) in agricultural plants: A review. Environ. Res.. 2019;169:326-341.
- [CrossRef] [Google Scholar]
- One-pot fabrication of magnetic fluorinated carbon nanotubes adsorbent for efficient extraction of perfluoroalkyl carboxylic acids and perfluoroalkyl sulfonic acids in environmental water samples. Chem. Eng. J.. 2020;380:122392
- [Google Scholar]
- Dual-functionalized MIL-101 (Cr) for the selective enrichment and ultrasensitive analysis of trace per-and poly-fluoroalkyl substances. Anal. Chem.. 2021;93:11116-11122.
- [Google Scholar]
- Ionic covalent organic frameworks for the magnetic solid-phase extraction of perfluorinated compounds in environmental water samples. Microchim. Acta.. 2021;188
- [CrossRef] [Google Scholar]
- Perfluoroalkyl substances and severity of nonalcoholic fatty liver in children: an untargeted metabolomics approach. Environ. Int.. 2020;134:105220
- [Google Scholar]
- Graphene coated iron oxide (GCIO) nanoparticles as efficient adsorbent for removal of chromium ions: Preparation, characterization and batch adsorption studies. Environ. Nanotechnol. Monit. Manag.. 2018;10:148-162.
- [CrossRef] [Google Scholar]
- Application of zirconium MOFs in drug delivery and biomedicine. Coord. Chem. Rev.. 2019;380:230-259.
- [Google Scholar]
- Preparation of ferric oxide-aluminium oxide carbon nanofiber nanocomposites for ultrasound-assisted dispersive magnetic solid phase extraction of 17-beta estradiol in wastewater. Emerg. Contam.. 2020;6:162-171.
- [Google Scholar]
- Porous metal-organic frameworks for gas storage and separation: Status and challenges. EnergyChem. 2019;1:100006
- [Google Scholar]
- Determination of anionic perfluorinated compounds in water samples using cationic fluorinated metal organic framework membrane coupled with UHPLC–MS/MS. J. Hazard. Mater. 2022:128333.
- [Google Scholar]
- Letter to the Editor Facile Synthesis of the Magnetic Metal Organic Framework Fe3O 4 @UiO-66-NH 2 for Separation of Strontium. Biomed. Environ. Sci.. 2018;31:483-488.
- [CrossRef] [Google Scholar]
- Understanding the adsorption of PFOA on MIL-101 (Cr)-based anionic-exchange metal–organic frameworks: comparing DFT calculations with aqueous sorption experiments. Environ. Sci. Technol.. 2015;49:8657-8665.
- [Google Scholar]
- Release of Per-and Polyfluoroalkyl Substances from Aqueous Film-Forming Foam Impacted Soils. Environ. Sci. Technol. 2021
- [Google Scholar]
- A Simple and Rapid Method for Quantitative HPLC MS/MS Determination of Selected Perfluorocarboxylic Acids and Perfluorosulfonates in Human Serum. Int. J. Anal. Chem.. 2020;2020
- [Google Scholar]
- Direct injection analysis of per and polyfluoroalkyl substances in surface and drinking water by sample filtration and liquid chromatography-tandem mass spectrometry. J. Chromatogr. A. 2021;1653:462426
- [CrossRef] [Google Scholar]
- Ultrasound-assisted dispersive solid phase nanoextraction of selected personal care products in wastewater followed by their determination using high performance liquid chromatography-diode array detector. J. Hazard. Mater. 2018
- [CrossRef] [Google Scholar]
- Preparation of magnetic Fe3O4 nanocomposites modified with MnO2, Al2O3, Au and their application for preconcentration of arsenic in river water samples. J. Environ. Chem. Eng.. 2018;6:1673-1681.
- [Google Scholar]
- Analysis of F-53B, Gen-X, ADONA, and emerging fluoroalkylether substances in environmental and biomonitoring samples: A review. Trends Environ. Anal. Chem.. 2019;23:e00066
- [Google Scholar]
- Worldwide trends in tracing poly- and perfluoroalkyl substances (PFAS) in the environment. TrAC - Trends Anal. Chem.. 2019;121:115410
- [CrossRef] [Google Scholar]
- Facile fabrication of novel magnetic ZIF-67 MOF@ aminated chitosan composite beads for the adsorptive removal of Cr (VI) from aqueous solutions. Carbohydr. Polym.. 2021;265:118084
- [Google Scholar]
- Magnetic covalent triazine-based frameworks as magnetic solid-phase extraction adsorbents for sensitive determination of perfluorinated compounds in environmental water samples. Anal. Bioanal. Chem.. 2018;410:1657-1665.
- [Google Scholar]
- Magnetic Solid Phase Extraction Based on Nanostructured Magnetic Porous Porphyrin Organic Polymer for Simultaneous Extraction and Preconcentration of Neonicotinoid Insecticides From Surface Water. Front. Chem.. 2020;8:852.
- [Google Scholar]
- A review of extraction, analytical, and advanced methods for the determination of neonicotinoid insecticides in environmental water matrices. Rev. Anal. Chem.. 2021;40:187-203.
- [Google Scholar]
- A critical review of the state of the art of solid-phase microextraction of complex matrices II. Food analysis. TrAC – Trends Anal. Chem.. 2015;71:236-248.
- [CrossRef] [Google Scholar]
- Recent trends in the application of the newest carbonaceous materials for magnetic solid-phase extraction of environmental pollutants. Trends Environ. Anal. Chem.. 2016;10:11-23.
- [CrossRef] [Google Scholar]
- Evaluation of the Matrix Effects in Herbal-Based Potions in Pesticide Residues Analysis by Dispersive Liquid-Liquid Microextraction Followed by Gas Chromatography-Mass Spectrometry. Anal. Bioanal. Chem. Res.. 2022;9:269-280.
- [Google Scholar]
- A metal-organic framework of type MIL-101 (Cr) for emulsification-assisted micro-solid-phase extraction prior to UHPLC-MS/MS analysis of polar estrogens. Microchim. Acta. 2019;186:1-9.
- [Google Scholar]
- Towards applications of bioentities@ MOFs in biomedicine. Coord. Chem. Rev. 2020:213651.
- [Google Scholar]
- Advances in magnetic porous organic frameworks for analysis and adsorption applications. TrAC Trends Anal. Chem.. 2020;132:116048
- [Google Scholar]
- Metal-organic framework-based materials for hybrid supercapacitor application. Coord. Chem. Rev.. 2020;404:213093
- [Google Scholar]
- A highly selective dispersive liquid–liquid microextraction approach based on the unique fluorous affinity for the extraction and detection of per-and polyfluoroalkyl substances coupled with high performance liquid chromatography tandem–mass spectrometry. J. Chromatogr. A. 2018;1544:1-7.
- [Google Scholar]
- Pore surface engineering of metal–organic frameworks for heterogeneous catalysis. Coord. Chem. Rev.. 2018;376:248-276.
- [Google Scholar]
- Occurrence, fate and transformation of emerging contaminants in water: An overarching review of the field. Environ. Pollut.. 2017;231:954-970.
- [CrossRef] [Google Scholar]
- Fluorine and nitrogen functionalized magnetic graphene as a novel adsorbent for extraction of perfluoroalkyl and polyfluoroalkyl substances from water and functional beverages followed by HPLC-Orbitrap HRMS determination. Sci. Total Environ.. 2020;723:138103
- [CrossRef] [Google Scholar]
- In-situ exfoliation of graphitic carbon nitride with metal-organic framework via a sonication-assisted approach for dispersive solid-phase extraction of perfluorinated compounds in drinking water samples. J. Chromatogr. A. 2020;1625:461337
- [Google Scholar]
- Construction of hydroxyl functionalized magnetic porous organic framework for the effective detection of organic micropollutants in water, drink and cucumber samples. J. Hazard. Mater.. 2021;412:125307
- [Google Scholar]
- Construction of hydrophilic hypercrosslinked polymer based on natural kaempferol for highly effective extraction of 5-nitroimidazoles in environmental water, honey and fish samples. J. Hazard. Mater. 2022:128288.
- [Google Scholar]
- Analysis of Perfluorinated Compounds in Environmental Water Using Decyl-perfluorinated Magnetic Mesoporous Microspheres as Magnetic Solid-Phase Extraction Materials and Microwave-Assisted Derivatization Followed by Gas Chromatography–mass Spectrometry. J. Chromatogr. Sci.. 2018;56:955-961.
- [Google Scholar]
- Study of MOF incorporated dual layer membrane with enhanced removal of ammonia and per-/poly-fluoroalkyl substances (PFAS) in landfill leachate treatment. Sci. Total Environ.. 2021;151207
- [Google Scholar]
- Modifying the surface of Fe3O4/SiO2 magnetic nanoparticles with C18/NH2 mixed group to get an efficient sorbent for anionic organic pollutants. J. Colloid Interface Sci.. 2011;362:107-112.
- [CrossRef] [Google Scholar]
- Covalent bonding of metal–organic framework-5/graphene oxide hybrid composite to stainless steel fiber for solid-phase microextraction of triazole fungicides from fruit and vegetable samples. J. Agric. Food Chem.. 2016;64:2792-2801.
- [Google Scholar]
- Solid phase microextraction of phthalic acid esters from vegetable oils using iron (III)-based metal-organic framework/graphene oxide coating. Food Chem.. 2018;263:258-264.
- [Google Scholar]
- Adsorption of perfluoroalkyl and polyfluoroalkyl substances (PFASs) from aqueous solution - A review. Sci. Total Environ.. 2019;694
- [CrossRef] [Google Scholar]
- Recent advancements in metal organic framework based electrodes for supercapacitors. Sci. China Mater.. 2018;61:159-184.
- [Google Scholar]
- Magnetic solid phase extraction of typical polycyclic aromatic hydrocarbons from environmental water samples with metal organic framework MIL-101 (Cr) modified zero valent iron nano-particles. J. Chromatogr. A. 2017;1487:22-29.
- [CrossRef] [Google Scholar]
- Revisiting the MIL-101 metal-organic framework: design, synthesis, modifications, advances, and recent applications. J. Mater. Chem. A 2021
- [Google Scholar]
Appendix A
Supplementary material
Supplementary data to this article can be found online at https://doi.org/10.1016/j.arabjc.2022.103960.
Appendix A
Supplementary material
The following are the Supplementary data to this article:Supplementary data 1
Supplementary data 1


