

Translate this page into:
Ultrasonic assisted synthesis of ZnO nanoflakes and photocatalytic activity evaluation for the degradation of methyl orange
⁎Corresponding authors. drismat@iub.edu.pk (Ismat Bibi), Munawar.iqbal@ue.edu.pk (Munawar Iqbal)
-
Received: ,
Accepted: ,
This article was originally published by Elsevier and was migrated to Scientific Scholar after the change of Publisher.
Peer review under responsibility of King Saud University.
Abstract
In the present investigation, ZnO nanoflakes was prepared via sonochemical synthesis route. Effect of ultrasonic treatment time was studied based on structural, morphological and optical properties. X-ray diffraction (XRD) reveals the formation of wurtzite hexagonal crystalline structure of ZnO nanoflakes. Ultrasonic treatments affected the crystallite size and the density of dislocation, which is due to increased nucleation and growth rates of nanoflakes. The samples synthesized at 40–50 min ultrasonic treatment showed a strong absorption band at 605 and 650 (cm−1) versus other treatments, which is an indication of 2D nanostructure (nanoflakes). FE-SEM analysis further confirms the formation of 2D nanostructures of the ZnO. The composition and purity was confirmed by the energy dispersive X-ray (EDX) analysis, which displays the occurrence of Zn and O elements in the sample. Photocatalytic activity (PCA) of ZnO nanoflakes was studied for methyl orange (MO) dye degradation under UV light exposure and up to 93.13 % dye degradation is achieved within 90 min. Effect of various parameters (dye concentration, mass of photocatalytic material) and kinetic study was also performed. Results revealed that the ultrasonic treatment affected the optical and photocatalytic properties of the of ZnO nanoflakes, which could be employed for the remediation of dyes in textile effluents.
Keywords
ZnO nanoflakes
Ultrasonic treatment
Optical
Structural
Photocatalysis
Methyl orange

1 Introduction
For the purification of water, nanostructures have been shown promising efficiency due to their unique properties. Due to their size at nanoscale, the nanostructures possess higher surface area, which have promising application in different fields (Manohar and Krishnamoorthi, 2017; Manohar et al., 2022). The water is the important factor for sustaining lives and the water sources are reducing in response of over utilization of water due to increasing the population, industries and sewage water mixing with water resources without any treatment, which is one of major issue worldwide. It is the global need to improve the technologies for the water treatment and purification to avoid negative impact on living organisms (Nazir et al., 2021; Khalid et al., 2021; Iqbal et al., 2019).
The ZnO is a semiconductor with 60 meV of exciton binding energy and 3.37 eV band gap energy, which has applications in different fields, i.e., solar cells, optical, electronic, and audio devices, gas and chemical monitors, films, catalysts, lasers, recording arrays and biological applications (Manohar et al., 2021; Salem and Awwad, 2022; Awwad et al., 2020). To date, numerous approaches are developed for the fabrication of ZnO nanostructures, i.e., sol–gel, electrochemical, hydrothermal, soft chemical, sonochemical methods etc (Bukhari et al., 2022; Azam et al., 2022; Ashar et al., 2021; Perveen et al., 2020; Noreen et al., 2020; Mohsin et al., 2020; Ata et al., 2019; Ata et al., 2018). Among all the approaches described, the sonochemical route is one of most cost-effective, efficient, and simple way for synthesis of different nanostructures (Askarinejad et al., 2011; Manohar et al., 2020).
The synthesis route affected the nanoparticles properties significantly (Manohar et al., 2021; Manohar et al., 2022; Manohar and Krishnamoorthi, 2017; Iqbal et al., 2020) and the concept of acoustic cavitation is used in this sonochemical approach, which utilize pressure pulses and ultrasonic energy, which causes physiochemical modifications in the materials exposed the ultrasonic energy. Ultrasonic treatment can considerably improve the rate of exchange of precursor to nanoscale size crystals without the use of high-temperature heating or surfactants. Another advantage of adopting the sonochemical approach is that the size and crystallinity of the synthesized structures that may be precisely regulated (Banerjee et al., 2012).
ZnO and/or ZnO nanocomposites-based nanostructures have been extensively used for as a catalyst for the removal of dyes. For instance, Xu et al. reported that methyl orange could be degraded with 78 % efficiency in 240 min using Co-ZnO NPs synthesized by a hydrothermal route (Xu et al., 2010). For instance, ZnO-TiO2 composite was synthesized using sol–gel method with the aid of surfactant, sodium dodecyl benzene sulfonate (DBS). The synthesized nanoparticles were used for photo-degradation of MO (Liao et al., 2008). Furthermore, the nanostructures were synthesized via surfactant-based synthesis processes make the process costly. Therefore, surfactant free synthesis of ZnO NPs synthesis by have not been studied, hence, the ZnO surfactant free synthesis can be performed under ultrasonic treatment.
Based on aforementioned facts, the effect of variation of ultrasonic treatment (energy) on ZnO nanoflakes formation is studied in the present investigation. The effect of ultrasonic treatment was studied on the basis of structural, morphology, optical and photocatalytic properties. The PCA of ZnO was studied for MO dye degradation under UV light exposure.
2 Material and methods
2.1 Synthesis procedure
The Zn(NO3)2·6H2O, NaOH was precured from Sigma-Aldrich. Zn(NO3)2·6H2O (3 g) was dissolved in 100 mL water and agitated for 15 min. Then, 20 mL of solution was subjected to ultrasonic treatment using UC-D10 ultrasonic BMS of frequency 35 kHz for 10 min. 1 M NaOH was added along with ultrasonic treatment, which results in the white precipitates formation. The sonicator was initially set to room temperature while due to ultrasonic agitation its temperature rises to 50 °C. The precipitates are rinsed with water, filtered and dried for overnight at 60 °C. A total 5 samples were prepared for 10–50 min ultrasonic treatments. The schematic ZnO synthesis is depicted in Fig. 1.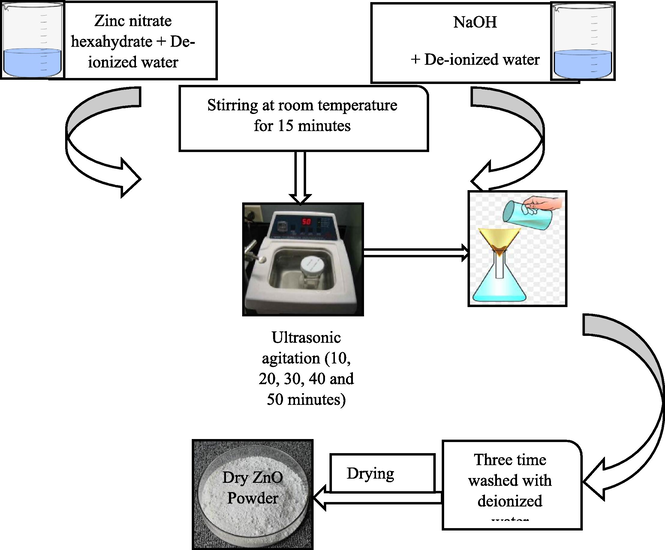
Schematic presentation of ZnO synthesis by sonochemical route.
2.2 Photocatalytic activity
The PCA of ZnO was appraised by MO degradation under UV radiation. Initially, the dye solution was prepared by dissolving different concentrations of MO (30 mg, 40 mg and 50 mg) in 1000 mL of water. ZnO (0.2 g/L, 0.4 g/L and 0.8 g/L) was mixed to dye solution of MO and agitated at room temperature for 1 h. The suspension was then put under UV irradiation up to 60 min. At different ultrasonic treatment time (50 min), 2 mL suspension was taken, fileted and residual concentration was measured dye degradation was calculated using Eq. (1).
2.3 Characterization
The Bruker D8 advance X ray diffractometer equipped with Ni filter having CuKa (0.15406 nm) was used to analyze the phase identification of prepared samples. The scanning range and step size were 30–70° and 0.05° respectively. The FE-SEM, FEI Nova NanoSEM equipped with EDX, was used to obtain the morphology of prepared samples. Moreover, the detailed observations were attained through 20 kV. The FTIR Bruker Tensor II was used to examine the functional groups. Also, by using Rock Solid Interferometer, spectrum was recorded in 600–2000 cm−1 range having resolution 4 cm−1. UV–vis spectra was obtained from SPECORD 210 PLUS Spectrometer.
The crystallite size has been calculated by Scherer’s equation from full width half maximum (FWHM) of diffraction peak (Eq. (2)) (Cullity, 1956).
The d-spacing is found out by using the Bragg law (Eq. (6)) (Manohar and Krishnamoorthi, 2017), d-spacing was estimated using Eq. (7) (Cullity and Stock, 2001) and ZnO the Zn—O bond length is given by Eq. (8) (Ahson et al., 2020).
3 Results and discussion
3.1 XRD analysis
The XRD patterns of ZnO synthesized at 10, 20, 30, 40, and 50 min of ultrasonic treatments are analyzed for their crystal structure and phase. With 10 min of ultrasonic treatment, XRD pattern (Fig. 2a-c) reveals that the samples exhibit Zn(OH)2 traces (JCPDS card No: 41-1359) along with ZnO phase (JCPDS card No: 36-1451). After 40 min of ultrasonic treatment, Fig. 2d revealed the formation of pure ZnO phase because no additional peaks are appeared in the spectra, which is an indication that Zn(OH)2 are changed into ZnO phase. After 50 min of sonochemical treatment, sharp and well-oriented peaks are seen. The reflection from the (1 0 0), (0 0 2), (1 0 1), (1 0 2), (1 1 0) and (1 1 3) crystal planes of the hexagonal wurtzite ZnO structure correspond to the diffraction peaks for final samples at angles 2
of 31.65168°, 34.33475°, 36.11539°, 47.39467°, 56.44974° and 62.04196° (Ahson et al., 2020). Standard data showed that all peaks corresponded to the hexagonal phase of zinc oxide (JCPS card No. 36-1451). The hexagonal wurtzite structure of ZnO prepared over a range of ultrasonic time values are alike (Fig. 2). These results indicate that pure zinc oxide nanoflakes have been synthesized. Nanometer range is indicated by broadenings of diffraction peaks. ZnO prepared by the ultrasonic treatment time shows that this variation in time has a significant impact on particle size and structure. By increasing time there is a decline in the intensity of peak of Zn(OH)2. ZnO phase purity was observed at 40 and 50 min of ultrasonic treatment due to the higher synthesis rate that was achieved using this method as opposed to conventional stirring (Gharat and Rathod, 2013). As the ultrasonic treatment time increases, the FWHM decreases as well. ZnO nanoflakes growth has been observed at higher ultrasonic treatment time. The growth rate change along the various crystallographic planes is accountable for this phenomenon (Fig. 3). They used zinc nitrate hexahydrate as precursor of Zn and NH4OH for pH variation from 7 to 11 (neutral to basic). In current study, pH of the solution is maintained to 7 (neutral). Neutral pH normally results in 2D structures, i.e., nanoplates or nanoflakes. The pH has significant effect on the morphology of the nanoparticles. Few reports are available for formation of nanoflakes by varying pH. Precursor selection is also very important for morphology of the crystals and the findings of the present investigation are also in line with previous studies. Three mostly used precursors (nitrates, chlorides and acetates) results in different morphology due to adsorption phenomenon. Nitrates base precursors adsorption phenomenon is stronger as compared to acetates and chlorides therefore forms 2D structures (Barreto et al., 2013). Moreover, the molar ratio of Zn+2 to OH-1 is also a main factor in the formation of ZnO nanoparticles and the OH-1 value increases as the reaction time increases. Fig. 3 represents the illustration of ZnO nanoflakes. After 10 mins of ultrasonic treatment, Zn(OH)2 crystals are nucleated. After 40 mins Zn(OH)2 decomposes and ZnO are produced. The effect of Zn2+ and OH– is reported by Yamabi and Imai (Yamabi and Imai, 2002). As reaction time increases, the surface of ZnO turned negative due to OH– ions. Due to this electronegativity, more Zn2+are attracted by ZnO and locally bounded at surface and this process continued till all the OH– ions are utilized. Formation of ZnO seeds involves consecutive reaction series of Zn(OH)2-2. When this solution subjected to ultrasound treatment, the medium stimulates formation of OH– and H+ ions because of regular conditions produced by implosion of the bubbles by the ultrasonic cavitation phenomenon (Yamabi and Imai, 2002). Zn(OH)22– continuous to form Zn(OH)42- by reacting with OH–. Zn(OH)42- is the basic growth unit for ZnO crystal. Conversely, Unsi (Usui, 2009) revealed the generation H2O2 (Eq. (13)) in the ultrasonic treatment, which then react with zinc hydroxide (Eq. (14)) and ZnO are formed as a result of ultrasonic treatment.
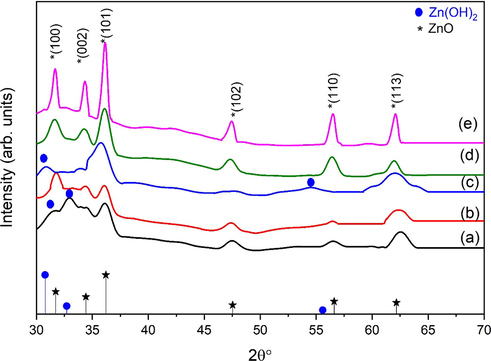
XRD patterns of ZnO nanoflakes prepared at different ultrasonic treatment time (a) 10 mins, (b) 20 mins, (c) 30 mins, (d) 40 mins and (e) 50 mins: “*” indicates the ZnO peaks (JCPDS 36-1451) and “” indicates the Zn (OH)2 (JCPDS-41-1359).
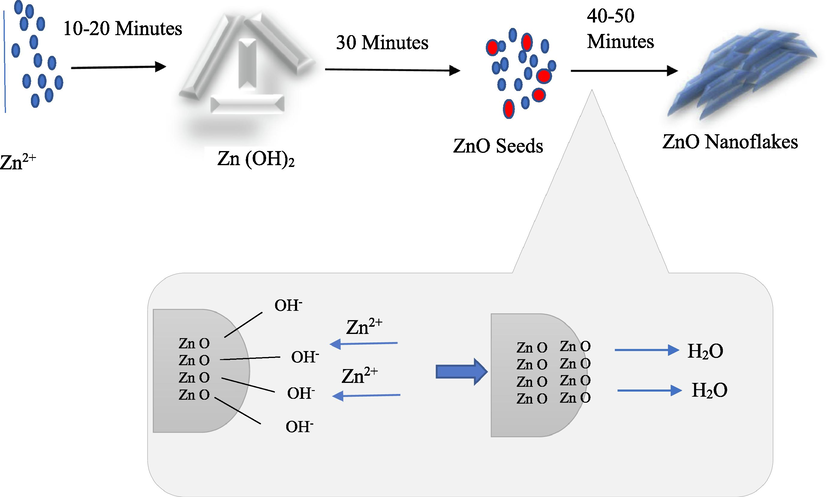
Proposed formation mechanism of ZnO nanoflakes.
The FWHM of (1 0 1) decreases with an increase in reaction time. Five samples were taken at different times, and the corresponding
values are depicted in Table 1.
Planes
2θ
10 min
20 min
30 min
40 min
50 min
100
31.380
31.756
30.831
31.599
31.651
002
34.507
34.516
33.961
34.284
34.334
101
36.184
36.080
35.997
36.128
36.115
102
47.439
48.879
47.546
47.458
47.394
110
56.538
–
–
56.417
56.449
103
62.541
62.475
62.205
61.935
62.041
The experimentally determined values (from XRD data) of respective parameters are depicted in Table 2 (Taha et al., 2015). With increasing ultrasonic treatment time, the crystallite size increases, the density of dislocations decreases, which is due to increased nucleation and growth rates of nanostructures (Fig. 4). Firstly, crystallite size increases with time and after 30 min it starts to decrease. This is due to fact that, variation or transformation of nanostructures causes decrease in crystallite size (Djurado et al., 2000). This variation or formation of 2D nanostructures, i.e., (nanoflakes) can be observed in scanning electron microscopy images. The increase in ultrasonic treatment time causes increase in temperature. This increased temperature produce polarization, or the separation of solvents, which accelerates growth and minimizes the likelihood of agglomeration (Vinila et al., 2014). Furthermore, as transformation in nanostructures has done, the ZnO phase strengthened due to the coalescence of tiny nuclei, resulting in an increase in crystallite size and a decrease in dislocation density.
Agitation time
a (Å)
c (Å)
c/a
D(nm)
δ(nm)-2
10 min
3.2890
5.6967
1.7321
36.3793
0.00076
20 min
3.2511
5.6309
1.7321
57.5332
0.00030
30 min
3.3461
5.7956
1.7321
66.3827
0.00023
40 min
3.2668
5.6583
1.7321
17.1963
0.00338
50 min
3.2615
5.6491
1.7321
30.6444
0.00107
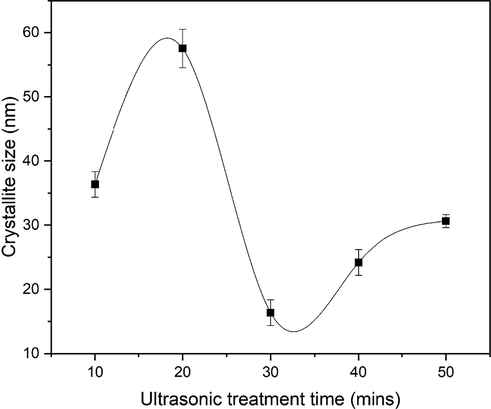
Variation in the crystallite size ZnO nanoflakes prepared at different ultrasonic treatments.
The decline is seen in δ, demonstrating that the defects (micro) of the samples reduce with time and with temperature because of changes in microstructure, scale and size, form, bond length, and particle defects, as indicated in Table 2. The lattice constants values ‘a’ and ‘c’ are same and highly match with the previously reported studied (Iqbal et al., 2018; Manikandan et al., 2018). Table 3 and Fig. 5 depicts the values of d (braggs) and d (Formulae) calculated for ZnO and Table 4 shows the bond length for ZnO samples.
Agitation time
d(Braggs) Å
d(Formulae) Å
10 min
2.48043
2.737066
20 min
2.487391
2.721226
30 min
2.492936
2.760716
40 min
2.48417
2.727827
50 min
2.485043
2.72561
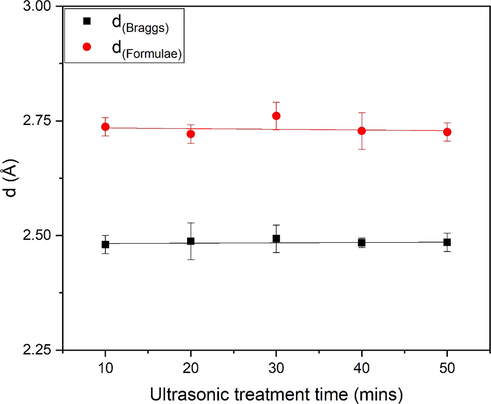
Comparison of dBraggs and dFormulae of ZnO nanoflakes prepared at different ultrasonic treatments.
Agitation time
L(Å)
10 min
0.444697
1.98486
20 min
0.44245
2.052293
30 min
0.44245
2.108125
40 min
0.44245
2.061575
50 min
0.44245
2.058455
3.2 FTIR analysis
The functional group of ZnO NPs was determined through FTIR analysis. Fig. 6 shows the FTIR spectra of ZnO over time ranging from 10 to 50 min during the sonochemical process. Several bands can be found throughout the spectrum in the 400–3000 cm−1 range. Specifically, peak at 433 cm−1 is the characteristic absorption of Zn–O bond observed at relatively low reaction time (10, 20 and 30 min). For samples synthesized at 40- and 50 min exhibit two strong absorption bands at 605 and 650 cm−1. It is earlier reported that, for 1D morphologies of ZnO, single peak at 433 cm−1 would appear, while double peaks at 605 and 650 (cm−1) revealed the 2D structures (Sowri Babu et al., 2013). The occurrence of double peaks is in good agreement with the observed flakes like 2D morphologies (50 min ultrasonic treatment). The C—O vibration is correlated with the band found at 887 cm–1 (Kaur et al., 2018). The band observed at 1400 cm−1 is only observed at relatively higher ultrasonic treatment time (40 and 50 min). There are two possibilities of band observed at 1400 cm−1. (1) Formation of zinc carboxylates (Aslinjensipriya et al., 2020). This band is relatively intense at 40 min ultrasonic treatment. The intensity of zinc carboxylate decreases after 50 min of ultrasonic treatment. With increase in time higher energy produces and decomposition of carboxylates starts (Vieira et al., 2021). (2) In the region of 1400–1600 cm-1C
C stretching vibrations occur. For aromatic ring two or three bands occur in this region, i.e. ∼1400 cm−1. The band observed at ∼1400 cm−1 is assigned to ring C
C. According to previous studies this band can also be assigned to aromatic ring C
C. An extremely weak peak at 2346 cm−1 was attributed to CO2 absorbed from air. The C—H vibration is correlated with the band found at 2910 cm−1.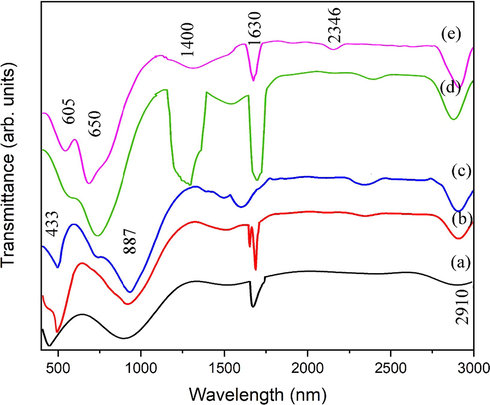
FTIR analysis of ZnO nanoflakes prepared at different ultrasonic treatments (a) 10 min, (b) 20 min, (c) 30 min, (d) 40 min and (e) 50 min.
3.3 SEM and EDX analysis
The FE-SEM results revealed that the flakes morphology dependent on synthesis method. The ZnO forms nanoflakes, which were in the form of agglomeration (Fig. 7). This agglomeration may be due to fact that there is no surfactant was used during synthesis and ZnO showed nanoflakes agglomeration trend. The nanoflakes formation is good to photocatalytic application due to enhanced surface area. Fig. 7a shows that nanoflake length is 170 nm to 180 nm while thickness is 20–30 nm. The EDS of ZnO nanoflake synthesized at 50 min of ultrasonic treatment is shown in Fig. 7 and the characteristic peaks are of Zn and O. The spectra revealed a strong signal for zinc around (85 %) and a prominent oxygen peak with 13.49 % was observed. This EDX analysis of the sample was also performed and results revealed the preparation of pure ZnO by sonochemical treatment (Fig. 8).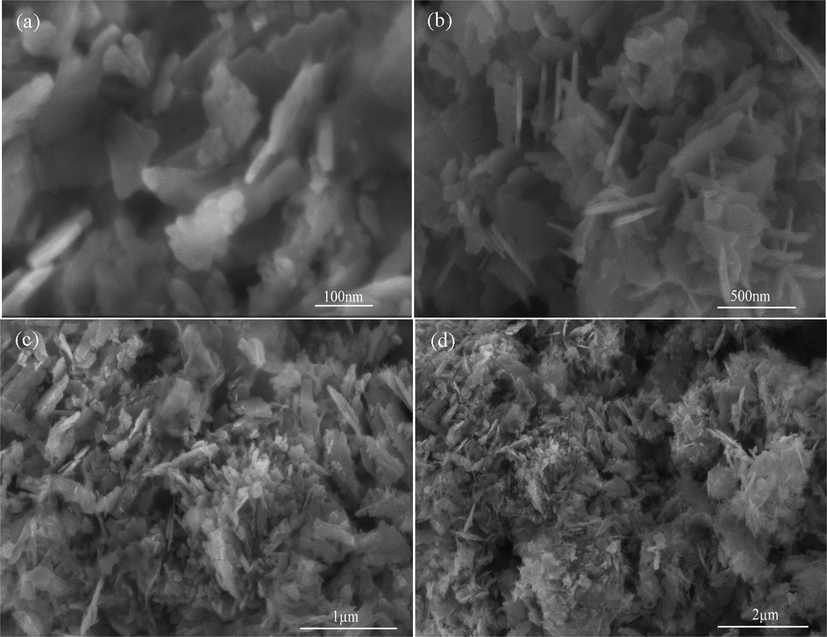
FE-SEM images of ZnO nanoflakes prepared at 50 min ultrasonic treatment at different magnifications (a) 100 nm, (b) 500 nm, (c) 1 µm and (d) 2 µm.
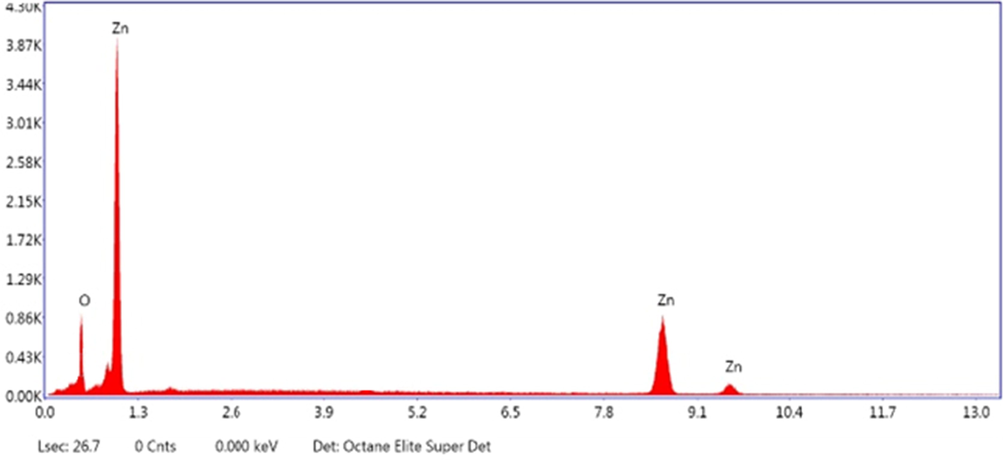
EDX analysis of ZnO nanoflakes prepared at 50 min of ultrasonic treatment.
3.4 Photocatalytic activity
The absorption spectra of ZnO nanoflakes at different ultrasonic treatment shows the absorption at 367 nm (Fig. S1), which can be attributed to the intrinsically band-gap absorption of ZnO due to electron transfers from the fermi band to the CB (Gharat and Rathod, 2013). For effective PCA, the morphology of NPs plays an important role, especially 2D nanostructure like nanoflakes. ZnO nanoflakes of 150–170 nm was observed for sample treated at 50 min of ultrasonic treatment. The photocatalytic mechanism of ZnO nanoflakes were analyzed by degrading MO dye under UV light irradiation.
To analyze the effect of UV on degradation activity a blank experiment was carried out in the absence of ZnO powder. The MO dye solution (30 mg/L) was prepared and subjected to UV light, which furnished only 3 % MO dye degradation (Fig. 9). This degradation rate is almost negligible. In the absence of UV light, MO concentration remain almost same. In can be concluded that UV illumination and presence of photocatalyst is necessary for degradation of dyes.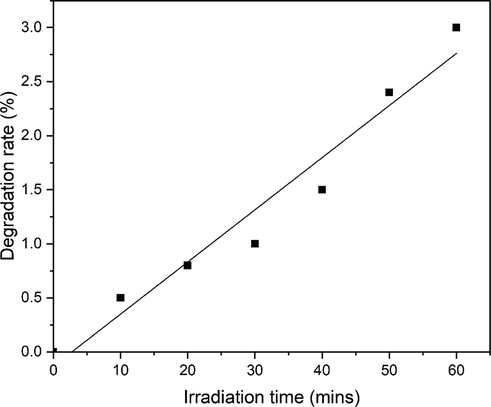
The degradation of MO dye in control runs (Blank).
3.4.1 Effect of initial dye concentration
ZnO nanoflakes (0.8 g/L) obtained after 50 min of sonication was added in the MO dye solution and ∼93.13 % degradation was achieved after 90 min of irradiation (Fig. 10a). Different parameters e.g. dye concentration, mass of photocatalytic material have been varied. Dye concentration is varied as 30 mg/ L, 50 mg/L and 100 mg/L. By keeping mass of the photocatalytic material constant maximum efficiency of MO for 30 mg/ L, 50 mg/L and 100 mg/L is obtained 93.13, 69.44 and 54.57 (%), respectively (Fig. 10a-c). Therefore, photocatalytic material efficiency can be enhanced by lowering the concentration of dye. Decreased efficiency is due to increased dye adsorption over the surface of photocatalyst. Dye molecules occupied active sites, thereby reducing the formation of radicals. Moreover, UV light cannot reach the molecules due to adsorption phenomenon of dye and thus initial concentration reduced dye degradation rate (Mohsin et al., 2020). Degradation rate for different initial dye concentration with irradiation time is shown in Fig. 11.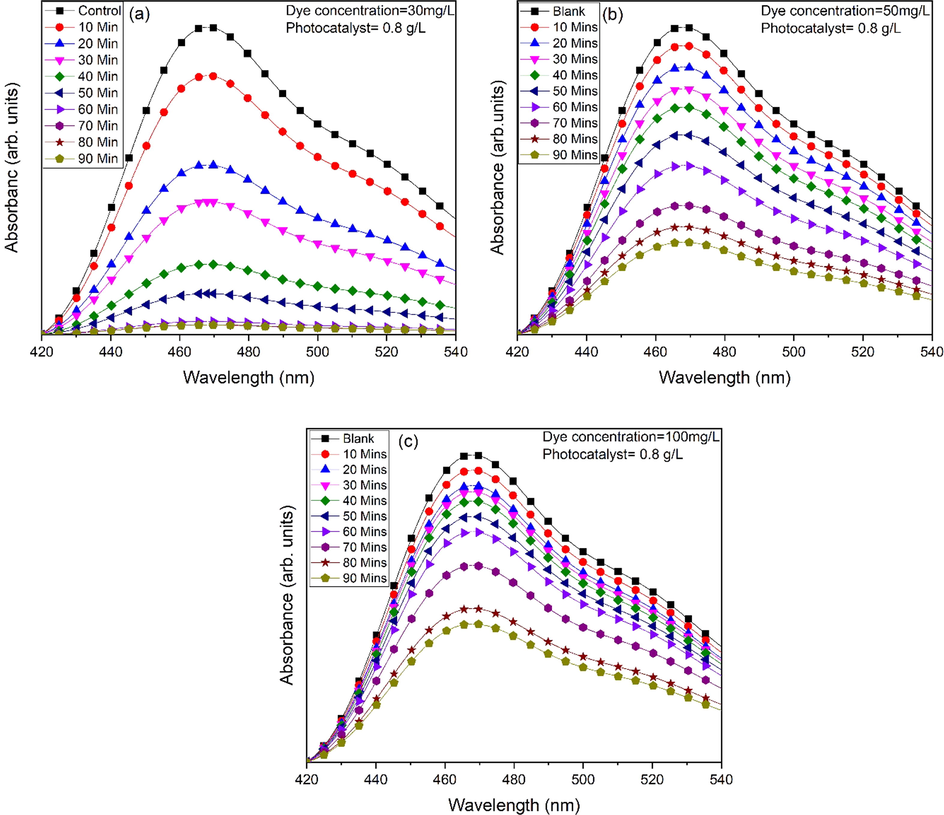
Photocatalytic activity of ZnO nanoflakes against MO for different dye concentrations (a) 30 mg/L, (b) 50 mg/L and (c) 100 mg/L.
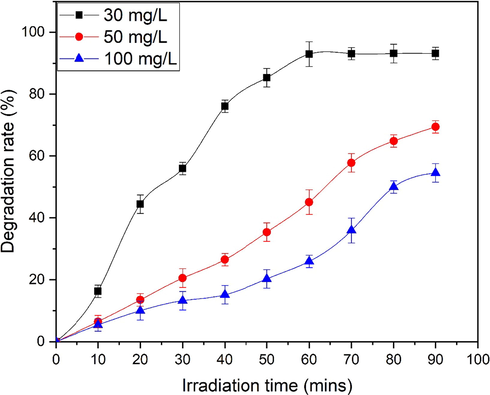
Comparison of degradation rate of MO at different dye concentration.
3.4.2 Effect of ZnO dosage
Fig. 12 represents the photocatalytic efficiency of MO (30 mg/L) for various mass of photocatalytic material (0.2 g/L, 0.4 g/L and 0.8 g/L) (Fig. 12a-c. Results show that efficiency of MO degradation decreases with increase in dosage of ZnO. With increase in photocatalytic material production of radicals increases due to large surface active sites (Ashar et al., 2016). Maximum efficiency (93.13 %) and saturation of dye degradation is achieved at 0.8 g/L of ZnO dose. Fig. 13 represents the comparison of degradation rate for different dosage of ZnO.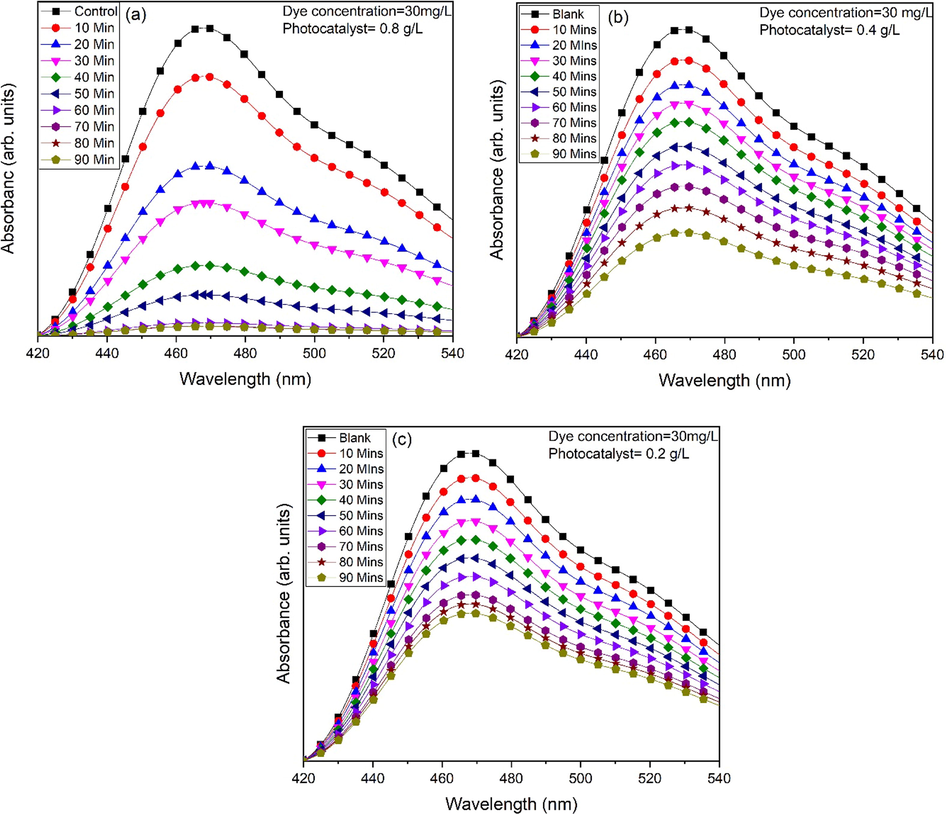
Photocatalytic activity of ZnO nanoflakes against MO for different dosage of ZnO (a) 0.8 g/L, (b) 0.4 g/L and (c) 0.2 g/L.
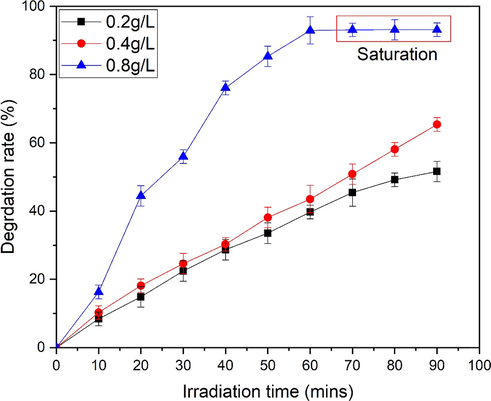
Comparison of degradation rate of MO at different ZnO.
3.4.3 Kinetic study
The kinetic study of sonochemically synthesized against MO was studied by Langmuir–Hinshewood Kinetic model given in Eq. (15) (Ghafoor et al., 2021).
Fig. 14a-b representing the linear plot of
vs exposure time for different dye concentrations and ZnO dosage respectively. It can be seen that MO dye follow the pseudo-first order rate constant. The value of linear regression coefficient (R) and rate constant is given in Table 5. The minimum value of correlation coefficient is achieved 0.90125 for higher concentration of dye. All values are above 0.90125 confirms the well-fitting of kinetic model. A comparison of previous related studies is shown in Table 6 and the responses thus observed, revealed that that the ZnO nanoflakes are highly efficient photocatalyst and could be employed for the remediation of dye in the effluents, which is a one of major environmental issues (Jalal et al., 2021; Chham et al., 2018; Ayach et al., 2017; Djehaf et al., 2017).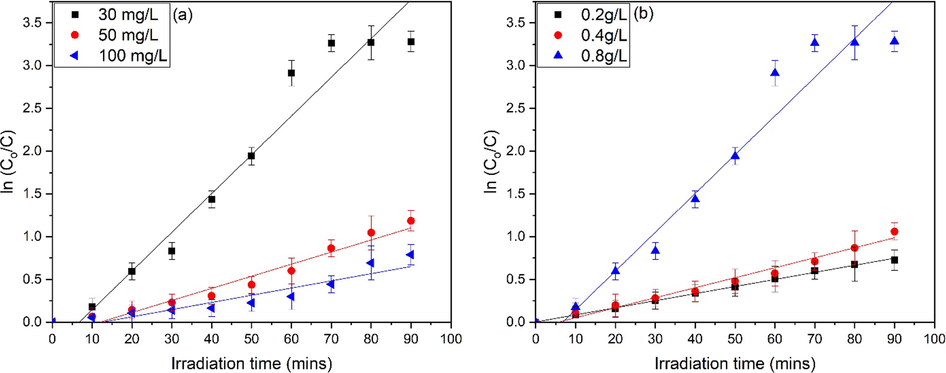
Pseudo-first order kinetics for ZnO, (a) effect of dye concentration and (b) effect of ZnO dosage.
Factors variation
k (min−1)
R2
Dye concentration (mg/L)
30
0.04533
0.964
50
0.01413
0.95288
100
0.0084
0.90125
ZnO dosage
0.8
0.04533
0.964
0.4
0.01169
0.97422
0.2
0.00829
0.99618
Catalyst
Surfactant
Dye concentration (ppm)
Degradation time (min)
Photo degradation (%)
References
ZnO
Pithecellobium dulce peel
–
50
∼63
(Madhumitha et al., 2019)
ZnO
Ag-r-GO
20
120
95.0
(Liu et al., 2020)
ZnO
–
10
50
80.8
(Lim et al., 2021)
ZnO
Urea
10
30
92
(Jayakrishnan et al., 2022)
ZnO
–
30
90
93.13
Present Study
3.4.4 TOC analysis
Next, the percentage variation in total organic carbon (TOC) during photo-degradation of MO was also examined (Fig. 15). The percentage TOC of the MO solution shows a steep increase. Graph represents the up to 75 % degradation after 90 mins. From Fig. 15, it can be interpreted that during PCA intermediate degradation products produced first and then, mineralization process occurs (Katsumata et al., 2013).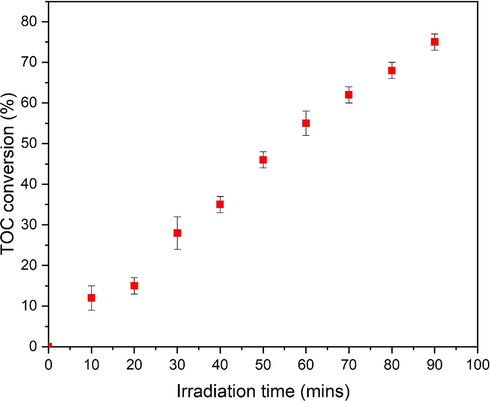
Total organic carbon analysis during photo-degradation of MO by ZnO.
3.4.5 Degradation mechanism and catalyst stability
The MO dye degradation mechanism is presented in Eqs. (16)–(28) and illustrated in Fig. 16 Photocatalysis is a dynamical mechanism that generates a succession of oxidation reduction events and is the most essential attribute of nano ZnO. Nano ZnO absorbs the light and breaks down complex series organic molecules (toxins) in to the smaller pieces, such as atoms, ions, and radicals, in photocatalysis. The transformation of light energy to electrical energy to make radicals as well as other volatile chemical compounds. Hydroxyl radicals & superoxide anions are the principal oxidizing species generated during photocatalysis (Katsumata et al., 2013). Pure ZnO in the hexagonal wurtzite crystalline form is widely employed in a variety of industrial & practical applications. Electrons are emitted when a photon with an energy larger than the energy band gap of ZnO meets its surface. The liberated electron then interacted with oxygen in the atmosphere to form a super oxides anion (•O2–). The surface which has lost one electron absorbs another electron via moisture in order to fill the hole. The moisture was transformed it into hydroxyl radical (•OH). The hydroxyl radical (•OH) as well as the superoxide anion (•O2–) are both extremely reactive, and their tremendous oxidative strength allows them to breakdown organic molecules that pollutes. In a recent study, we analyzed the importance of reactive oxygen species (ROS) in photocatalysis and found that hydroxyl radicals (•OH) are the most important radical scavengers responsible for pollutant degradation (Katsumata et al., 2013). Increased generation of reactive oxygen species (ROS) on the photocatalyst surface improves their ability to destroy contaminants. Also, the ZnO nanoflakes showed promising stability up to four cycles without loss in PCA (Fig. 17a-b). No significant difference in efficiency is observed during recycling which indicates that ZnO not only having outstanding PCA but also can be reused and recycled.
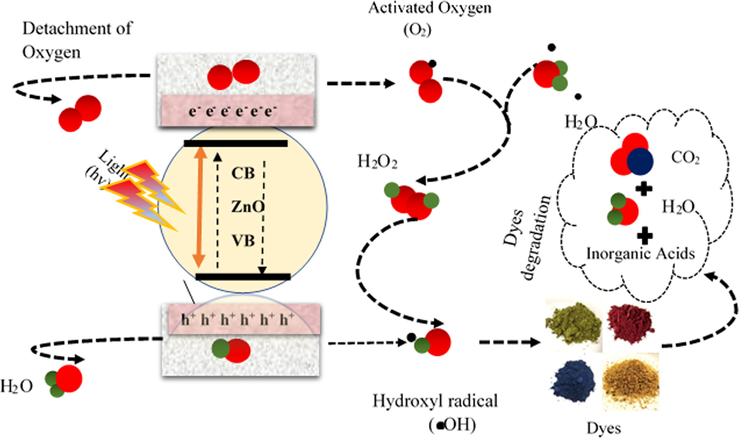
Photo-degradation mechanism of MO by ZnO under UV irradiation.
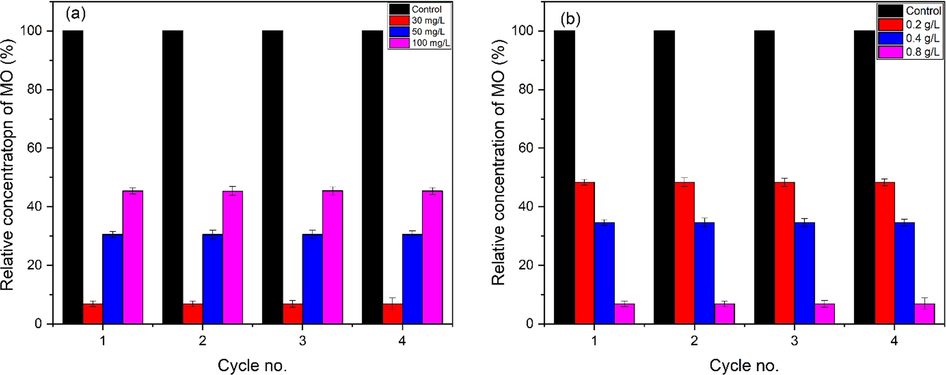
Stability and reproducibility of ZnO photocatalyst, (a) effect of dye concentration and (b) effect of ZnO dosage.
4 Conclusions
Ultrasonic assisted approach was employed successfully for the fabrication of ZnO nanoflakes. The effect of ultrasonic treatment was applied on the basis of photocatalytic application along with structural and morphological properties. The ZnO revealed the formation of hexagonal wurtzite structure. The crystallite size was increased and dislocation density was decreased with ultrasonic treatment. The PCA of ZnO nanoflakes was evaluated against MO dye under UV light irradiation. The ZnO nanoflakes degraded the MO dye up to 93.13 % after 90 min of irradiation. The ZnO nanoflakes, prepared via ultrasonic assisted route is highly photoactive and have potential application for the removal of dyes in effluents.
Research funding
This research was funded by Princess Nourah bint Abdulrahman University Researchers Supporting Project (PNURSP2022R26), Princess Nourah bint Abdulrahman University, Riyadh, Saudi Arabia. The authors extend their appreciation to the Deanship of Scientific Research at King Khalid University, Saudi Arabia for funding this work through Research Groups Program under Grant No R.G.P.2-187/43.
Acknowledgments
The authors express their gratitude to Princess Nourah bint Abdulrahman University Researchers Supporting Project (PNURSP2022R26), Princess Nourah bint Abdulrahman University, Riyadh, Saudi Arabia. The authors extend their appreciation to the Deanship of Scientific Research at King Khalid University, Saudi Arabia for funding this work through Research Groups Program under grant number R.G.P.2-187/43.
Declaration of Competing Interest
The authors declare that they have no known competing financial interests or personal relationships that could have appeared to influence the work reported in this paper.
References
- Effect of Structure Modifying Agents on the Structural, Morphological and Optical Features of Hydrothermally Grown ZnO. J. Nanosci. Nanotechnol.. 2020;20:3265-3273.
- [Google Scholar]
- Synthesis, characterization and photocatalytic activity of ZnO flower and pseudo-sphere: Nonylphenol ethoxylate degradation under UV and solar irradiation. J. Alloys Compd.. 2016;678:126-136.
- [Google Scholar]
- Integrated hydrothermal assisted green synthesis of ZnO nano discs and their water purification efficiency together with antimicrobial activity. J. Mater. Res. Technol.. 2021;15:6901-6917.
- [Google Scholar]
- Sonochemically assisted synthesis of ZnO nanoparticles: a novel direct method. Iran. J. Chem. Chem. Eng.. 2011;30:75-81.
- [Google Scholar]
- Synthesis and characterization of ZnO nanoparticles by novel sol gel technique. In: AIP Conference Proceedings. AIP Publishing LLC; 2020. p. :070013.
- [Google Scholar]
- Graphene and silver decorated ZnO composite synthesis, characterization and photocatalytic activity evaluation. Diam. Relat. Mater.. 2018;90:26-31.
- [Google Scholar]
- Synthesis and Characterization of ZnO Nanorods as an Adsorbent for Cr (VI) Sequestration. Z. Phys. Chem.. 2019;233:995-1017.
- [Google Scholar]
- Green synthesis of zinc oxide nanoparticles (ZnO-NPs) using Ailanthus altissima fruit extracts and antibacterial activity. Chem. Int.. 2020;6:151-159.
- [Google Scholar]
- Adsorption of methylene blue on bituminous schists from Tarfaya-Boujdour. Chem. Int.. 2017;3:442-451.
- [Google Scholar]
- Zinc oxide nano-fertilizer application (foliar and soil) effect on the growth, photosynthetic pigments and antioxidant system of maize cultivar. Biocatal. Agric. Biotechnol.. 2022;42:102343.
- [Google Scholar]
- Ultrasonics Sonochemistry Zinc oxide nanoparticles–Sonochemical synthesis, characterization and application for photo-remediation of heavy metal. Ultrason. Sonochem.. 2012;19:85-93.
- [Google Scholar]
- Structure of Metals. Oxford: Pergamon Press; 1980.
- Microwave assisted synthesis of ZnO nanoparticles: effect of precursor reagents, temperature, irradiation time, and additives on nano-ZnO morphology development. J. Mater.. 2013;2013:1-11.
- [Google Scholar]
- Catalytic degradation of MO and MB dyes under solar and UV light irradiation using ZnO fabricated using Syzygium Cumini leaf extract. Z. Phys. Chem.. 2022;236:659-671.
- [Google Scholar]
- The use of insoluble mater of Moroccan oil shale for removal of dyes from aqueous solution. Chem. Int.. 2018;4:67-77.
- [Google Scholar]
- Elements of X-ray Diffraction. Addison-Wesley Publishing; 1956.
- Elements of X-ray Diffraction (third ed.). Prentice Hall; 2001. p. :174-177.
- Textile wastewater in Tlemcen (Western Algeria): Impact, treatment by combined process. Chem. Int.. 2017;3:414-419.
- [Google Scholar]
- Crystallite Size Effect on the Tetragonal-Monoclinic Transition of Undoped Nanocrystalline Zirconia Studied by XRD and Raman Spectrometry. J. Solid State Chem.. 2000;149:399-407.
- [Google Scholar]
- Ce and Fe doped LaNiO3 synthesized by micro-emulsion route: Effect of doping on visible light absorption for photocatalytic application. Mater. Res. Express. 2021;8:085009.
- [Google Scholar]
- Ultrasound assisted enzyme catalyzed transesterification of waste cooking oil with dimethyl carbonate. Ultrason. Sonochem.. 2013;20:900-905.
- [Google Scholar]
- Bioassays based on higher plants as excellent dosimeters for ecotoxicity monitoring: A review. Chem. Int.. 2019;5:1-80.
- [Google Scholar]
- Microwave assisted synthesis of zinc vanadate nanoparticles and photocatalytic application. Mater. Res. Express. 2020;7:015070.
- [Google Scholar]
- Facile synthesis of ZnO nanosheets: Structural, antibacterial and photocatalytic studies. Mater. Lett.. 2018;224:59-63.
- [Google Scholar]
- Efficient removal of dyes in textile effluents using aluminum-based coagulants. Chem. Int.. 2021;7:197-207.
- [Google Scholar]
- Photoelectrochemical properties and photocatalytic degradation of methyl orange dye by different ZnO nanostructures. J. Mater. Sci.: Mater. Electron.. 2022;33:9732-9742.
- [Google Scholar]
- Photocatalytic degradation of bisphenol A by Ag3PO4 under visible light. Catal. Commun.. 2013;34:30-34.
- [Google Scholar]
- Structural, morphological and optical properties of Eu-N co-doped zinc oxide nanoparticles synthesized using co-precipitation technique. Vacuum. 2018;155:689-695.
- [Google Scholar]
- Cellulosic biomass biocomposites with polyaniline, polypyrrole and sodium alginate: Insecticide adsorption-desorption, equilibrium and kinetics studies. Arab. J. Chem. 2021:103227.
- [Google Scholar]
- Preparation of nanosized TiO2/ZnO composite catalyst and its photocatalytic activity for degradation of methyl orange. J. Photochem. Photobiol., A. 2008;194:11-19.
- [Google Scholar]
- Efficient photocatalytic degradation of dyes using photo-deposited Ag nanoparticles on ZnO structures: simple morphological control of ZnO. RSC Adv.. 2021;11:8709-8717.
- [Google Scholar]
- Green preparation of Ag-ZnO-rGO nanoparticles for efficient adsorption and photodegradation activity. Colloids Surf., A. 2020;584:124011.
- [Google Scholar]
- Green synthesis, characterization and antifungal and photocatalytic activity of Pithecellobium dulce peel–mediated ZnO nanoparticles. J. Phys. Chem. Solids. 2019;127:43-51.
- [Google Scholar]
- Properties of sol gel synthesized ZnO nanoparticles. J. Mater. Sci.: Mater. Electron.. 2018;29:9474-9485.
- [Google Scholar]
- Photocatalytic study and superparamagnetic nature of Zn-doped MgFe2O4 colloidal size nanocrystals prepared by solvothermal reflux method. J. Photochem. Photobiol., B. 2017;173:456-465.
- [Google Scholar]
- Magnetic hyperthermia and photocatalytic degradation of rhodamine B dye using Zn-doped spinel Fe3O4 nanoparticles. J. Mater. Sci.: Mater. Electron.. 2021;32:8778-8787.
- [Google Scholar]
- Magnetic and photocatalytic studies on Zn1−xMgxFe2O4 nanocolloids synthesized by solvothermal reflux method. J. Photochem. Photobiol., B. 2017;177:95-104.
- [Google Scholar]
- Magnetic Hyperthermia and Photocatalytic Properties of Mg₀.₇Zn₀.3Fe2O4 Nanocrystals. IEEE Trans. Magn.. 2020;56:1-7.
- [Google Scholar]
- Synthesis and characterization of ZnO nanoparticles for photocatalysis, antibacterial and cytotoxicity in kidney cancer (A498) cell lines. J. Alloys Compd.. 2021;874:159868.
- [Google Scholar]
- A mini-review on AFe2O4 (A = Zn, Mg, Mn Co, Cu, and Ni) nanoparticles: Photocatalytic, magnetic hyperthermia and cytotoxicity study. Mater. Chem. Phys.. 2022;286:126117.
- [Google Scholar]
- Ca-Doped MgFe2O4 Nanoparticles for Magnetic Hyperthermia and Their Cytotoxicity in Normal and Cancer Cell Lines. ACS Appl. Nano Mater.. 2022;5:5847-5856.
- [Google Scholar]
- Fe/ZnO@ ceramic fabrication for the enhanced photocatalytic performance under solar light irradiation for dye degradation. J. Mater. Res. Technol.. 2020;9:4218-4229.
- [Google Scholar]
- Zinc oxide nanoparticles fabrication using Eriobotrya japonica leaves extract: Photocatalytic performance and antibacterial activity evaluation. Arab. J. Chem.. 2021;14:103251.
- [Google Scholar]
- MgO and FeO adsorption efficiencies for direct sky Blue dye: equilibrium, kinetics and thermodynamics studies. J. Mater. Res. Technol.. 2020;9:5881-5893.
- [Google Scholar]
- Green versus sol-gel synthesis of ZnO nanoparticles and antimicrobial activity evaluation against panel of pathogens. J. Mater. Res. Technol.. 2020;9:7817-7827.
- [Google Scholar]
- Green synthesis and characterization of ZnO nanoparticles using Solanum rantonnetii leaves aqueous extract and antifungal activity evaluation. Chem. Int.. 2022;8:12-17.
- [Google Scholar]
- Synthesis and optical characterization of porous ZnO. J. Adv. Ceram.. 2013;2:260-265.
- [Google Scholar]
- Mechanical fabrication and characterization of zinc oxide (ZnO) nanoparticles. J. Ovon. Res.. 2015;11:271-276.
- [Google Scholar]
- Surfactant concentration dependence of structure and photocatalytic properties of zinc oxide rods prepared using chemical synthesis in aqueous solutions. J. Colloid Interface Sci.. 2009;336:667-674.
- [Google Scholar]
- Thermal stability and decomposition mechanism of dicationic imidazolium-based ionic liquids with carboxylate anions. J. Mol. Liq.. 2021;330:115618.
- [Google Scholar]
- X-ray diffraction analysis of nano crystalline ceramic PbBaTiO 3. Crystal Struct. Theor. Appl.. 2014;3:57.
- [Google Scholar]
- Preparation, characterization and photocatalytic activity of Co-doped ZnO powders. J. Alloys Compd.. 2010;497:373-376.
- [Google Scholar]
- Growth conditions for wurtzite zinc oxide films in aqueous solutions. J. Mater. Chem.. 2002;12:3773-3778.
- [Google Scholar]
Appendix A
Supplementary material
Supplementary data to this article can be found online at https://doi.org/10.1016/j.arabjc.2022.104194.
Appendix A
Supplementary material
The following are the Supplementary data to this article:Supplementary data 1
Supplementary data 1


