

Translate this page into:
Moringa oleifera leaves from Brazil: Influence of seasonality, regrowth age and, region in biochemical markers and antioxidant potential
⁎Corresponding author. tatianeoldoni@utfpr.edu.br (Tatiane Luiza Cadorin Oldoni)
-
Received: ,
Accepted: ,
This article was originally published by Elsevier and was migrated to Scientific Scholar after the change of Publisher.
Peer review under responsibility of King Saud University.
Abstract
Moringa oleifera leaves are cultivated in warm regions of Brazil for commercial ends due to their nutritional and biological properties. This study evaluated, by chemometric tools, the influence of seasonality (winter, spring, autumn, and summer), growing area in Brazil (South, Southeast, and Northeast), and regrowth age (40 and 80 days) in antioxidant potential, and biochemical markers determined by HPLC-DAD. The results obtained in the present study showed that all the parameters evaluated were affected by seasonality, regrowth age, and growing region. The content of phenolic compounds and antioxidant activity using the ABTS method was higher in samples cultivated in the southeast (59.4 mg GAE g−1 and 346 µmol TEAC g−1, respectively). The highest antioxidant activities evaluated by DPPH and FRAP methods were obtained from leaves of the southeast and northeast. In addition, young leaves presented higher antioxidant potential and total phenolic content. The cultivation region significantly influenced the content of chlorogenic acid, isoquercitrin, and astragalin, which ranged from 4.2 to 7.2 mg g−1, 8.0 to 10.7 mg g−1, and 2.2 to 3.8 mg g−1, respectively. In addition, a positive correlation between solar radiation and temperature with caffeic acid, rutin, phenolic compounds, and antioxidant assay from the DPPH method was observed. Additionally, the RGB pattern of the images of these leaves was correlated with the levels of compounds with antioxidant activity. Models generated through machine learning showed good performances, and ABTS and rutin analyses developed the best models with a coefficient of determination above 75 %. Thus, color patterns can be used to measure the antioxidant activity by the ABTS method and to determine the rutin concentration in M. oleifera leaves.
Keywords
Natural products
Phenolic compounds
Chlorogenic acid
Astragalin
Machine learning

1 Introduction
Moringa oleifera Lam. (Moringaceaea) is a tree called the “miracle vegetable” because it is a medicinal and functional food. The tree is a drought-resistant plant widespread throughout the world and in Brazil, was introduced as an ornamental plant and locally known as “moringa”, “lírio branco” and “quiabo-de-quina” and has adapted well in warm regional climates (Ma et al., 2018). M. oleifera is considered a Non-Conventional Food Plant (PANC), and it contains high nutritional content and offers commercial possibilities (Javed et al., 2021) due to its excellent nutritional value, easy and low cost cultivation (Dutra et al., 2016).
In recent years, plant-derived products have been used as nutraceuticals, herbal formulations, and dietary supplements and have reached widespread acceptability as a therapeutic agent for treating some diseases. Many studies have shown that the biological activities of natural products are intimately related to phenolic composition (Oldoni et al., 2021), and their content can be influenced by external factors affecting the quality of the material. Thus, it is fundamental to standardize plant-derived products to ensure their safe utilization for industries and consumers (Mandal et al., 2021).
The leaves of M. oleifera present high nutritional value mainly because they are rich in crude protein, fibers, and minerals (Ca, K, Mg and Fe) and their medicinal properties are related to chemical composition mainly due to specialized metabolism as phenolic acids (derivatives of hydrocinnamic acid) and glycosylated flavonoids as isoquercitrin, astragalin and rutin (Lin et al., 2021; Oldoni et al., 2021, 2019; Rodríguez-Pérez et al., 2015). Studies have shown that extracts obtained from leaves of M. oleifera present pharmacological properties such as antioxidant, anti-inflammatory, antilipidemic, antimicrobial, anti-hyperglycemic, among others (Kou et al., 2018; Oldoni et al., 2021; Zhang et al., 2022).
The specialized metabolism could be affected in different pathways. According to Pinto et al., (2022), some stressors, such as temperature, radiation and drought, can induce changes in the metabolism of plants and alter the concentration of phytochemicals because they can form reactive oxygen species (ROS). For example, solar radiation is an external factor that influences the production of phenolic compounds (de Oliveira et al., 2021). Thus, it is expected that higher temperatures and UV radiation can improve the biosynthesis of phenolic compounds. In addition, according to Shervington et al (2018), the content of total phenolic and flavonoids are higher in mature rather than young leaves.
Brazil is megadiverse with continental size, and because of this it is expected that some factors such as geographical location, age of the plant, growing methods, post-harvest, and storage management of the leaves can influence the chemical composition, as well as nutritional and pharmacological potentials suggesting adaptation abilities of the cultivars to the environments (Shervington et al., 2018). To improve and promote the interpretation of data obtained from complex matrices, machine learning (ML) methodologies is a branch of artificial intelligence that can recognize patterns and build predictive models of datasets through algorithms. Karydas et al. (2020) analyzed the antioxidant profile of cherry fruits using spectral imaging and machine learning.
Therefore, it is essential to define biochemical markers for natural products, ensuring efficiency and support of quality control of natural extracts. This study evaluated, by chemometric tools, the influence of seasonality (winter, spring, autumn, and summer), growing area in Brazil (South, Southeast, and Northeast), and regrowth age (40 and 80 days) in antioxidant potential, and biochemical markers determined by HPLC-DAD. In addition, this work aimed to analyze the RGB pattern of M. oleifera leaves images and correlate it with antioxidant activity and their levels of phenolic compounds.
2 Materials and methods
2.1 Plant material
The leaves of M. oleifera were collected from December 2018 to December 2019: (I) during summer, autumn, winter, and spring; (II) with two stages of regrowth (young and mature with 40 and 80 days respectively); and (III) in three different states (Santa Catarina – South, Sao Paulo – Southeast and Bahia – Northeast), with geographical coordinates 26° 57′ 16.2″ S and 48° 45′ 55.0″ W; 22°37′18′' S and 44°49′01′' W and 16°16′43′' S and 39°1′39′' W respectively. A voucher specimen (HPB 483) was authenticated by a plant taxonomist, Dra. Giovana Faneco Pereira, and deposited in the Herbarium of Federal Technological University of Paraná (Pato Branco, Paraná, Brazil). After being collected, leaves were oven-dried (at 40–45 °C), ground, weighed, and stored under refrigeration.
According to Alvares et al. (2013), 3 climatic zones were classified in Brazil: the tropical zone, dry zone, and humid subtropical zone, and also 12 types of climates. Brazil is characterized by a tropical climate found in most of its territory. The south and southeast region are in the humid subtropical zone; the south has a humid subtropical climate, oceanic climate with no dry season, and hot summer and temperate summer. Climate with dry winter and temperate summer is typical of the southeast region. The Northeast has a semi-arid climate characteristic of the region.
2.2 Extraction and isolation of phenolic compounds
M. oleifera leaves (10 g) were extracted with 100 mL of ethanol: water (80:20, v/v) under stirring, for 24 h at ambient conditions of temperature (22–25 ◦C) and light (Oldoni et al., 2019). The extract was filtered and stored under refrigeration, and this procedure was repeated twice to guarantee the complete extraction of compounds. After mixing the three filtrates, they were concentrated using a rotary evaporator, at 40 ◦C, lyophilized and resulted in Hydroalcoholic Extract (HE) that was purified and used for all described assays.
2.3 Folin-Ciocalteau’s reducing capacity (FCR)
The reducing capacity was determined by colorimetric analysis using the Folin-Ciocalteau reagent described by (Singleton et al., 1999). In a test tube, 0.5 mL of the HE (500 mg/L), 2.0 mL of Na2CO3 4 % and 2.5 mL of Folin-Ciocalteau reagent (1:10) were added. After incubation in the dark during a period of 2 h at room temperature, the absorbance (740 nm) was measured by spectrophotometer (model UV–vis Lambda 25, Perkin Elmer). The total phenolic content of the extracts was determined by comparison with a calibration curve of gallic acid as a standard and expressed as mg gallic acid equivalent (GAE) g−1 of the plant.
2.4 Antioxidant activity using the 2,2-diphenyl-1-picrylhydrazyl hydrate (DPPH) free radical scavenging method
The DPPH radical scavenging activity was measured as described by Brand-Williams et al. (1995). The reaction medium consisted of 0.5 mL of the HE (300 mg/L), 3 mL of ethanol, and 0.3 mL of DPPH radical solution 0.5 mmol/L in ethanol. The mixture was incubated in the dark at room temperature for 1 h, and subsequently, the absorbance was measured using a spectrophotometer (model UV–vis Lambda 25, Perkin Elmer) at 517 nm. An analytical curve using Trolox as standard and the results were expressed in μmol of Trolox per gram of plant (μmol Trolox g−1).
2.5 Antioxidant activity using the 2–2′-azino-di-(3-ethylbenzthiazoline sulfonic acid) (ABTS) method
According to Re et al., (1999), the ABTS•+ radical was formed by the reaction of 7 mM ABTS with 140 mM potassium persulfate, incubated at 25 °C in the dark for 12–16 h. The radical was diluted with ethanol to obtain an absorbance value of 0.700 ± 0.200 at 734 nm. Then, 3.0 mL of the ABTS•+ radical solution was added to 30 μL of HE (1000 mg/L), and the absorbance was read at 734 nm after 6 min. The results of the antioxidant activity were expressed as μmol of Trolox equivalent antioxidant capacity TEAC g−1 of the plant.
2.6 Ferric reducing antioxidant potential (FRAP) method
To obtain the FRAP reagent 25 mL of acetate buffer (300 mmol/L, pH 3.6); 2.5 mL of TPTZ (10 mmol/L in 40 mmol/L HCl) and 2.5 mL of FeCl3 (20 mmol/L were mixed in aqueous solution) according to (Benzie and Strain, 1996). An aliquot of 90 μL of the HE (500 mg/L) was added to 3 mL of FRAP reagent. The solution was homogenized and maintained for 30 min in a water bath at 37 °C, and the absorbance was measured in a spectrophotometer at 595 nm. For quantification purposes a calibration curve was plotted related to absorbance versus concentration (from 100 to 1500 μmol/L), and results were expressed as μmol Fe2+ g−1 of the plant.
2.7 High performance liquid chromatography with diode array detector
The chromatographic analyses were carried out according to Oldoni et al. (2019) on a Varian 920-LC high-performance liquid chromatography using an Agilent Microsorb-MV 100 C18 column (250 × 4.6 mm, 5 μm particle size). The mobile phase was a mixture of water: acetic acid (98:2, v/v) (solvent A) and acetonitrile (solvent B) with a flow rate of 1.0 mL min − 1 in a gradient mode, starting with 5 % of solvent B to 30 % B in 10 min, 38 % B in 25 min, 50 % B in 28 min, 95 % B in 32 min, 5 % B in 34 and maintained until 42 min of the conditioning phase. The column temperature was held at 30 °C, and a volume of 10 μL of each sample was injected. For identification purposes, the retention time (RT) and absorption profile in the ultraviolet region were compared with authentic standards (gallic acid, chlorogenic acid, caffeic acid, rutin, isoquercetrin, coumaric acid, astragalin, quercetin, and kaempferol) signals. UV spectra were recorded from 200 to 390 nm and for quantification purposes, peak areas were determined in concentrations ranging from 1.25 to 25 mg/L at 280 (for phenolic acids) and 360 nm (for flavonoids).
2.8 Image analysis and model generation of Moringa oleifera leaves
M. oleifera leaves were photo-registered. The color pattern of the RGB space was decomposed into a data frame. This dataset was used to correlate color with titers of compounds with antioxidant activity. Several models were generated through machine learning algorithms, but only the best models were presented in this article. The models were generated in the Environment R (https://www.R-project.org/).
2.9 Statistical analysis
Multifactorial ANOVA with three factors (seasonality, region, and regrowth age) and Tukey test with a significance level of 5 % was applied to determine significant differences in biochemical markers and antioxidant activity results. Factor analysis was used on the non-collinear physicochemical variables to select variables with high communalities. Following this, principal component analysis (PCA) was applied to the correlation matrix of the average results to ascertain which parameters were relevant for explaining the variability of samples. Data were analyzed using Statistica ® 12.7 and Environment R (https://www.R-project.org/).
3 Results and discussion
3.1 Antioxidant activity
Typically and in order to determine antioxidant potential of complex matrices as plants, it is recommended the use of multiple tests with differences between the experimental conditions and principle of the methods (Prior et al., 2005). Ideally the choice should cover different antioxidant mechanisms, such as those based on single electron transfer (SET) and hydrogen atom transfer (HAT) (Tan & Lim, 2015). Thus, M. oleifera extracts were evaluated using a combination of assays: FCR and FRAP assays, which are based on the SET mechanism; DPPH and ABTS assays, which are based on both SET and HAT mechanisms.
Evaluating the effect of the seasonality, regrowth age, and region on biochemical markers and antioxidant potential, the MANOVA was used (Lise et al., 2021). The results showed that all three independent variables presented significant effects, including interactions (Table 1).
Effect
F
p
Age
40.67
< 0.0001
Region
98.28
< 0.0001
Seasonality
43.29
< 0.0001
Age*Region
15.47
< 0.0001
Age*Season
8.74
< 0.0001
Region*Seasonality
21.81
< 0.0001
Age*Region*Seasonality
9.58
< 0.0001
When the cultivation area was assessed, the content of compounds with capacity to reduce the Folin-Ciocalteau reagent (FCR) ranged from 47.8 to 59.4 mg GAE g−1 for samples cultivated in the South and Southeast respectively. Additionally, the highest values of phenolic content were obtained in the summer and autumn, with a significant difference from leaves grown in winter and spring (Table 2). Data are expressed as mean ± standard deviation. Means followed by different letters vertically indicate significant difference, using the Tukey test (p ≤ 0.05).
Factor
FCR
ABTS
DPPH
FRAP
(mg GAE g−1)
(µmol TEAC g−1)
(µmol TEAC g−1)
(μmol de Fe2+ g−1)
Summer
68.97 ± 7.90 a
245.40 ± 94.8c
285.83 ± 46.9 a
1073.81 ± 133.1b
Autumn
66.94 ± 10.5 a
212.52 ± 60.4c
240.92 ± 55.9b
1099.29 ± 222.8b
Winter
40.97 ± 9.70b
388.68 ± 119.1b
289.52 ± 39.6 a
1401.83 ± 190.6 a
Spring
39.42 ± 2.90b
427.05 ± 37.5 a
284.59 ± 24.4 a
1479.87 ± 141.8 a
South
47.80 ± 14.7c
295.60 ± 123.3b
254.63 ± 60.1b
1118.41 ± 238.6b
Southeast
59.42 ± 18.2 a
346.78 ± 97.5 a
286.78 ± 41.7 a
1361.69 ± 224.6 a
Northeast
53.78 ± 13.7b
320.44 ± 144.3 ab
284.18 ± 26.1 a
1327.92 ± 221.7 a
Young
55.57 ± 15.6 a
336.53 ± 109.0 a
292.62 ± 30.9 a
1294.06 ± 240.1 a
Mature
51.76 ± 16.7b
305.34 ± 135.7b
257.77 ± 53.2b
1244.62 ± 260.4b
To better understand the effects on samples, the triple interactions among seasonality, regrowth age, and cultivation region (supplementary data) were evaluated. The highest content of phenolic compounds was obtained in samples cultivated in the southeast during summer and autumn, with no significant difference based on age of regrowth. Additionally, samples from the south grown in winter and autumn presented the lowest content of phenolic content. Although sample age has influenced results from leaves from the south, it was not significant in samples from the southeast and northeast. Therefore, our results suggest that leaves collected by Moringa producers of the southeast and northeast regions, until 80 days of regrowth will have the highest phenolic content.
Oldoni et al., (2019) and Castillo-López et al., (2017) evaluated the content of phenolic compounds from leaves of M. oleifera from Brazil and Mexico and they obtained 83.4 mg EAG g−1 and 76.6 mg EAG g−1 respectively. Also, Nobossé et al., (2018) evaluated the content of phenolic from leaves cultivated in Camaroes with 30, 45, and 60 days of regrowth and obtained values ranging from 21 to 46 mg EAG g−1.
From ABTS, it is possible to suggest that samples cultivated in the northeast and in the southeast showed the highest values, significantly different from the southern region. From triple interactions (supplementary material), mature leaves grown in the southeast during winter showed the highest capacity of scavenging ABTS radical with value of 511 µmol TEAC g−1. Moreover, samples cultivated in the south during the autumn showed the lowest activity (125 µmol TEAC g−1). Results of antioxidant activity corroborate Lin et al., (2021) that obtained TEAC ranging from de 275 to 484 μmol TEAC g−1 from leaves from India, while Oldoni et al., (2019) obtained values ranging from 600 to 928 μmol TEAC g−1 from purified extracts of M. oleifera leaves.
From DPPH and FRAP methods, similar behavior was observed. Samples from the southeast and northeast showed significant differences from samples from the south. Young leaves from the southeast cultivated in the winter (330 µmol TEAC g−1) and spring (1652 μmol de Fe2+ g−1) showed the highest content for DPPH and FRAP methods, respectively. In addition, from correlation studies (Fig. 1), it was possible to suggest a good and positive relationship between FRAP assay and scavenging methods of ABTS and DPPH radicals. On the other hand, DPPH and ABTS methods showed a weak correlation that could be explained by the fact that the DPPH assay is adequate to evaluate hydrophilic antioxidants while ABTS is indicated to evaluate both lipophilic and hydrophilic antioxidants.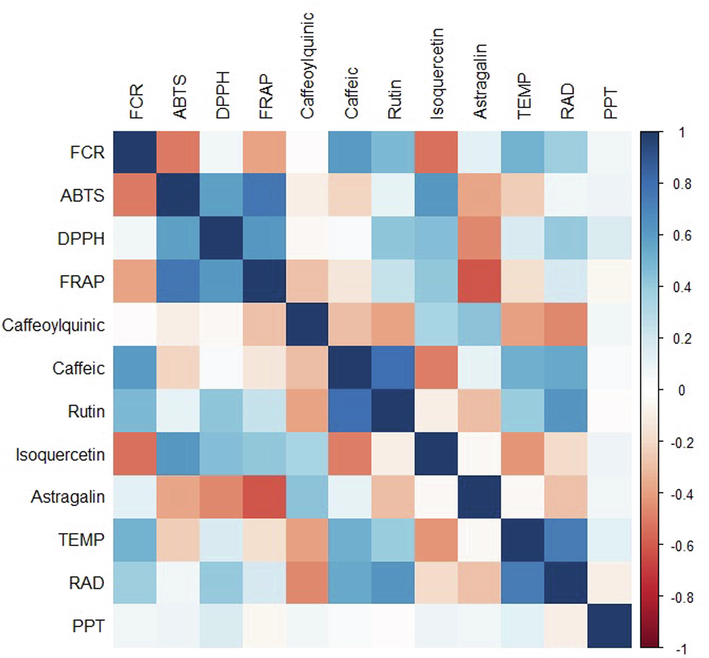
Correlation analysis among evaluated variables. TEMP (temperature), RAD (radiation) and PPT (precipitation).
3.2 Chemical markers
Studies suggest that chlorogenic acid and flavonoids such as quercetin, kaempferol, and their derivatives are widely present in leaves of M. oleifera (Nouman et al., 2016; Rodríguez-Pérez et al., 2015). Oldoni et al., (2021) isolated glycosylated flavonoids (isoquercitrin and astragalin) and phenolic acid (3-O-caffeoylquinic acid) from M. oleifera leaves by using bioguided monitoring and concluded that the compounds described above are largely responsible for antioxidant and antihyperglycemic activities.
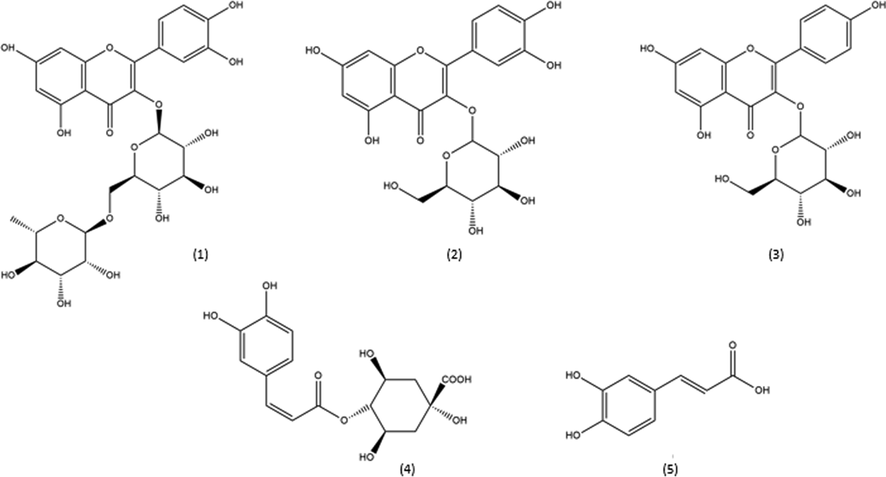
This study identified and quantified all samples analyzed for the compounds: caffeic acid and its derivative 3-O-caffeoylquinic acid, astragalin, rutin, and isoquercitrin (Fig. 2). It is essential to highlight that samples were cultivated in three distinct regions of Brazil over an entire year and collected in two stages of regrowth which suggests that these compounds can be considered chemical biomarkers of Brazilian M. oleifera mainly because they were widespread and closely related to antioxidant activity.
For a quantification study, five-point standard curves in solvent for each phenolic compound were plotted by relating peak area vs concentration of phenols. The calibration curves were linear from 1.25 to 25 mg/L and were obtained with R2 higher than 0.994 (Table 3). For solvent-based standards, LOD ranged from 0.006 to 0.132 mg/L while LOQ varied from 0.020 to 0.441 mg/L. All evaluated parameters were in accordance with the International Conference of Harmonization (ICH, 1998). LD: Limit of Detection. LQ: Limit of Quantification.
Compound
RT (min)
λmáx (nm)
Regression equation
R2
LD
(mg L-1)LQ
(mg L-1)
3-O-caffeoylquinic acid
8.92
325
y = 4.1595x + 0.0565
0.999
0.007
0.023
Caffeic acid
10.4
323
y = 2.5803x – 0.1004
0.999
0.132
0.441
Rutin
11.6
254–354
y = 2.3737x – 0.1039
0.994
0.006
0.021
Isoquercetrin
12.2
255–354
y = 1.6951x + 0.0203
0.999
0.006
0.020
Astragalin
13.2
263–346
y = 2.0353x + 0.0388
0.999
0.006
0.020
The results revealed a significant effect by seasonality, regrowth age, and region for all parameters evaluated (Fig. 3). From the results, regrowth age was the only factor that did not affect caffeic acid and astragalin. The cultivation area significantly influenced the content of chlorogenic acid, isoquercitrin, and astragalin ranging from 4.2 to 7.2 mg g−1, 8.0 to 10.7 mg g−1 and 2.2 to 3.8 mg g−1, respectively (Table 4). Samples grown in the south showed the highest values for the compounds described above. Data are expressed as mean ± standard deviation. Means followed by different letters vertically indicate significant difference, using the Tukey test (p ≤ 0.05).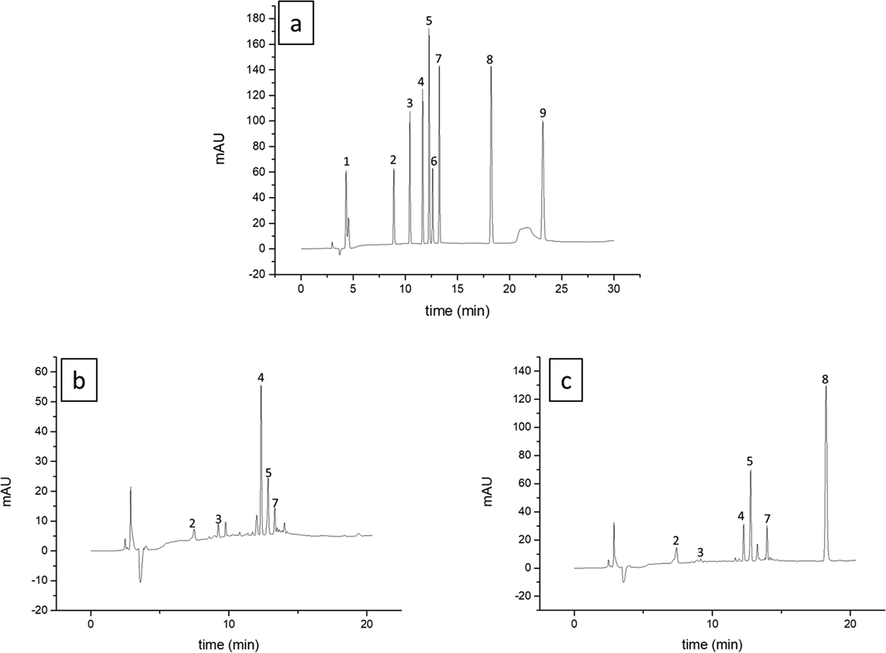
HPLC-DAD chromatogram of standard mixture at 25 μg mL−1 (a), young leaves harvested in summer from Northeast (b), young leaves harvested in winter from South (c) recorded at 270 nm. Gallic acid (1), caffeoylquinic acid (2), caffeic acid (3), rutin (4), isoquercetin (5), coumaric acid (6), astragalin (7), quercetin (8) and kaempferol (9).
Phenolic compounds individual (mg/g)
Factor
Caffeoylquinic acid
Caffeic acid
Rutin
Isoquercetin
Astragalin
Summer
5.83 ± 1.5 ab
2.43 ± 0.4 a
16.46 ± 4.8 a
7.96 ± 1.5b
3.40 ± 1.4 a
Autumn
5.44 ± 2.4b
2.01 ± 0.6b
13.54 ± 6.0b
6.12 ± 2.0c
3.13 ± 1.3b
Winter
6.09 ± 2.0 a
1.38 ± 0.8c
12.40 ± 5.3b
11.02 ± 2.4 a
2.35 ± 0.3c
Spring
4.54 ± 1.0c
1.49 ± 0.7c
13.56 ± 2.7b
10.87 ± 3.4 a
2.41 ± 0.6c
South
7.23 ± 1.7 a
1.16 ± 0.9b
8.55 ± 2.8b
10.67 ± 4.0 a
3.78 ± 1.3 a
Southeast
4.95 ± 1.2b
2.22 ± 0.3 a
17.22 ± 2.3 a
8.41 ± 2.2b
2.40 ± 0.4b
Northeast
4.19 ± 0.9c
2.05 ± 0.5 a
16.08 ± 4.1 a
8.02 ± 2.5b
2.24 ± 0.5b
Young
5.80 ± 1.9 a
1.85 ± 0.8 a
14.92 ± 4.8 a
10.15 ± 2.7 a
2.78 ± 0.6 a
Mature
5.11 ± 1.7b
1.78 ± 0.7 a
12.99 ± 5.0b
7.92 ± 3.3b
2.83 ± 1.4 a
From the triple interactions amongst seasonality, regrowth age, and region of cultivation (supplementary data), it is possible to conclude that young leaves cultivated in the south during autumn showed the highest content for chlorogenic acid (10.0 mg g−1) while mature leaves from the south harvested during the summer showed the highest content of astragalin (6.1 mg g−1). The isoquercitrin was quantified in the highest content in young (15.4 mg g−1), and mature (14.8 mg g−1) leaves grown during the spring in the south.
The content of flavonoid rutin and phenolic acid caffeic ranged from 8.5 to 17.2 and from 1.16 to 2.2 mg g−1, respectively among regions of cultivation. Samples grown in the south showed the lowest values, while samples from the southeast the highest. From triple interaction (supplementary data), it is possible to suggest that young leaves cultivated in the northeast during the summer showed the highest caffeic acid and rutin content (2.9 and 22 mg g−1, respectively).
The major components quantified in all samples were rutin, followed by isoquercitrin and chlorogenic acid (Table 4). The highest rutin content was determined in samples cultivated in the southeast and northeast (17.2 and 16 mg g−1 respectively), while isoquercetin and chlorogenic acid were determined at higher levels in samples from the south (10.7 and 7.23 mg g−1). Both compounds derivative of flavonoid quercetin (rutin and isoquercetin) showed good correlation with antioxidant activity evaluated by scavenging DPPH and ABTS methods and FRAP assay. Therefore, it is possible to suggest that leaves of M. oleifera rich in these compounds should present a great antioxidant potential.
Rutin and isoquercitrin are quercetin derivatives, and the significant structural difference is related to glycosylation. The isoquercitrin, also known as quercetin-3-glycoside (Fig. 2), has a molecule of glucose linked to carbon 3 of ring C. At the same time, quercetin 3-rutinoside, also known as rutin, has a disaccharide (rutinoside) attached to the same carbon. The astragalin is a derivative of kaempferol and has glucose linked to carbon 3 of ring C. The presence of glycoside improves the solubility of substances in an aqueous medium. The chlorogenic acid is an ester of caffeic acid, also known as 5-O-caffeoylquinic acid (5-CQA) (Fig. 2).
From correlation studies (Fig. 1), a positive correlation between radiation UV and temperature was observed with caffeic acid, rutin, phenolic compounds, and antioxidant assay from the DPPH method. Thus, days with higher temperatures and UV radiation (supplementary material) improved the biosynthesis of phenolic compounds with antioxidant potential. According to Kusano et al., (2011) and Pinto et al., (2022), some stressors, such as temperature, radiation, and drought, can induce changes in the metabolism of plants and alter the concentration of phytochemicals, especially those of specialized metabolism, mainly because during stress conditions, reactive oxygen species (ROS form). Thus, for example, ultraviolet radiation type B and C (UV-B and UV–C) affect specialized metabolism in different pathways such as in the synthesis of flavonoids and has been shown to play a key role in cellular protection.
High temperatures and radiation are directly correlated with caffeic acid, rutin, FCR and DPPH and inversely correlated with ABTS, caffeoylquinic acid and isoquercitrin levels. High solar radiation decreases astragalin levels. We can also observe that the higher the ABTS and DPPH contents, the higher the FRAP contents. Astragalin showed a strong and negative correlation with ABTS, DPPH and FRAP.
Besides isoquercitrin presenting a negative correlation with UV radiation, this compound showed a positive and significant correlation with ABTS, DPPH, and FRAPS methods. Thus, the glycosylated compound derivatives of quercetin could be considered the best biochemical markers of antioxidant activity from M. oleifera plants grown in Brazil. This information can be used to standardize extracts, which is a fundamental requirement of organizations and industries dealing with herbal products (Mandal et al., 2021).
The highest antioxidant activity obtained from the flavonoids rutin and isoquercitrin can be related to their chemical structures. According to Williams et al., (2004), the flavonol quercetin shows some features important in its structure that increase its antioxidant potential. The most important is the catechol or dihydroxylated B-ring followed by unsaturation in the C-ring and the presence of a 4-oxo function in the C ring. All the mentioned characteristics seem to increase the ability to chelate transition metal such as iron in the FRAP method.
Through multidimensional analysis, the PCA was performed, which identified two principal components (PC), being PC1 (33.4 %) and PC2 (27.3 %), which together explain 60.7 % of the total data variance (Fig. 4). The PCA model can be represented by the weight of each variable over its principal components. Initially, the chemical composition of M. oleifera leaf extracts contained 12 response variables. The calculation of the variance inflation factor (VIF) showed that 10 of these variables had a VIF lower than 10. Rutin and caffeic acid were the excluded response variables, as they presented VIF equal to 13 and 16. Therefore, these last 10 variables remained to compose the PCA model. The model equations for the first two principal components generated (Equations (1) and (2)) in our study were:
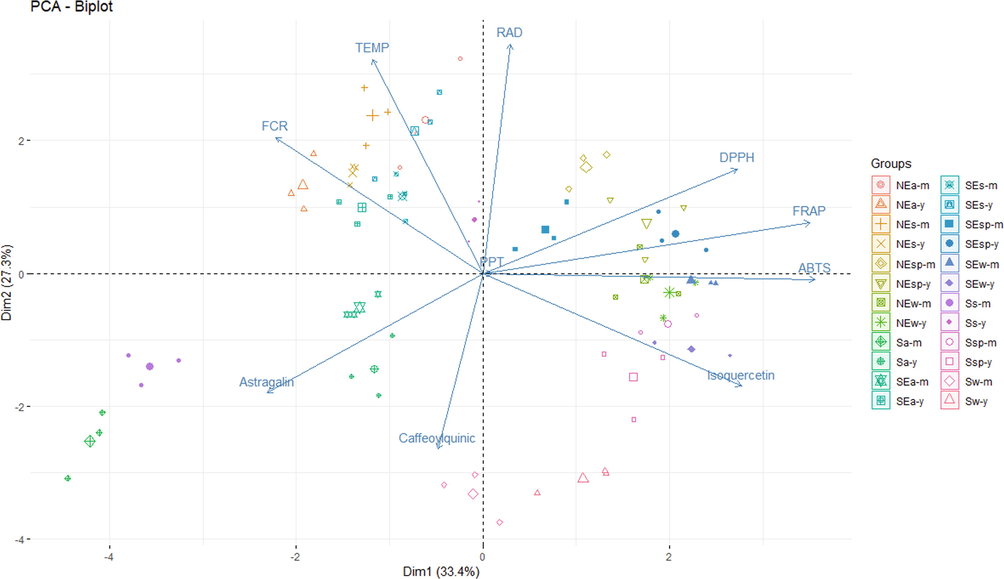
Clustering on a PCA-Biplot based on the variables evaluated. Capital letters: S (South), SE (Southeast), NE (Northeast).
It should be noted that through the models for the first principal component (Equation (1)), the two most important variables were ABTS and FRAP, followed by isoquercetin, DPPH, astragalin, and FCR. The second principal component showed that radiation and temperature were the two most important variables.
From PC1, it is possible to suggest that samples collected in the southeast and northeast during autumn and summer showed the highest content of FCR, which presented a positive correlation with temperature. Samples from the three regions harvested in spring and winter showed the highest values for antioxidant activity by scavenging DPPH and ABTS radicals and Fe reduction and was negatively correlated with higher temperature.
In addition to the PCA, several models were built that correlate the RGB color pattern with the analyzed attributes. Currently, machine learning (ML) methodologies are being widely used for pattern recognition in various types of matrices. Using ML algorithms, it is possible to predict titers of markers with antioxidant activity in M. oleifera leaves. Thus, six models were generated: one for ABTS (Fig. 5) and another five for molecular biomarkers of M. oleifera leaves. The latter were: astragalin, rutin, caffeic acid, and caffeoylquinic acid (Figs. 5 to 7).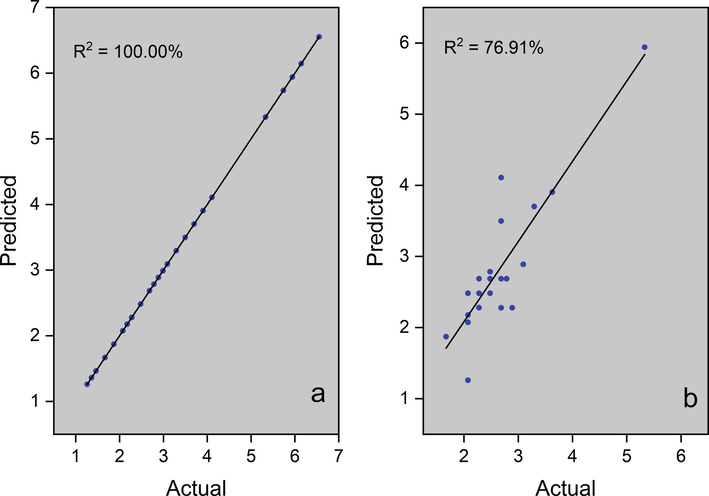
Models plot for prediction of ABTS (µmol TEAC g−1). (a) Model – training data set, (b) Model – supplied test set.
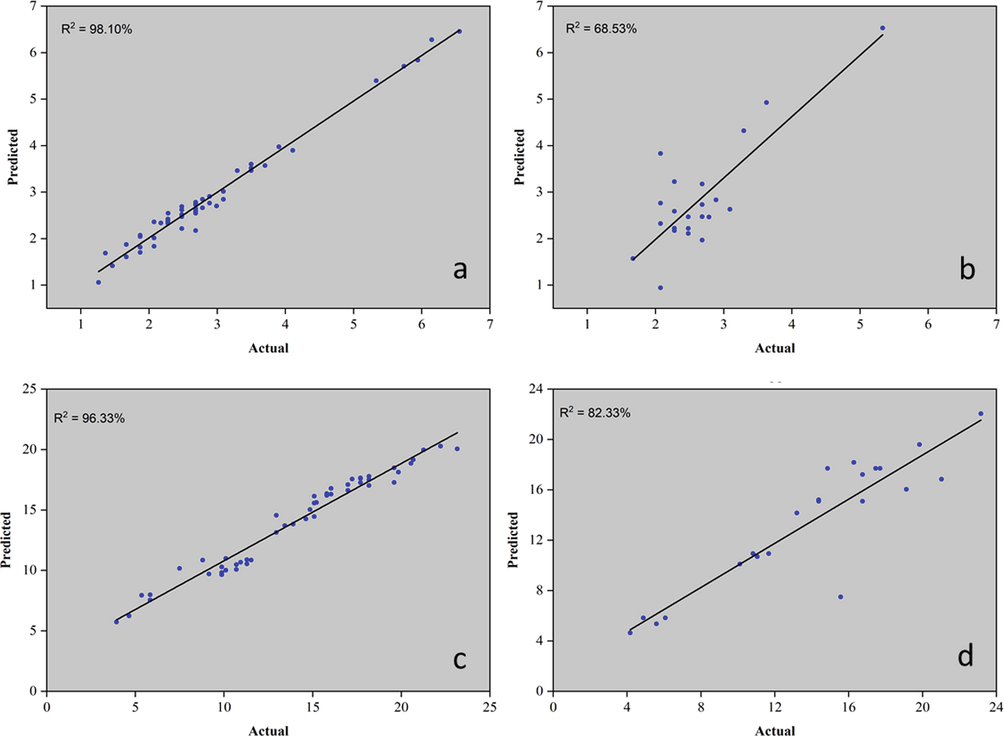
Models plot for prediction of astragalin (mg/g). (a) Model – training data set, (b) Model – supplied test set; and rutin (mg/g), (c) Model – training data set, (d) Model – supplied test set titers..
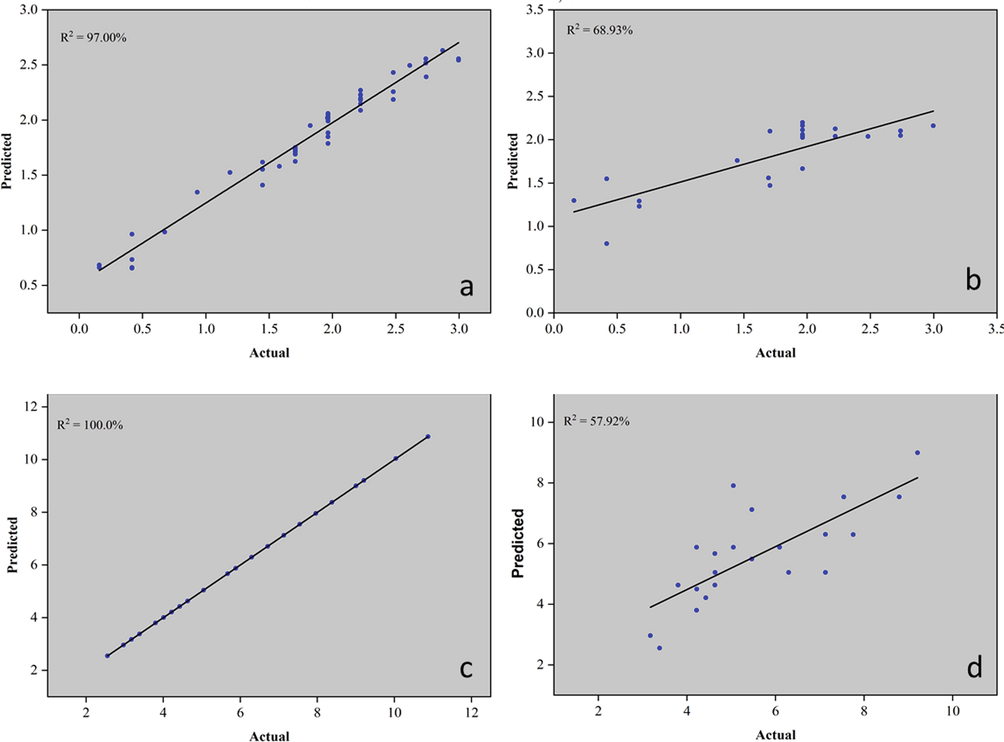
Models plot for prediction of caffeic acid (mg/g). (a) Model – training data set, (b) Model – supplied test set; and caffeoylquinic acid (mg/g), (c) Model – training data set, (d) Model – supplied test set titers.
ML models are generated from original data from each experiment. First was, a correlation analysis between the predictor variables (grayscale of the RGB channels) and the response variable. Models with a correlation coefficient above 70 % were selected to compose this article. The models were generated as follows: the initial dataset is divided into two parts. One part consists of 70 % of the original data and was used to create the model. The other 30 % of the data was used for external validation of the models. Finally, the quality of the model was evaluated by Pearson's correlation coefficient (r) and by the coefficient of determination (R2), which was calculated for each model. In this article, three models that presented adequate correlation coefficients were presented. Models of astragalin, caffeic acid, and caffeoylquinic acid were conducted and shown.
Three models were generated: cross-validation, training data set, and supplied test set, but only the last two were presented in this article. The algorithms used to create the models were K- Nearest Neighbors (KNN) to ABTS, caffeoylquinic acid, and rutin. The PLS algorithm was used for astragalin and random forest for caffeic acid. When the training set was used with 70 % of the samples, the coefficient of determination was above 96 % and when the data was used to validate the models, R2 was above 57 %. ABTS and rutin analysis were the best models. These last two presented a coefficient of determination above 75 %. Color patterns using the ABTS method can measure antioxidant activity in M. oleifera leaves. As a molecular biomarker, rutin can also be used in models that correlate the RGB pattern with titers of this compound.
4 Conclusion
The cultivation region, age of regrowth and seasonality were essential to differentiate between samples of M. oleifera leaves. The results obtained in this study are compelling evidence that Moringa leaves are a source of caffeic acid and their derivatives and glycosylated flavonoids, mainly isoquercitrin and rutin, which show high antioxidant potential and can be considered good biochemical markers in M. oleifera leaves. From PCA, the south region showed the highest levels of astragalin in autumn and summer. Moringa leaves showed the highest levels of ABTS, DPPH, and FRAP in plants grown in the northeast and southeast regions and the highest levels of biochemical markers rutin, astragalin, and caffeic acid in the summer. Using ML algorithms, it was possible to predict titers of biochemical markers with antioxidant activity in M. oleifera leaves. These results are essential to improve the development and production of this plant species, which in the future can be used as a source of nutrients in human diets.
Funding
This research did not receive any specific grant from funding agencies in the public, commercial, or not-for-profit sectors.
6 Authors’ contributions
TLCO: contributed in supervision, project administration, conceptualization, formal analysis, writing – original draft. SS: contributed in methodology, visualization, investigation. MLMD: contributed in analysis of the data and drafted the paper. LHIP: contributed in methodology and analysis of the data. VAL: contributed in formal analysis, in building and discussions of the models. All the authors have read the final manuscript and approved the submission.
Acknowledgement
This work was supported by Federal Technological University of Paraná (UTFPR), Central de Análises (UTFPR) and CAPES.
Declaration of Competing Interest
The authors declare that they have no known competing financial interests or personal relationships that could have appeared to influence the work reported in this paper.
References
- Köppen’s climate classification map for Brazil. Meteorol. Z.. 2013;22:711-728.
- [CrossRef] [Google Scholar]
- The Ferric Reducing Ability of Plasma (FRAP) as a Measure of ‘“ Antioxidant Power ”’: The FRAP Assay. Anal. Biochem.. 1996;239:70-76.
- [Google Scholar]
- Use of a Free Radical Method to Evaluate Antioxidant Activity. Leb. Technol.. 1995;28:25-30.
- [Google Scholar]
- Nutritional and phenolic characterization of Moringa oleifera leaves grown in Sinaloa. México. Pakistan J. Bot.. 2017;49:161-168.
- [Google Scholar]
- Screening of antimicrobial synergism between phenolic acids derivatives and UV-A light radiation. J. Photochem. Photobiol. B Biol.. 2021;214
- [CrossRef] [Google Scholar]
- Medicinal plants in Brazil: Pharmacological studies, drug discovery, challenges and perspectives. Pharmacol. Res.. 2016;112:4-29.
- [CrossRef] [Google Scholar]
- Isolation and characterization of Moringa oleifera L. flower protein and utilization in functional foods bars. Food Sci. Technol.. 2021;41:643-652.
- [CrossRef] [Google Scholar]
- Prediction of Antioxidant Activity of Cherry Fruits from UAS Multispectral Imagery Using Machine Learning. Antioxidants.. 2020;9:156.
- [Google Scholar]
- Nutraceutical or Pharmacological Potential of Moringa oleifera Lam. Nutrients. 2018;10:1-12.
- [CrossRef] [Google Scholar]
- Metabolomics reveals comprehensive reprogramming involving two independent metabolic responses of Arabidopsis to UV-B light. Plant J.. 2011;67:354-369.
- [CrossRef] [Google Scholar]
- Ultrasonic-assisted extraction for flavonoid compounds content and antioxidant activities of India Moringa oleifera L. leaves: Simultaneous optimization, HPLC characterization and comparison with other methods. J. Appl. Res. Med. Aromat. Plants. 2021;20
- [CrossRef] [Google Scholar]
- Alternative protein from Pereskia aculeata Miller leaf mucilage: technological potential as an emulsifier and fat replacement in processed mortadella meat. Eur. Food Res. Technol.. 2021;247:851-863.
- [CrossRef] [Google Scholar]
- Evaluation of phytochemical and medicinal properties of Moringa (Moringa oleifera) as a potential functional food. South African J. Bot.. 2018;129:40-46.
- [CrossRef] [Google Scholar]
- Herbal biomolecules in Healthcare applications (1st ed.). Elsevier; 2021.
- Effects of age and extraction solvent on phytochemical content and antioxidant activity of fresh Moringa oleifera L. leaves. Food Sci. Nutr.. 2018;6:2188-2198.
- [CrossRef] [Google Scholar]
- Profiling of polyphenolics, nutrients and antioxidant potential of germplasm’s leaves from seven cultivars of Moringa oleifera Lam. Ind. Crops Prod.. 2016;83:166-176.
- [CrossRef] [Google Scholar]
- Bioguided extraction of phenolic compounds and UHPLC-ESI-Q-TOF-MS/MS characterization of extracts of Moringa oleifera leaves collected in Brazil. Food Res. Int.. 2019;125
- [CrossRef] [Google Scholar]
- Antihyperglycemic activity of crude extract and isolation of phenolic compounds with antioxidant activity from Moringa oleifera Lam. leaves grown in Southern Brazil. Food Res. Int.. 2021;141:1-12.
- [CrossRef] [Google Scholar]
- Phenolic compounds are dependent on cultivation conditions in face of UV-C radiation in ‘Concord’ grape juices (Vitis labrusca) Lwt. 2022;154
- [CrossRef] [Google Scholar]
- Standardized methods for the determination of antioxidant capacity and phenolics in foods and dietary supplements. J Agri Food Chem.. 2005;53:4290-4302.
- [Google Scholar]
- Antioxidant activity applying an improved ABTS radical cation decolorization assay. Free Radic. Biol. Med.. 1999;26:1231-1237.
- [Google Scholar]
- Optimization of extraction method to obtain a phenolic compounds-rich extract from Moringa oleifera Lam leaves. Ind. Crops Prod.. 2015;66:246-254.
- [CrossRef] [Google Scholar]
- A Comparative HPLC Analysis of Myricetin, Quercetin and Kaempferol Flavonoids Isolated From Gambian and Indian Moringa oleifera Leaves. Int. J. Chem.. 2018;10:28-37.
- [CrossRef] [Google Scholar]
- Analysis of total phenols and other oxidation substrates and antioxidants by means of folin-ciocalteu reagent. Methods Enzymol.. 1999;299:152-178.
- [Google Scholar]
- Critical analysis of current methods for assessing the in vitro antioxidant and antibacterial activity of plant extracts. Food Chem.. 2015;172:814-822.
- [CrossRef] [Google Scholar]
- Flavonoids: Antioxidants or signalling molecules? Free Radic. Biol. Med.. 2004;36:838-849.
- [CrossRef] [Google Scholar]
- The effect of Moringa oleifera polysaccharides on the regulation of glucocorticoid-induced femoral head necrosis: In vitro and in vivo. Arab. J. Chem.. 2022;15
- [CrossRef] [Google Scholar]
Appendix A
Supplementary data
Supplementary data to this article can be found online at https://doi.org/10.1016/j.arabjc.2022.104206.
Appendix A
Supplementary data
The following are the Supplementary data to this article:Supplementary data 1
Supplementary data 1


