

Translate this page into:
Discovery of quality markers for Mailuoshutong Pill based on “spider web” mode of “Content-Pharmacokinetics-Pharmacology” network
⁎Corresponding authors at: Department of Pharmacy, The First Affiliated Hospital of Zhengzhou University, Zhengzhou, Henan 450000, China. sunzhi2013@163.com (Zhi Sun), zhangxiaojian_yxb@163.com (Xiaojian Zhang), dushuzhang911@163.com (Shuzhang Du)
-
Received: ,
Accepted: ,
This article was originally published by Elsevier and was migrated to Scientific Scholar after the change of Publisher.
Abstract
Mailuoshutong pill (MLSTP) is a traditional Chinese medicine compound preparation used for the treatment of thromboangiitis obliterans. However, component responsible for those effects are not yet identified, nor with their accurate contents and in-vivo movement, which means the quality markers of MLSTP are still unknown. The aim of this study was to discovery quality markers of MLSTP by developing a new multi-dimensional network strategy based on “Content-Pharmacokinetics-Pharmacology”. 40 analytes were determined by UHPLC-MS/MS in 8 min and the average contents in 11 batches of commercial MLSTP samples were used as the content dimension, the pharmacokinetics and pharmacology dimension were evaluated by five variables based on ADME Prediction and Prediction of Activity Spectra. Each dimension of the characteristic network was quantified by multivariate statistical analysis, and a three-dimensional network was constructed. Finally, Liquiritin, Calycosin-7-glucoside and Albiflorin with larger regression area were preferred as quality markers of MLSTP, which had satisfactory comprehensive properties of content, pharmacokinetic properties and pharmacological activity. In summary, the potential quality markers of MLSTP were identified by multi-dimensional characteristic network of content, pharmacokinetics and pharmacology. Also, the new strategy established in this work provided a valuable perspective for the selection of quality control indicators from compound formula.
Keywords
Quantitative analysis
Quality markers
“spider-web” mode
Mailuoshutong Pill

1 Introduction
Traditional Chinese Medicine (TCM) refers to a unique treatment system formed on the basis of more than 2000 years of accumulated knowledge and practice of Chinese medicine, which still plays an important role in today's medical and health care (Wang et al., 2018, Xu et al., 2019). As a clinically effective TCM preparation, Mailuoshutong Pill (MLSTP) is commonly used for the superficial thrombophlebitis caused by damp-heat stasis of the vein, and swelling and pain of lower limbs caused by non-acute deep venous thrombosis (Li et al., 2018). The composition of the drug is complex, composed of 9 kinds of plant drugs and 3 kinds of animal medicine. Astragali Radix and Lonicerae Japonicae Flos are the emperor medicines, while Phellodendri Chinrnsis Cortex, Atractylodis Rhizoma, Coicis Semen, Scrophulariae Radix, Angelicae Sinensis Radix, Paeoniae Radix Alba, Glycyrrhizae Radix Et Rhizoma are minister medicines, Hirudo, Scolopendra and Scorpio are adjuvants (Chu et al., 2022). Based on our previous research, more than 100 substances were identified using current pharmaceutical analysis methods. Many of these components have been experimentally proved to have the role of regulating lipid metabolism, and have different biological activities such as anti-inflammatory, antiviral, antioxidant, anti-cancer, liver protection and so on (Yu et al., 2019, Xin et al., 2020, Deng et al., 2021). However, there is no research on the ingredients of MLSTP, and there is an urgent need to investigate the quality and composition of MLSTP.
With the gradual transformation of TCM into modern medical treatment, quality control has become an issue that cannot be ignored (Zhang et al., 2018), especially for compound preparations of TCM with complex components, such as MLSTP. In order to improve the quality of TCM, Academician Liu Changxiao proposed a new concept of TCM quality marker (Q-marker) based on the quality evaluation methods and existing problems in 2016, which is closely related to the functional properties and capable of qualitative and quantitative analysis (Liu et al., 2018). Q-marker is defined as a chemical substance inherent in Chinese herbal medicine and TCM products or formed during processing and preparation, which is closely related to the functional properties of Chinese medicine, as a marker to reflect the safety and efficacy of TCM, which is the material basis of medicinal properties and a quantitative and qualitative evaluation method (Yang et al., 2017). In recent years, many experts have systematically studied Q-marker from different perspectives, resulting in a variety of strategies. The “spider web” model was established by three dimensions of content, stability and activity, and candidate compounds with large regression area were preferred as Q-marker (Zhang et al., 2020a, 2020b), and the importance index was used to filter out redundant components, thus focusing on the key indicators of quality control. A pharmacokinetic/pharmacokinomic-pharmacodynamics combined network strategy was applied to the Q-marker discovery of Baoyuan Decoction (Du et al., 2021), which can fully explore the interaction between two complex systems of TCM and human body, and their integration is an effective tool to understand the relationship between drug exposure and drug effect. In this study, we developed a new strategy by combining the advantages of both strategies, constructing a multi-dimensional network based on “Content-Pharmacokinetics-Pharmacology”. According to the review of literature, it was found that a variety of ingredients have biological activities, and 40 compounds were selected as candidate substance of Q-marker on account of the pharmacological activity.
In this study, TSQ-Altis Mass Spectrometer platform was adopted to achieve the collective rapid detection of 40 components, and the quality evaluation and analysis of 11 batches of samples in 8 min were carried out. The average content was applied to the content dimension, and the components with high bioavailability and drug-like properties were defined as high pharmacokinetic dimension values according to the ADME (Absorption, Distribution, Metabolism and Excretion) prediction collected from the Traditional Chinese Medicine Systems Pharmacology Database and Analysis Platform (TCMSP). anti-inflammatory, antithrombotic and vascular protection activities are selected as pharmacological dimensions, considering that inflammatory response, vascular injury and thrombosis are closely related to thromboangiitis obliterans, and the data were obtained from the Prediction of Activity Spectra for Substances (PASS). Finally, the compounds with larger area of the “spider-web” formed by the content, pharmacokinetics and pharmacology were selected as the preferential Q-markers of MLSTP. In general, this strategy, as can be seen in Fig. 1, combined the traditional quantitative method with the natural product activity prediction method, which not only determined the content of each substance in MLSTP and provided a basis for its quality control, but also provided some new ideas for the identification of Q-markers in other TCM prescriptions.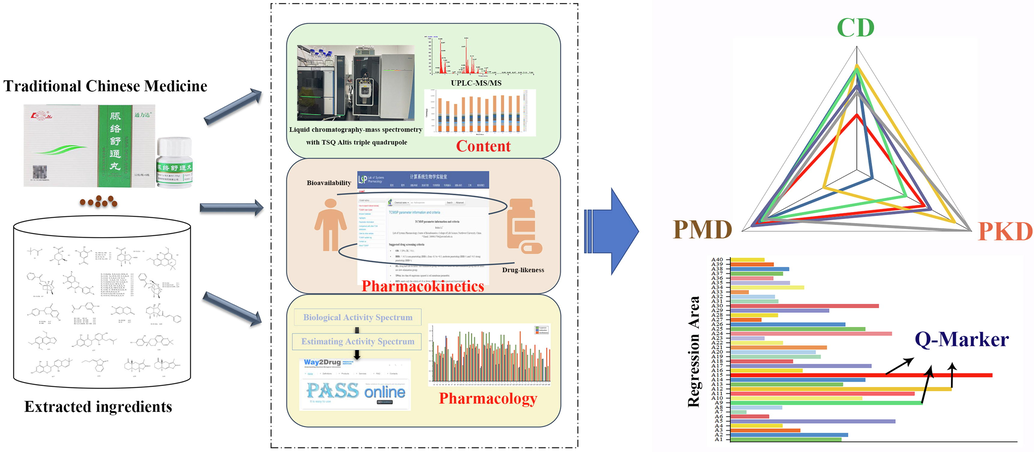
Schematic diagram for identifying potential Q-markers of MLSTP based on three-dimensional characteristic network.
2 Materials and methods
2.1 Reagents and chemicals
Umbelliferone, Quinic acid, Ferulic Acid, Atractylenolide I, Atractylenolide II, Benzoylpaeoniflorin, Ononin, Cosmosiin, Daidzein, Scopoletin, 4-Hydroxycinnamic acid, Liquiritin, Liquiritigenin, Licoisoflavone A, Licoisoflavone B, Ligustilide, Glabridin, Harpagoside, Baicalin, Hyperoside, Rutin, Magnoflorine, Loganic acid, Formononetin, Calycosin, Calycosin-7-glucoside, Gallic acid, Methyl gallate, Galloylpaeoniflorin, Cymaroside, Paeoniflorin, Albiflorin, Betaine, Rhoifolin, Isoliquiritigenin, Protocatechualdehyde, Protocatechuic acid, Astragalin were obtained from Chengdu Mansite Biological Technology Company ltd (Sichuan, China), Skimmianin, Ethyl caffeate were purchased from Chengdu Aifa Biological Technology Company ltd (Sichuan, China). A total of 40 standard products were used in the study, all with a purity greater than 98 % by HPLC method, whose structures were shown in Fig. 2. 11 batches of MLSTP were purchased from Lunan Houpu Pharmaceutical Company ltd (Shandong, China).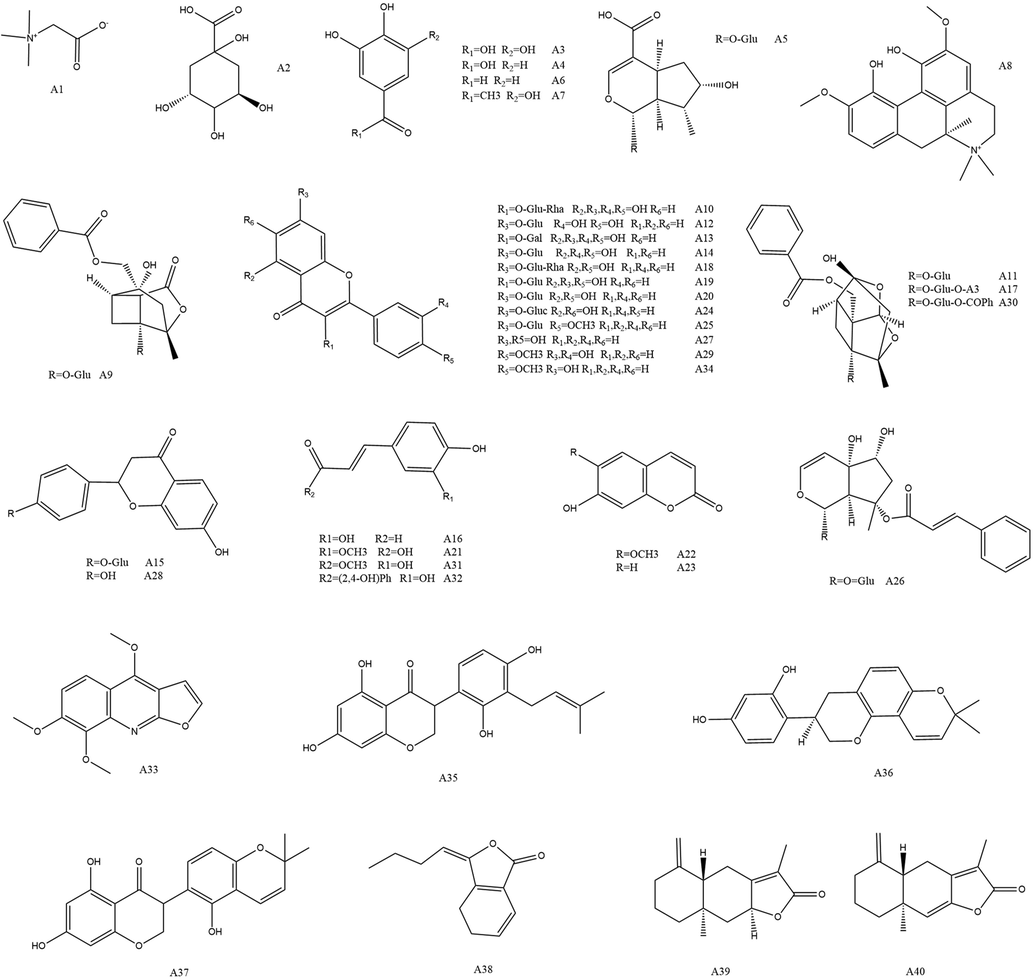
Chemical structures of 40 bioactive compounds in MLSTP. The compounds of A1–A40 were listed in Table 1.
Methanol and acetonitrile were of HPLC grade from Fisher Scientific (Pittsburgh, Pennsylvania, USA). Formic acid was of spectroscopic grade from Aladdin Industrial Company ltd. (Shanghai, China), and purified water was from Hangzhou Wahaha Group Company ltd. (Hangzhou, China).
2.2 Ultra-performance liquid chromatography with mass spectrometry analysis
A UHPLC Dionex Ultimate 3000 system (Thermo Scientific, San Jose, USA) and TSQ-Altis mass spectrometer (Thermo Scientific, San Jose, USA) were operated for LC-MS/MS analysis. The samples were separated on Waters ACQUITY UPLC® C18 column (2.1 mm × 50 mm, 1.7 μm), the temperature was set at 40 °C. The mobile phases, consisting of water containing 0.1 % (v/v) formic acid (A) and acetonitrile (B) with an optimized gradient program as follows: 0–0.5 min, 5 % B; 0.5–3.5 min, 5–100 % B; 3.5–6.0 min, 100 % B; 6.0–6.2 min, 100–5 % B; 6.2–8.0 min, 5 % B. The flow rate was set at 0.20 mL/min, the auto-sampler was conditioned at 10 °C and the injection volume was 3 μL for every analysis.
A heated electrospray ionization (HESI) source was equipped with TSQ-Altis Triple series quadrupole mass spectrometer, and a selective reaction monitoring mode was applied for the data analysis. The parameters of optimized mass spectrometry were as follows: the spray voltage: 3500 V for positive ion or 2500 V for negative ion; the sheath gas pressure: 40 arb; the aux gas pressure:10 arb; the sweep gas pressure: 0 arb; Ion Transfer Tube Temp (°C): 325 °C; Vaporizer Temp (°C): 275 °C; Cycle Time (sec): 0.8; Q1 Resolution (FWHM): 0.2; Q3 Resolution (FWHM): 0.7; CID Gas (mTorr): 1.5; Chromatographic Peak Width (sec): 6. All the data acquired would be processed by Thermo Trace Finder 4.1 General Quan (Thermo Scientific, San Jose, USA).
2.3 Standard solution and sample solution preparation
The candidate compounds 10 mg, 1 mg and 0.1 mg were accurately weighed respectively, and dissolved in 50 % methanol aqueous solution to make the original solution (1 mg/mL, 0.1 mg/mL, 0.01 mg/mL). Then, 40 parts of the original solution were diluted with 50 % methanol aqueous solution to obtain the final mixed standard solution.
11 batches of MLSTP samples were ground respectively, and the powder (0.5 g) was weighed and dispersed in 40 mL 50 % methanol aqueous solution (v/v), and ultrasonically extracted (100 W, 40 kHz) at room temperature for 30 min. After that, an appropriate amount was taken and centrifuged at 13,000 rpm for 10 min. Supernatant was injected into UHPLC instrument for analysis.
2.4 Method validation for multi-compounds in MLSTP
The calibration curves were constructed using a linear least squares regression model with the peak-area ratio of five gradient analytes and the corresponding concentrations. For each target component, LODs (Limit of detection) and LOQs (Limit of quantitation) were determined at signal to noise ratios (S/N) of 3 and 10 by continuous dilution of standard solutions. Six repeated tests were conducted on the same day and three consecutive days with Intra-day and Inter-day variations as precision indexes. The change in peak area is expressed as a percentage of RSD (relative standard deviation). Six samples prepared by the same method were analyzed to demonstrate the repeatability of the method. The stability experiment was carried out by analyzing the mixed standard for six times under different conditions (Mixed standards after 12 h, 24 h at room temperature, 12 h, 24 h in the injector, 20 days at −80°Celsius, and three repeated freeze-thaws at −80°Celsius, respectively). The recovery rate was verified by adding the reference solution to MLSTP samples (S1) with known concentration levels at six replicates. The calculation formula of recovery was as follows:
2.5 Content dimension of Q-markers
Quantitative data from all samples will be processed through Thermo Xcalibur 3.0 and Thermo TraceFinder 4.1 (Thermo Scientific, San Jose, USA). To construct the “spider-web” mode, the content measurements of 40 compounds were used to construct the content dimensions. In order to maximize the value obtained by the most stable substance between 0 and 1, the results are calculated by the following formula.
, the different compound; , the different batches; , the contents of substance in batch ; , the average content of the compound in eleven batches; , the value of the different compound about content dimension.
2.6 Pharmacokinetics dimension of Q-markers
The pharmacokinetics dimension score of each compound was evaluated by oral bioavailability (OB) and drug-likeness (DL). Data were collected from the TCMSP according to the substance CAS number. The general drug screening criteria is OB ≥ 0.2 and DL ≥ 0.1. In order to make Q-Markers conform to the screening rules and have improved ADME properties and similar pharmacological functions, the score is calculated by the following formula.
, the normalized value of the different compound about pharmacology dimension; , the OB value of substance ; , the DL value of substance .
2.7 Pharmacology dimension of Q-markers
The pharmacology dimension score of each compound was evaluated by three aspects on anti-inflammatory, vasoprotector and anti-thrombotic. All the activity data were obtained from the PASS. According to the structure and activity relationship of the compounds, the Leave-one-out cross-validation (LOO CV) procedure was performed to estimate the probability of the compounds being active compounds. The score maximizes the probability of being active (Pa).
, the normalized value of the different compound about pharmacology dimension;
2.8 The ‘Spider-web’ mode of Q-markers
The“Content-Pharmacokinetics-Pharmacology” dimension of MLSTP candidate compounds was integrated to construct a multi-dimensional network for searching Q-markers.
, the perimeter of the triangle made up of , and ; , the area of the triangle formed by , and .
3 Results and discussion
3.1 Optimization of liquid chromatography and mass spectrometry
In this study, a variety of mobile phase conditions, including methanol, acetonitrile, water, and formic acid at different concentrations, were tried for better separation, shorter chromatographic retention time, and higher sensitivity. The optimum peak shape was obtained by elution of acetonitrile (B), water and 0.1 % formic acid (A). Compared with methanol, acetonitrile has higher intensity and lower background noise; Formic acid was added to the mobile phase to improve the separation of chromatography and prevent peak trailing. The peak shape was improved and the response intensity was enhanced by changing the gradient elution. Finally, the rapid separation of 40 components was obtained by the combination of different gradient elution and mobile phase.
In the SRM mode, the precursor ion pair is used for quantitative analysis, and other MS parameters, including precursor ion-product ion pair, collision energy and polarity, were all optimized for maximum response and summarized in Table 1. Meanwhile, to avoid the mutual interference of individual components, SRM mode was used and the MS parameters such as precursor ion-product ion pair, collision energy, and polarity were optimized by manual tuning for the maximum response, as shown in Table 1. For the particular isomers, Liquiritigenin and Isoliquiritigenin will both peak in the corresponding detection channels, and the different product ion pairs were selected for the strongest respective responses and differentiated them according to the retention times of the peaks.
No.
Compound
Retention Time (min)
Polarity
Precursor (m/z)
Product (m/z)
Collision Energy (V)
A1
Betaine
0.65
Positive
118.09
58.07
25.98
A2
Quinic acid
0.66
Negative
191.05
85.05
21.55
A3
Gallic acid
1.01
Negative
168.99
124.99
15.03
A4
Protocatechuic acid
1.66
Negative
152.99
109.00
14.52
A5
Loganic acid
2.38
Negative
375.20
213.13
15.87
A6
Protocatechualdehyde
2.47
Negative
137.01
108.00
23.96
A7
Methyl gallate
2.57
Negative
183.01
123.99
21.09
A8
Magnoflorine
2.69
Positive
342.19
297.14
17.76
A9
Albiflorin
2.74
Positive
481.20
197.13
10.81
A10
Rutin
2.76
Negative
609.13
299.99
37.35
A11
Paeoniflorin
2.78
Negative
479.16
449.21
7.86
A12
Calycosin-7-glucoside
2.82
Positive
447.11
285.13
16.25
A13
Hyperoside
2.83
Negative
463.05
299.97
27.28
A14
Cynaroside
2.83
Negative
447.07
284.99
27.03
A15
Liquiritin
2.86
Negative
417.07
254.99
19.95
A16
Coumaric acid
2.87
Negative
163.03
119.00
14.31
A17
Galloylpaeoniflorin
2.90
Negative
631.16
613.13
23.79
A18
Rhoifolin
2.90
Negative
577.16
269.11
36.97
A19
Astragalin
2.91
Negative
447.09
255.04
40.38
A20
Cosmosiin
2.94
Negative
431.07
267.99
34.61
A21
Ferulic acid
2.96
Negative
193.03
178.04
13.13
A22
Scopoletin
2.97
Positive
193.05
122.04
28.00
A23
Umbelliferone
2.99
Negative
161.01
77.10
26.65
A24
Baicalin
3.09
Negative
444.98
268.99
21.39
A25
Ononin
3.14
Positive
431.11
269.13
16.37
A26
Harpagoside
3.20
Negative
493.20
345.07
10.10
A27
Daidzein
3.21
Negative
253.04
208.07
30.78
A28
Liquiritigenin
3.24
Negative
255.06
119.00
24.97
A29
Calycosin
3.27
Positive
285.11
270.05
22.02
A30
Benzoylpaeoniflorin
3.33
Negative
583.20
553.24
9.30
A31
Ethyl caffeate
3.41
Negative
207.05
134.99
22.19
A32
Isoliquiritigenin
3.53
Negative
255.06
134.96
15.95
A33
Skimmianin
3.55
Positive
260.11
227.05
21.81
A34
Formononetin
3.62
Positive
269.10
197.13
37.94
A35
Licoisoflavone A
3.93
Negative
353.10
285.14
22.44
A36
Glabridin
4.13
Negative
323.13
201.07
23.32
A37
Licoisoflavone B
4.19
Negative
351.09
283.00
24.50
A38
Ligustilide
4.27
Positive
191.10
173.16
14.56
A39
Atractylenolide II
4.35
Positive
233.16
151.13
14.86
A40
Atractylenolide I
4.57
Positive
231.16
185.21
18.40
3.2 Validation of the analytical method
Chromatograms of the mixed standard solution are shown in Fig. 3. It can be seen from the chromatogram that 40 kinds of substances have good peak shapes and no endogenous interference, indicating that the method is suitable. The linear regression equations, correlation coefficients, linear ranges, and LOD and LOQ of the 40 target components were all listed in Table 2. The correlation coefficients (R2) of the analytes ranged from 0.995 6 to 0.999 9, indicating good linearity; the LODs and LOQs of 40 analytes are in the range of 0.009 4 to 9.014 and 0.031 2 to 30.05, respectively, indicating that the method has high sensitivity. The test results of precision, repeatability, stability and recovery of the analyzable substances are summarized in Table 2 and Table S1. The intra-day precision, intra-day precision, repeatability and stability (RSD%) of all the analytes were all less than 12 %. The results showed that the method was reproducible and accurate for the determination of analytes. Six repeated extraction recovery values were measured in QC samples, all of which were in the range of 90.3 % to 109.3 % (RSD: 2.3 % to 11.0 %), indicating that no significant loss of analyte occurred during the analysis. The method meets the requirements and quantifies 40 analytes over a wide range, and the accurate quantification of these substances can help researchers better understand MLSTP and facilitate research on its quality control. The newly developed method allows multiple analytes to be measured in a single run with continuous rapid determination and, unlike traditional UPLC methods, accurate separation of substances with similar polarity based on different ion pairs, making it more applicable and desirable for high-volume detection.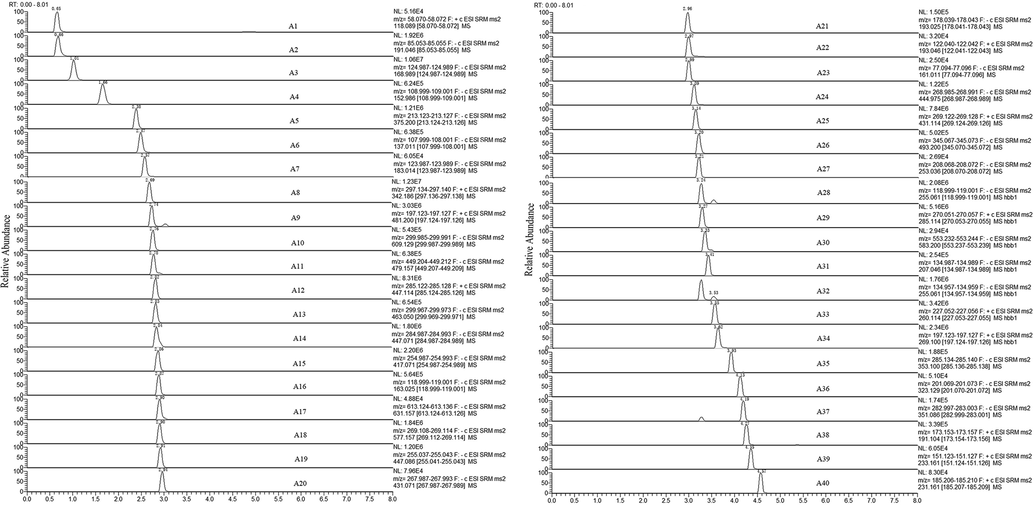
UHPLC-MS chromatograms of 40 bioactive compounds in MLSTP.
Compound
Regression equation
R2
Linear range
(ng/mL)
LOD (ng/mL)
LOQ
(ng/mL)
Precision (RSD%)
Stability
(RSD%)
Repeatability
(RSD%)
Intra-day
Inter-day
A1
y = 2.00e7x + 2.00e6
0.9987
54.7 ∼ 3.50e3
0.0238
0.0795
2.4
2.2
2.4
2.4
A2
y = 3.26e5x – 5.99e4
0.9982
547 ∼ 3.50e4
3.2423
10.8078
1.8
1.3
3.0
3.0
A3
y = 2.00e6x + 4.78e5
0.9996
0.781 ∼ 50.0
0.0094
0.0312
4.1
2.2
3.2
3.2
A4
y = 3.00e6x – 9.50e3
0.9993
21.9 ∼ 1.40e3
0.2369
0.7897
5.3
3.7
5.1
3.2
A5
y = 2.89e5x + 1.53e5
0.9968
125 ∼ 8.00e3
0.2677
0.8922
8.5
8.7
7.5
7.4
A6
y = 2.00e6x + 1.12e5
0.9967
39.1 ∼ 2.50e3
0.0969
0.3231
7.8
7.7
7.2
8.0
A7
y = 1.00e7x – 4.87e3
0.9996
15.6 ∼ 1.00e3
0.0819
0.2732
1.4
1.6
2.5
5.0
A8
y = 8.00e6x + 6.00e6
0.9964
130 ∼ 8.30e3
0.0230
0.0766
3.7
7.7
7.9
8.6
A9
y = 4.75e5x + 1.04e5
0.9992
500 ∼ 3.20e4
1.271
4.237
3.2
7.8
9.0
9.2
A10
y = 2.00e6x – 4.27e4
0.9956
26.6 ∼ 1.70e3
0.0960
0.3200
2.8
3.7
2.8
2.4
A11
y = 1.19e5x + 6.44e4
0.9974
547 ∼ 3.50e4
2.139
7.130
5.8
2.5
5.5
7.9
A12
y = 6.00e6x – 1.15e5
0.9989
43.8 ∼ 2.80e3
0.0189
0.0631
6.1
7.4
8.6
6.2
A13
y = 7.00e6x – 7.75e3
0.9971
7.81 ∼ 500
0.0185
0.0617
9.3
4.9
6.9
6.2
A14
y = 6.00e6x + 1.41e5
0.9966
31.3 ∼ 2.00e3
0.1671
0.5570
8.4
8.4
9.8
9.2
A15
y = 3.00e6x + 5.66e4
0.9989
54.7 ∼ 3.50e3
0.0712
0.2375
7.6
1.8
2.3
1.9
A16
y = 6.00e6x + 7.38e4
0.9957
7.81 ∼ 500
0.0677
0.2258
4.9
3.0
4.4
6.4
A17
y = 2.94e5x – 2.02e3
0.9978
500 ∼ 3.20e4
9.014
30.05
3.4
8.3
9.8
8.1
A18
y = 4.00e6x + 1.63e5
0.9963
39.1 ∼ 2.50e3
0.4019
1.340
2.2
2.8
2.6
2.9
A19
y = 3.00e6x + 2.21e3
0.9983
39.1 ∼ 2.50e3
0.1195
0.3982
6.1
4.5
2.9
6.7
A20
y = 6.00e6x + 63.50
0.9976
1.09 ∼ 70.0
0.0938
0.3125
7.2
9.2
8.2
2.3
A21
y = 2.79e5x – 8.15e3
0.9988
46.9 ∼ 3.00e3
0.7769
2.590
5.0
2.7
10.3
8.3
A22
y = 3.00e6x + 1.55e3
0.9991
0.781 ∼ 50.0
0.0732
0.2441
6.5
2.6
9.5
4.5
A23
y = 3.00e6x – 821
0.9999
0.781 ∼ 50.0
0.0252
0.0840
5.4
4.9
3.6
9.5
A24
y = 1.00e6x – 9.99e3
0.9973
7.81 ∼ 500
0.1711
0.5703
7.0
9.4
9.0
7.6
A25
y = 1.00e7x + 2.07e5
0.9993
51.6 ∼ 3.30e3
0.0272
0.0908
3.7
8.6
3.3
7.5
A26
y = 6.00e5x – 7.27e3
0.9999
70.3 ∼ 4.50e3
0.7324
2.441
2.3
2.1
7.4
5.9
A27
y = 3.00e6x + 3.47e3
0.9964
0.781 ∼ 50.0
0.0938
0.3125
7.2
6.4
8.8
9.3
A28
y = 4.00e6x + 2.10e5
0.9968
39.1 ∼ 2.50e3
0.0431
0.1438
10.0
5.2
9.6
8.1
A29
y = 1.00e7x + 5.07e5
0.9973
17.2 ∼ 1.10e3
0.0127
0.0425
2.1
2.4
2.1
1.3
A30
y = 3.25e5x + 191
0.9976
7.81 ∼ 500
0.6696
2.232
6.3
11.0
7.4
7.0
A31
y = 2.00e7x – 1.86
0.9991
1.09 ∼ 70.0
0.0138
0.0460
7.8
4.5
9.1
5.8
A32
y = 3.00e7x + 353
0.9997
0.938 ∼ 60.0
0.0118
0.0395
4.2
5.1
6.7
4.3
A33
y = 3.00e8x + 3.20e5
0.9965
0.781 ∼ 50.0
0.0100
0.0332
2.9
2.9
3.4
3.9
A34
y = 1.00e7x + 6.70e5
0.9952
0.422 ∼ 27.0
0.2185
0.7284
3.4
5.4
4.9
3.0
A35
y = 2.00e7x + 8.33e3
0.9974
0.781 ∼ 50.0
0.0144
0.0479
4.1
8.5
11.3
8.8
A36
y = 5.00e6x – 688
0.9997
0.781 ∼ 50.0
0.0977
0.3255
2.1
6.2
10.8
9.1
A37
y = 2.00e7x – 1.14e3
0.9995
0.781 ∼ 50.0
0.0213
0.0710
4.3
8.1
11.0
6.4
A38
y = 1.55e5x – 3.34e4
0.9999
0.157 ∼ 10.0
2.633
8.778
1.3
3.3
4.7
3.4
A39
y = 6.00e6x + 135
0.9994
0.781 ∼ 50.0
0.0350
0.1166
6.4
4.5
5.9
5.3
A40
y = 9.00e6x – 1.53e3
0.9992
0.781 ∼ 50.0
0.0230
0.0766
4.1
3.3
5.4
9.1
3.3 Sample analysis and establishment of the content dimension of “spider-web” mode
After the method was validated, 40 components of 11 batches of MLSTP were determined, and the results were shown in the Table 3. There are differences among the 11 batches, as can be seen from Fig. 4A. The difference can be caused by many factors, such as raw materials, processing procedures, even the geographical environment, climate and temperature. All factors contribute to the difference in the content of ingredients, which may affect the pharmacological effects and even the therapeutic effects of different batches. Therefore, a quality evaluation system for MLSTP should be established as soon as possible to ensure the stability, safety and effectiveness of clinical use. According to the overall quality level diagram shown in Fig. 4B, the content of 40 substances can be found to be quite different. Among them, there are 11 kinds of substances have a relatively large content, including Harpagoside, Ononin, Betaine, Calycosin-7-glucoside, Magnoflorine, Loganic acid, Paeoniflorin, Albiflorin, Gallic acid, Quinic acid, Ligustilide, with an average of more than 100 μg/g, the other 29 substances have a relatively low content. Among the 11 substances with high content, many of them are representative components of adjuvants, such as Paeoniflorin, a representative component of peony, and Ligustilide, a representative component of angelica, ect. Others are some for carboxylic acid compounds, such as Gallic acid, Quinic acid, And Loganic acid, which may be related to the preparation process of medicinal materials. After the medicinal materials were decocted at high temperature, some components may be hydrolyzed to form small molecular carboxylic acid components. All these ingredients may be closely related to the quality of the drug, which provides a material basis for us to find quality markers in the future.
Compound
51,821,142
(S1)
51,821,143
(S2)
51,821,144
(S3)
51,821,145
(S4)
51,821,146
(S5)
51,821,147
(S6)
51,821,148
(S7)
51,821,149
(S8)
51,821,150
(S9)
51,821,151
(S10)
51,821,152
(S11)
A1
156.8
162.8
154.5
157.1
186.0
175.8
177.9
185.9
188.8
183.3
180.9
A2
1802
1792
1702
1655
1841
1827
1822
1933
1899
1915
1793
A3
685.6
807.1
845.1
952.3
855.5
893.6
833.0
921.4
891.9
921.0
900.0
A4
29.29
32.41
29.14
31.03
30.09
32.05
30.56
30.96
31.52
31.21
32.35
A5
673.6
683.9
640.4
688.4
647.7
675.1
666.6
771.7
945.6
751.9
706.6
A6
3.303
4.376
2.263
4.309
2.983
3.886
2.196
2.733
5.069
1.679
3.390
A7
0.3640
0.3617
0.3636
0.3449
0.3589
0.3802
0.3565
0.4484
0.3476
0.4294
0.4216
A8
98.58
140.1
140.7
166.6
179.8
186.9
118.7
125.6
177.4
146.6
229.0
A9
607.7
628.8
558.0
608.1
627.2
647.8
579.4
724.0
647.5
705.2
757.0
A10
44.00
41.90
37.98
50.96
56.66
49.38
41.49
56.84
42.92
52.51
56.90
A11
1069
893.6
757.2
808.6
951.4
927.8
836.4
1036.1
911.7
964.5
976.4
A12
158.1
144.2
130.9
141.4
151.7
163.4
147.9
142.9
149.1
133.7
152.5
A13
17.76
15.56
15.99
20.74
22.23
19.42
16.68
22.18
21.36
20.36
23.14
A14
81.51
71.40
66.12
79.47
90.85
86.96
76.76
89.47
93.86
86.53
92.65
A15
158.3
101.9
85.53
56.38
75.22
76.31
67.92
68.84
87.04
64.87
63.49
A16
15.79
17.32
15.27
15.26
17.29
16.36
15.73
16.01
17.18
15.62
17.91
A17
65.38
56.48
48.49
58.03
66.06
67.13
54.92
69.55
64.74
65.09
71.17
A18
1.878
2.152
1.218
1.233
2.207
2.104
1.180
2.002
2.021
1.659
2.248
A19
5.784
5.212
4.673
6.003
6.749
6.504
5.873
6.896
6.851
6.736
7.035
A20
5.124
4.856
3.901
4.361
5.316
5.533
4.718
5.108
5.749
4.880
5.445
A21
71.00
72.81
66.52
74.82
80.12
71.81
81.69
81.84
81.35
74.24
103.44
A22
1.605
1.778
1.376
1.765
2.091
1.672
1.753
2.106
1.932
1.858
1.825
A23
0.6424
0.6225
0.5592
0.5409
0.6660
0.6476
0.7416
0.6734
0.5321
0.5984
0.6728
A24
9.023
9.961
9.155
10.41
12.67
11.54
10.18
12.98
12.46
11.58
13.57
A25
139.9
124.1
118.1
104.1
110.5
113.8
101.9
101.6
108.7
94.7
106.2
A26
243.2
199.0
174.5
194.6
205.0
209.8
189.9
217.8
220.4
211.9
216.7
A27
0.1421
0.0602
0.1238
0.0507
0.0825
0.0618
0.0595
0.1033
0.0847
0.1119
0.0687
A28
7.33
3.51
4.25
12.39
8.42
4.90
5.58
8.99
8.70
6.80
6.19
A29
64.38
55.62
61.41
71.08
64.82
59.01
60.90
60.94
68.64
58.81
65.61
A30
20.25
16.48
14.42
16.27
17.96
18.91
16.73
20.73
18.40
19.55
19.76
A31
1.751
1.773
1.592
1.961
1.980
2.201
2.190
2.424
1.890
2.457
2.250
A32
0.4822
0.0372
0.5979
0.3219
0.4681
0.0499
0.1015
0.3983
0.5545
0.3352
0.2407
A33
0.3684
0.3180
0.2682
0.6803
0.6193
0.4830
0.4639
0.5209
0.5844
0.5050
0.5227
A34
25.27
17.55
20.46
24.80
23.14
19.95
20.14
20.80
23.96
20.21
22.77
A35
1.307
0.1305
0.9915
0.5447
0.7001
0.1095
0.2531
0.6537
0.6655
0.5475
0.4056
A36
2.165
2.738
6.005
3.766
3.683
1.971
2.380
1.796
2.735
1.663
2.771
A37
4.316
0.3553
1.899
1.083
1.562
0.619
0.954
1.592
2.083
1.410
1.099
A38
4910
4129
3544
5480
5415
5157
4980
5289
5444
5336
5427
A39
1.463
1.748
1.440
1.678
1.684
1.828
1.816
1.797
1.825
1.729
1.655
A40
0.8879
1.019
0.8406
1.015
1.027
1.028
1.064
1.154
1.175
1.016
0.9981
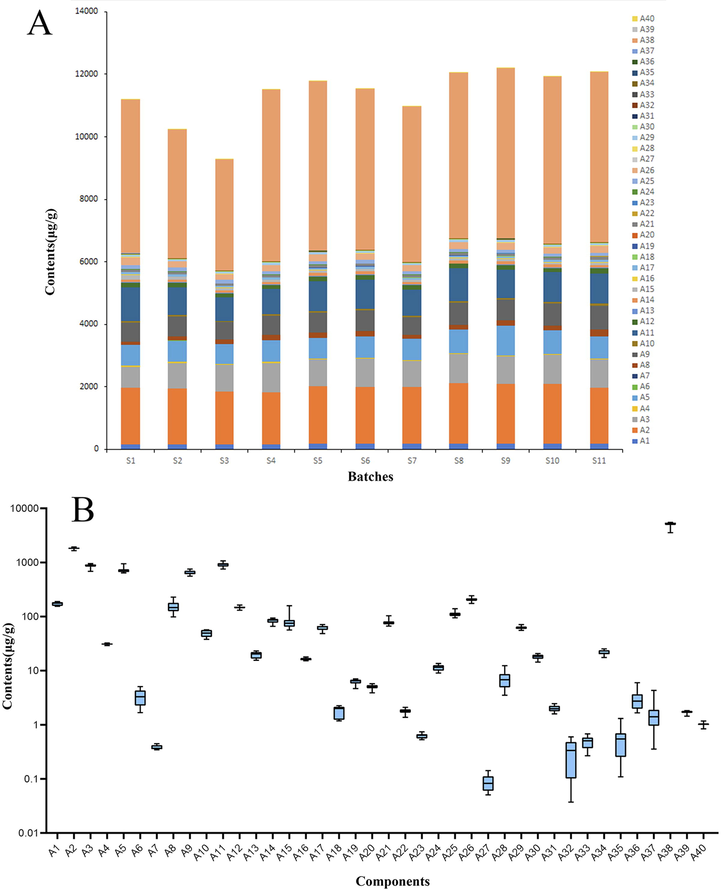
Contents of 40 constitutes in 11 batches of MLSTP products. (A) Comparison of 11 batches (S1-S11) in MLSTP. (B) Horizontal comparison of 40 components (A1-A40) in MLSTP.
For the quality control research of TCM, the components with higher content usually become the key research objects, which is inseparable from the complexity of substances and existing detection techniques. To construct the content dimension of the spider web, the average content data of 40 substances were processed by the min–max normalization method. As can be seen from Table 4, the CD values of Ligustilide, Quinic acid, Paeoniflorin, Gallic acid, Loganic acid are high, which may indicate that they have great potentials to become Q-markers of MLSTP. Ligustilide is a representative substance of the ministerial drug Angelicae Sinensis Radix, with an average content of more than 5000 μg·g−1 in MLSTP, which is the highest content. It was verified to have a wide range of pharmacological properties, including anticancer, anti-inflammatory, antioxidant, and neuroprotective activities (Xie et al., 2020). However, its pharmacokinetic study showed that it has poor oral bioavailability in rats due to severe first-pass metabolic reactions (Donkor et al., 2016). Therefore, whether it can be used as a candidate substance needs further analysis. In addition to the level of substance content being a factor to be considered, the stability of each substance between batches is also a factor that cannot be ignored (Cai et al., 2021, Wang et al., 2021). This is an issue that is often considered in studies of simultaneous quantitative of TCM and herbs, and the stability investigation was not followed in this study due to the small number of batches, which can be investigated in more depth in subsequent studies.
No.
Average Content
(μg·g−1)
CD
OB
DL
PKD
Pa
PMD
SD
Vasoprotector
Antithrombotic
Antiinflammatory
A1
173.618
0.693
0.409
0.010
0.202
0.778
0.388
0.369
0.636
0.240
A2
1816.455
0.908
0.635
0.060
0.205
0.538
0.333
0.705
0.509
0.254
A3
864.227
0.840
0.317
0.040
0.232
0.565
0.504
0.548
0.265
0.151
A4
30.965
0.536
0.254
0.040
0.242
0.592
0.461
0.538
0.312
0.112
A5
713.773
0.822
0.049
0.400
0.134
0.676
0.899
0.855
0.847
0.357
A6
3.290
0.332
0.384
0.030
0.217
0.63
0.000
0.000
0.378
0.083
A7
0.380
0.135
0.309
0.050
0.236
0.483
0.455
0.541
0.223
0.034
A8
155.453
0.683
0.267
0.550
0.327
0.413
0.27
0.342
0.000
0.112
A9
644.609
0.813
0.303
0.770
0.426
0.396
0.408
0.886
0.824
0.416
A10
48.322
0.577
0.032
0.680
0.000
0.980
0.685
0.728
0.988
0.285
A11
921.155
0.846
0.539
0.790
0.849
0.312
0.478
0.578
0.287
0.398
A12
146.891
0.678
0.416
0.810
0.643
0.936
0.52
0.655
0.911
0.478
A13
19.584
0.495
0.073
0.780
0.028
0.947
0.643
0.739
0.930
0.243
A14
83.235
0.626
0.069
0.770
0.025
0.976
0.662
0.718
0.981
0.292
A15
82.345
0.625
0.657
0.740
1.000
0.873
0.660
0.689
0.801
0.567
A16
16.340
0.478
0.433
0.040
0.214
0.735
0.541
0.641
0.561
0.156
A17
62.458
0.600
0.030
0.420
0.111
0.256
0.292
0.984
0.995
0.305
A18
1.809
0.277
0.067
0.770
0.021
0.970
0.719
0.702
0.970
0.135
A19
6.211
0.390
0.140
0.740
0.152
0.942
0.641
0.748
0.922
0.195
A20
4.999
0.370
0.097
0.740
0.081
0.969
0.651
0.707
0.969
0.184
A21
78.149
0.621
0.396
0.060
0.230
0.753
0.538
0.604
0.592
0.209
A22
1.796
0.277
0.278
0.080
0.246
0.747
0.325
0.629
0.582
0.113
A23
0.627
0.181
0.274
0.050
0.240
0.681
0.338
0.648
0.467
0.074
A24
11.230
0.444
0.401
0.750
0.585
0.919
0.719
0.741
0.882
0.349
A25
111.236
0.653
0.115
0.780
0.102
0.916
0.519
0.64
0.876
0.291
A26
207.527
0.710
0.155
0.830
0.166
0.644
0.720
0.793
0.662
0.248
A27
0.086
0.000
0.194
0.190
0.249
0.721
0.000
0.548
0.537
0.067
A28
7.005
0.401
0.328
0.180
0.276
0.556
0.329
0.616
0.354
0.102
A29
62.838
0.601
0.478
0.240
0.350
0.720
0.000
0.549
0.535
0.214
A30
18.133
0.488
0.311
0.540
0.376
0.261
0.278
0.987
1.000
0.321
A31
2.043
0.288
1.039
0.070
0.185
0.747
0.575
0.636
0.582
0.103
A32
0.326
0.121
0.853
0.150
0.334
0.624
0.229
0.715
0.526
0.096
A33
0.485
0.157
0.401
0.200
0.302
0.519
0.000
0.258
0.185
0.039
A34
21.732
0.504
0.697
0.210
0.390
0.639
0.000
0.517
0.394
0.159
A35
0.574
0.173
0.416
0.420
0.427
0.559
0.288
0.719
0.533
0.128
A36
2.879
0.320
0.533
0.470
0.566
0.289
0.000
0.446
0.057
0.092
A37
1.543
0.263
0.389
0.550
0.468
0.617
0.000
0.561
0.355
0.114
A38
5010.091
1.000
0.235
0.070
0.247
0.437
0.442
0.000
0.051
0.126
A39
1.697
0.272
0.475
0.150
0.285
0.279
0.269
0.660
0.430
0.093
A40
1.020
0.225
0.374
0.150
0.272
0.294
0.000
0.628
0.375
0.073
3.4 Establishment of the pharmacokinetics dimension of “spider-web” mode
ADME prediction is a common method to screen valuable active substances and is widely used in various Q-marker discovery strategies as an important link. For example, strategies that integrate UHPLC-LTQ-Orbitrap, ADME prediction, and network target analysis (Guo et al., 2018), and strategies that combine ADME prediction, network pharmacology, and experimental validation (Zhang et al., 2021). ADME prediction is a classic tool that provides key insights into how drugs will eventually be treated or accepted by the body (Lucas et al., 2019). In the open platform TCMSP, the membrane permeability, drug similarity, drug half-life, AlogP and other ADME data can be obtained (Ru et al., 2014). Among these parameters, OB and DL are the two most commonly concerned values, which are used as a classical combination for screening massive active substances in network pharmacology (Guo et al., 2019, Zhang et al., 2020a, 2020b).
Due to the absorption properties of oral preparations, various components of MLSTP can play their role only after being absorbed into the blood. Therefore, good pharmacokinetic properties are very important for their pharmacological effects. OB and DL parameters of 40 candidate compounds were collected from TCMSP and PKD was used to evaluate the pharmacokinetic properties of the compounds in MLSTP. As can be seen from Table 4, Liquiritin, Paeoniflorin and Calycosin-7-glucoside, Baicalin showed the better property in PK dimension, whose PKD value were 1.000, 0.849, 0.643, 0.585, respectively. Chemical components with similar structural types always exhibit similar activity, and high oral bioavailability is often a key indicator for determining the drug-like properties of bioactive molecules as therapeutic agents. According to the data, the OB of Liquiritin is 65.69 % and DL is 0.74, which is the highest PKD score among all substances. According to the literature, glycyrrhizin can penetrate the blood–brain barrier. In addition, it has various pharmacological effects, including anti-Alzheimer's disease, antidepressant, antitumor, anti-inflammatory, cardiovascular protective, cough suppressant, hepatoprotective and skin protective effects (Qin et al., 2022). In this study, only ADME prediction analysis was performed, and its in vivo pharmacokinetics can be further validated in the future in MLSTP.
3.5 Establishment of the pharmacology dimension of “spider-web” mode
Q-marker is defined as the chemical substances closely related to the functional properties of traditional Chinese medicine (Ren et al., 2020). Activity prediction is an effective strategy for the discovery of bioactive natural products (Nothias et al., 2018). It can screen out valuable components from massive substances and has great application prospect in Q-marker search (Kibble et al., 2015, Thomford et al., 2018). PASS is an integrated computer screening strategy that can simultaneously predict 3678 activities based on the structural formula of substance, with an average prediction accuracy of about 95 % (Rudik et al., 2021). It also be widely used to find new targets (mechanisms) of known drugs and discover new bioactive substances (Jairajpuri et al., 2021).
MLSTP was proven as a therapy for treatment of superficial thrombophlebitis, which was characterized as a localized inflammatory condition of the venous vessels underlying the skin, often accompanied by thrombosis and vascular wall injury (Nasr and Scriven 2015). In order to find the Q-marker of MLSTP, we evaluated the anti-inflammatory, anti-thrombotic and vascular protection activities of the candidate substance according to the action principle of superficial thrombophlebitis. In this paper, various biological activities of 40 substances were predicted by PASS. As can be seen from Table 4, the PMD values of Benzoylpaeoniflorin, Galloylpaeoniflorin, Rutin, Cynaroside, Rhoifolin and Cosmosiin are relatively high, with the value of 1.000, 0.995, 0.988, 0.981, 0.970 and 0.969, respectively, which may indicate that they have better pharmacological activity and more chance of becoming Q-marker. Benzoylpaeoniflorin is a representative component of Paeoniae Radix Alba with an anti-inflammatory activity score of 0.987 and has the highest PMD value according to the formula. According to literature studies, B has been found to suppresses TNF-α-induced nuclear translocation of NF-κB p65 from cytosol as well as the enhanced TNFA and C—C motif chemokine ligand 2 (CCL2) mRNA expression in HUVECs (Zheng et al., 2020, Kim et al., 2021), but further validation analysis is needed for the therapeutic effect on TAO. Future validation of the anti-TAO activity of all candidate compounds with respect to their target effects will require further in vitro and in vivo experiments.
3.6 Established the ‘Spider-web’ mode for identifying Q-markers
In order to balance the contribution of each dimension in Q-markers, the values of content, pharmacokinetics and pharmacology were processed by maximum and minimum normalization method. The results of three-dimensional feature network and regression region sorting histogram were shown in Fig. 5 and Fig. 6A, the SD value of candidate components was listed in Table 4. It can be seen that Liquiritin, Calycosin-7-glucoside, Albiflorin, Paeoniflorin, Loganic acid and Baicalin have the best overall ranking in the SD value calculated from three dimensions of content, pharmacokinetics and pharmacology, which can be used as the potential quality markers of MLSTP.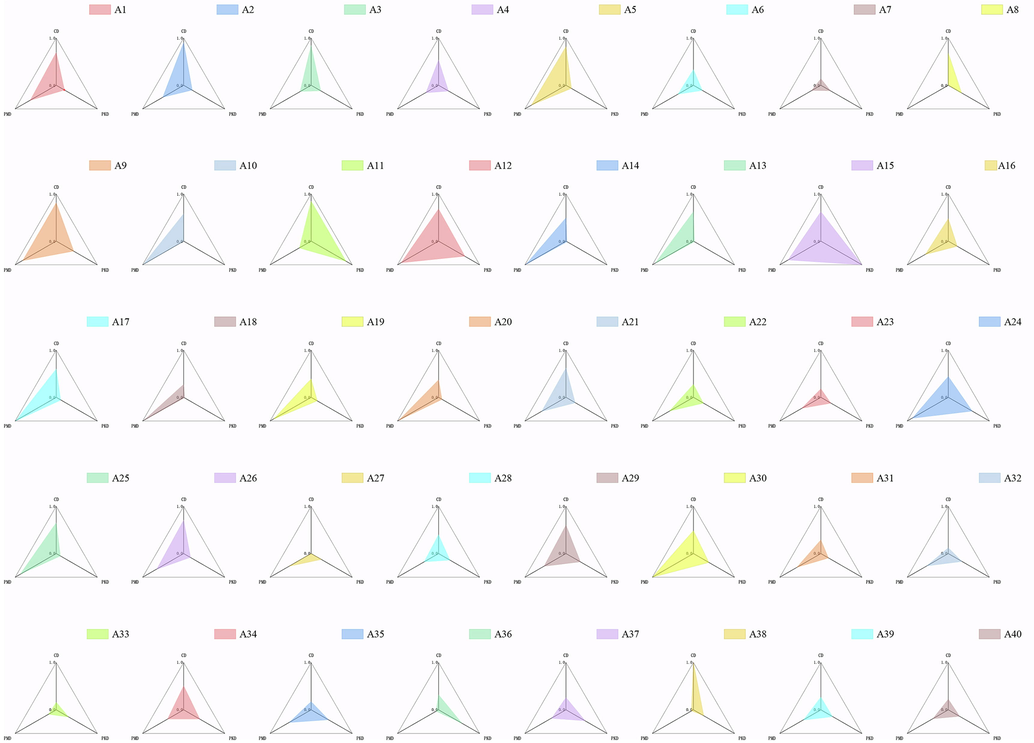
Established “spider-web” mode of 40 candidate components in MLSTP.
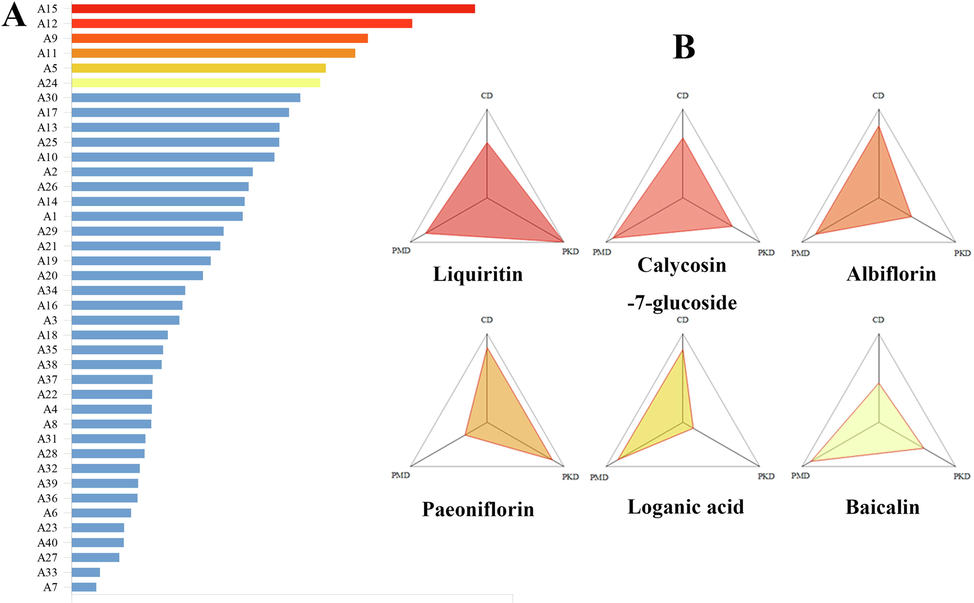
Established the ‘Spider-web’ mode of A1-A40 in MLSTP. (A) Histogram of regression area ranking formed by “spider web”. (B) A three-dimensional network of the top six compounds.
According to Fig. 6B, Liquiritin, Calycosin-7-glucoside and Albiflorin showed good performance in three aspects, with higher values in CD, PKD and PMD. Liquiritin is a flavonoid derived from Glycyrrhizae Radix Et Rhizoma in MLSTP, which is high in content. And its oral bioavailability and drug-like degree are high, indicating that Liquiritin has good pharmacokinetic properties as therapeutic agents. Meanwhile, its Pa (Vasoprotector), Pa (Antithrombotic) and Pa (Antiinflammatory) are all greater than 0.6, indicating that it may have three aspects of activity and play an important role in the treatment of thromboangiitis obliterans. This is consistent with the literature that Liquiritin can reduce inflammation, inhibit angiogenesis and regulate the proliferation of human vascular smooth muscle cells, and may indicate the value of further research on Liquiritin (Zhai et al., 2019, Yuan et al., 2022). Calycosin-7-glucoside showed the higher value in CD, PKD and PMD, especially for PMD. Its Pa was 0.936 for vascular protection and 0.655 for anti-inflammatory, which may indicate Calycosin-7-glucoside have potential vascular protection activity and anti-inflammatory activity. As the main representative of isoflavone components in radix astragali, there are few studies on the pharmacological effects of Calycosin-7-glucoside separately. Some studies have reported that Calycosin-7-glucoside can improve the left ventricular ejection fraction of myocardial infarction rats and promote angiogenesis, which is also consistent with our prediction results (Junqing et al., 2015). In addition, the anti-inflammatory activity of Calycosin-7-glucoside may require more research. Albiflorin is a monoterpene derived from Paeonia lactiflora in MLSTP, with the high content. OB and DL were 0.303 and 0.770, respectively, which were in line with drug screening standards and had good performance in PK dimension. Pa (anti-inflammatory) was 0.886, indicating the potential anti-inflammatory activity of Albiflorin, which may indicate that it is a potential medicinal ingredient against thromboangiitis obliterans. By comparison, it is obviously found that PMD of Paeoniflorin, PKD of Loganic acid and CD of Baicalin are lower, indicating that they perform poorly in these three aspects and may not meet the requirements of Q-Markers. In summary, Liquiritin, Calycosin-7-glucoside and Albiflorin can be used as the Q-markers of MLSTP.
4 Conclusion
In this study, a new strategy based on “Content-Pharmacokinetics-Pharmacology” three-dimensional radar pattern was proposed, which creatively combined classical quantitative analysis with activity prediction, and Q-markers in MLSTP were discovered for the first time. The standardized content data were used to determine its content dimension, the pharmacokinetic dimension was evaluated by two parameters of OB and DL, and the pharmacology dimension was assessed by three aspects on anti-inflammatory, vasoprotector and anti-thrombotic. And then, the scores of the above three dimensions were combined to construct a spider network, and the material with the larger regression area was selected as its potential Q-marker. Finally, Liquiritin, Calycosin-7-glucoside and Albiflorin were screened out as Q-markers for MLSTP. This model can predict the properties of the substance, save time and money for subsequent substance research and cell experiment, and overcome the problems of large reagent investment and single activity study in traditional methods. All in all, the strategy achieved comprehensive and divergent evaluation of various attributes of Q-markers in TCM prescriptions, which has a certain reference significance for the discovery of Q-markers in TCM prescriptions.
5 Author’s contributions
MW and XZ performed the experiments and wrote this manuscript. YC, ZL, and LZ helped to revise the manuscript and provided valuable feedback to this conception, JK and GC revised the entire manuscript and edited the language for scientific presentation. The corresponding authors, ZS, XZ and SD conceived and organized this study.
Funding
This article was supported by the Foundation of World Federation of Chinese Medicine Societies (No. WFCMS2019003), the Key Scientific Research Projects of Colleges and Universities in Henan Province (Nos. 20A350015 and 22B360018), Health Science and Technology Innovation Excellent Talents Training Project for Young and Middle-aged in Henan Province (No. YXKC2020058), and the Project of China Guanghua Foundation.
Declaration of Competing Interest
The authors declare that they have no known competing financial interests or personal relationships that could have appeared to influence the work reported in this paper.
References
- Quality evaluation of Lonicerae Japonicae Flos and Lonicerae Flos based on simultaneous determination of multiple bioactive constituents combined with multivariate statistical analysis. Phytochem. Anal.. 2021;32:129-140.
- [CrossRef] [Google Scholar]
- Identifying quality markers of Mailuoshutong pill against thromboangiitis obliterans based on chinmedomics strategy. Phytomedicine. 2022;104:154313
- [CrossRef] [Google Scholar]
- Calycosin: a Review of its Pharmacological Effects and Application Prospects. Expert. Rev. Anti Infect. Ther.. 2021;19:911-925.
- [CrossRef] [Google Scholar]
- Locally and traditionally used Ligusticum species - A review of their phytochemistry, pharmacology and pharmacokinetics. J. Ethnopharmacol.. 2016;194:530-548.
- [CrossRef] [Google Scholar]
- Pharmacokinetics/pharmacometabolomics-pharmacodynamics reveals the synergistic mechanism of a multicomponent herbal formula, Baoyuan decoction against cardiac hypertrophy. Biomed. Pharmacother.. 2021;139:111665
- [CrossRef] [Google Scholar]
- Integrating Network Pharmacology and Pharmacological Evaluation for Deciphering the Action Mechanism of Herbal Formula Zuojin Pill in Suppressing Hepatocellular Carcinoma. Front. Pharmacol.. 2019;10:1185.
- [CrossRef] [Google Scholar]
- Identifying potential quality markers of Xin-Su-Ning capsules acting on arrhythmia by integrating UHPLC-LTQ-Orbitrap, ADME prediction and network target analysis. Phytomedicine. 2018;44:117-128.
- [CrossRef] [Google Scholar]
- Identification of natural compounds as potent inhibitors of SARS-CoV-2 main protease using combined docking and molecular dynamics simulations. Saudi J. Biol. Sci.. 2021;28:2423-2431.
- [CrossRef] [Google Scholar]
- Effect of calycosin on left ventricular ejection fraction and angiogenesis in rat models with myocardial infarction. J. Tradit. Chin. Med.. 2015;35:160-167.
- [Google Scholar]
- Network pharmacology applications to map the unexplored target space and therapeutic potential of natural products. Nat. Prod. Rep.. 2015;32:1249-1266.
- [CrossRef] [Google Scholar]
- Root Extract and Its Components Reduce Biomarkers of Early Atherosclerosis via Anti-Inflammatory and Antioxidant Effects In Vitro and In Vivo. Antioxidants (Basel).. 2021;10
- [CrossRef] [Google Scholar]
- Experimental Study of Phlebitis Ointment Administration in Acute Superficial Thrombophlebitis. Evid. Based Complement. Alternat. Med.. 2018;2018:2983195.
- [CrossRef] [Google Scholar]
- Quality transitivity and traceability system of herbal medicine products based on quality markers. Phytomedicine. 2018;44:247-257.
- [CrossRef] [Google Scholar]
- Estimating human ADME properties, pharmacokinetic parameters and likely clinical dose in drug discovery. Expert Opin. Drug Discov.. 2019;14:1313-1327.
- [CrossRef] [Google Scholar]
- Superficial thrombophlebitis (superficial venous thrombosis) BMJ. 2015;350:h2039
- [CrossRef] [Google Scholar]
- Bioactivity-Based Molecular Networking for the Discovery of Drug Leads in Natural Product Bioassay-Guided Fractionation. J. Nat. Prod.. 2018;81:758-767.
- [CrossRef] [Google Scholar]
- Pharmacological activities and pharmacokinetics of liquiritin: A review. J. Ethnopharmacol.. 2022;293:115257
- [CrossRef] [Google Scholar]
- Analytical strategies for the discovery and validation of quality-markers of traditional Chinese medicine. Phytomedicine. 2020;67:153165
- [CrossRef] [Google Scholar]
- TCMSP: a database of systems pharmacology for drug discovery from herbal medicines. J. Cheminform.. 2014;6:13.
- [CrossRef] [Google Scholar]
- MetaPASS: A Web Application for Analyzing the Biological Activity Spectrum of Organic Compounds Taking into Account their Biotransformation. Mol. Inform.. 2021;40:e2000231
- [CrossRef] [Google Scholar]
- Natural Products for Drug Discovery in the 21st Century: Innovations for Novel Drug Discovery. Int. J. Mol. Sci.. 2018;19
- [CrossRef] [Google Scholar]
- What has traditional Chinese medicine delivered for modern medicine? Expert Rev. Mol. Med.. 2018;20:e4
- [CrossRef] [Google Scholar]
- An integrated strategy for holistic quality identification of Chinese patent medicine: Liuwei Dihuang Pills as a case study. Phytochem. Anal.. 2021;32:183-197.
- [CrossRef] [Google Scholar]
- Z-ligustilide: A review of its pharmacokinetics and pharmacology. Phytother. Res.. 2020;34:1966-1991.
- [CrossRef] [Google Scholar]
- Regulatory Mechanisms of Baicalin in Cardiovascular Diseases: A Review. Front. Pharmacol.. 2020;11:583200
- [CrossRef] [Google Scholar]
- Overview and prospects of traditional Chinese medicine blending technology oriented by quality consistency. Zhongguo Zhong Yao Za Zhi.. 2019;44:4786-4792.
- [CrossRef] [Google Scholar]
- Approaches to establish Q-markers for the quality standards of traditional Chinese medicines. Acta Pharm. Sin. B. 2017;7:439-446.
- [CrossRef] [Google Scholar]
- Ononin, sec-O-β-d-glucosylhamaudol and astragaloside I: antiviral lead compounds identified via high throughput screening and biological validation from traditional Chinese medicine Zhongjing formulary. Pharmacol. Res.. 2019;145:104248
- [CrossRef] [Google Scholar]
- Protective effect of liquiritin on coronary heart disease through regulating the proliferation of human vascular smooth muscle cells via upregulation of sirtuin1. Bioengineered. 2022;13:2840-2850.
- [CrossRef] [Google Scholar]
- Liquiritin from Glycyrrhiza uralensis Attenuating Rheumatoid Arthritis via Reducing Inflammation, Suppressing Angiogenesis, and Inhibiting MAPK Signaling Pathway. J. Agric. Food Chem.. 2019;67:2856-2864.
- [CrossRef] [Google Scholar]
- The method of quality marker research and quality evaluation of traditional Chinese medicine based on drug properties and effect characteristics. Phytomedicine. 2018;44:204-211.
- [CrossRef] [Google Scholar]
- A novel strategy for exploring food originated anti-adipogenesis substances and mechanism by structural similarity evaluation, ADME prediction, network pharmacology and experimental validation. Food Funct.. 2021;12:7081-7091.
- [CrossRef] [Google Scholar]
- Application of “spider-web” mode in discovery and identification of Q-markers from Xuefu Zhuyu capsule. Phytomedicine. 2020;77:153273
- [CrossRef] [Google Scholar]
- Integrated network pharmacology analysis and serum metabolomics to reveal the cognitive improvement effect of Bushen Tiansui formula on Alzheimer's disease. J. Ethnopharmacol.. 2020;249:112371
- [CrossRef] [Google Scholar]
- Evaluation of Anti-Inflammatory Components of Guizhi Fuling Capsule, an Ancient Chinese Herbal Formula, in Human Umbilical Vein Endothelial Cells. Evid. Based Complement. Alternat. Med.. 2020;2020:2029134.
- [CrossRef] [Google Scholar]


