

Translate this page into:
Crystal structure, thermodynamic behavior, and luminescence properties of a new series of lanthanide halogenated aromatic carboxylic acid complexes
⁎Corresponding authors. ningren9@163.com (Ning Ren), jjzhang6@126.com (Jian-Jun Zhang)
-
Received: ,
Accepted: ,
This article was originally published by Elsevier and was migrated to Scientific Scholar after the change of Publisher.
Peer review under responsibility of King Saud University.
Abstract
Five lanthanide complexes with polydentate coordination were successfully synthesized by volatilization of 2,4-difluorobenzoate and o-phenanthroline ligands. The structure general formula is [Ln(2,4-DFBA)3(phen)]2, (Ln = La(1), Gd(2), Tb(3), Dy(4), Ho(5); 2,4-DFBA = 2,4-difluorobenzoate, phen = o-phenanthroline). The crystal structures of five complexes were determined, and supramolecular structures were probed. Characterization was performed by elemental analysis, IR, Raman spectroscopy and XRD, followed by an examination of the fluorescence and heat capacity properties. The molar heat capacities of complexes 4 and 5 were determined in detail by the DSC apparatus, and the thermodynamic functions were calculated. Finally, the fluorescence properties of complexes 3 and 4 were investigated. Using DFT, the HOMO, LUMO energy levels of the ligands and their single and triplet state energy levels were calculated at the level of the valence layer cleavage 6-311G(d,p) basis group, and the fluorescence enhancement mechanism was explained from the energy transfer perspective.
Keywords
Lanthanide complexes
Supramolecular structure
Spectroscopy
Fluorescence, Heat capacity

1 Introduction
Lanthanide ions are more likely to form coordination models of lanthanide complexes with high coordination numbers and multiple structures due to their unique 4f electron layer structure (Mikhalyova and Pavlishchuk, 2019). Therefore, lanthanide complexes are widely used to synthesize and explore their properties. Many scholars have focused on the synthesis of oxygen-containing ligands (deKoning et al., 1997, Chruszcz-Lipska et al., 2008), N-containing ligands (He et al., 2005, Gao et al., 2014), and the study of how they form complexes with lanthanide ions (Wu et al., 2019, Zhao et al., 2021). Based on the excellent properties of lanthanide complexes in many fields such as magnetism (Kumar et al., 2020), optics, electrical conductivity, catalysis, and biomedicine (Du et al., 2002, Misra et al., 2004, Shinoda and Tsukube, 2011). They are often used as various magnetic materials (Du et al., 2002, Kumar et al., 2019a, 2019b, 2019c, Biswas and Neugebauer, 2021, Qu et al., 2021), optical devices (Bai et al., 2017, Kumar et al., 2018, Cantelar et al., 2020), superconductors (Edleman et al., 2002), efficient catalysts (Loughmari et al., 2012, Chen et al., 2017), and anti-tumor drugs (Chan et al., 2014). All of these hold great promise for applications. It is well known that lanthanide ions can coordinate with oxygen, nitrogen, halogen, sulfur, phosphorus, and other atoms to form various types of complexes (Wu et al., 2021). Still, their coordination abilities are pretty different (Huang et al., 2017). From the theory of acidity and basicity of metal ions (Chattaraj and Ayers, 2005, Anderson and Ayers, 2014), lanthanide ions belong to the hard acid group of metals. After continuous theoretical research and practice, it is found that among them, they have strong coordination ability (Kumar et al., 2019a, 2019b, 2019c, Ashashi et al., 2021) with coordination atoms belonging to hard bases such as oxygen, fluorine, and nitrogen atoms. Therefore, our group is devoted to studying oxygenated aromatic carboxylic acid ligands as the main ligands (Zhao et al., 2018, Zhu et al., 2019). In order to make its structure more unique and novel, auxiliary ligands containing nitrogen such as pyridines were introduced to investigate its unique structure, thermal properties, fluorescence properties, etc. Aromatic carboxylic acid ligands are commonly used to construct complexes and have been used to date to synthesize a variety of complexes. Both oxygen atoms in the carboxylate can be coordinated with the lanthanide ion in various coordination modes, so the coordination mode is very flexible (Sen et al., 2020). In addition, the oxygen atom on the carboxyl group is easier to form hydrogen bonds (Kumar et al., 2019a, 2019b, 2019c). To further enhance the stability of the complex, the use of halogenated aromatic carboxylic acids allows the halogens on the benzene ring to form hydrogen bonds. The lanthanide aromatic carboxylic acid complexes have good thermal stability properties (Li et al., 2020). The thermal decomposition mechanism and molar heat capacity were investigated by thermal analysis techniques, which can successfully predict the thermal stability of the materials and facilitate the subsequent production applications. Based on the above analytical studies, five complexes [Ln(2,4-DFBA)3(phen)]2 (Ln = La(1), Gd(2), Tb(3), Dy(4), Ho(5); 2,4-DFBA = 2,4-difluorobenzoate, phen = o-phenanthroline) were subjected to single-crystal X-ray determination, followed characterization by elemental analysis, infrared spectroscopy, Raman spectroscopy, and thermogravimetric analysis, and the thermal and fluorescence properties were investigated. Using DFT, the energy transfer between ligands and lanthanide ions was investigated to explain the luminescence phenomenon of lanthanide complexes.
2 Experimental
2.1 Materials
As reagent grade materials, the products purchased in the market can be used without further purification of the reaction. All the reagents used in the experiments are listed in supporting information Table S1.
2.2 Experimental equipment and conditions
Mo-Kα and Cu-Kα rays (λ = 0.71073 Å) monochromatized by graphite were used as the incident light source. The diffraction data of single crystals 1–5 were measured at room temperature on a single crystal X-ray diffractometer Smart-1000 (Bruker AXS). After collecting the data, the SHELXS-97 program (Sheldrick and Schneider, 1997) in the computer was used to calculate the analysis. A direct method was used to determine the structures of complexes 1–5, and full-matrix least-squares refinement on F2 was used to refine the structures. Measurements were performed in the wavelength range 4000–400 cm−1 using the KBr press method by Bruker TENSOR27 infrared spectrometer. Powder X-ray diffraction experiments were performed on five complex powders by a Bruker D8 ADVANCE X-ray diffractometer at room temperature, using copper-potassium radiation (λ = 0.71073 Å) scanned in the range of 5-50°. The Raman spectra of the complexes were measured using a Bruker VERTEX-90 FTIR-RAMANII in the wavelength range of 4000–50 cm−1 with an Nd:YAG laser (λ = 1.064 μm) and a liquid nitrogen cooling device with a resolution of 4 cm−1 and a laser power of 400 mW and 100 scans in the wavelength range. The TG/DSC-FTIR experiments were performed in a simulated dynamic air atmosphere (20 mL/min of nitrogen, 10 mL/min of oxygen, and 30 mL/min of nitrogen as the protective gas). Experiments were performed using a NETZSCH STA 449 F3 and a BRUKERTENSOR27 Fourier transform infrared spectrometer and equipped with a liquid nitrogen system for the experiments, using an alumina trioxide crucible for release and a blank alumina trioxide crucible as a reference. The heating rate is 10 K/min and heated to 800℃. The fluorescence spectra were measured with an FS5 fluorescence spectrophotometer. The excitation spectra and emission spectra of complexes 3 and 4 were measured under Xe lamp irradiation, and complex 3 fluorescence lifetimes were determined. The Gaussian09 program package was used for the theoretical part of the calculations. Density functional theory (Geerlings et al., 2003) is a quantum mechanical method to study the electronic structure of the multi-electron system. In this case, the B3LYP hybridization generalization (Tirado-Rives and Jorgensen, 2008) is used, using the nonlocal correlations provided by the LYP expressions. The 6-311G(d,p) cleavage valence bond group is chosen, which describes the system wave function better than the STO-3G group.
2.3 Synthesis
The acidic ligand 2,4-DFBA (6 × 10⁻⁴ mol) and the ligand phen (2 × 10⁻⁴ mol) were mixed and dissolved in 6 mL of 95% ethanol and in 3 mL of distilled water, lanthanide nitrate (2 × 10⁻⁴ mol) was dissolved. After adjusting the pH to 5–7 by adding sodium hydroxide solution with a concentration of 1 mol/L to the ligand solution, it was poured into the lanthanide nitrate solution. Stirred at room temperature with a magnetic stirrer for about 6 h and left to stand for about 12 h. Using the room temperature solution volatilization method, the filtrate was extracted and placed in a small clean beaker, covered with a layer of cling film with small holes, and left to stand at room temperature for about a week to obtain the crystals.
Elemental analysis (in percent content): C66H34F12La2N4O12, Calcd: H, 2.17; C, 50.15; N, 3.54. Found: H, 2.16; C, 50.35; N, 3.72. C66H34F12Gd2N4O12, Calcd: H, 2.12; C, 49.01; N, 3.46. Found: H, 2.07; C, 49.03; N, 3.49. C66H34F12Tb2N4O12, Calcd: H, 2.12; C, 48.91; N, 3.46. Found: H, 2.09; C, 48.92; N, 3.43. C66H34F12Dy2N4O12, Calcd: H, 2.11; C, 48.69; N, 3.44. Found: H, 2.11; C, 48.98; N, 3.35. C66H34F12Ho2N4O12, Calcd: H, 2.10; C, 48.55; N, 3.43. Found: H, 2.06; C, 48.70; N, 3.42.
2.4 Determination of X-ray single-crystal structure and structural analysis
The complexes 1–5 with good crystal quality were selected and measured in a single crystal X-ray diffractometer Smart-1000 (Bruker AXS). The radiation source was Mo-Kα and Cu-Kα rays (λ = 0.71073 Å) monochromatized by graphite, and their crystal diffraction data were measured at room temperature. The rhythmic structures were structurally resolved by the direct method using the SHELXS-97 program (Sheldrick and Schneider, 1997) and refined by full-matrix least-squares on F2 to obtain the crystal structures. All atoms in the structure are non-isotropic except for hydrogen. Based on the above data, the crystal.cif file is imported into Mercury/Diamond software to visualize the crystal structure and facilitate the study. The crystal model is drawn in Diamond software according to the structure in Mercury software. As a 3D crystal simulation software (Pennington, 1999), Diamond can display crystal models very well, rotate, move, and scale freely as needed, and make reasonable changes to the coloring scheme. For the coordination environment of the central metal ion, the simulation calculation was carried out by using the shape software. Via the continuous shape measure method (Alvarez et al., 2014, Terebilenko et al., 2022). This software can well classify and organize the topological types and solve the previous errors with the naked eye observation. In complexes 1–5, the 2,4-difluorobenzoate ligand adopts a total of three coordination modes (Zhou et al., 2021) to Ln(III), namely double-dentate chelate (Fig. 1a), bridged double-dentate (Fig. 1b) and bridged tri-dentate (Fig. 1c).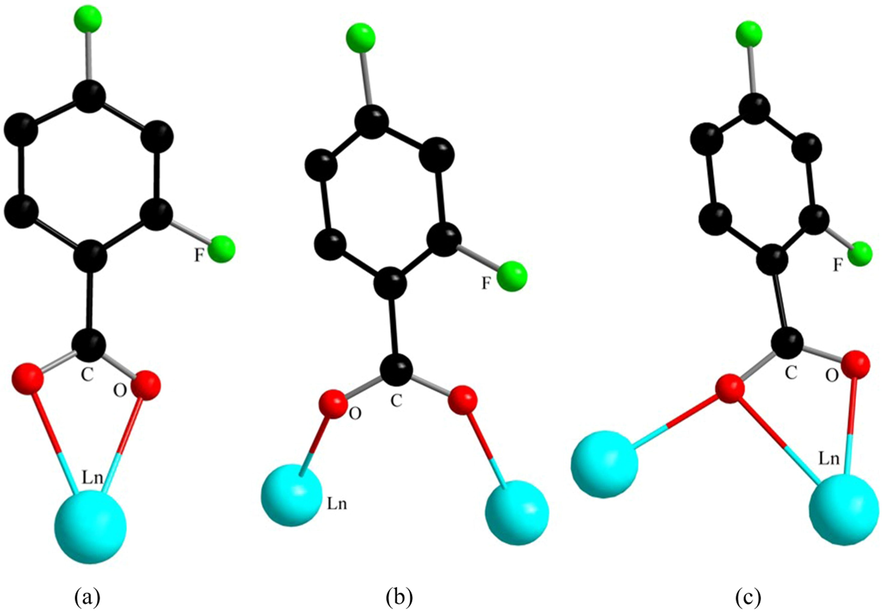
(a-c) Three bonding modes of 2,4-difluorobenzoate.
3 Results and discussion
3.1 Description of the crystal structure
The complexes 1–5 were analyzed by single crystal X-ray diffraction. The crystallographic data and the corresponding structural refinement parameters are listed in Table 1. The selected bond lengths and angles are listed in supporting information Table S2, Table S3. Hydrogen bond data are shown in supporting information Table S4. Upon analysis of the data, complexes 1–5 are all monoclinic crystal systems with space group P21/n. All compounds are isostructural. It is noteworthy that complexes 1, 2 and complexes 3–5 have the same structural formula, both crystal systems and space point groups are the same. However, they have different crystal structures, coordination environments, and coordination numbers. This may be due to the contraction of the lanthanum system. Therefore, two other crystal structures, represented by complexes 1 and 4, are selected for detailed discussion below.
Complex
1
2
3
4
5
Empirical formula
C66H34F12La2N4O12
C66H34F12Gd2N4O12
C66H34F12Tb2N4O12
C66H34F12Dy2N4O12
C66H34F12Ho2N4O12
Formula weight/g·mol−1
1580.79
1617.47
1620.81
1627.97
1632.83
Temperature/K
293(2)
293(2)
293(2)
293(2)
293(2)
Wavelength/Å
0.71073
0.71073
0.71073
0.71073
0.71073
Crystal system
Monoclinic
Monoclinic
Monoclinic
Monoclinic
Monoclinic
space group
P21/n
P21/n
P21/n
P21/n
P21/n
a/ Å
15.0114(13)
14.9841(13)
14.9747(13)
14.9881(15)
14.9684(13)
b/ Å
13.9262(11)
13.5045(12)
13.5144(12)
13.5352(14)
13.5042(12)
c/ Å
15.2708(14)
15.0686(14)
15.0766(14)
15.0448(14)
14.9763(14)
α/(°)
90
90
90
90
90
β/(°)
112.951(5)
109.290(4)
109.117(4)
108.962(4)
108.916(3)
γ/(°)
90
90
90
90
90
Volume/ Å3
2939.7(4)
2878.0(4)
2882.8(4)
2886.5(5)
2863.8(4)
Z, Calculated density/Mg·m−3
2, 1.786
2, 1.866
2, 1.867
2, 1.873
2, 1.894
Absorption coefficient/mm−1
1.542
2.395
2.544
2.679
2.854
F(0 0 0)
1552
1580
1584
1588
1592
Crystal size/mm3
0.22 × 0.18 × 0.11
0.41 × 0.18 × 0.11
0.26 × 0.15 × 0.10
0.23 × 0.13 × 0.08
0.26 × 0.15 × 0.10
θ range for data collection/°
2.06 to 25.02
2.09 to 25.02
2.08 to 25.02
2.08 to 25.01
2.08 to 25.02
Limiting indices
−17 ≤ h ≤ 15
−17 ≤ h ≤ 17
−17 ≤ h ≤ 12
−17 ≤ h ≤ 16
−16 ≤ h ≤ 17
−16 ≤ k ≤ 16
−16 ≤ k ≤ 15
−15 ≤ k ≤ 16
−16 ≤ k ≤ 12
−15 ≤ k ≤ 15
−8 ≤ l ≤ 14
−14 ≤ l ≤ 17
−17 ≤ l ≤ 17
−17 ≤ l ≤ 17
−16 ≤ l ≤ 17
Reflections collected / unique
13,763 / 5174 [R(int) = 0.0526]
14059/5064 [R(int) = 0.0825]
13949/5071 [R(int) = 0.0491]
14024/5076 [R(int) = 0.0817]
13,570 / 5008 [R(int) = 0.0592]
Completeness to θ = 25.02°
99.9%
99.9%
99.9%
99.8%
99.3%
Max. and min. transmission
0.8487 and 0.7278
0.7786 and 0.4401
0.7850 and 0.5576
0.8142 and 0.5778
0.7634 and 0.5241
Data / restraints / parameters
5174 / 36 / 437
5064 / 36 / 437
5071 / 36 / 437
5076 / 36 / 437
5008 / 36 / 437
Goodness-of-fit on F2
1.031
1.034
1.073
1.060
1.107
Final R indices
[I > 2σ(I)]R1 = 0.0405, wR2 = 0.0878
R1 = 0.0467, wR2 = 0.1064
R1 = 0.0351, wR2 = 0.0743
R1 = 0.0425, wR2 = 0.0988
R1 = 0.0496, wR2 = 0.1047
R indices (all data)
R1 = 0.0656, wR2 = 0.0961
R1 = 0.0678, wR2 = 0.1162
R1 = 0.0523, wR2 = 0.0799
R1 = 0.0619, wR2 = 0.1071
R1 = 0.0686, wR2 = 0.1094
Largest diff. peak
and hole
(e⋅nm−3)1.141 and −0.614
1.564 and −1.845
1.263 and −1.001
0.974 and −1.827
1.430 and −2.583
3.1.1 Central coordination geometries of complexes 1–5
Continuous shape measurement (CShM) calculations classified the central ion coordination geometry configuration. The corresponding geometric parameters are imported into the shape software and compared through a series of defined reference polyhedra, and the calculated results are presented as CShM parameters. Supporting information table S5 lists the CShM values for the central geometric configurations of the complexes 1–5. The lowest value of the CShM parameter corresponds to the higher coherence of the obtained coordination geometry (Kumar et al., 2019a, 2019b, 2019c). According to the results, the central geometrical configuration of the lanthanide elements in complexes 1 and 2 are muffin-shaped (MFF-9, point group Cs), while the geometrical configuration of complexes 3–5 are biaugmented trigonal prism (BTPR-8, point group C2v). The calculated configurations are all consistent with the drawn configurations. In conclusion, the CShM values used to calculate the Ln(III) centers are essential for determining the structural differences.
3.1.2 Structural description of [Ln(2,4-DFBA)3(phen)]2, (Ln = La(1), Gd(2))
The crystal structure of 1 and 2 has a muffin-shaped spatial geometry (Fig. 2b), and this configuration was calculated (Madanhire et al., 2020) by the shape software. This configuration is used for complexes 1 and 2 with coordination number nine. Introduce complex 1 as an example in detail. The structural unit of complex 1 (Fig. 2a) consists of two central La(III), six 2,4-difluorobenzoate ligands, and two o-phenanthroline ligands. It has the same two central La(III) coordination environments as a binuclear molecule. Among them, the two nitrogen atoms (N1, N2) that were ligated with the central ion were derived from the o-phenanthroline ligand. The remaining seven oxygen atoms were all derived from the 2,4-difluorobenzoate ligand. Interestingly, these seven oxygen atoms have three coordination modes. They are bridged tri-dentate (O1#, O1, O2), bridged double-dentate (O3, O4), and double-dentate chelate (O5, O6). The bond length of the La-O bond ranges from 2.412(3)-2.801(3) Å. The critical length is similar to that reported in the literature (Shen et al., 2018, Zhu et al., 2018). The average bond length of the La-O bond is significantly longer than that of the other conformation of the complex, which is due to the bond length of La1-O1# involved in the tridentate coordination. As shown in Fig. 3a, through hydrogen bonding along the crystallographic c-axis, complex 1 formed a 1D chain structure. In addition, the adjacent structural units formed a 2D faceted supramolecular structure along the crystallographic ac-plane by C-H···F hydrogen bonding (Fig. 3b) with forces of 3.243 and 3.528 Å, respectively.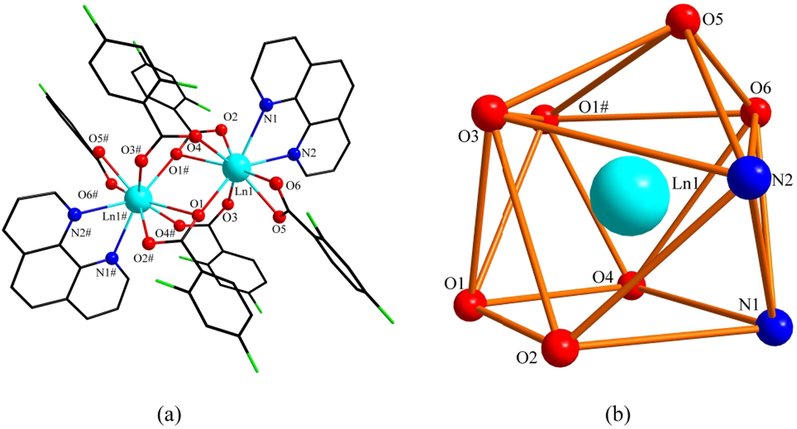
(a) Structural unit of complex 1 and 2 (Ln = La, Gd). (b)The polyhedral coordination environment of central Ln(III) (Ln = La, Gd).
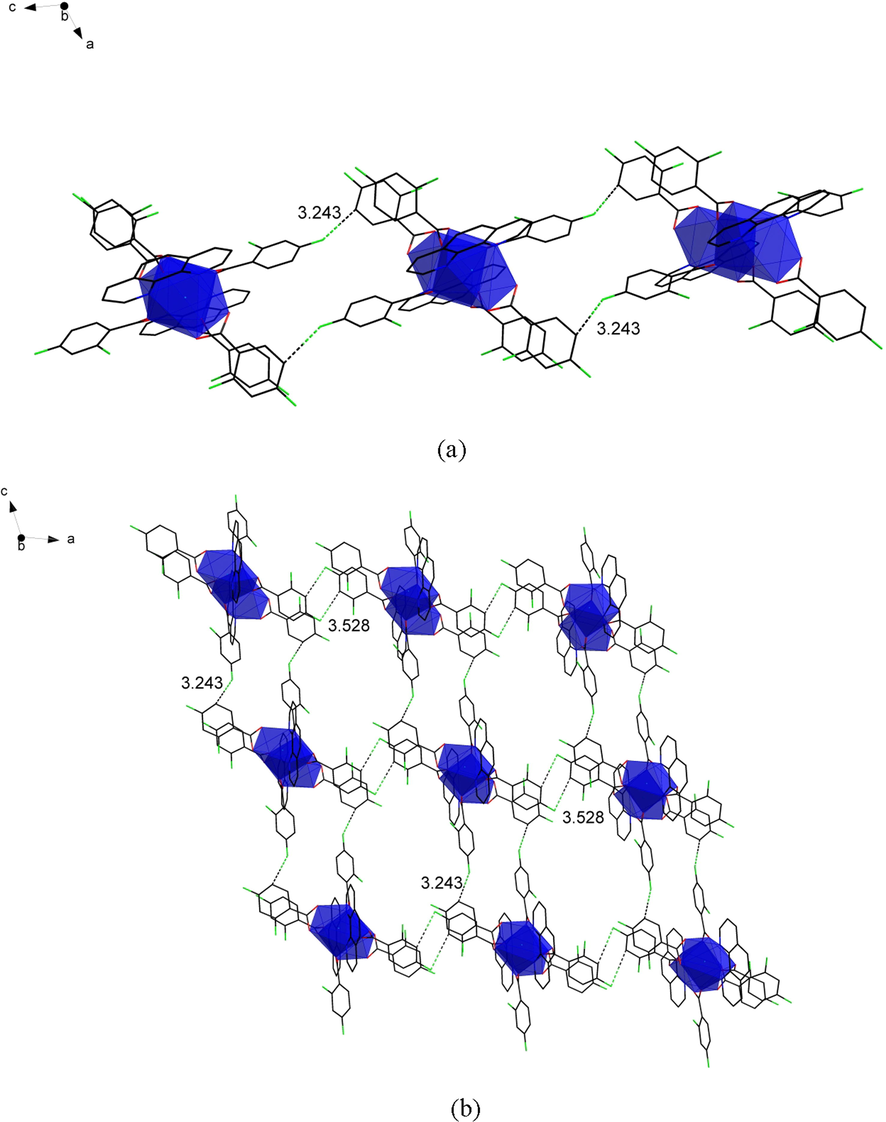
(a) The one-dimensional chain structure along the crystallographic c-axis. (b) The two-dimensional faceted supramolecular structure along the ac-plane.
3.1.3 Structural description of [Ln(2,4-DFBA)3(phen)]2, (Ln = Tb(3), Dy(4), Ho(5))
Fig. 4a shows the structural unit of complex 4, which can be seen as a binuclear molecule consisting of six 2,4-difluorobenzoate ligands and two o-phenanthroline ligands in coordination. The coordination environments of the two central Dy(III) are the same, and the coordination number is 8. The coordination environment is obtained as a biaugmented trigonal prism column after the calculation (Madanhire et al., 2020) of the shape software (Fig. 4b). Each central Dy(III) forms a coordination environment with two N atoms in one o-phenanthroline ligand (N1, N2) and six O atoms in five 2,4-difluorobenzoate ligands (O1, O2, O3, O4, O5, O6). A closer look reveals that the coordination of oxygen atoms is divided into two types, which are double-dentate chelation (O5, O6) and bridging double-dentate (O1, O2, O3, O4). The two central Dy(III) are connected by four 2,4-difluorobenzoate ligands (O1, O2, O3, O4, O1#, O2#, O3#, O4#) in a bridging double-dentate coordination mode. The bond lengths of Dy1-O bonds range from 2.273(5)-2.430(5) Å with an average bond length of 2.350(5) Å. The average bond length of Dy1-N is 2.546(5) Å. This is similar to the previously reported (Casanovas et al., 2021) ranges for the same species of chemical bonds. To further investigate the crystal structure, the one-dimensional chain-like structure of complex 4 along the crystallographic c-axis direction (Fig. 5a) and the two-dimensional faceted (Fig. 5b) supramolecular design along the crystallographic bc-plane direction was drawn. As shown in the figure, the adjacent structural units form a one-dimensional chain in the crystallographic c-axis direction by C-H···F hydrogen bonding. The hydrogen bonding force is formed by the F4 in the bridging bidentate coordination of 2,4-difluorobenzoate and the C(20)H(20) in the bidentate chelate coordination in the adjacent structural unit with a weak force distance of 3.143 Å. The adjacent one-dimensional chains are in turn interconnected by C-H···F hydrogen bonding, forming a two-dimensional faceted supramolecular structure on the bc surface. Both hydrogen bonding interactions are created by the forces of C(20)H(20) in the 2,4-difluorobenzoate ligand using the bidentate chelate coordination mode and F(4) in the 2,4-difluorobenzoate using the bridging bidentate coordination mode. The distances were 3.143 and 3.406 Å, respectively. In analogy to the previously reported (Du et al., 2021) [Ho(2-FBA)3(5,5‘-DM-2,2‘-bipy)]2, the hydrogen bond length is in the appropriate range.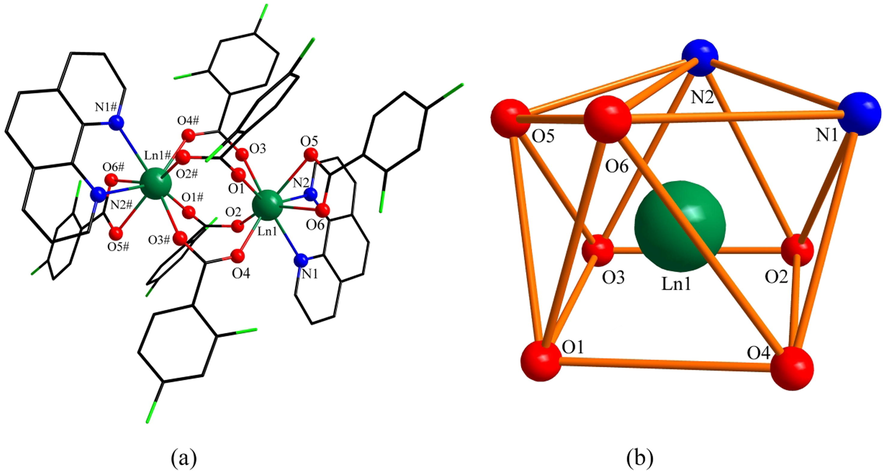
(a) Structural unit of complex 3, 4 and 5 (Ln = Tb, Dy, Ho). (b)The polyhedral coordination environment of the central Ln(III) (Ln = Tb, Dy, Ho).
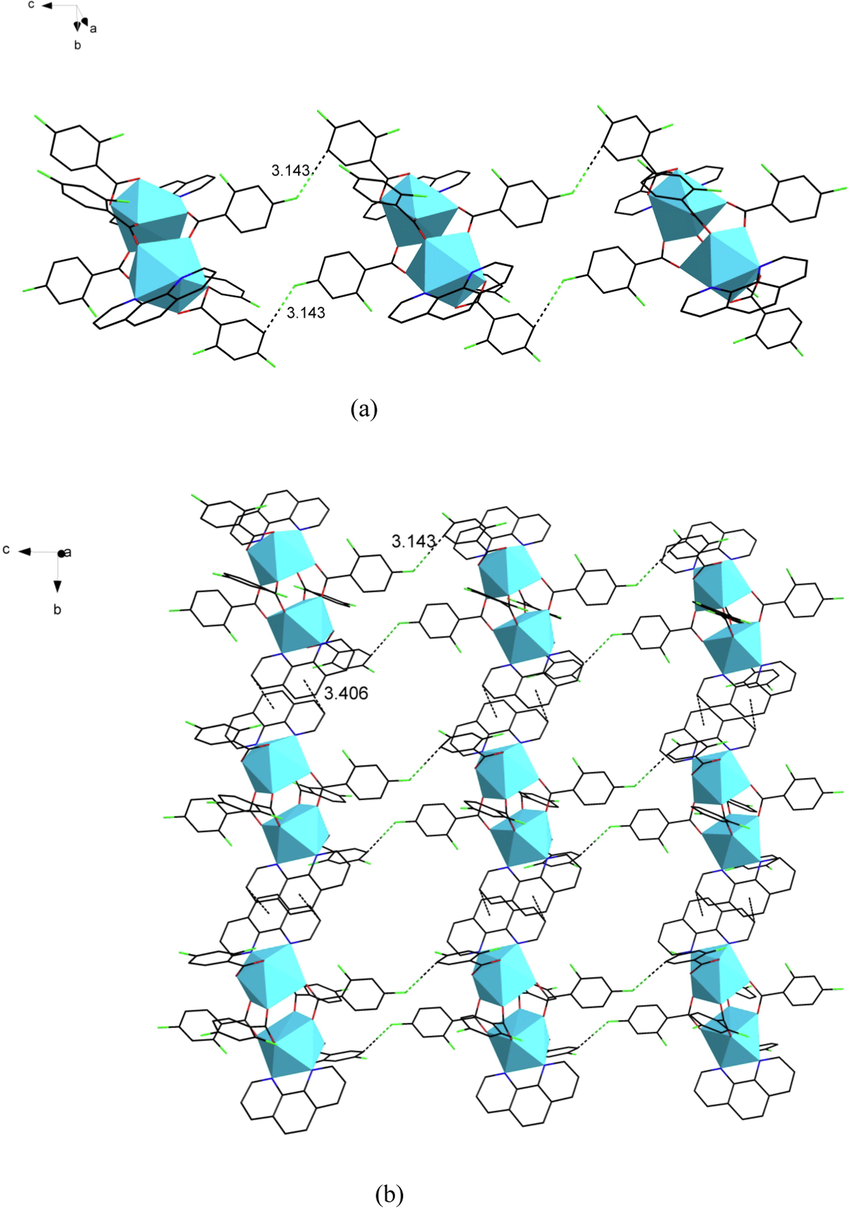
(a) The one-dimensional chain structure along the crystallographic c-axis. (b) The two-dimensional faceted supramolecular structure along the bc-plane.
3.1.4 Comparison of two different crystal structures
Interestingly, single-crystal X-ray diffraction shows that the two crystal structures have the same monoclinic crystal system and P21/n space group. Since complexes 1–5 are isostructural, the selected bond lengths and bond angles were compared. The values were found to be similar to those previously reported (Shen et al., 2018, Zhao et al., 2018, Zhao et al., 2021), which again confirms the accuracy of the synthesized new structures. Although the general structural formula is the same, there are apparent differences in the coordination mode. The first type of structure (complexes 1 and 2) has one more bridged tri-dentate than the coordination pattern of the second type of structure (complexes 3, 4, and 5). This leads to a muffin-like centered geometric configuration with coordination number 9 for the first type of structure and a biaugmented trigonal prism geometric configuration with coordination number 8 for the second type of structure. In the resulting supramolecular structures, 1D chain structures of both structures are formed by C-H···F hydrogen bonding. The difference lies in the 2D faceted structure, while the second type of structure uses π-π stacking interactions to create a 2D facet.
3.2 Infrared and Raman spectra
IR and Raman spectra are shown in Fig. 6. It can be observed from the figure that the spectra of the two ligands are very different from those of the five complexes, indicating the successful synthesis of the new complexes. And the spectral morphologies of the five complexes were the same, indicating similar structures.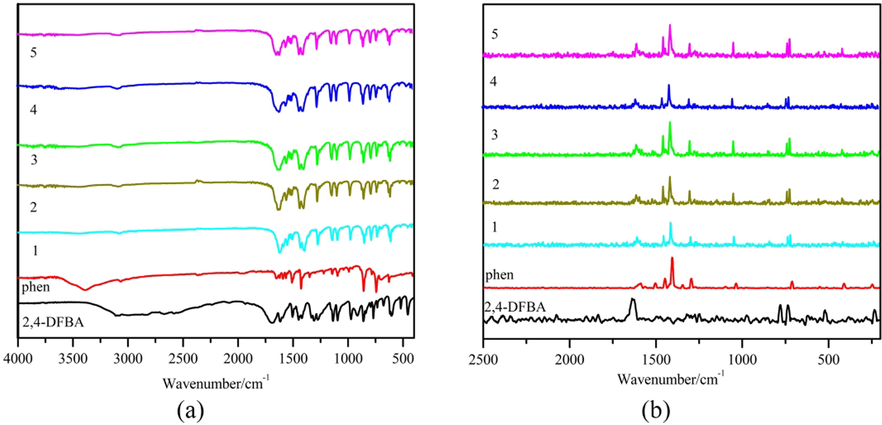
(a) Infrared spectra of complexes 1–5 and ligands. (b) Raman spectra of complexes 1–5 and ligands.
Supporting information Table S6 shows the IR and Raman spectral data. The absorption peaks of the 2,4-difluorobenzoate located at νC=O (IR: 1691 cm−1, R: 1634 cm−1) completely disappeared after the formation of the complexes. In contrast, the spectrograms of the complexes showed new absorption peaks νas(coo–) (IR: 1616–1610 cm−1, R: 1620–1614 cm−1) and νs(coo–) (IR: 1431–1427 cm−1, R: 1416–1415 cm−1), which indicates the involvement of oxygen atoms in the formation of coordination sites in the acidic ligands. The differences between the bands (Δ = νas(coo–) - νs(coo–)) reflect the coordination pattern (Deacon and Phillips, 1980) of the carboxylate with Ln(III). The spectral band differences of all the complexes were in the range of 189–179 cm−1, indicating that the coordination modes were chelate and bridging mode. Furthermore, the appearance of the characteristic absorption peak of νLn-O in the complex spectrogram (IR: 419–417 cm−1, R: 423–417 cm−1) confirms the above view (Wang et al., 2015). The νC=N absorption peak of o-phenanthroline at (IR: 1560 cm−1, R: 1507 cm−1) shifts the wavenumber to the high wavenumber region after the formation of the complex, and a blue shift occurs, representing lower energy required for the vibration and a more stable complex moiety is formed (Hermansson et al., 2009). The characteristic absorption peak of νLn-N (R: 242–240 cm−1) was also observed in the Raman spectrum. This further suggests that the lanthanide atoms form coordination bonds with the nitrogen atoms in the o-phenanthroline (Ye et al., 2010).
3.3 Powder X-ray diffraction
Experiments with X-ray powder diffraction at room temperature were conducted on complexes 1–5 and their ligands. The two different structures of complexes 1 and 4 are used as an introduction. It can be seen in Fig. 7 (a) that the peak patterns of the complex powders 1–5 are the same, indicating that these five complexes have the same molecular structure general formula. The single crystal CIF data of complexes 1 and 4 were fitted to obtain the corresponding fitted plots Simulated 1 and Simulated 4. As shown in Fig. 7 (b), the peak pattern of the complex is different from that of the two ligands, indicating that the complex forms a new phase rather than a simple summation of the two ligands (Wu et al., 2019). In addition, the diffraction peaks of each complex powder are consistent with the data of their single-crystal CIF fits, which further indicates that the obtained complex powders have the same structure as their corresponding single crystals and the complexes are relatively pure (Zhu et al., 2019).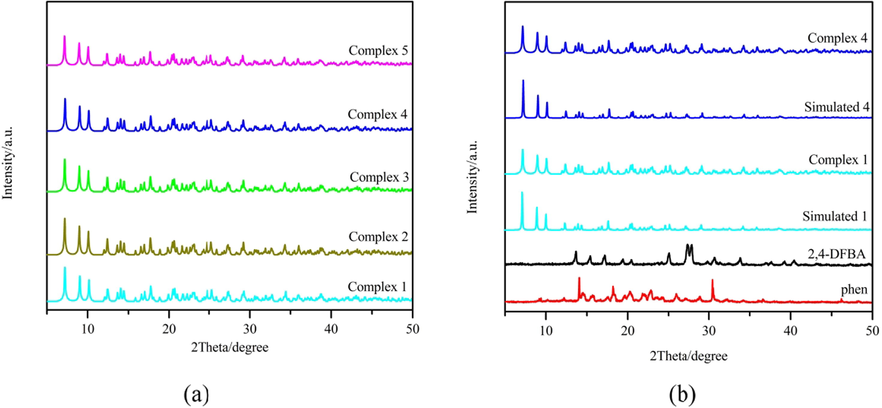
(a) XRD curves of complexes 1–5. (b) XRD curves of ligands and complexes 1 and 4.
3.4 Thermal analysis
Thermal stability is a measure of the physicochemical properties of substances. Supporting information Fig. S1 shows the curves of the thermal decomposition process of the five complexes. The collected thermal decomposition data are shown in supporting information Table S7. The thermal decomposition processes of complexes 1–3 are consistent, and complex 1 is used as an example to introduce them in detail. From Fig. S1 (a), it can be seen that the complex is decomposed in two steps. The first decomposition step occurred in the temperature range 494.15–691.15 K with a weight loss of 60.58%, corresponding to the loss of two o-phenanthroline ligands and part 2,4-difluorobenzoate ligands. The second decomposition step occurred within 691.15–1009.15 K with a weight loss percentage of 18.21%, corresponding to the loss of the remaining 2,4-difluorobenzoate. The final decomposition product was La2O3, and the experimental total weight loss for the two-step decomposition was 78.79%, which was similar to the theoretical total weight loss of 79.39%. The thermal decomposition process of complexes 4 and 5 are similar and accomplished in three steps. 2,4-difluorobenzoate is lost in multiple stages, which is different from complexes 1–3. The final decomposition products are the corresponding metal oxides (Zhu et al., 2019).
During the thermal decomposition, the infrared escape gases of the five complexes accumulate in three-dimensional space (Fig. S2). The strongest signal peaks in the 3D stacking diagram at each decomposition stage were solved. The IR spectra of the strongest signal peaks at different temperatures were plotted and displayed in supporting information Fig. S3.
Complexes 1–3 have two stacking peaks, and complexes 4 and 5 have three stacking peaks, which is consistent with the thermal decomposition process. Take complexes 1 and 4 as examples. For complex 1, the strongest signal of the first decomposition phase was observed at 619.15 K. The characteristic absorption peaks of small organic fragments of o-phenanthroline ligand decomposition were observed, which were νC=N at 1611 cm−1, νC-N at 1232 and 1257 cm−1, νC-H at 3188–3083 cm−1, and γC-H (772, 1050, 1130 cm−1). In addition to this, a CO2 bending vibration peak at 672 cm−1 and an asymmetric stretching vibration peak at 2366 cm−1 was also observed. This is due to the partial decomposition of 2,4-difluorobenzoate. The strongest peak of the signal in the second decomposition stage at 732.15 K. The bending vibration peak, and the asymmetric stretching vibration peak of carbon dioxide (672, 2361 cm−1) are visible in the figure, while the vibration peak of water molecules is not obvious, which may be due to the small amount of production that the instrument cannot detect. The strongest signal peak of complex 4 (Fig. S3d) appears at three temperature nodes, 621.15 K, 773.15 K, and 820.15 K, respectively. The absorption peak of small organic fragments of o-phenanthroline decomposition was observed in the first stage. For example, νC=N (1607 cm−1), νC=C (1438, 1489 cm−1), νC-N (1231, 1257 cm−1), νC-H (3453–3032 cm−1) and γC-H (768, 1046, 1126 cm−1). At the same time, characteristic absorption peaks of the fugitive gases H2O (3883–3580 cm−1) and CO2 (671, 2357–2311 cm−1) were also observed, which are due to partial decomposition of 2,4-difluorobenzoate ligands. The strongest signal peaks of the second and third steps are the same, with temperatures of 773.15 K and 820.15 K, H2O (3753–3664 cm−1) and CO2 (671, 2361–2311 cm−1) were observed, proving the loss was of the remaining 2,4-difluorobenzoate. In summary, the products of each decomposition stage corresponded to the results obtained from the thermogravimetric analysis.
3.5 Luminescence spectrum
Fig. 8 illustrates that the emission spectrum of Tb3+ at 353 nm as the excitation wavelength shows four distinct characteristic emission peaks (Zhao et al., 2004). They are 5D4→7FJ (J = 5, 4, 3, 2), respectively located at 490, 544, 586, 623 nm. Due to the appearance of the polycrystalline state of complex 3, the presence of the crystal field leads to the splitting of the characteristic 5D4→7F5 emission peak located at 544 nm. Meanwhile, the 5D4→7F5 characteristic emission peak is the most substantial jump peak, which is why the green fluorescence (Xiao et al., 2017) of complex 3 under UV light. The green area in the CIE coordinates (0.3527,0.5793; Fig. 8, inset) also supports this conclusion. Due to the strong fluorescence performance of Tb3+, the double exponential function equation (Lee et al., 2010) I(t) = B1exp(-t/τ1) + B2exp(-t/τ2) was fitted, and the fitted equation τ=(B1τ12 + B2τ22)/(B1τ1 + B2τ2) was used to calculate the fluorescence lifetime of complex 3 as 1.693 ms (Fig. 10). For complex 4, a distinct broadband absorption peak appears in the excitation spectrum, which is due to the π-π* electron leap of the organic ligand. Two characteristic leap peaks of Dy3+ can be observed (Carter et al., 2014) in the emission spectra. They are the characteristic transition peak of 4F9/2→6H15/2 located at 481 nm and the characteristic leap peak of 4F9/2→6H13/2 located at 574 nm, respectively. Complex 4 is located in the yellow area at coordinates (0.3775,0.4269; Fig. 9, inset).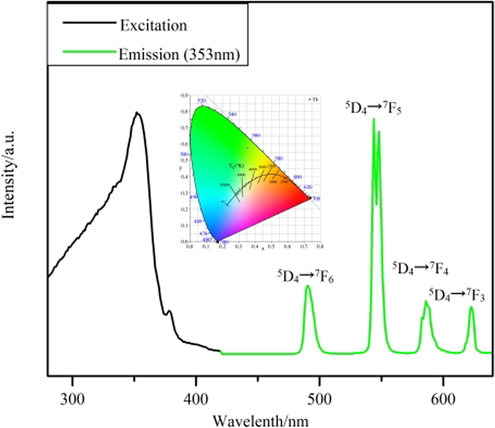
Fluorescence spectrum of complex 3.
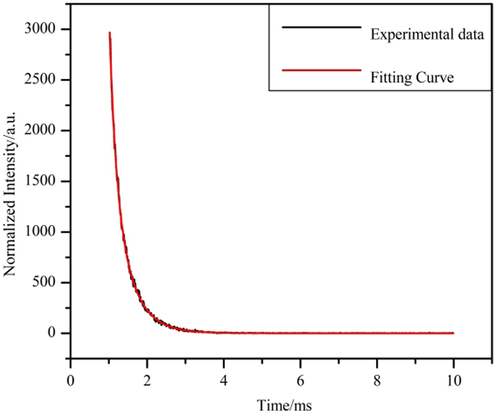
Fluorescence lifetime decay curve of complex 3.
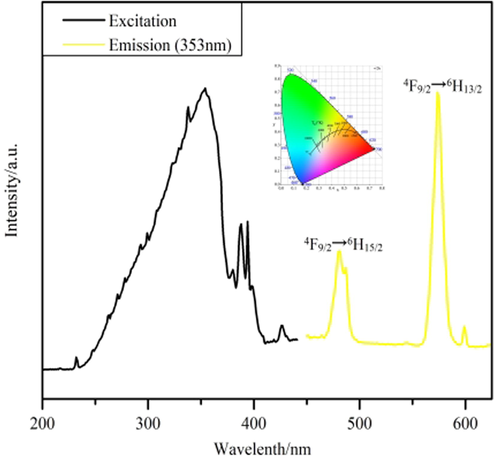
Fluorescence spectrum of complex 4.
3.6 Energy transfer of ligands and lanthanide ion
The phenomenon of luminescence of lanthanide complexes can be explained by the energy transfer between ligands and lanthanide ions. Energy transfer between the ligand and the lanthanide ion depends on the degree of matching between the triplet excited state and the resonance energy level of the lanthanide ion. According to Reinhoudt's rule of thumb, if the difference between the lowest singlet and lowest triplet energy levels of the same ligand is more excellent than 5000 cm−1, it can be considered an effective inter-system scramble process (Segall et al., 2002). According to Latvia's rule (Latva et al., 1997) of thumb, the lowest triplet state of the ligand should be 5000–2000 cm−1 higher than the lowest emission energy level of the lanthanide ion for optimal energy transfer.
The energy level calculations of the ligands are performed on a computer using the Gaussian09 series program package for simulations. The highest occupied molecular orbitals and the lowest unoccupied molecular orbitals of the ligands were investigated at the level of the 6-311G(d,p) group using the B3LYP method in density generalization theory (Karabacak et al., 2011), and the results are shown in supporting information Table S8. On this basis, the ligands' single and triplet state energy levels were calculated, and the obtained data are shown in supporting information Table S9. The energy levels of the o-phenanthroline were estimated to be 32,206 and 23,095 cm−1, with an energy gap of 9111 cm−1. Similarly, the energy levels of the acidic ligand 2,4-difluorobenzoic acid were 40,123 cm−1 for the single heavy state and 28,766 cm−1 for the triplet state, with an energy gap difference of 11,537 cm−1. This shows that both o-phenanthroline and 2,4-difluorobenzoic acid ligands can undergo an effective interlinear scramble process. The lowest emission energy levels (Dejneka Matthew et al., 2003, Tsaryuk et al., 2017) of Tb(III) and Dy(III) are usually considered to be 20,430 cm−1 and 21,300 cm−1, and the energy differences between the lowest triplet state of the ligand and the lowest emission energy level of the Ln(III) ion are 2665 and 1795 cm−1, respectively. This suggests that o-phenanthroline is an effective molecular fluorescence sensitizer that enhances the fluorescence intensity of Tb(III).
3.7 Molar heat capacity properties and thermodynamic function calculations
As a result of differential scanning calorimetry (DSC) and specific heat comparison, the molar heat capacities of complexes 4 and 5 were determined in the temperature range of 260.15 to 386.15 K. As shown in Fig. 11, the molecular vibrational energies are similar because the structures of the two complexes are similar, and their molar heat capacity curves almost overlap. With the increase in temperature, the curves increased smoothly without interruptions. No phase change peaks appeared, indicating that the two complexes were structurally stable in the temperature range of 260.15–386.15 K without any phase change, conjugation, or decomposition processes. Again, this indicates that the substance is more stable in this temperature interval. In the experimental temperature range, the temperature was fitted using the equation x = [T-(Tmax + Tmin)/2]/[(Tmax-Tmin)/2] to obtain the folded temperature x. The experimentally obtained values of Cp,m were subsequently used as y, a polynomial fit to the folded temperature x yields polynomial equations for the two complexes.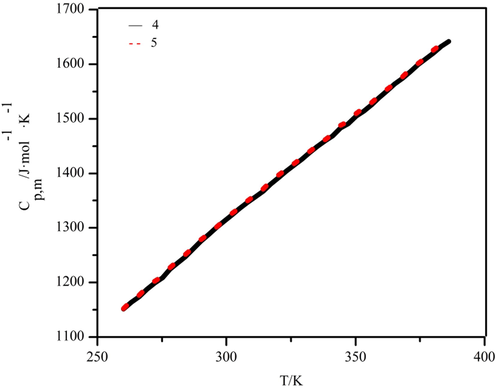
Curves of the average molar heat capacity of complexes 4 and 5 with temperature.
Complex 4:[Dy(2,4-DFBA)3(phen)]2.
Cp,m/J·mol−1·K−1 = 1403.29077 + 231.50551x-8.36579x2 + 42.15143x3-1.16524x4-28.57373x5 + 3.36235x6.
R2 = 0.99993 SD = 1.29285.
Complex 5:[Ho(2,4-DFBA)3(phen)]2.
Cp,m/J·mol−1·K−1 = 1406.64493 + 235.43261x-9.76328x2 + 26.76058x3 + 0.98861x4-14.59546x5 + 3.08112x6.
R2 = 0.9995 SD = 1.11518.
R2 is the correlation coefficient, and SD is the standard deviation.
The polynomial equation obtained above is brought into the following thermodynamic equation.
The reference temperature was set at 298.25 K. The values of smooth molar thermal melting, and thermodynamic functions of the two complexes were calculated at 3 K intervals. The data are shown in supporting information Table S10 and Table S11.
4 Conclusion
In summary, five new lanthanide complexes were successfully synthesized [Ln(2,4-DFBA)3(phen)]2, (Ln = La(1), Gd(2), Tb(3), Dy(4), Ho(5); 2,4-DFBA = 2,4-difluorobenzoate, phen = o-phenanthroline). Although the measured structures have the same structural formula and belong to the same space group (P21/n), the coordination geometry configuration is divided into two types, which are the muffin with coordination number 9 and the biaugmented trigonal prism with coordination number 8. Besides, different forces form different 2D faceted supramolecular structures. One type has only a single C-H···F hydrogen bonding force, and the other contains π-π stacking interaction. This is due to the contraction of the lanthanum system. The thermal analysis of these complexes by TG-DSC/FTIR technique showed that the two configurations were decomposed in two or three steps and the end products were all the corresponding rare earth oxides. The fluorescence properties of complexes 3 and 4 were investigated, exhibiting characteristic transition peaks for specific Ln(III) ions. The fluorescence lifetime of complex 3 is 1.693 ms, which is expected to be a new type of luminescent material. Finally, the thermodynamic parameters of complexes 4 and 5 were calculated from the fitted polynomials and thermodynamic equations. Both complexes were thermodynamically stable in the range of 260.15–386.15 K, and there were no abnormal thermal phenomena.
Author contribution
For the author of this article, made a simple explanation. The author Chen-Lu Wang is mainly responsible for the synthesis and characterization of all complexes in this paper, as well as the drafting and first draft of this paper. The author Ning Ren, is mainly responsible for the thermal analysis of complexes in this paper. The author is Jin-Ying Zhang and Xiao-Yan Li, mainly responsible for the technical support of quantum chemical computation. The author Jian-Jun Zhang is mainly responsible for the design of the project and the revision of the paper.
Acknowledgement
This research work was financially supported by the National Natural Science Foundation of China (No. 21803016 and No. 21473049).
Declaration of Competing Interest
The authors declare that they have no known competing financial interests or personal relationships that could have appeared to influence the work reported in this paper.
References
- Stereochemistry of complexes with double and triple metal-ligand bonds: a continuous shape measures analysis. Inorg. Chem.. 2014;53:12151-12163.
- [CrossRef] [Google Scholar]
- Resolving the nature of the reactive sites of phenylsulfinate (PhSO2-) with a single general-purpose reactivity indicator. Comput. Theor. Chem.. 2014;1043:1-4.
- [CrossRef] [Google Scholar]
- Solvothermal self assembly of three lanthanide(III)-succinates: Crystal structure, topological analysis and DFT calculations on water channel. J. Mol. Struct.. 2021;1245
- [CrossRef] [Google Scholar]
- Emerging La2O2CN2 matrix with controllable 3D morphology for photoluminescence applications. CrystEngComm.. 2017;19:6498-6505.
- [CrossRef] [Google Scholar]
- Lanthanide-based metal-organic-frameworks for proton conduction and magnetic properties. Eur. J. Inorg. Chem.. 2021;2021:4610-4618.
- [CrossRef] [Google Scholar]
- Structural, photoluminescent properties and Judd-Ofelt analysis of Eu3+-activated CaF2 nanocubes. J. Alloys Compd.. 2020;813:152194
- [CrossRef] [Google Scholar]
- A series of Ln-p-chlorobenzoic acid–terpyridine complexes: lanthanide contraction effects, supramolecular interactions and luminescent behavior. CrystEngComm.. 2014;16:1873-1884.
- [CrossRef] [Google Scholar]
- Field-induced SMM and Vis/NIR luminescence on mononuclear lanthanide complexes with 9-Anthracenecarboxylate and 2,2′:6,2″-terpyridine. Magnetochemistry.. 2021;7:124.
- [CrossRef] [Google Scholar]
- Bifunctional up-converting lanthanide nanoparticles for selective in vitro imaging and inhibition of cyclin D as anti-cancer agents. J. Mater. Chem. B.. 2014;2:84-91.
- [CrossRef] [Google Scholar]
- The maximum hardness principle implies the hard/soft acid/base rule. J. Chem. Phys.. 2005;123:086101
- [CrossRef] [Google Scholar]
- Tris(cyclopentadienyl)lanthanide complexes as catalysts for hydroboration reaction toward aldehydes and ketones. Org. Lett.. 2017;19:3382-3385.
- [CrossRef] [Google Scholar]
- Vibrational study of calcium salt of pyridine-2-phospho-4-carboxylic acid. Chem. Phys. Lett.. 2008;451:127-131.
- [CrossRef] [Google Scholar]
- Relationships between the carbon-oxygen stretching frequencies of carboxylato complexes and the type of carboxylate coordination. Coordin. Chem. Rev.. 1980;33:227-250.
- [CrossRef] [Google Scholar]
- The synthesis of novel oxygen-containing ligands derived from amine precursors. Tetrahedron Lett.. 1997;38:1261-1264.
- [CrossRef] [Google Scholar]
- A series of lanthanide complexes with 2-fluorobenzoic acid and 5,5′-dimethyl-2,2′-bipyridine: Synthesis, supramolecular structures, spectroscopy and thermal behaviour. J. Solid State Chem.. 2021;300:122198
- [CrossRef] [Google Scholar]
- Complexation of ytterbium to human transferrin and its uptake by K562 cells. Eur. J. Biochem.. 2002;269:6082-6090.
- [CrossRef] [Google Scholar]
- Synthesis and characterization of volatile, fluorine-free β-ketoiminate lanthanide MOCVD precursors and their implementation in low-temperature growth of epitaxial CeO2 buffer layers for superconducting electronics. Inorg. Chem.. 2002;41:5005-5023.
- [CrossRef] [Google Scholar]
- Syntheses, structures and properties of silver(I) complexes constructed from nitrogenous aromatic heterocyclic carboxylic acids and N-donor ligands. Inorg. Chem. Commun.. 2014;46:194-197.
- [CrossRef] [Google Scholar]
- Coordination polymers based on inorganic lanthanide(III) sulfate skeletons and an organic isonicotinate N-oxide connector: Segregation into three structural types by the lanthanide contraction effect. Inorg. Chem.. 2005;44:862-874.
- [CrossRef] [Google Scholar]
- Anharmonic OH vibrations in Mg(OH)2 (brucite): two-dimensional calculations and crystal-induced blueshift. J. Chem. Phys.. 2009;131:244517
- [CrossRef] [Google Scholar]
- Sodium alginate/carboxyl-functionalized graphene composite hydrogel via neodymium ions coordination. J. Mater Sci. Technol.. 2017;33:821-826.
- [CrossRef] [Google Scholar]
- Structural and spectroscopic characterization of 2,3-difluorobenzoic acid and 2,4-difluorobenzoic acid with experimental techniques and quantum chemical calculations. Spectrochim. Acta. A Mol. Biomol. Spectrosc.. 2011;79:1511-1519.
- [CrossRef] [Google Scholar]
- A series of 3D lanthanide coordination polymers decorated with a rigid 3,5-pyridinedicarboxylic acid linker: syntheses, structural diversity, DFT study, Hirshfeld surface analysis, luminescence and magnetic properties. Dalton Trans.. 2018;47:12318-12336.
- [CrossRef] [Google Scholar]
- Lanthanide contraction in action: structural variations in 13 lanthanide(III) thiophene-2,5-dicarboxylate coordination polymers (Ln = La–Lu, except Pm and Tm) featuring magnetocaloric effect, slow magnetic relaxation, and luminescence-lifetime-based thermometry. Cryst. Growth Des.. 2020;20:6430-6452.
- [CrossRef] [Google Scholar]
- Magnetic, luminescence, topological and theoretical studies of structurally diverse supramolecular lanthanide coordination polymers with flexible glutaric acid as a linker. New J. Chem.. 2019;43:14546-14564.
- [CrossRef] [Google Scholar]
- 2,5-Furandicarboxylic acid as a linker for lanthanide coordination polymers: the role of heteroaromatic π–π stacking and hydrogen bonding. New J. Chem.. 2019;43:2179-2195.
- [CrossRef] [Google Scholar]
- A series of lanthanide-based metal-organic frameworks derived from furan-2,5-dicarboxylate and glutarate: structure-corroborated density functional theory study, magnetocaloric effect, slow relaxation of magnetization, and luminescent properties. Inorg. Chem.. 2019;58:7760-7774.
- [CrossRef] [Google Scholar]
- Correlation between the lowest triplet state energy level of the ligand and lanthanide(III) luminescence quantum yield. J. Lumin.. 1997;75:149-169.
- [CrossRef] [Google Scholar]
- Time variation of fluorescence lifetime in enhanced cyan fluorescence protein. J. Lumin.. 2010;130:1300-1304.
- [CrossRef] [Google Scholar]
- Supramolecular structures, thermal decomposition mechanism and heat capacity of the novel binuclear Tb(III) and Dy(III) complexes with 2,3-dimethoxybenzoic acid and 5,5′-dimety-2,2′-bipyridine. J. Therm. Anal. Calorim.. 2020;140:2435-2445.
- [CrossRef] [Google Scholar]
- Highly stereoselective coordination polymerization of beta-myrcene from a lanthanide-based catalyst: Access to bio-sourced elastomers. J. Polym. Sci. Part A: Polym. Chem.. 2012;50:2898-2905.
- [CrossRef] [Google Scholar]
- Synthesis, characterisation and anticancer activity screening of lanthanide(III) acetate complexes with benzohydrazone and nicotinohydrazone ligands. Polyhedron.. 2020;184:114560
- [CrossRef] [Google Scholar]
- Modern approaches to the tuning of the Lanthanide(3+) coordination compound luminescent characteristics: a review. Theor. Exp. Chem.. 2019;55:293-315.
- [CrossRef] [Google Scholar]
- Biological and clinical aspects of lanthanide coordination compounds. Bioinorg. Chem. Appl.. 2004;2
- [CrossRef] [Google Scholar]
- DIAMOND - Visual crystal structure information system. J. Appl. Cryst.. 1999;32:1028-1029.
- [CrossRef] [Google Scholar]
- Sensitive magnetic-field-response magnetization dynamics in a one-dimensional dysprosium coordination polymer. Inorg. Chem. Front.. 2021;8:4657-4665.
- [CrossRef] [Google Scholar]
- First-principles simulation: ideas, illustrations and the CASTEP code. J. Phys. Condens. Matter.. 2002;14:2717-2744.
- [CrossRef] [Google Scholar]
- Coordination polymers of manganese(II), cobalt(II), nickel(II) and cadmium(II) decorated with rigid pyrazine-2,3-dicarboxylic acid linker: Synthesis, structural diversity, DFT study and magneto-luminescence properties. Polyhedron. 2020;187
- [CrossRef] [Google Scholar]
- Crystal structures, luminescent and thermal properties of lanthanide complexes with 3,4-dimethylbenzoic acid and 2,2′-bipyridine. J. Therm. Anal. Calorim.. 2018;131:1699-1707.
- [CrossRef] [Google Scholar]
- Luminescent lanthanide complexes as analytical tools in anion sensing, pH indication and protein recognition. Analyst. 2011;136:431-435.
- [CrossRef] [Google Scholar]
- Crystal growth, layered structure and luminescence properties of K2Eu(PO4)(WO4) RSC Adv.. 2022;12:8901-8907.
- [CrossRef] [Google Scholar]
- Performance of B3LYP density functional methods for a large set of organic molecules. J. Chem. Theory Comput.. 2008;4:297-306.
- [CrossRef] [Google Scholar]
- Structures and optical spectroscopy of lanthanide trifluoroacetates obtained from hexafluoroacetylacetone. J. Fluorine Chem.. 2017;197:87-93.
- [CrossRef] [Google Scholar]
- Luminescence properties and crystal structure of europium complexes with phenoxyacetic acid and 2,4,6-tri(2-pyridyl)-s-triazine. J. Lumin.. 2015;160:238-244.
- [CrossRef] [Google Scholar]
- Crystal and electronic structure of poly-halogenated lanthanide Schiff base complex: Insights into halogen bond from structural and theoretical analysis. J. Mol. Struct.. 2021;1225:129054
- [CrossRef] [Google Scholar]
- Crystal structure, thermochemical and fluorescent properties of two novel binuclear lanthanide complexes with 3-chloro-4-methoxybenzoic acid and 5,5′-dimethy-2,2′-bipyridine. J. Chem. Thermodyn.. 2019;132:476-483.
- [CrossRef] [Google Scholar]
- Rare earth metal–organic complexes constructed from hydroxyl and carboxyl modified arenesulfonate: syntheses, structure evolutions, and ultraviolet, visible and near-infrared luminescence. Dalton Trans.. 2017;46:16493-16504.
- [CrossRef] [Google Scholar]
- Crystal structures, luminescent and thermal properties of a new series of lanthanide complexes with 4-ethylbenzoic acid. New J. Chem.. 2010;34:533-540.
- [CrossRef] [Google Scholar]
- Coordination polymers containing 1D channels as selective luminescent probes. J. Am. Chem. Soc.. 2004;126:15394-15395.
- [CrossRef] [Google Scholar]
- Lanthanide complexes with 2,6-dimethylbenzoic acid and 2,2′:6′,2′′-terpyridine: Crystal structures, thermochemical property and luminescent behavior. Thermochim. Acta.. 2021;699:178915
- [CrossRef] [Google Scholar]
- Syntheses, crystal structures, luminescence and thermal properties of three lanthanide complexes with 2-bromine-5-methoxybenzoate and 2,2:6′,2″-terpyridine. Polyhedron.. 2018;144:1-5.
- [CrossRef] [Google Scholar]
- Crystal structure, thermal decomposition mechanism and properties of lanthanide supramolecular complexes based on 2,4,6-trimethylbenzoic acid and 5,5’-dimethyl-2,2’-bipyridine. Acta Phys. Chim. Sin.. 2021;37:2004071.
- [CrossRef] [Google Scholar]
- Two novel Sm(III) complexes with different aromatic carboxylic acid ligands: Synthesis, crystal structures, luminescence and thermal properties. Polyhedron.. 2019;158:485-493.
- [CrossRef] [Google Scholar]
- Rare earth complexes with 3,4-dimethylbenzoic acid and 5,5′-dimethyl-2,2′-bipyridine. J. Therm. Anal. Calorim.. 2018;136:873-883.
- [CrossRef] [Google Scholar]
Appendix A
Supplementary data
Supplementary data to this article can be found online at https://doi.org/10.1016/j.arabjc.2022.104089.
Appendix A
Supplementary data
The following are the Supplementary data to this article:Supplementary data 1
Supplementary data 1


