

Translate this page into:
The optimization of silica gel synthesis from chemical bottle waste using response surface methodology
⁎Corresponding author. yatimnikmah@gmail.com (Yatim Lailun Ni'mah)
-
Received: ,
Accepted: ,
This article was originally published by Elsevier and was migrated to Scientific Scholar after the change of Publisher.
Peer review under responsibility of King Saud University.
Abstract
To reduce the amount of hazardous chemical bottle waste in the environment, we report the optimization research of silica extraction in chemical bottle waste into silica gel. Alkali fusion and sol–gel process were utilised to prepare silica gel effectively. The alkali fusion process was carried out by adding sodium hydroxide to produce sodium silicate. Afterwards, silica gel was prepared by the sol–gel method using hydrochloric acid. Box-Behnken Design (BBD) was applied to Optimisation factors the poptimiseactors affecting the silica recovery. The factors that optimised mass ratio, particle size, and temperature. The optimum recovery of silica gel was obtained by SiO2: NaOH mass ratio of 1:3, the particle size of 63–74 µm, and a temperature of 800 °C. The purity of silica gel optimum is 63.74% characterised using X-ray fluorescence. The structure of silica gel is the appearance of amorphous peaks at 2θ 20-30° characterised using an x-ray diffractogram. The silica gel surface was characterises using scanning electron microscopy-energy dispersive x-ray. It showed an irregular surface and characteristic showed that silica gel had a radius of 15.74 nm and a specific surface area of 297.08 m2.
Keywords
Silica Gel
Chemical bottle waste
Alkali decomposition
Sol-gel method
Box-Behnken design

- BBD
-
Box-Behnken Design
- RSM
-
Response Surface Methodology
Abbreviations
1 Introduction
Glass waste in Indonesia reaches 0.7 tons per year (Alkatiri et al., 2017). One of them is chemical bottle waste. Glass bottle waste is inorganic waste and is classified as hazardous waste. Chemical bottle waste cannot be decomposed naturally. So far, glass bottle waste has been utilised as a mixture of building materials. The chemical glass bottle waste was used depending on its composition (Kafillah and Alimuddin, 2018). The content of glass waste generally contains silica (65–75%), sodium oxide (12–15%), and calcium (6–12%) (Owoeye et al., 2020). While the chemical bottle waste or borosilicate glass which contains silica (SiO2) and boron oxide (B2O3 > 8%) as glass network forming, and is typically composed of 70–80 % SiO2, 7–13% of B2O3, 4–8% of Na2O or K2O, and 2–8% of Al2O3 (Hasanuzzaman et al., 2016). The high silica content makes the chemical bottle waste a potential material to be converted as a sodium silicate precursor to produce silica gel (Owoeye et al., 2021). Silica extraction from chemical glass bottle waste is more effective than silica from pure quartz because it requires lower energy (Owoeye et al., 2020).
Silica gel obtained from silicate compounds has a specific surface area and pore volume properties. These properties were due to the presence of silanol groups on the surface of silicate compounds (Hayati et al., 2017; Mitra et al., 2016; Mota et al., 2017; Saliba et al., 2016). Several studies showed that silicate compounds from organic and inorganic waste have the potential to be applied in the purification of oil (Sudjarwo and Bee, 2017), stationary phase in column chromatography (Fabiani et al., 2018), and adsorbents (Chen et al., 2021).
Extraction is the process of separating compounds using a solvent. Several methods have been used for silica gel extraction including heating (Fabiani et al., 2018), hydrothermal (Owoeye et al, 2020), and reflux method (Asadi and Norouzbeigi, 2018). In this research, silica gel was synthesized from chemical bottle waste by extracting silica using the alkali fusion method. This method was carried out by reacting glass powder and alkali in a specific ratio at high temperatures. Silica extraction is determined by some factors, including the ratio of SiO2 and sodium hydroxide, particle size (µm), and decomposition temperature (°C) (Owoeye et al, 2021). Due to these factors, it is necessary to choose an efficient method for silica extraction.
Previous studies reported that fusion reaction is influenced by the mass ratio of glass bottle waste and fusion soda. Chemical reactions occurring during alkaline fusion are spelled out in the Eq. (1) (Mori, 2003):
Eq. (1) shows the ratio of mol SiO2 and NaOH is 1: 2, this is used as the basis for mass ratio between the sample and SiO2 through calculations and obtained a mass ratio of SiO2 and NaOH 1: 3 with the prediction of reagents running out of reaction. Silica with a purity of 93% was obtained using a ratio of glass bottle waste and NaOH (1:2) (Sudjarwo and Bee, 2017). Silica with a purity of 82% was obtained by calcination at 400 °C (Kafillah and Alimuddin, 2018). The second factor is the calcination temperature. Silica recovery of 60% was obtained by calcination at 950 °C (Yadav et al., 2019). Silica with a recovery of 53% was obtained by calcination at 850 °C (Falayi, Ntuli, and Okonta, 2019). The glass powder particle size is the third-factor affecting silica’s recovery and purity. The greater the surface area of the glass powder, the greater the possibility of contact between the solvent and the particles (Kafillah and Alimuddin, 2018). Owoeye et al. (2020) used a glass powder with a particle size of 270 mesh, while Kafillah and Alimuddin (2018) used a glass powder with a particle size of 180–200 mesh.
The result of the silica extraction process from chemical bottle waste is an alkaline silicate, a precursor for forming silica gel using the sol–gel method. The sol–gel process is a transformation that allows the formation of a gel from the sol. The initial solution is called a sol, a suspension of solid particles in solution.
Silica sol can be made in 3 stages (Yoshida, 2006):
-
Formation of silicic acid by removing alkaline ions from water glass
-
Formation of silica sol with nucleation of silicic acid and growing silica particles by polymerisation
-
Concentration of the dilute silica sol
An acid such as hydrochloric acid s added to a dilute aqueous solution of alkaline silicate (water glass) while stirring and heating, neutralising and obtaining silica gel. The reaction that occurs is a hydrolysis reaction followed by a condensation reaction and produces silicic acid (Si(OH)4). In the condensation reaction, continued with polymerisation, tissue is obtained, a solid phase in the liquid phase (SiO2) (Besbes et al., 2009). Mori (2003) described the reaction equation that occurs in the sol–gel process as in the reaction Eq. (2).
The step to obtain SiO2(s) from si(OH)4 precipitate is drying as in the reaction Eq. (3).
The Design of Experiment (DoE) is an experimental design with each defined action step, so that relevant information can be obtained for the problem for the researched. The experimental design's purpose was to obtain optimum conditions with a few experiments (Montgomery, 2013). The application of Design of Experiment (DoE) in the Optimization of the analytical parameter has some advantages, i.e. reducing the number of the experiment, reagent consumption, and working time (Rahbar et al., 2016). DoE has input and output. Inputs to the experimental design included in determining the factors and levels used. There are two types of input on the experimental design: Box-Behnken Design (BBD) and Central Composite Design (CCD).
Box-Behnken Design (BBD) was one of the non-factorial experimental designs in that each experiment that involves the median value of each factor (variable). In BBD the determination of the point uses three levels, including: the upper value (+1), median value (0), and bottom value (−1). Box-Behnken Design (BBD) was applied to optimize the factors that affect the recovery of silica. The factors that were optimized were calcination temperature, mass ratio, and particle size. BBD inputs were correlated with response variables to obtain response surface curve and contour map, which can help to distinguish the optimum area, and optimum conditions (Ding et al., 2015; Mousavi et al., 2018) and estimate the significance of all terms in the polynomial equation using F-test (Zaky et al., 2008).
The use of the classical approach in determining optimal variables was considered less economical and practical because it requires a lot of testing runs. Response Surface Methodology (RSM) was the output of the experimental design. RSM was a mathematical method and statistics used to optimise optimal conditions. RSM was used to see the relationship between one or more variables to optimise the response in an experiment. RSM has been used to conduct and plan experiments to obtain as much information as possible in the least number of runs (Ding et al., 2015). The purpose of RSM was to optimise the response or variable bound value. Model parameters can be estimated using the appropriate experimental method to collect data. Modelling on RSM using polynomial modelling to determine the relationship between response values and independent variables (Montgomery, 2013).
2 Material and methode
2.1 Material preparation
The materials used in this research were chemical glass waste and sodium hydroxide pellets (98% purity). The as-received sodium hydroxide pellets were procured from Merck (Germany). The chemical glass waste was initially rinsed, dried, and crushed into smaller sizes using Jaw Crusher. The raw glass powder was pulverised using Disc Mill. The milling was done for 2 min at 2 rpm to obtain fine glass powder. The glass powder was sieved to obtain a powder with a particle size of 45–53, 53–63, and 63–74 µm.
2.2 Silica recovery optimization
Response surface methodology (RSM) with Box-Behnken Design (BBD) was applied in this experiment to determine the optimum condition for silica gel synthesis. PyDoE2 Python package was used to generate BBD input (https://github.com/clicumu/pyDOE2). The regression analysis and 3D surface response plots were carried out using Python Library (Rahman et al., 2021). In this study, three independent factors i.e., SiO2: sodium hydroxide ratio (X1), particle size (µm) (X2), and calcination temperature (X3) were selected, and each factor was investigated on a three-level (high (+1), centre point (0) and low (1)) as shown in Table 1. BBD design of 15 trials with different combinations was optimised to obtain the optimum response. RSM was applied to optimise the factors that influence the recovery of silica gel.
Variables
Level
−1
0
1
Mass ratio SiO2: NaOH (g, X1)
1:3
1:4
1:5
Particle sizes (µm, X2)
63–74
53–63
45–53
Temperature (°C, X3)
400
600
800
2.3 Synthesis of silica gel
The synthesis of silica gel from chemical bottle waste was done by calcinating glass powder and sodium hydroxide in the silica and sodium hydroxide ratio (w/w) of 1:3, 1:4, and 1:5. The mixtures were calcined at 400, 600, and 800 °C for 4 h.
The sodium silicate formed by alkali decomposition was dissolved in 50 ml of boiling water. The solution obtained was filtered and sodium silicate solution was obtained. Hydrochloric acid 3 M was added into sodium silicate dropwise and stirred at 450 rpm to obtain white gel (at pH 0.5–2). The gel was aged for 18 h, after which it was filtered and oven-dried at 80 °C for 12 h to obtain silica gel.
2.4 Characterization
2.4.1 X-ray spectrometer
The structure of glass powder and silica gel was characterized by XRD (XPERT-PRO). The racial scans of intensity versus scattering angle (2θ) were recorded from 10 to 80° with a scan speed using Cu Kα (λ = 1.5406 Å) radiation at an operating voltage of 40 kV and filament current of 30 mA on a focus x-ray diffractometer.
2.4.2 X-ray fluorescence spectrometer (XRF)
X-ray Fluorescence spectrometer (Rigaku ZSX Primus IV) was used to measure the composition of glass powder and silica gel in stable oxides.
2.4.3 Scanning electron microscopy-energy dispersion X-ray (SEM-EDX)
The morphology and elemental composition in silica gel surface were determined by scanning electron microscopy (Zeiss EVO MA 10) - energy dispersive X-ray (Bruker EVO MA 10). The silica gel was observed and imaged at 7.7 mm working distance and a 20 kV accelerating voltage.
2.4.4 Specific surface area analyzer
The nitrogen adsorption–desorption was determined at 77 K using a specific surface area porosity analyzer (Quantachrome Autosorb IQ). The specific surface area was measured using the Brunauer-Emmet-Teller (BET) method and pore size distribution branch of isotherm by the Barret-Joyner-Halenda (BJH).
2.4.5 FTIR
Fourier transform infrared spectroscopy (FTIR) was used look at the functional groups that are from silica gel and waste chemical bottles.
3 Results and discussion
3.1 Predicted model and statistical analysis
An experiment with 15 runs was conducted to optimise the input variables. The effect of the input variables (calcination temperature, mass ratio, and particle size) on the recovery of silica gel is shown in Table 2.
Run no.
Coded variables levels
Recovery percentage
x1
x2
x3
Experiment
Predicted
1
−1
−1
0
62.40
60.69
2
1
−1
0
48.41
53.03
3
−1
1
0
44.59
40.77
4
1
1
0
48.87
49.79
5
−1
0
−1
56.23
59.35
6
1
0
−1
59.85
57.44
7
−1
0
1
69.46
71.87
8
1
0
1
75.89
72.77
9
0
−1
−1
69.82
67.96
10
0
1
−1
58.82
59.96
11
0
−1
1
85.99
84.95
12
0
1
1
68.04
69.79
13
0
0
0
46.71
47.93
14
0
0
0
43.15
47.93
15
0
0
0
53.92
47.93
By applying multiple regression analysis to the experimental data, the response and the variable can be correlated using the polynomial Eq. (4).
Table 3 shows the statistical analysis of the regression result. The p-value determines the relationship between the independent and dependent variables by testing the null hypothesis that the independent variable was not correlated with the dependent variable. If the p-value for the variable is less than the significance level, the null hypothesis will be rejected. Table 3 showed the p-value for the equation (0.0123) was less than the significance value (0.05) so the input variables have a significant correlation to the silica gel recoveries (dependent variable).
OLS Regression Results
Dep. Variable:
Yield
R-squared:
0.65486111
Model:
OLS
Adj. R-squared:
0.58472222
Method:
Least Squares
F-statistic:
9,266
Date:
Mon, 01 Aug 2022
Prob (F-statistic):
0.08541667
Time:
23.15.22
Log-Likelihood:
−37,115
No. Observations:
15
AIC:
94.23.00
Df Residuals:
5
BIC:
101.03.00
Df Model:
9
Covariance Type:
nonrobust
coef
std err
t
P>|t|
[0.025
0.975]
const
213.3385
136.493
1.563
0.179
−137.529
564.206
x1
34.7797
26.693
1.303
0.249
–33.836
103.395
x2
−2.7179
3.227
−0.842
0.438
−11.013
5.577
x3
−0.587
0.119
−4.926
0.004
−0.893
−0.281
x4
−1.0832
2.59
−0.418
0.693
−7.741
5.574
x5
−0.4456
0.237
−1.881
0.119
−1.054
0.163
x6
0.0035
0.012
0.283
0.789
−0.028
0.036
x7
0.0359
0.024
1.525
0.188
−0.025
0.096
x8
0.0008
0.001
0.689
0.521
−0.002
0.004
x9
0.0005
6.47E-05
7.149
0.001
0
0.001
Omnibus:
0.30069444
Durbin-Watson:
2,540
Prob(Omnibus):
0.55902778
Jarque-Bera (JB):
0.34305556
Skew:
0.22152778
Prob(JB):
0.54236111
Kurtosis:
2,381
Cond. No.
4.51e + 07
3.2 Response surface methodology (RSM)
The interaction of the input variables and the optimal level of each variable was observed by plotting them in the response surface curve. The three-dimensional response surface plots were obtained by plotting the response (silica gel recoveries) on the Z-axis against two input variables on X and Y axis while keeping the third variables at their “0″ level (Ding et al., 2015).
Fig. 1(a) showed the effect of particle size, temperature, and their interaction on the recovery of silica gel when the mass ratio was fixed at 1:4. The recovery was increased at higher temperatures and bigger particle sizes. Likewise, Fig. 1(b) shows the effect of mass ratio (sample: NaOH) and particle size on the recovery of silica gel when the temperature was fixed at 600 °C. The recovery was increased at a smaller mass ratio and bigger particle size. As shown in Fig. 1(c), the temperature positively affected silica gel recovery when the particle size was at 53–62 µm. The mass ratio that was applied did not have a significant effect on the temperature ranges that were used.
(a)-(c). Response surface plot showing the effect of variables (mass ratio, particle size, and temperature) on the recovery of silica gel.
The optimum condition (X1 = 1:3, X2 = 63–74 µm, X3 = 800 °C) for the silica gel recovery was estimated by solving the regression equation and analysing the response surface. The theoretical recovery under the above condition was 90,05%.
3.3 Characterization
3.3.1 SEM characterization
Fig. 2 shows the SEM micrograph of silica extracted from chemical bottle waste at 500X magnification. The particles observed have an irregular surface with a spherical shape. The EDX also confirms that synthesized silica gel contains a high content of silica and some minor constituents. This morphology was similar to that reported by several authors (Imoisili et al., 2020; Owoeye et al., 2020).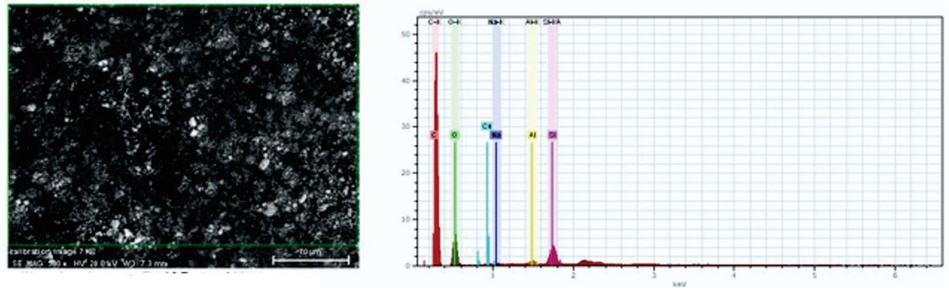
SEM-EDX image of silica gel.
3.3.2 XRF analysis
The chemical bottle glass waste was characterised using X-ray fluorescence to determine its chemical composition. The composition of the chemical bottle waste is presented in Table 3. It can be seen that the chemical bottle waste contains 63.74% SiO2. This result was in accordance with the previous research (Owoeye, Jegede, and Borisade, 2020). The silica content in the chemical bottle waste has the potential to be extracted and used as a sodium silicate precursor. After extracted and synthesized into silica gel, the silica content in the product was 75.63%, while the other components were decreasing (see Table 4).
Components
Chemical bottle waste (%)
Silica gel
Na2O
12.88
8.19
MgO
1.91
0.12
Al2O3
2.04
8.39
Fe2O3
0.62
0.54
SiO2
63.74
75.63
Cl
0.02
0.71
K2O
0.75
0.27
CaO
10.95
0.09
Cr2O3
0.04
0.28
MnO
0.02
0.06
NiO
0.004
0.03
CuO
0.01
0.01
3.3.3 XRD characterization
Fig. 3 shows the diffractogram of the chemical bottle waste and synthesized silica gel.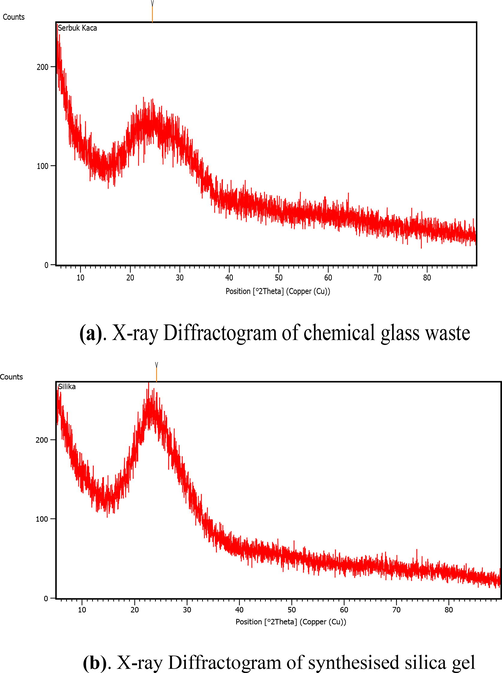
(b). X-ray Diffractogram of synthesized silica gel (a). X-ray Diffractogram of chemical glass waste.
Both diffractograms show broadband peaks between 22 and 27°. The diffractogram confirms the characteristic of amorphous silica gel. The diffractogram of the synthesized silica gel did not show NaCl peaks which was a typical by-product in the synthesis of silica gel. The absence of NaCl peaks indicated the effectiveness of washing in the synthesis procedure. The peak intensity of silica gel was higher than that of the initial chemical bottle waste. This indicates that the silica content was higher after the extraction and synthesis process. The diffractogram was similar to the previous research (Majdinasab and Yuan, 2019; Owoeye et al., 2020).
3.3.4 Fourier Transform Infrared Spectroscopy (FTIR)
Table 5 is the result of the identification of peaks detected using FTIR and Fig. 4 is a functional group spectra that emerged from chemical glass bottle waste and silica gel synthesis in this study. Based on the results of the analysis, it shows that the chemical glass waste powder and silica gel synthesis have typical absorption characteristics of silica, including in the wave number area between 457.14 and 516.94 cm−1 is a typical absorption characteristic of siloxane rings, 775.41 and 702.11 cm−1 are Si—O—Si symmetric stretching, 1031.95 and 1022.31 cm−1 is Si—O—Si asymmetric stretching. However, in the waste powder of the glass bottle, chemicals do not appear absorption at the wave number between 663.53 cm−1 which is the typical absorption of Si—O—Si bending and 959.01 cm−1 which is Si—OH symmetric. The typical uptake of silica that appears in the synthesized silica gel has a higher intensity than in glass bottle waste which indicates that the silica content is higher. This shows that, after the fusion process and the gel insoles of the impurities present in the waste glass bottles the chemicals were successfully separated. 1660.77 and 1641.48 cm−1 are typical ejections of H-O-H bending and wide absorption at 3525.99 and 3425.69 cm−1 are characteristic of water being adsorbed on the surface of the sample. The typical uptake that appeared in this study has similarities with previous studies by (Owoeye et al., 2020; Mota et al., 2017).
Types of vibration mode
Wavenumber (cm−1) (Owoeye et al., 2020) and (Mota et al., 2017)
Glass waste powder
Silica gel
Wavenumber (cm−1)
Intensity (a.u)
Wavenumber (cm−1)
Intensity (a.u)
Siloxane rings
560
457.14
24.452
516.94
58.60
Si—O—Si bending
663.53
–
–
582.52
56.73
Si—O—Si symmetric stretching
786.98
775.41
46.35
702.11
54.74
Si—O—Si asymmetric stretching
1072.46
1031.95
12.26
1022.31
34.80
Si—OH symmetric
949.01
–
–
868
55.88
H—O—H bending
1643.41
1660.77
49.71
1641.48
55.34
H2O molecule
3201.94
3525.99
45.14
3425.69
44.33
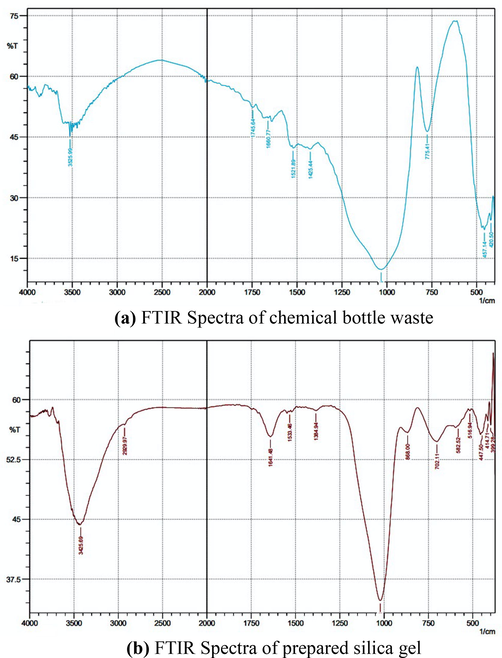
(a) FTIR Spectra of chemical bottle waste (b) FTIR Spectra of prepared silica gel.
3.3.5 Surface area analyzer
Fig. 5 shows the adsorption–desorption isotherm of nitrogen on the silica gel. The isotherm of the silica gel adsorption followed the type IV isotherm. This indicated that the synthesized silica gel tends to have a mesoporous structure. This type of isotherm is associated with capillary condensation in the mesopore structure and has a limited absorption rate in the high p/p° region. Fig. 4 also shows that the type of loop was H3 which indicates the presence of a slit-shaped pore. The pore size distribution using the BJH method shows that the synthesized silica gel has a pore size diameter of 15.74 nm and a surface area of 297.083 m2/g. The results obtained have similarities with previous research by Ding et al. (2015).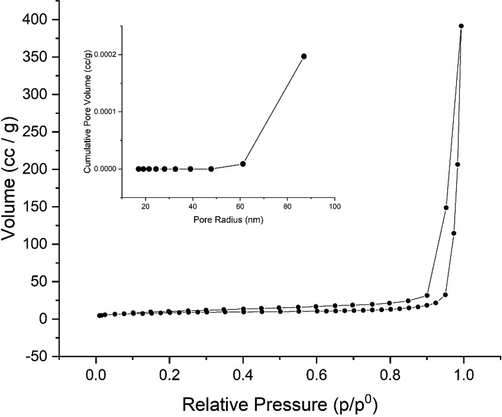
Adsorption-desorption isotherm of nitrogen on the adsorption silica gel.
4 Conclusion
The process for extraction and synthesized of SiO2 from brown chemical bottle glass waste by alkali fusion and sol–gel method using NaOH was investigated. The brown bottles selected in the present study were qualitative. They quantitatively confirmed to contain the components of Na2O, MgO, Al2O3, Fe2O3, SiO2, Cl, K2O, CaO, Cr2O3, MnO, NiO and, CuO from energy dispersive X-ray spectroscopy analysis. The result showed that chemical bottle glass waste can be fully recycled and used for preparation highly valuable silica gels. Box-Behnken Design - RSM optimized alkali fusion and sol gel method. The optimum conditions were obtained by SiO2:NaOH mass ratio of 1:3, the particle size of 63–74 µm, and the temperature of 800 °C. The morphology of silica gel synthesized showed that the silica gel has an irregular surface while the highest chemical component is Si (75.63%), confirming the product is silica gel. The diffractogram showed the broad band between 20 and 30° confirming the characteristic band of silica. The average radius of silica gel is 15.74 nm and a specific surface area of 297.08 m2.
Acknowledgements
The authors gratefully acknowledge financial support from the Institut Teknologi Sepuluh Nopember for this work, under the project scheme of the Publication Writing and IPR Incentive Program (PPHKI) 2022.
Declaration of Competing Interest
The authors declare that they have no known competing financial interests or personal relationships that could have appeared to influence the work reported in this paper.
References
- Pembuatan Gel Silika Dari Limbah Kaca Dengan Bantuan Ultrasound Bath Dan Microwave. Prosiding Semnastek 2017:1-2.
- [Google Scholar]
- Synthesis of colloidal nano silica from waste glass powder as a low-cost precursor. Ceram. Int.. 2018;44(18):22692-32267.
- [CrossRef] [Google Scholar]
- Characterization of silica gel prepared by using a sol-gel process. Physics Procedia. 2009;2(3):1087-1095.
- [CrossRef] [Google Scholar]
- Hydroxyl modification of silica aerogel: An effective adsorbent for cationic and anionic dyes. Colloids Surf., A. 2021;616(February):126331
- [CrossRef] [Google Scholar]
- Preparation of silica nanoparticles from waste silicon sludge. Powder Technol.. 2015;284:231-236.
- [CrossRef] [Google Scholar]
- Sintesis Dan Karakterisasi Silika Gel Dari Limbah Kaca Serta Aplikasinya Pada Kromatografi Kolom. Indonesian J. Pure Appl. Chem.. 2018;1(1):10-16.
- [Google Scholar]
- Desilication of calcined pulverised fly ash and use of silicate solution to prepare a mesoporous silica adsorbent for heavy metals in acid mine drainage. Int. J. Environ. Technol. Manage.. 2019;22(2–3):155-176.
- [CrossRef] [Google Scholar]
- Properties of Glass Materials. Ref. Module Mater. Sci. Mater. Eng.. 2016;1–12
- [CrossRef] [Google Scholar]
- Adsorption of Pb2+, Ni2+, Cu2+, Co2+ metal ions from aqueous solution by PPI/SiO2 as new high performance adsorbent: Preparation, characterization, isotherm, kinetic, thermodynamic studies. J. Mole. Liquids. 2017;237:428-436.
- [Google Scholar]
- Green technology extraction and characterisation of silica nanoparticles from palm kernel shell ash via sol-gel. J. Mater. Res. Technol.. 2020;9(1):307-313.
- [CrossRef] [Google Scholar]
- Sintesis dan karakterisasi zeolit analsim menggunakan prekursor silika dari limbah kaca. Jurnal Kimia Khatulistiwa. 2018;7(1):73=78.
- [Google Scholar]
- The optimization of Sumbawa manganese ore beneficiation using response surface method (RSM) AIP Conference Proceedings. 2021;2349(1):020050.
- [CrossRef] [Google Scholar]
- Microwave synthesis of zeolites from waste glass cullet using landfill leachate as a novel alternative solvent. Mater. Chem. Phys.. 2019;223(September 2018):613-622.
- [CrossRef] [Google Scholar]
- Scaling analysis and numerical studies on water vapour adsorption in a columnar porous silica gel bed. Int. J. Heat Mass Transf.. 2016;95:853-864.
- [CrossRef] [Google Scholar]
- Design and Analysis of Experiments (eighth ed.). Arizona State University; 2013. p. :2009.
- Adsorption of heavy metals (Cu2+ and Zn2+) on novel bifunctional ordered mesoporous silica: Optimization by response surface methodology. J. Taiwan Inst. Chem. Eng.. 2018;84:123-141.
- [CrossRef] [Google Scholar]
- Effects of process variable on synthesis and characterization of amorphous silica nanoparticles using sodium silicate solutions as precursor by sol–gel method. Nano-Struct. Nano-Obj.. 2021;25:100625
- [CrossRef] [Google Scholar]
- Preparation and characterization of nano-sized silica xerogel particles using sodium silicate solution extracted from waste container glasses. Mater. Chem. Phys.. 2020;248(February)
- [CrossRef] [Google Scholar]
- CuO-nanoparticles modified carbon paste electrode for square wave voltammetric determination of lidocaine: Comparing classical and Box-Behnken optimization methodologies. Chin. Chem. Lett.. 2016;27(6):837-842.
- [CrossRef] [Google Scholar]
- Efficient removal of Pb(II) from water using silica gel functionalized with thiosalicylic acid: Response surface methodology for optimization. J. King Saud Univ. – Sci.. 2021;33(1):101232
- [CrossRef] [Google Scholar]
- Extraction of Silicon Dioxide from Waste Colored Glasses by Alkali Fusion Using Sodium Hydroxide. Journal of the Ceramic Society of Japan. 2003;111(1294):376-381.
- [CrossRef] [Google Scholar]
- Simple process for preparing mesoporous sol-gel silica adsorbents with high water adsorption capacities. Micropor. Mesopor. Mater.. 2017;253:177-182.
- [CrossRef] [Google Scholar]
- Combined influence of pore size distribution and surface hydrophilicity on the water adsorption characteristics of micro- and mesoporous silica. Micropor. Mesopor. Mater.. 2016;226:221-228.
- [CrossRef] [Google Scholar]
- Sudjarwo, Wisnu Arfian A., Mei Magdayanti F. Bee, 2017. Synthesis of silica gel from waste glass bottles and its application for the reduction of free fatty acid (FFA) on waste cooking oil. In: AIP Conference Proceedings 1855 (June). https://doi.org/10.1063/1.4985464.
- A novel and efficient method for the synthesis of amorphous nanosilica from fly ash tiles. Mater. Today:. Proc.. 2019;26:701-705.
- [CrossRef] [Google Scholar]
- Yoshida, Akitoshi, 2006. Silica Nucleation, Polymeration and Growth Preparation of Monodispersed Sols. In: Colloidal Silica Fundamentals and Applications, diedit oleh Horacio E Bergna dan William O Robert. New York: Taylor & Francis Group, pp. 48–56.
- Preparation of silica nanoparticles from semi-burned rice straw ash. Powder Technol.. 2008;185(1):31-35.
- [CrossRef] [Google Scholar]


