

Translate this page into:
Discrimination and characterization of the volatile organic compounds of Acori tatarinowii rhizoma based on headspace-gas chromatography-ion mobility spectrometry and headspace solid phase microextraction-gas chromatography-mass spectrometry
⁎Corresponding authors at: College of Pharmaceutical Engineering of Traditional Chinese Medicine, Tianjin University of Traditional Chinese Medicine, 10 Poyanghu Road, Jinghai, Tianjin 301617, China. hs_yu08@163.com (Heshui Yu), lizheng@tjutcm.edu.cn (Zheng Li)
-
Received: ,
Accepted: ,
This article was originally published by Elsevier and was migrated to Scientific Scholar after the change of Publisher.
Abstract
Acori tatarinowii rhizome (ATR) is a Traditional Chinese Medicine (TCM), which has multiple effects, such as neuroprotective activity, antidepressant and other activity. However, the widespread cultivation of ATR has led to it varying quality. Therefore, it is important to find a method to quickly identify the components of ATR. Headspace-gas chromatography-ion mobility spectrometry (HS-GC-IMS) and headspace solid phase microextraction-gas chromatography-mass spectrometry (HS-SPME-GC–MS) were applied to analyze and characterize the volatile organic compounds (VOCs) of ATR. 33 VOCs were identified by HS-GC-IMS and 95 VOCs were identified by HS-SPME-GC–MS from 15 batches of ATR. Then, quantification of estragole, methyleugenol, γ-asarone, β-asarone and asarone by gas chromatography-mass spectrometry (GC–MS). The fingerprint of HS-GC-IMS and the heatmap of HS-SPME-GC–MS were established. Which compared differential components of ATR. In addition, principal component analysis (PCA) was performed on the results of both instruments. The VOCs in the ATR were significantly correlated with β-asarone and asarone by PatternHunter analysis. It assisted HS-GC-IMS determine ATR quality. It is the first report regarding the method development of HS-GC-IMS and HS-SPME-GC–MS that targets the VOCs characterization of ATR, and the findings obtained would benefit the quality control and distinguish the complex analytical objects of ATR.
Keywords
Headspace-gas chromatography-ion mobility spectrometry
Headspace solid phase microextraction-gas chromatography-mass spectrometry
Acori tatarinowii rhizome
Volatile organic compounds
Quantification

1 Introduction
Traditional Chinese Medicine (TCM) has a long history of helping humans treat diseases for thousands of years. However, quality control of TCM has always been a challenge, such as confusing products (Shi et al., 2021), differences among batches (Huang et al., 2021), pesticide residues (Li et al., 2020), etc. It affects drug safety, clinical efficacy, and hinders the modernization and industrialization of TCM. There is an urgent need to provide an efficient, simple and reproducible method for detection of TCM. As a TCM, Acori tatarinowii rhizome (ATR) has many effects, such as inducing resuscitation, dear away phlegm, dehumidification and appetizer (Lam et al., 2019). ATR is historical and cultural, which was recorded in The Book of Songs as early as the 6th century BCE. And it is used in a variety of remedies, such as Kaixin San (Yin et al., 2021a,b), Ding-Zhi-Xiao-Wan (Zheng et al., 2018) both from QianjinYaofang <Thousand-Golden-Prescriptions>. Modern pharmacological research shows that ATR has neuroprotective activity (Yan et al., 2020), antidepressant (Zhang et al., 2019), anti-fatigue (Zhu et al., 2014), antifungal activity (Wang et al., 2020) and other pharmacological effects. It has the potential to treat depression and Alzheimer's disease (Su et al., 2021).
ATR is mainly produced in the northern temperate zone to the subtropical zone (Lam et al., 2016). It is common in dense forests at 20–2600 m, growing in wetlands or on rocks near streams. Because of the wide range of growing areas and different growing conditions, it leads to different composition and quality of the herb. It is difficult to distinguish ATR from different sources only by the eyes and nose. Therefore, the method of rapid Identification and characterization of different qualities of ATR is crucial.
ATR has many volatile organic compounds (VOCs). The detection of VOCs is often performed by gas chromatography-mass spectrometry (GC–MS). It has wide detection range, high sensitivity, qualitative and quantitative accuracy but complicated pre-treatment. So, with the idea of simplifying the processing steps and protecting the environment, solid phase microextraction (SPME) technology is applied to solve problems. SPME is a technique for enrichment and extraction of small molecule (m/z < 1500 Da) compounds by fiber coating, without solvent and complex pretreatment (Gómez-Ríos and Mirabelli 2019). Headspace solid phase microextraction-gas chromatography-mass spectrometry (HS-SPME-GC–MS) incubates the sample by heating to precipitate the small molecular components, and adsorbs the components on the SPME fiber. Then, the fiber is inserted into the GC–MS injection port and the components are desorbed at high temperature. Finally, the components are separated and identified by GC–MS.
GC has good separation performance, but it is difficult to distinguish compounds with the same retention time. Ion mobility spectrometry (IMS) is an analytical technique to characterize chemical ions based on the difference in migration velocity of different gas phase ions in an electric field. It is a highly sensitive and fast analytical technique that was used in military early (Yin et al., 2021a,b). Headspace-gas chromatography-ion mobility spectrometry (HS-GC-IMS) combines the advantages of GC and IMS. It is high sensitivity, no complex pre-processing and visualization of result. In recent years, food (Zhang et al., 2020), environment (Yang et al., 2019), medicine (Yuan et al., 2020) and cosmetics (Brendel et al., 2020) all have a wide range of applications. Compared with HS-SPME-GC–MS, HS-GC-IMS detected VOCs with smaller molecule. Therefore, the combination of these two instruments can give a more comprehensive characterization of the VOCs of ATR. Besides, it can quickly identify and characterize VOCs in ATR. It has been reported that analysis of VOCs in the fermentation of liuyang tempeh based on HS-GC-IMS and HS-SPME-GC–MS (Chen et al., 2021) and dried and fresh matsutake mushrooms (Guo et al., 2018). The feasibility of HS-GC-IMS combined with HS-SPME-GC–MS was confirmed.
The purpose of this study was to discriminate and characterize ATR by HS-GC-IMS and HS-SPME-GC–MS. For this reason, some efforts had been made. We optimized conditions for HS-GC-IMS (incubation temperature, and incubation time) and HS-SPME-GC–MS (fiber coating, incubation temperature, incubation time, extraction time and GC oven temperature program) to detect VOCs of ATR. The volatile oil of ATR was extracted by hydrodistillation, Optimized MS collision energy to quantify 5 major components in MRM mode, and the method was validated. The differences in ATR were identified by principal component analysis (PCA), heatmap and fingerprint. VOCs associated with asarone and β-asarone were found based on PatternHunter analysis to facilitate rapid determination of ATR quality.
2 Materials and methods
2.1 Materials and reagents and samples
N-ketone C4-C9 standard mix (Sinopharm Chemical Reagent Beijing Co., ltd., China) was used as an external reference to calculate the retention index (RI) of the GC-IMS compound. N-alkane C8-C20 standard for GC–MS was purchased from Sigma-Aldrich Chemical Co., ltd. (Missouri, USA). Ethyl acetate (Fisher, Fair lawn, NJ, USA), Some other standard chemicals: methyl eugenol (CAS: 93–15-2, 95 %), β-asarone (CAS: 5273–86-9, 98 %), asarone (CAS: 2883–98-9, 98 %) were provided by NatureStandard (Shanghai, China), esdragole (CAS: 140–67-0, 98 %), γ-asarone (CAS: 5353–15-1, 98 %) were provided by Shanghai Yuanye Bio-technology Co., ltd. (Shanghai, China).
15 batches of ATR from 14 producing areas were collected, Anqing (ATR1, ATR4), Qianshan (ATR2), Huangshan (ATR3) and Dabieshan (ATR5) all in Anhui, Jiujiang (ATR6), Nanchang (ATR7), Shangrao (ATR8), Jingdezhen (ATR9) and Guixi (ATR10) all in Jiangxi, China; Guangyuan (ATR11), Kaijiang (ATR12), Yaan (ATR13) and Nanchong (ATR14) all in Sichuan, China; and ATR15 from Chongqing, China. Herbs purchased from Bozhou Chinese herbal market, Anhui, China. Sample details were available at Table S1. All herbs were certified by Professor Lijuan Zhang from Tianjin University of Traditional Chinese Medicine. The specimens were deposited in College of Pharmaceutical Engineering of Traditional Chinese Medicine, Tianjin University of Traditional Chinese Medicine China.
2.2 HS-GC-IMS analysis
The GC-IMS system (FlavourSpec®, Gesellschaft für Analytische Sensorsysteme mbH, Dortmund, Germany) with an autosampler (CTC Analytics AG, Zwingen, Switzerland) was used to detect the VOCs of 15 batches of ATR. Single-factor experiments were used to optimize incubation temperature (50 °C, 60 °C, 70 °C, 80 °C), and incubation time (10 min, 20 min, 30 min, 40 min). All herbs were dried and crushed through a 40-mesh sieve. Finally, 0.5 g of powder was weighed into a 20 mL headspace glass sampling bottle (Zhejiang HAMAG technology, Ningbo, China), and incubated at 60 °C for 20 min at 250 rpm. The column was FS-SE-54-CB-1 capillary column (15 m × 0.53 mm ID, 1 μm, CS-Chromatographie Service GmbH, Germany). headspace samples were automatically injected into the injector, the injection temperature was 85 ℃, and the injection volume was 500 μL. The carrier gas was N2 (>99.999 %), the column temperature was 45 ℃. The program flow was as follows: 2 mL/min maintained for 2 min initially, increased to 10 mL/min over 10 min, then increased to 150 mL/min over 20 min, and maintained at 150 mL/min over 30 min. The drift tube has a length of 98 mm, a temperature of 45 °C, a voltage of 500 kV, and the drift gas is N2 (>99.999 %) with a gas flow rate of 150 mL/min. Three parallel measurements per batch of samples.
2.3 HS-SPME-GC–MS qualitative analysis
SPME fiber (supelco, Bellefonte, Penn.) was installed on a MultiPurpose sampler (Gerstel, GER) and combined with a 7890B-7000D GC–MS (Agilent Technologies, Palo Alto, CA, USA) to detect VOCs of ATR. All herbs were dried and crushed through a 40-mesh sieve. 0.1 g of ATR was weighed into a 20 mL headspace glass sampling bottle. Single-factor optimization of SPME conditions: Four fiber coatings were tested, polydimethylsiloxane 100 µm phase thickness (PDMS), polyacrylate 85 µm phase thickness (PA), polydimethylsiloxane/divinylbenzene 65 µm phase thickness (PDMS/DVB) and polydimet-hylsiloxane/Carboxen/divinylbenzene 50/30 µm phase thickness (PDMS/CAR/DVB). The incubation temperatures were 50 °C, 60 °C, 70 °C and 80 °C, respectively. And the extraction times were 10 min, 20 min, 30 min and 40 min. The final, extraction conditions were the following: The PDMS/DVB coating was chosen and incubated for 5 min at 60 °C, followed by 30 min in an extract. vial penetration was 21.00 mm, the injection penetration was 54.00 mm, the desorption time was 5 min, and the desorption temperature was 250 °C.
The chromatographic column was HP-5MS phenyl methyl siloxane (30 m × 0.25 mm × 0.25 μm, 19091S-433, J&W Scientific, Folsom, CA, USA) elastic quartz capillary column. the initial temperature was maintain a temperature of 40 ℃ for 2 min; increased to 100 ℃ at a rate of 20 ℃/min; increase to 130 ℃ at a rate of 7 ℃/min; then, increased to 136 ℃ at a rate of 2 ℃/min, and maintain for 6 min; increased to 139 ℃ at a rate of 2 ℃/min, and maintained for 2 min; increased to 146 ℃ at a rate of 3 ℃/min; finally increased to 250℃ at a rate of 30 ℃/min and maintained for 5 min. the carrier gas was Helium (>99.999 %) with a flow rate of 1 mL/min; the split ratio was 1:1; the injection port temperature is 250 ℃. The conditions of MS were set as follow: the ion source temperature was 230 °C, electron impact (EI) with ionization energy was 70 eV. MS1 full scan mode was adopted with a scan range of m/z 30–650. Three parallel measurements per batch of samples.
2.4 Volatile oil extraction
All herbs were dried and crushed through a 40-mesh sieve. 50 g of ATR powder and 500 mL of pure water were placed in a 2 L round bottom flask, then added a small amount of zeolite. Heated to a slight boil and started timing, distilled for 5 h until the volatile oil no longer increased in the volatile oil tester, read the volatile oil volume. Added the volatile oil to ethyl acetate to make a solution.
2.5 GC–MS quantitative analysis
Liquid injection volatile oil solution 1 μL. The collision energies of 10 eV, 15 eV, 20 eV and 25 eV were optimized in product ion scan. Based on the optimized energy for multi reaction monitoring (MRM). In MRM scan, the precursor ions of estragole, methyleugenol, γ-asarone, β-asarone and asarone were m/z 147.1, m/z 179, m/z 208.1, m/z 208.1 and m/z 207.9. Then, determined their respective CE: 15 eV, 10 eV, 10 eV, 10 eV, 10 eV; the product ions were m/z 105.2 and m/z 91; m/z 164.1 and m/z 148.1; m/z 193.1 and m/z 165; m/z 193.1 and m/z 165; m/z 193.1 and m/z 165. Retention time range correspond to 3.5–10 min, 10–17 min, 17–20 min, 20–22 min, 22–32.59 min. Other conditions are consistent with the qualitative method.
2.6 Data analysis
Laboratory Analytical Viewer (LAV) and the plug-in (Reporter, Gallery Plot) were used to analyze the VOCs detected by HS-GC-IMS. The two-dimensional spectrograms of the samples were compared by Reporter, the fingerprint was established by Gallery Plot. The components were then retrieved from the GC-IMS database according to RI and drift time (Dt). The VOCs detected by HS-SPME-GC–MS were identified based on NIST17 library (matching degree > 80, RI) and reference compounds. Histogram drawn by origin 2021(Origin Lab Corporation, Northampton, MA, USA), PCA analyzed by SIMCA 14.1 (Umetrics, Sweden), heatmap and PatternHunter were performed using the MetaboAnalyst 5.0.
3 Result and discussion
3.1 Qualitative analysis of the VOCs by HS-GC-IMS
Separation of components in two dimensions by HS-GC-IMS and a three-dimensional (retention time, migration time, and peak intensity) map was provided. It provided a visual method for the identification of VOCs. The X-axis was the normalized migration time, the Y-axis was the retention time. It could be seen that most of the ion peaks appear at the retention time of 100–1600 s and the migration time of 1.0–2.5. The red line at a migration time of 1.0 is the reaction ion peak (RIP). The color represented the peak intensity. The peak intensity decreased from red to white and then to blue. The dimers or polymers usually appear in the high concentration components, and the appearance of them will make the result identification more accurate (Fig. 1A). However, the differences among the 15 batches of ATR could not be quickly identified by the Topographic plot alone (Fig. S1). Therefore, the fingerprint was established (Fig. 1B).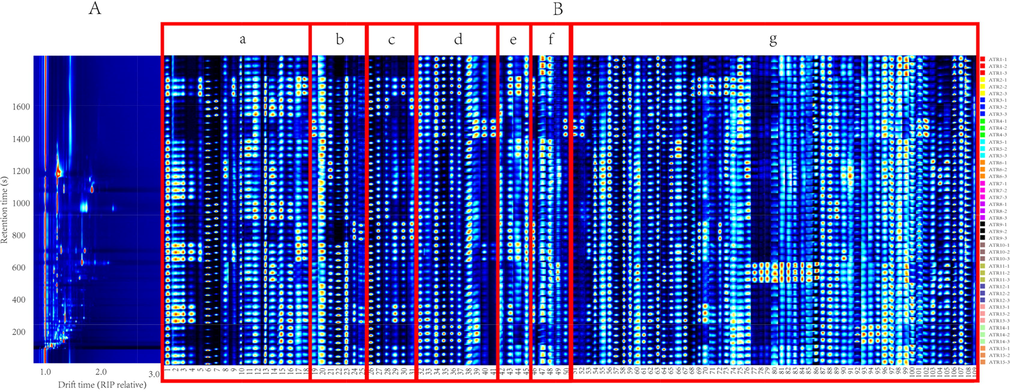
(A) Topographic plot; (B) Fingerprints of 15 batches of ATR deteced by HS-GC-IMS. Each row represents a selected signal peak in a sample and each column represents a signal peak of a compound in a different sample. Compounds correspond to Table 1.
A total of 33 VOCs were identified corresponding to 1–50, there are 10 alcohols, 4 ketones, 5 terpenes, 5 aldehydes, 4 esters and 5 other compounds (Table 1). These components correspond to the five regions a, b, c, d, e and f (Fig. 1B). Compounds 51–109 were unidentified compounds (Fig. 1B-g). Alcohols were less abundant in ATR1, ATR4 and ATR9; linalool was higher in ATR7, ATR10 and ATR13; (-)-myrtenol, nerol and 2-methylbutanol were more abundant in ATR2 and ATR10, nerol has some hepatoprotective effects (Islam et al., 2021); ATR3 and ATR8 contain more 1-hexanol; more 2-butoxyethanol in ATR6 (Fig. 1B-a). ATR4 had more 2-heptanone; 3-octanone was high level in ATR9, ATR13 and ATR15; the ketone component was also relatively low in ATR1 (Fig. 1B-b). Terpenoids were relatively few in ATR1 and ATR4; β-ocimene was most abundant in ATR13; α-phellandrene was more abundant in ATR3 and ATR9, it has anti-inflammatory and antioxidant effects (de Christo Scherer et al., 2019); α-terpinene was more in ATR2 and ATR9, it has a diastolic effect on tracheal smooth muscle(Pereira-de-Morais et al., 2020); Fig. 1B-c summarized the content of terpenoids. ATR4 and ATR14 contained more pentanal; and furfural was also higher in ATR4 (Fig. 1B-d). The content of isoamyl acetate in ATR2, ATR9, ATR10 and ATR13 was more; the content of methyl 2-methylbutanoate was higher in ATR2, ATR5 and ATR10, highest in ATR2; ATR1, ATR9 and ATR10 contained more ethyl acetate (Fig. 1B-e). Decalin had a high content in ATR2, ATR9, ATR10 and ATR13; ATR1 and ATR5 contained more acrylonitrile and 2-propanethiol; ATR11 contained high levels of isovaleric acid; 2-pentylfuran was higher in ATR4 (Fig. 1B-f). Among the unidentified components, there are some differences in ATR of different batches, especially ATR11, components 77–86 are higher (Fig. 1B-g).
NO.
Compound
CAS
Formula
RI
Rt [sec]
Dt [a.u.]
Comment
1
Linalool
78-70-6
C10H18O
1106.3
860.66
1.22114
Monomer
2
Linalool
78-70-6
C10H18O
1106.7
861.926
1.69459
Dimer
3
Linalool
78-70-6
C10H18O
1106.1
859.966
1.75374
Tripolymer
4
Linalool
78-70-6
C10H18O
1105.8
859.312
2.23429
Tetramer
5
(-)-Myrtenol
19894-97-4
C10H16O
1199.9
1140.632
1.21755
Monomer
6
1,8-Cineole
470-82-6
C10H18O
1027.4
624.698
1.28915
Monomer
7
1.8-Cineole
470-82-6
C10H18O
1027.1
623.842
1.72135
Dimer
8
2-Butoxyethanol
111-76-2
C6H14O2
902.9
361.437
1.20116
Monomer
9
Nerol
106-25-2
C10H18O
1220.6
1202.589
1.21827
Monomer
10
1-Octen-3-ol
3391-86-4
C8H16O
983.9
509.162
1.15836
Monomer
11
1-Octen-3-ol
3391-86-4
C8H16O
983.5
508.422
1.59868
Dimer
12
1-Hexanol
111-27-3
C6H14O
871.1
319.152
1.32626
Monomer
13
Borneol
507-70-0
C10H18O
1155.7
1008.304
1.21897
Monomer
14
Borneol
507-70-0
C10H18O
1152.6
999.189
1.88592
Dimer
15
1-Pentanol
71-41-0
C5H12O
762.1
208.886
1.25161
Monomer
16
1-Pentanol
71-41-0
C5H12O
762.1
208.886
1.50447
Dimer
17
2-methylbutanol
137-32-6
C5H12O
731.4
185.942
1.22813
Monomer
18
2-methylbutanol
137-32-6
C5H12O
731
185.599
1.47136
Dimer
19
2-Heptanone
110-43-0
C7H14O
893.4
344.089
1.26177
Monomer
20
Acetoin
513-86-0
C4H8O2
712
171.439
1.05685
Monomer
21
Acetoin
513-86-0
C4H8O2
709.8
169.763
1.32698
Dimer
22
d-Camphor
464-49-3
C10H16O
1141
964.522
1.34219
Monomer
23
d-Camphor
464-49-3
C10H16O
1139.7
960.601
1.86217
Dimer
24
3-Octanone
106-68-3
C8H16O
989.6
519.579
1.30257
Monomer
25
3-Octanone
106-68-3
C8H16O
989.6
519.579
1.71625
Dimer
26
α-Pinene
80-56-8
C10H16
941.6
432.138
1.21104
Monomer
27
β-Pinene
127-91-3
C10H16
970.4
484.624
1.2181
Monomer
28
β-Pinene
127-91-3
C10H16
971.3
486.186
1.29456
Dimer
29
β-Ocimene
13877-91-3
C10H16
1035.7
649.457
1.21953
Monomer
30
α-Terpinene
99-86-5
C10H16
1011.9
578.304
1.21726
Monomer
31
α-Phellandrene
99-83-2
C10H16
992.4
524.724
1.2181
Monomer
32
Heptanal
111-71-7
C7H14O
900.2
356.596
1.32866
Monomer
33
Heptanal
111-71-7
C7H14O
899.8
355.772
1.69048
Dimer
34
Hexanal
66-25-1
C6H12O
791.2
233.008
1.25549
Monomer
35
Hexanal
66-25-1
C6H12O
790.8
232.577
1.55969
Dimer
36
Benzaldehyde
100-52-7
C7H6O
954.2
455.062
1.15109
Monomer
37
Benzaldehyde
100-52-7
C7H6O
954.7
455.979
1.46353
Dimer
38
Pentanal
110-62-3
C5H10O
685.8
152.816
1.18082
Monomer
39
Pentanal
110-62-3
C5H10O
692.3
156.69
1.4183
Dimer
40
Furfural
98-01-1
C5H4O2
824.2
268.606
1.08516
Monomer
41
Furfural
98-01-1
C5H4O2
825.4
269.819
1.33013
Dimer
42
2-Butenoic acid, hexyl ester
19089-92-0
C10H18O2
1243.4
1270.611
1.46317
Monomer
43
Isoamyl acetate
123-92-2
C7H14O2
873.1
321.312
1.30877
Monomer
44
methyl 2-methylbutanoate
868-57-5
C6H12O2
768.3
213.556
1.19434
Monomer
45
Ethyl acetate
141-78-6
C4H8O2
631.6
132.05
1.09849
Monomer
46
Decalin
91-17-8
C10H18
1065.7
739.223
1.21829
Monomer
47
Acrylonitrile
107-13-1
C3H3N
536
95.359
1.09209
Monomer
48
2-Propanethiol
75-33-2
C3H8S
577
111.09
1.04688
Monomer
49
Isovaleric acid
503-74-2
C5H10O2
820.8
264.94
1.21792
Monomer
50
2-Pentylfuran
3777-69-3
C9H14O
991.6
523.298
1.25032
Monomer
3.2 Qualitative analysis of the VOCs by HS-SPME-GC–MS
PDMS is a non-polar fiber coating, PA is a polar fiber coating, PDMS/DVB and PDMS/CAR/DVB are bipolar fiber coating (Shirey 2012). Optimization of SPME conditions. After filtering the miscellaneous peaks, compared the number of peaks under different conditions. Firstly, the different SPME fiber coatings were optimized, PDMS has the least number of peaks and PDMS/DVB has the most. Secondly, optimized incubation temperature, the number of peaks at 50 °C was the highest, and the number of peaks at other temperatures was similar. Finally, optimized the extraction time, the higher the temperature the higher the number of peaks (Fig. 2A). Most of the major peaks were present under different conditions, The peak areas were further analyzed. The peak area of eight major components of in ATR were used as criteria. Compare different fiber coatings, the peak areas of both PA and PDMS were low in general. The PDMS/CAR/DVB had the highest peak area only for estragole and asarone. most of the peaks had the highest area in PDMS/DVB. So PDMS/DVB was selected as the extraction fiber (Fig. 2B-a). At different incubation temperatures, the peak areas of components with large retention times were almost positively correlated with the incubation temperature. But the peak areas of components with small retention times were generally negatively correlated with incubation temperature. When the incubation temperature was 60 °C, the peak areas of most components were moderate at this temperature (Fig. 2B-b). At different incubation times, it found that the extraction time increased, the peak areas increased, except estragole. And when the extraction time reached 40 min, methyleugenol, cis-methyl isoeugenol and shyobunone were also declined. A high peak area was achieved for all components at an extraction time of 30 min (Fig. 2B-c). The final SPME conditions were determined.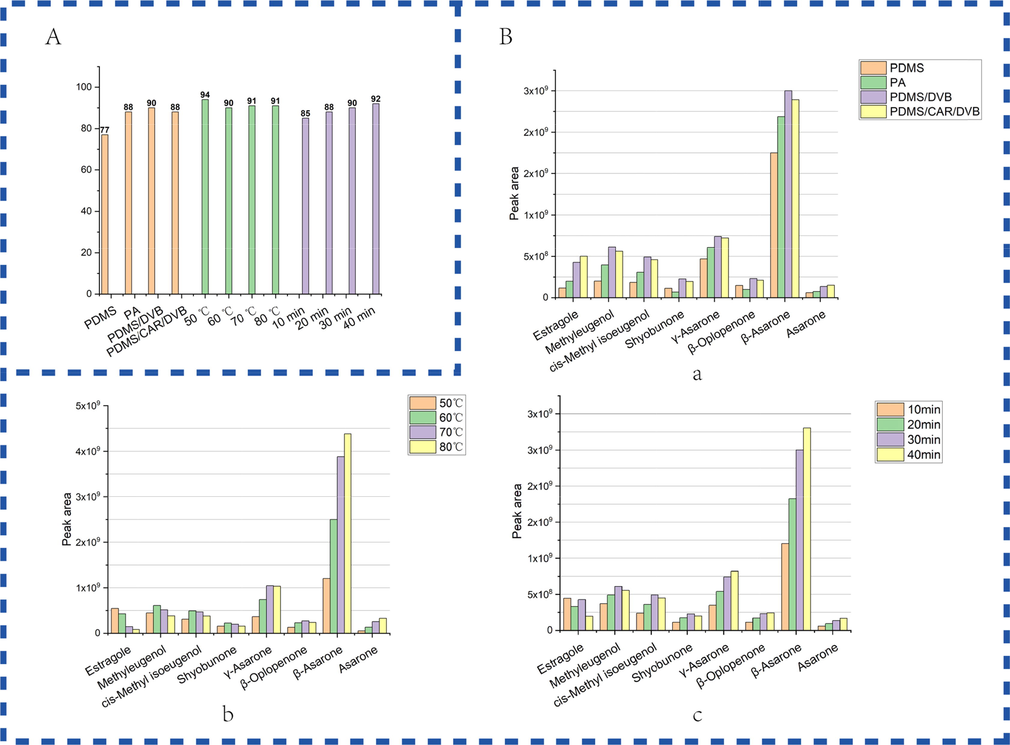
(A) Effect of different SPME conditions on the number of peaks. (B) Effect of different SPME conditions on the peak areas of eight major compounds in ATR. (a) SPME fiber coating; (b) incubation temperature; (c) extraction time.
The total ion chromatograms (TIC) of ATR are shown in Supplementary Information (Fig. S2). The content of individual components in different batches varies significant. A total of 95 VOCs were identified by HS-SPME-GC–MS, there were 24 alcohols, 9 ethers, 2 aldehydes, 2 acids, 39 terpenes, 1 epoxyalkane, 13 ketones, 1 alkane and 4 esters correspond to the a, b, c, d, e, f, g and h regions of heatmap (Fig. 3). The peak area was taken as log10 for the heatmap, the color changed from brownish red to white and then to dark blue, indicating a sequential decrease. Components methyleugenol, cis-methyl isoeugenol, estragole, γ-asarone, β-asarone, asarone, β-elemen (anti-tumor activity), β-caryophyllen (lilac scent), aromandendrene, viridiflorene, eremophilene, δ-guaiene, β-cadinene, shyobunone, isoshyobunone, eremophila ketone, β-oplopenone, cyperenone (anti-dysmenorrhea effect) were more abundant in the ATR.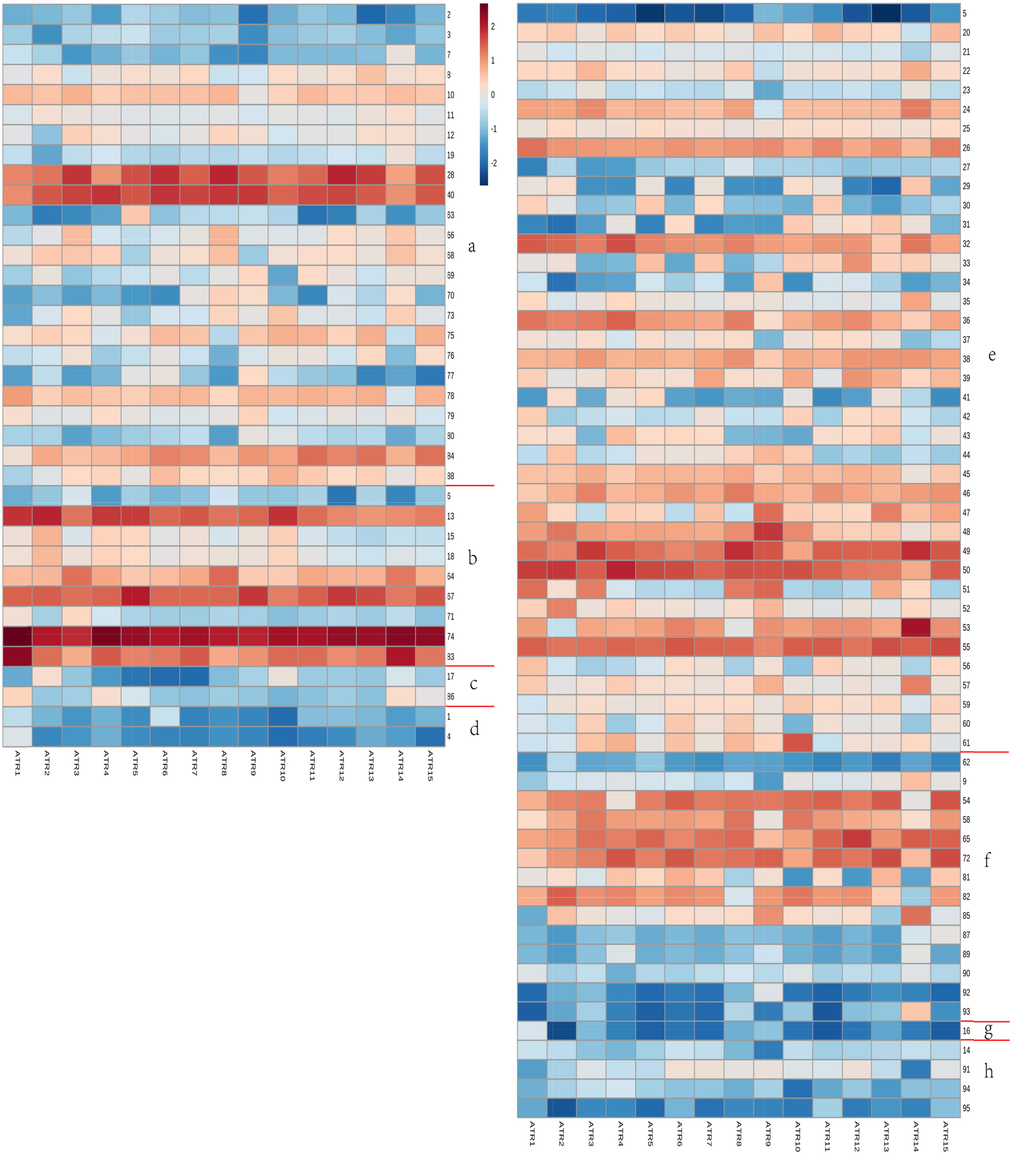
Heatmap of 15 batches of ATR detected by HS-SPME-GC–MS. Each column represents a different component in a batch of ATR, each row represents the same component in different batches. Compounds correspond to Supplementary Information (Table S2).
β-Asarone and asarone are its main medicinal components of ATR. β-Asarone has central nervous system depressant effect, sedative, hypothermic and tranquilizing, and anticonvulsant properties; asarone has the effect of calming asthma, expectorant, cough, antispasmodic and choleretic (Park et al., 2015, Chellian et al., 2017, Chellian and Pandy 2018, Saki et al., 2020). But the two ingredients have some toxicity (Chellian et al., 2017). Methyleugenol has a sweet clove-anise pungent aroma, the aroma is more translucent and long-lasting, with a mild tea pungent aroma, can be used in perfumes and fragrances. It also has the effect of suppressing anorexia (Zhu et al., 2018) and analgesic effect (Rocha-Gonzalez et al., 2020). However, genotoxicity and carcinogenicity should not be ignored (Suparmi et al., 2019). Estragole has an aniseed aroma, mainly used in spices, has antibacterial activity (Moghaddam et al., 2014), insecticidal effect (Kumari et al., 2017). γ-Asarone has a strong correlation with C6 glioma cells in terms of antioxidant, anti-inflammatory and neurotrophic (Yan et al., 2020). β-Caryophyllen has antibacterial, anti-inflammatory, anti-cancer and analgesic properties (Fidyt et al., 2016). Shyobunone interact with AChE with a kind of non-competitive inhibition (Martins et al., 2021). These components with pharmacodynamics and high content can be used as quality markers detected by ATR in HS-SPME-GC–MS.
Benzyl alcohol was higher in ATR14; elemol was high level only in ATR5, it has immunosuppressive effects and has therapeutic potential in the treatment of atopic dermatitis (Yang et al., 2015); longiborneol was more abundant in ATR3, ATR8, ATR10 and ATR14; guaiol (anti-proliferative, autophagy-promoting, anthelmintic and insecticidal bioactivities) was present in ATR8, ATR9 and ATR14, it significantly inhibite cell growth of non-small cell lung cancer cells in vitro and in vivo (Yang et al., 2016); α-eudesmol was more abundant in ATR9 and T-muurolol was only less abundant in ATR14 (Fig. 3a). cis-Anethole, anethole (fennel odor, leukocyte-raising effect) were higher levels in ATR2, ATR4, ATR5 and ATR10, anethole can be used as a potential therapeutic ingredient for non-alcoholic steatohepatitis (Zhang et al., 2021) and has osteoprotective effects (Qu et al., 2021); more allyltetramethoxybenzene in ATR1 and ATR3 (Fig. 3b). Cinnamal (cinnamon aromatic scent) was higher in ATR2 and ATR10. The content of acetosyringone (raw materials for the preparation of asarone) in ATR1, ATR4 and ATR14 was higher (Fig. 3c). The acid content was low (Fig. 3d). Low content of α-longipinene, longicyclene, α-guaiene and more content of γ-maaliene in ATR9; cyclosativene was relatively more in ATR3 and ATR14, it has antioxidant ability, can reduce oxidative damage in the field of neurodegenerative diseases, anti-cancer (Turkez et al., 2015). The content of α-guaiene in ATR14 and ATR15 was low. γ-Himachalene was less abundant in ATR3, ATR6 and ATR8. The content of δ-guaiene and 3,7(11)-selinadiene were higher in ATR14. The contentα-calacorene in ATR10 was high level (Fig. 3e). The content of d-camphor was abundant in ATR14 it has sedative effect (Oshima and Ito 2021), relief of inflammation (Dos Santos et al., 2021). ATR14 had more dehydrofukinone, ATR9 and ATR14 contained more zierone (Fig. 3f). It showed less in both epoxides and esters (Fig. 3g and h) different components in a batch of ATR, each row represents the same component in different batches. Compounds correspond to Supplementary Information (Table S2).
3.3 Quantification of 5 major components by GC–MS
Estragole, methyleugenol, γ-asarone, β-asarone and asarone were high in ATR and have some biological activity (Moghaddam et al., 2014, Park et al., 2015, Chellian et al., 2017, Zhu et al., 2018, Yan et al., 2020), so the five components were quantified. The content of five components in the powder was calculated after the quantitative research of the volatile oil by GC–MS. In Table 2, the standard curve showed good linearity in the corresponding range (r2 > 0.999). The concentrations at signal-to-noise ratios of 3 and 10 were used as limits of detection (LOD) and limits of quantification (LOQ). Methodological investigations were shown in Supplementary Information (Table S3). Took the mixed standard solution and calculated the intraday precision by continuously measuring the concentration of 6 times of the standard solution (<1.87 %). The stability was calculated by injecting the one sample at 6 times points: 0 h, 2 h, 4 h, 6 h, 12 h, 24 h (<2.14 %). The 1 batch of samples was weighed precisely in 6 portions to prepare the test solution, each solution was measurement once, then calculated the reproducibility (<2.45 %). 9 samples of the 1 sample were divided into 3 groups, each group was blended with 50 %, 100 % and 150 % of the target standard compound. 3 injection per solution, then calculated the recovery (93.32–105.68).
Compound
Linear equation
LOD (ng/mL)
LOQ (ng/mL)
Linear range (ng/mL)
r2
Esdragole
Y = 303.71X-9644.60
7.64
25.33
191–8725
0.999
Methyl eugenol
Y = 56.05X-4773.75
6.16
21.34
312–5909
0.999
γ-Asarone
Y = 575.73X-143312.82
9.03
31.83
670–9986
0.999
β-Asarone
Y = 904.23X-319399.11
8.63
28.05
1116–20992
0.999
Asarone
Y = 786.88X-288846.48
10.03
34.38
582–9417
0.999
ATR1-ATR15 were extracted volatile oils: 0.59 mL, 1.47 mL, 0.70 mL, 0.68 mL, 0.69 mL, 0.88 mL, 0.86 mL, 1.08 mL, 0.59 mL, 1.03 mL, 1.37 mL, 0.87 mL, 0.69 mL, 1.18 mL, 0.98 mL. The content of the five components in the volatile oil and powder were shown in Supplementary Information (Table S4). The content of esdragole were between 0.05 and 21.78 mg/g, methyl eugenol were between 0.04 and 5.16 mg/g, γ-asarone were between 0.22 and 2.97 mg/g, β-asarone were between 3.06 and 21.61 mg/g and asarone were between 0.15 and 4.55 mg/g in powder of 15 batches of ATR. The content of esdragole was particularly pronounced only in ATR2 and ATR10; methyl eugenol was more abundant in ATR12, ATR3, ATR6, ATR8, most in ATR8; the content of β-asarone was high in all batches, with ATR4, ATR11, ATR14 and ATR15 being particularly high; asarone is present in high levels in ATR1; ATR5, ATR9 and ATR12 have more γ-asarone (Fig. 4). It could be seen that there were differences in active ingredients among the different batches of ATR.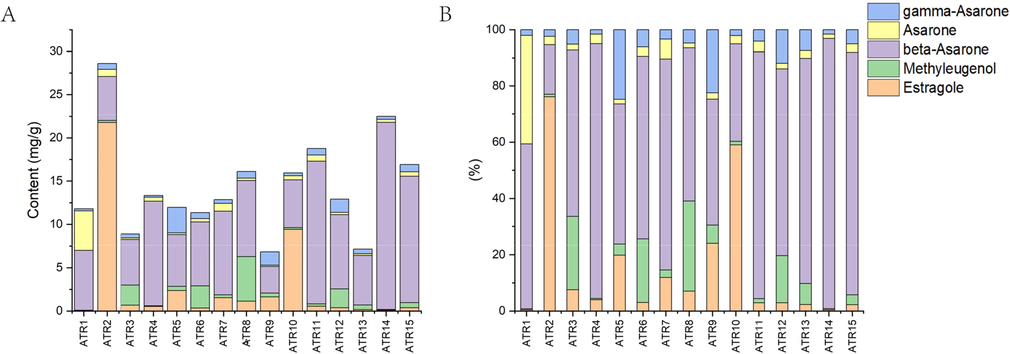
The content of the 5 components in ATR powder.
3.4 Comprehensive analysis
The two instruments have different detection ranges. 1,8-Cineole, linalool, d-camphor and borneol are the compositions detected by both approaches. The results measured by both approaches were analyzed based on PCA. PCA is a multivariate statistical analysis technique based on unsupervised analysis. By reducing the dimension of data, an unsupervised data driven approach is provided. Then, the regularity and difference among samples are evaluated according to the contribution rate of principal component factors in different samples (Farrugia et al., 2021). The peak area is taken as log10, then subjected to UV-scaling. Since the magnitude-level difference between the data detected by the two instruments, UV-scaling was used to increase the importance of low-response variables (Cheng et al., 2017). PCA of HS-GC-IMS and HS-SPME-GC–MS were established with named as model A and model B, respectively (Fig. 5). The sample differences in the graph are proportional to their distances, large distance results in large difference, small distance results in small difference. The ellipse in the figure is defined as the Hotelling's T2 (95 %) critical limit. Exceeding the critical limit is considered as an outlier. Most of the ATR are in the critical limit, except for ATR6 of model B, which is at the edge of the critical limit. In model A, Q2 was 0.757, indicating that the model predicts well. In model A, ATR1, ATR4 and ATR14 deviated significantly from the other batches (Fig. 5A-a), 2-Pentylfuran, 2-Heptanone and other components were positively correlated with them (Fig. 5A-b). The others were not more obviously separated (Fig. 5A). In model B, Q2 was 0.623, indicating that the model predicted well. Model A and model B had similar distribution trends. However, the distribution of PCA for Model A and Model B were not entirely consistent. Because there are some differences in the detection methods (Fig. 5B-a). Few components were positively correlated with ATR1 and ATR4, asarone, β-asarone, and so on were positively correlated components; γ-elemene, 3,7(11)-selinadiene, epi-γ-eudesmol and others in ATR14 are positively correlated components; acorenone B and other components were positively correlated with ATR6 (Fig. 5B-b).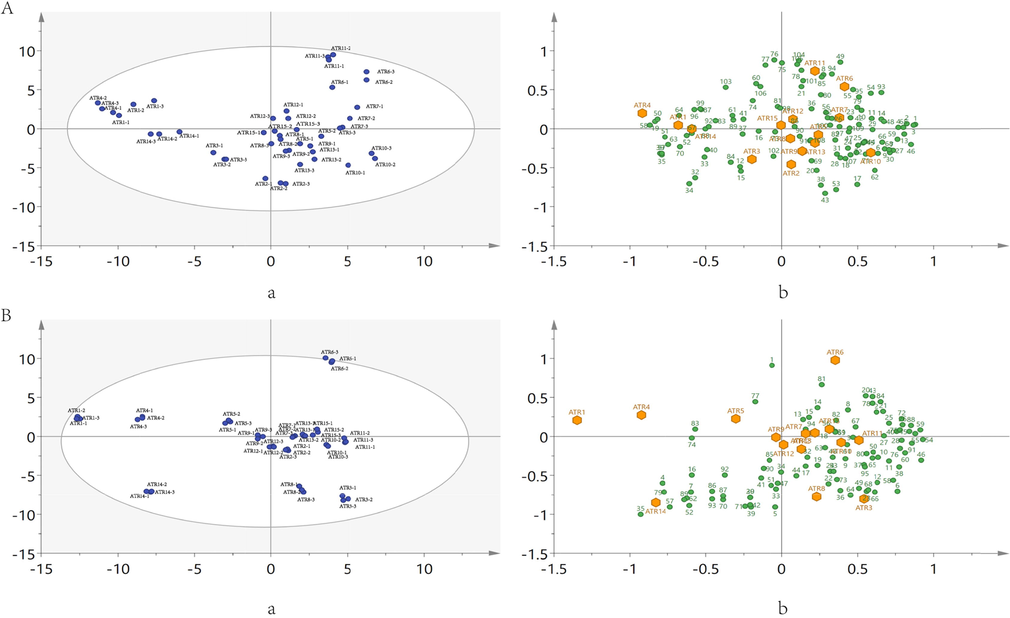
PCA score plot of 15 batches of ATR. (A) HS-GC-IMS, compounds correspond to Table 1; (B) HS-SPME-GC–MS, compounds correspond to Supplementary Information (Table S2). (a and b are score scatter plot and biplot; in biplot, the yellow hexagons represent ATR, the green circles represent components.).
PatternHunter was performed based on the percent peak area content (Fig. 6). Blue indicates negative correlation and pink indicates positive correlation. cis-Methyl isoeuge and some components are negatively correlated with asarone, benzyl alcohol and others were positively correlated with asarone (Fig. 6A). Meanwhile, β-selinene and some components were also negatively correlated with β-asarone, asarone and others were positively correlated with β-asarone (Fig. 6B). The components detected by HS-GC-IMS showed more positive correlations with asarone and β-asarone compared to HS-SPME-GC–MS. Benzaldehyde and some components were positively correlated with asarone, while borneol and other components were negatively correlated with asarone (Fig. 6C). 2-Pentylfuran and some components showed a positively correlation with β-asarone, β-pinene and others showed a negative correlation with β-asarone (Fig. 6D). β-Asarone and asarone are the main medicinal components of ATR. To some extent, they determine the quality of ATR. When more of the VOCs have a positive correlation with the target components and less of a negative correlation, it means that the target components are high content. This is helpful to quickly distinguish the content of asarone and β-asarone in ATR by HS-GC-IMS. Furthermore, the quality of ATR can also be quickly identified.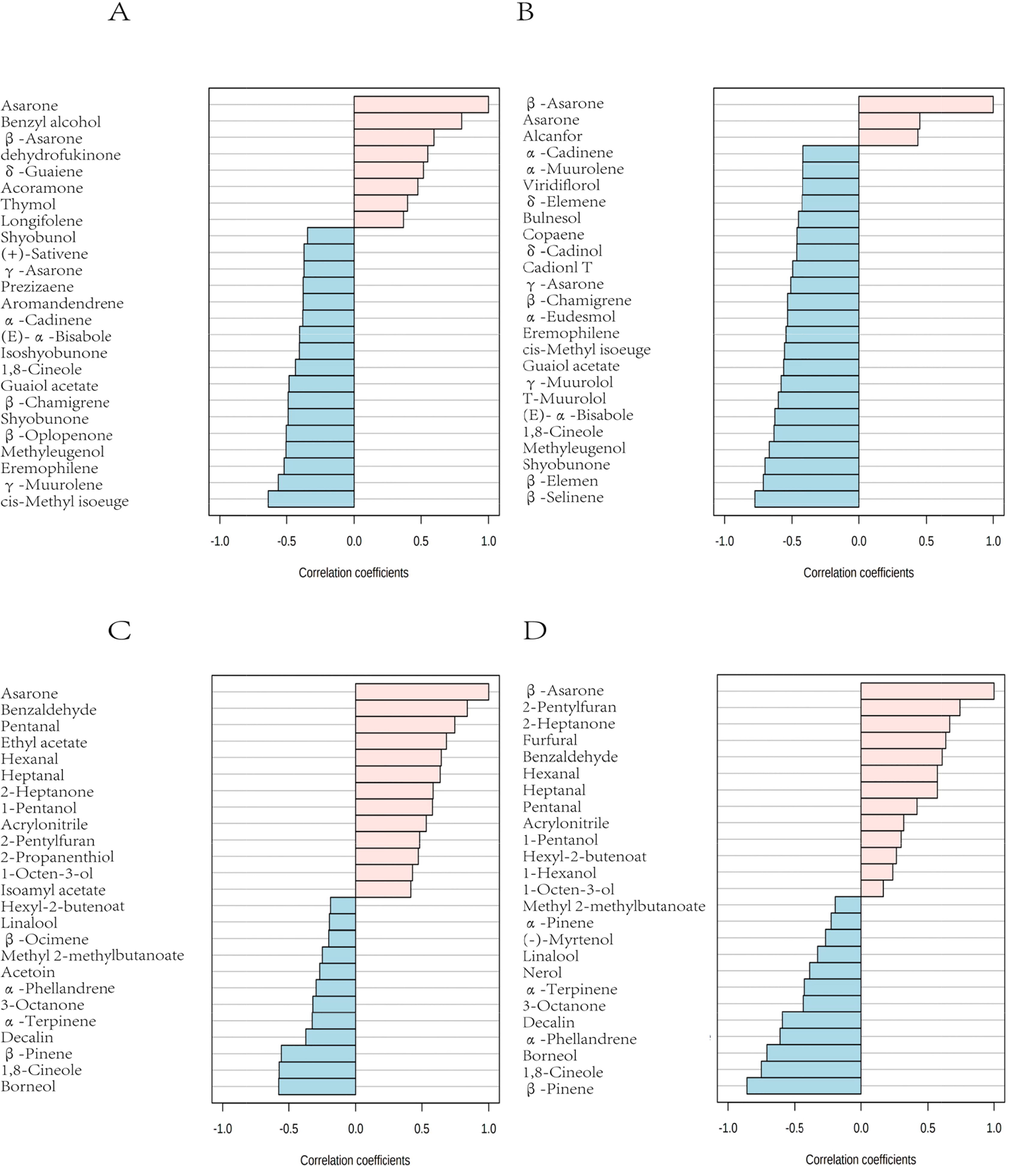
PatternHunter of ATR. (A) The top 25 components detected by HS-SPME-GC–MS showed the highest correlation with β-asarone; (B) The top 25 components detected by HS-SPME-GC–MS showed the highest correlation with asarone; (C) The top 25 components detected by HS-GC-IMS showed the highest correlation with β-asarone; (D) The top 25 components detected by HS-GC-IMS showed the highest correlation with asarone.
4 Conclusion
A method for rapid identification and characterization of ATR was established based on HS-GC-IMS and HS-SPME-GC–MS. Support the development of modernization of TCM industry. 33 volatile organic compounds (VOCs) were identified by HS-GC-IMS and 95 VOCs were identified by HS-SPME-GC–MS from 15 batches of ATR. 4 components were the compositions detected by both instruments. There is a better explanation for ATR VOCs. The heatmap of HS-SPME-GC–MS showed the content of different components. And the five main components of ATR were quantified by GC–MS. A fingerprint of HS-GC-IMS was established, identified the characteristic components of ATR. The associative components of β-asarone and asarone were identified according to PatternHunter. These results would help HS-GC-IMS to quickly identify the source and quality. The method established would benefit the research on quality control of storage and confusing products of ATR. The combination of multiple analytical platforms and chemometrics to better analyze the chemical composition of comprehensive multicomponent characterization of TCM with more VOCs or the comprehensive metabolites identification and provide us with more useful information.
Acknowledgements
This work was supported by the financial support of National Natural ScienceFoundation of China (Grant No.82174434, 81904251). The authors would like to thank the support from Innovation Team and Talents Cultivation Program of National Administration of Traditional Chinese Medicine. (No: ZYYCXTD-D-202002).
Declaration of Competing Interest
The authors declare that they have no known competing financial interests or personal relationships that could have appeared to influence the work reported in this paper.
References
- Comparison of PLSR, MCR-ALS and Kernel-PLSR for the quantification of allergenic fragrance compounds in complex cosmetic products based on nonlinear 2D GC-IMS data. Chemometrics Intell. Lab. Syst.. 2020;205
- [CrossRef] [Google Scholar]
- Protective effect of alpha-asarone against nicotine-induced seizures in mice, but not by its interaction with nicotinic acetylcholine receptors. Biomed. Pharmacother.. 2018;108:1591-1595.
- [CrossRef] [Google Scholar]
- Pharmacology and toxicology of alpha- and beta-Asarone: A review of preclinical evidence. Phytomedicine. 2017;32:41-58.
- [CrossRef] [Google Scholar]
- Characteristic fingerprints and volatile flavor compound variations in Liuyang Douchi during fermentation via HS-GC-IMS and HS-SPME-GC-MS. Food Chem.. 2021;361:130055
- [CrossRef] [Google Scholar]
- Classification of Different Dried Vine Fruit Varieties in China by HS-SPME-GC-MS Combined with Chemometrics. Food Anal. Methods. 2017;10:2856-2867.
- [CrossRef] [Google Scholar]
- Wound healing activity of terpinolene and alpha-phellandrene by attenuating inflammation and oxidative stress in vitro. J. Tissue Viability. 2019;28:94-99.
- [CrossRef] [Google Scholar]
- Analgesic and anti-inflammatory articular effects of essential oil and camphor isolated from Ocimum kilimandscharicum Gurke leaves. J. Ethnopharmacol.. 2021;269:113697
- [CrossRef] [Google Scholar]
- Principal component analysis of hyperspectral data for early detection of mould in cheeselets. Curr. Res. Food Sci.. 2021;4:18-27.
- [CrossRef] [Google Scholar]
- beta-caryophyllene and beta-caryophyllene oxide-natural compounds of anticancer and analgesic properties. Cancer Med.. 2016;5:3007-3017.
- [CrossRef] [Google Scholar]
- Solid Phase Microextraction-mass spectrometry: Metanoia. TrAC, Trends Anal. Chem.. 2019;112:201-211.
- [CrossRef] [Google Scholar]
- Characteristic volatiles fingerprints and changes of volatile compounds in fresh and dried Tricholoma matsutake Singer by HS-GC-IMS and HS-SPME-GC-MS. J. Chromatogr. B Analyt. Technol. Biomed. Life. Sci.. 2018;1099:46-55.
- [CrossRef] [Google Scholar]
- Qualitative and quantitative analysis of chemical components in Eupatorium lindleyanum DC. by ultra-performance liquid chromatography-mass spectrometry integrated with anti-inflammatory activity research. J. Sep. Sci.. 2021;44:3174-3187.
- [CrossRef] [Google Scholar]
- Effects of nerol on paracetamol-induced liver damage in Wistar albino rats. Biomed. Pharmacother.. 2021;140:111732
- [CrossRef] [Google Scholar]
- Chemical and genetic stability of methyl chavicol-rich Indian basil (Ocimum basilicum var. CIM-Saumya) micropropagated in vitro. S. Afr. J. Bot.. 2017;113:186-191.
- [CrossRef] [Google Scholar]
- Authentication of Acori Tatarinowii Rhizoma (Shi Chang Pu) and its adulterants by morphological distinction, chemical composition and ITS sequencing. Chin. Med.. 2016;11:41.
- [CrossRef] [Google Scholar]
- Asarones from Acori Tatarinowii Rhizoma stimulate expression and secretion of neurotrophic factors in cultured astrocytes. Neurosci. Lett.. 2019;707:134308
- [CrossRef] [Google Scholar]
- Screening of pesticide residues in Traditional Chinese Medicines using modified QuEChERS sample preparation procedure and LC-MS/MS analysis. J. Chromatogr. B Analyt. Technol. Biomed. Life Sci.. 2020;1152:122224
- [CrossRef] [Google Scholar]
- Impact on cholinesterase-inhibition and in silico investigations of sesquiterpenoids from Amazonian Siparuna guianensis Aubl. Spectrochim. Acta A Mol. Biomol. Spectrosc.. 2021;252:119511
- [CrossRef] [Google Scholar]
- Chemical composition and antibacterial activity of essential oil of Ocimum ciliatum, as a new source of methyl chavicol, against ten phytopathogens. Ind. Crops Prod.. 2014;59:144-148.
- [CrossRef] [Google Scholar]
- Sedative effects of l-menthol, d-camphor, phenylethyl alcohol, and geraniol. J. Nat. Med.. 2021;75:319-325.
- [CrossRef] [Google Scholar]
- Effect of alpha-asarone on angiogenesis and matrix metalloproteinase. Environ. Toxicol. Pharmacol.. 2015;39:1107-1114.
- [CrossRef] [Google Scholar]
- Myorelaxant action of the Dysphania ambrosioides (L.) Mosyakin & Clemants essential oil and its major constituent alpha-terpinene in isolated rat trachea. Food Chem.. 2020;325:126923
- [CrossRef] [Google Scholar]
- Anethole inhibits RANKL-induced osteoclastogenesis by downregulating ERK/AKT signaling and prevents ovariectomy-induced bone loss in vivo. Int. Immunopharmacol.. 2021;100:108113
- [CrossRef] [Google Scholar]
- Antinociceptive Interaction and Pharmacokinetics of the Combination Treatments of Methyleugenol Plus Diclofenac or Ketorolac. Molecules. 2020;25
- [CrossRef] [Google Scholar]
- Effect of β-asarone in normal and β-amyloid-induced Alzheimeric rats. Arch. Med. Sci.. 2020;16:699-706.
- [CrossRef] [Google Scholar]
- Aconitum Diterpenoid Alkaloid Profiling to Distinguish between the Official Traditional Chinese Medicine (TCM) Fuzi and Adulterant Species Using LC-qToF-MS with Chemometrics. J. Nat. Prod.. 2021;84:570-587.
- [CrossRef] [Google Scholar]
- Shirey, R.E., 2012. SPME Commercial Devices and Fibre Coatings. In: Handbook of Solid Phase Microextraction, pp. 99–133. https://doi.org/10.1016/B978-0-12-416017-0.00004-8.
- Protective effect of Acorus tatarinowii extract against alzheimer in 3xTg-AD mice. Trop. J. Pharm. Res.. 2021;18:1903-1907.
- [CrossRef] [Google Scholar]
- Levels of methyleugenol and eugenol in instant herbal beverages available on the Indonesian market and related risk assessment. Food Chem. Toxicol.. 2019;125:467-478.
- [CrossRef] [Google Scholar]
- Protective effects of cyclosativene on H2O 2-induced injury in cultured rat primary cerebral cortex cells. Cytotechnology. 2015;67:299-309.
- [CrossRef] [Google Scholar]
- Bioguided isolation, identification and activity evaluation of antifungal compounds from Acorus tatarinowii Schott. J. Ethnopharmacol.. 2020;261:113119
- [CrossRef] [Google Scholar]
- Identification of volatile active components in Acori Tatarinowii Rhizome essential oil from different regions in China by C6 glioma cells. BMC Compl. Med. Ther.. 2020;20:255.
- [CrossRef] [Google Scholar]
- Profiling and characterization of odorous volatile compounds from the industrial fermentation of erythromycin. Environ. Pollut.. 2019;255:113130
- [CrossRef] [Google Scholar]
- Elemol from Chamaecyparis obtusa ameliorates 2,4-dinitrochlorobenzene-induced atopic dermatitis. Int. J. Mol. Med.. 2015;36:463-472.
- [CrossRef] [Google Scholar]
- (-)-Guaiol regulates RAD51 stability via autophagy to induce cell apoptosis in non-small cell lung cancer. Oncotarget. 2016;7(38)
- [CrossRef] [Google Scholar]
- Strategy for the multi-component characterization and quality evaluation of volatile organic components in Kaixin San by correlating the analysis by headspace gas chromatography/ion mobility spectrometry and headspace gas chromatography/mass spectrometry. Rapid Commun. Mass Spectrom.. 2021;35:e9174.
- [Google Scholar]
- Application and development trends of gas chromatography–ion mobility spectrometry for traditional Chinese medicine, clinical, food and environmental analysis. Microchem. J.. 2021;168
- [CrossRef] [Google Scholar]
- HS-GC-IMS-Based metabonomics study of Baihe Jizihuang Tang in a rat model of chronic unpredictable mild stress. J. Chromatogr. B Analyt. Technol. Biomed. Life Sci.. 2020;1148:122143
- [CrossRef] [Google Scholar]
- Identification of changes in volatile compounds in dry-cured fish during storage using HS-GC-IMS. Food Res. Int.. 2020;137:109339
- [CrossRef] [Google Scholar]
- Bioactivities of serotonin transporter mediate antidepressant effects of Acorus tatarinowii Schott. J. Ethnopharmacol.. 2019;241:111967
- [CrossRef] [Google Scholar]
- Trans-anethole attenuates diet-induced nonalcoholic steatohepatitis through suppressing TGF-beta-mediated fibrosis. Clin. Res. Hepatol. Gastroenterol.. 2021;46:101833
- [CrossRef] [Google Scholar]
- Study on the compatibility interactions of formula Ding-Zhi-Xiao-Wan based on their main components transport characteristics across Caco-2 monolayers model. J. Pharm. Biomed. Anal.. 2018;159:179-185.
- [CrossRef] [Google Scholar]
- The effects of Acorus tatarinowii Schott on 5-HT concentrations, TPH2 and 5-HT1B expression in the dorsal raphe of exercised rats. J. Ethnopharmacol.. 2014;158(Pt A):431-436.
- [CrossRef] [Google Scholar]
- Methyleugenol counteracts anorexigenic signals in association with GABAergic inhibition in the central amygdala. Neuropharmacology. 2018;141:331-342.
- [CrossRef] [Google Scholar]
Appendix A
Supplementary material
Supplementary data to this article can be found online at https://doi.org/10.1016/j.arabjc.2022.104231.
Appendix A
Supplementary material
The following are the Supplementary data to this article:Supplementary data 1
Supplementary data 1


