

Translate this page into:
Non-functionalized oil palm waste-derived reduced graphene oxide for methylene blue removal: Isotherm, kinetics, thermodynamics, and mass transfer mechanism
⁎Corresponding author at: Faculty of Chemical Engineering & Technology, Universiti Malaysia Perlis (UniMAP), Kompleks Pusat Pengajian Jejawi 3, 02600 Arau, Perlis, Malaysia. umifazara@unimap.edu.my (Umi Fazara Md Ali)
-
Received: ,
Accepted: ,
This article was originally published by Elsevier and was migrated to Scientific Scholar after the change of Publisher.
Peer review under responsibility of King Saud University.
Abstract
The discharge of colored effluents from industries is one of the significant sources of water pollution. Therefore, there is a growing demand for efficient and low-cost treatment methods. An adsorption process with reduced graphene oxide (rGO) synthesized using a novel double carbonization and oxidation method from the natural precursor of oil palm empty fruit bunch (OPEFB) as adsorbent is a promising approach for addressing the problem. In this study, OPEFB biochar was mixed with ferrocene with a ratio of 5:1 (m/m) and oxidized under nitrogen flow at a temperature of 300 °C for 20 min, which resulted in 75.8 wt% of yield. The potential of the synthesized rGO as an effective adsorbent for dye removal from water and wastewater was explored using methylene blue (MB) as a model. Several factors were investigated, including adsorbent dosage, initial concentration, contact time, and pH, to obtain the optimum adsorption condition through batch studies. The physical and chemical characteristics of the rGO in terms of functional groups, surface morphology, elemental composition, and crystallinity phase were determined through characterization. The nonlinear isotherms were appropriated using several error functions to describe the adsorption isotherm with a maximum adsorption capacity of 50.07 mg/g. The kinetic study demonstrates that MB’s adsorption fits the PFO kinetic model and agrees with Bangham’s interpretation of pore diffusion. The adsorption mechanism was found to be physisorption on the multilayer heterogeneous surface of the rGO involving π-π interaction, hydrophobic association, and electrostatic interaction. The thermodynamics study showed that the process was spontaneous and exothermic. The mass transfer mechanism study shows that the adsorption is controlled by intraparticle diffusion and involves complex pathways. The study found that the novel non- functionalized rGO could remove cationic dyes from water and wastewater.
Keywords
Reduced graphene oxide
Oil palm waste
Cationic dye
Adsorption
Thermodynamics
Mass transfer mechanism

1 Introduction
It is becoming increasingly difficult to ignore the water pol- lution caused by the discharge of colored effluents from indus- tries. More than 700 000 tons of dyes are produced worldwide annually, and 5–10 % of the dye substances are lost in the in- dustrial effluents (Dim, 2013). Growing textile industries in Malaysia, especially batik industries, contribute to the national import and export value. However, a major problem with the growing industries is the colored effluents released cause neg- ative effects on the environmental quality (Pang and Abdullah, 2013). The textile industries, food producers, and dye facto- ries are also no exception in discharging liquid effluents. The high visibility of dye, even at a deficient concentration, may af- fect the plankton’s photosynthesis and disrupt the ecosystem’s food chain (Berizi et al., 2016). Dyes from the industry are also harmful to humans as they can cause irritation to the di- gestive tract when inhaled, cause skin and eye irritation, and worse, cause mutation and cancer. Methylene blue (MB) is one of the widely used synthetic color dyes responsible for causing adverse effects on humans and the environment.
Although there are numerous conventional methods for dye removal from water, including oxidation, reverse osmosis, and ion exchange treatment, adsorption is widely used due to its ef- ficiency, feasibility, and low cost. Carbon-based materials are very well known as adsorbents for removing dyes through ad- sorption. Graphene, a carbon-based material, is an excellent choice other than widely used activated carbon as an adsorbent due to its excellent physiochemical and mechanical properties. Graphene oxide (GO) is an oxidized form of graphene through exfoliation of graphene resulting in graphene sheets contain- ing epoxy, hydroxyl, and carboxylic functional groups. The oxygen-containing functional groups in the GO help in the ef- fective adsorption of cationic dyes such as MB or crystal violet (CV); however, it is negligible for anionic dyes such as methyl red (MR) and methyl orange (MO). However, the reduced form of GO, the reduced graphene oxide (rGO), exhibits a high sur- face area with numerous functional groups to act as an excellent adsorbent for various dyes, including MB.
All the methods proposed so far to produce rGO, however, suffer from the fact that the methods are expensive, compli- cated, and even produce toxic gases that may harm the envi- ronment. Typically, the Hummers’ method (Hummers Jr and Offeman, 1958) and modified Hummers’ methods are com- monly used in producing rGO but expensive and complicated. The use of potassium chlorate (KClO3) in Hummers’ releases toxic gases such as chlorine dioxide (ClO2), nitrogen dioxide (NO2), and dinitrogen dioxide (N2O2) (Yu and Le, 2018). The introduction of modified methods of the Hummers’ (Marcano et al., 2010; Sujiono et al., 2020) does not help with resolv- ing the high cost of production and complex steps of produc- ing the rGO despite being more eco-friendly as it does not release any toxic gases with the use of a mixture of sulfuric acid (H2SO4)/phosphoric acid (H3PO4) (Guo and Dong, 2011). Brodies’ method (Brodie, 1860) is no longer favorable due to the high defects of the GO and the high thermal stability of oxygen functional groups, which are hard to reduce into rGO (Botas et al., 2013). Therefore, this work seeks to address the problem by synthesizing the rGO without going through the production of GO and reducing GO into rGO. The method was aimed to produce rGO directly from oil palm empty fruit bunch (OPEFB) biochar through oxidation by air and reduc- tion using ferrocene. The current study focused on the rGO without the interference of other materials that resulted from functionalization through doping or fabrications. Therefore, the rGO was studied as a single adsorbent. To date, there are no other reported studies on the non-doped or non-fabricated rGO produced from a natural precursor that includes the study on isotherm, kinetics, thermodynamics, and mass transfer mecha-nism on the adsorption of cationic dyes.
2 Methodology
2.1 Precursor preparation and synthesis of rGO
OPEFB was washed with distilled water several times. The washed OPEFB was then placed in an oven, heated to 400 °C under nitrogen flow conditions, and crushed later into powder (Nasir et al., 2017). The rGO synthesis method was adapted (Model: Bruker D2 PHASER, Massachusetts, United States of America).
2.2 Adsorption studies
The batch studies were carried out at room temperature. Sev- eral parameters, including adsorbent dosage (0.01–0.10 g), pH (3–11), initial concentration (5–25 mg/L), and contact time (20–100 mins), were studied to determine the optimum condition for MB removal. The corresponding weighed rGO is performed in a set of 100 mL of tightly sealed volumetric flask. The flasks were placed on the shaker at a constant speed of 120 rpm for a given time. Upon completion of the shaking process, each solution was filtered using filter paper to separate the adsor- bent from the solution. Each solution concentration was evalu- ated using a UV–vis spectrometer with a wavelength of 664 nm (Ahmed and Dhedan, 2012).
2.3 Equilibrium study
The adsorption data at a different initial concentration (5–25 mg/L) at 1 h from the batch studies were taken for the ad- sorption equilibrium study. Through the nonlinear fitting, the experimental points were plotted using Langmuir, Freundlich, Sips, and n-BET isotherm. The respective isotherms were de- termined using the curve fitting tool in MATLAB R2022A.
2.4 Kinetic study
The data of adsorption at different contact times (20–100 mins) was taken from the batch studies. The nonlinear forms of Pseudo-first order (PFO), Pseudo-second order (PSO), and Bangham kinetic models were plotted using the curve fitting tool provided in MATLAB R2022A.
2.5 Thermodynamics study
Similar steps in adsorption studies were applied for the ther- modynamics study by varying the temperature from 30 to 40 °C. The thermodynamic parameters were determined by fitting Ar- rhenius Equation into linear and nonlinear forms in Microsoft Excel: from (Sa et al., 2018; Somanathan et al., 2015; Yu and Le, 2018). 12.5 g of oil palm empty fruit bunch (OPEFB) biochar powder was mixed with 2.5 g ferrocene in an aluminum con– tainer before being carbonized and oxidized. The mixing was placed in a furnace and gradually heated up to 300 °C for 20 mins under nitrogen flow conditions. The resulting sample was cooled down to room temperature and weighed.
2.6 Characterization
Fourier transform infrared spectroscopy (FTIR) was per- formed to analyze the functional groups in the OPEFB biochar and synthesized rGO. The surface morphology was examined using scanning electron microscopy (SEM) (Model: Hitachi TM3000, Tokyo, Japan). Energy dispersive X-ray spectroscopy (EDX) was used to identify the elemental composition of the samples. The crystallographic structure of the materials was determined using X-ray powder diffraction spectroscopy (XRD).
Where k is the rate constant (dimensionless), A is the pre- exponential factor, Ea is the activation energy (KJ/mol), and R is the (Universal gas constant = 8.314 J/K mol), and T is the absolute temperature (in Kelvin).
2.7 Mass transfer mechanism
The intraparticle diffusion model was plotted using MAT- LAB R2022A curve fitting tool through the linear fitting. The model was assessed with the PFO, PSO, and Bangham kinetic models to interpret the mass transfer mechanism. The intra- particle diffusion model was plotted using the following equa- tion:
where kp is the intraparticle diffusion constant (mg g−1 min−0.5).
2.8 Error analysis
The margin of error between theoretical and experimental data of nonlinear fittings was analyzed through the inclusion of error functions: squared estimated of errors (SSE) and root mean square error (RMSE). Marquardt’s percentage standard deviation (MPSD) was used in the determination of isotherm fittings, while kinetic models utilize the use of sum squares er- rors (ERRSQ) as the number of parameters function,p is un- available in kinetic models. The model equations are given in the supplementary information.
3 Results and discussion
3.1 Characterization of OPEFB biochar and rGO
3.1.1 FTIR analysis
Fig. 1 indicates the spectrum peaks of OPEFB biochar and rGO. By comparing these spectrum peaks, three peaks have shifted and permanently exist for rGO at C⚌O stretching of amide (1556 cm−1), C—N stretching of aliphatic amine (1030 cm−1), and C—H bending of the alkyne (693 cm−1). Untreated OPEFB biochar showed a much more complex spectrum sug-.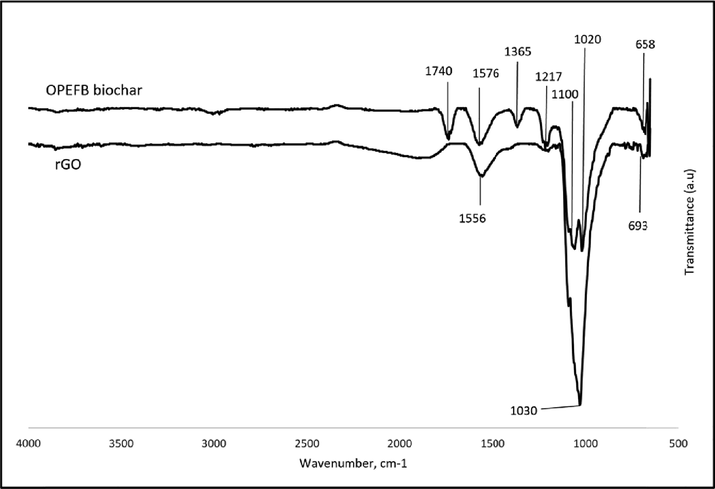
FTIR spectrum of OPEFB biochar and rGO.
gesting the functional groups of lignocellulosic materials. A strong peak at peak 1740 cm−1 indicated the C⚌O stretching of aldehyde. Moreover, peak 1576 cm−1 showed the C⚌O stretch- ing of amide, while peak 1365 cm−1 exhibited the existence of O—H stretching of hydroxyl phenol functional group. Peak 1216 cm−1 indicates C—O stretching of ether. In addition, two peaks were observed at 1110 cm−1 and 1020 cm−1, indicating the ex- istence of the C—N stretching of aliphatic amine. The peak of 658 cm−1 signals the presence of the alkyne group’s C—H bend- ing.
As the current study does not provide a comparison of peaks between GO and rGO, it is understandable for the material to have increased in the peak of the oxygen-containing functional group as the rGO undergoes the oxidation process and is re- duced by the ferrocene. The limited and low-intensity peaks compared to GO suggest a successful synthesis of rGO (Mahi- uddin and Ochiai, 2021; Sajab et al., 2018; Shen et al., 2012).
3.1.2 SEM analysis
Fig. 2 illustrates the OPEFB biochar and rGO morphol- ogy at 5,000x magnification. The porous structure does not diminish after carbonization, suggesting the pyrolysis possi- bly does not change the structure of the precursor much. The possible occurrence was the loss of water content and organic compounds through decomposition resulting in the mass loss (Abnisa et al., 2013). The crumpled thinner sheets in the rGO mainly caused by the reduction by ferrocene formed the dis- ordered structure of the rGO (Hidayah et al., 2017). The ob- served distorted structure on the surface prevents stacking of graphene layers by forming mesopores and macropores (Arias et al., 2020). Some impurities can be observed at the layers of the rGO, as confirmed through the EDX analysis (see Fig. 3).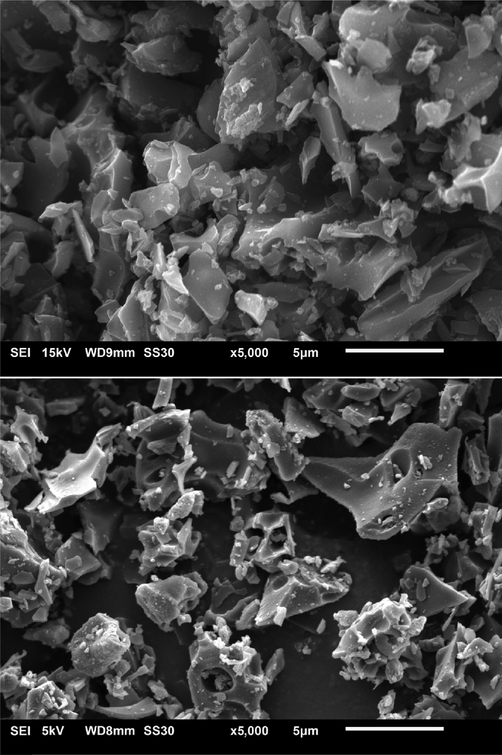
SEM micrograph of (a) OPEFB biochar (b) rGO.
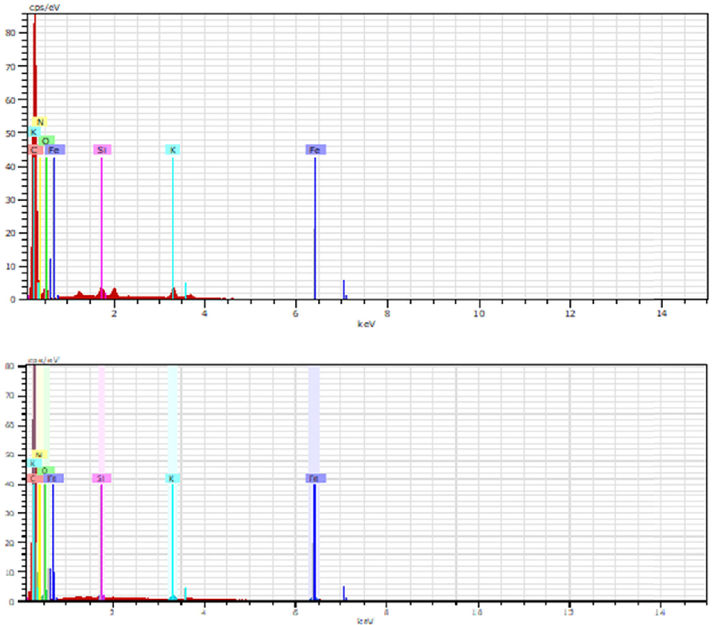
EDX spectrum of (a) OPEFB biochar (b) rGO.
The arrangement of the rGO can be seen as more parallel in arrangement compared to the biochar, indicating the pres- ence of stacking layers (Drewniak et al., 2016). The incom- plete stacking due to the nearby blocked pores, might result in restacking that eventually lead to the π-π interaction between rGO and the dye (Nasir et al., 2017).
3.1.3 EDX analysis
Fig. 4 illustrates the EDX analysis peaks. The carbon el- ement is higher for the rGO with up to 80 cps/eV (67 %) com- pared to the OPEFB biochar with around 70 cps/eV (66.2 %) due to the second carbonization, which increases the carbon content. The oxygen content is higher in the OPEFB biochar with 48 cps/eV (12.4 %) compared to 46 cps/eV (10.3 %) in the rGO, suggesting the reduction of oxygen-functioning groups.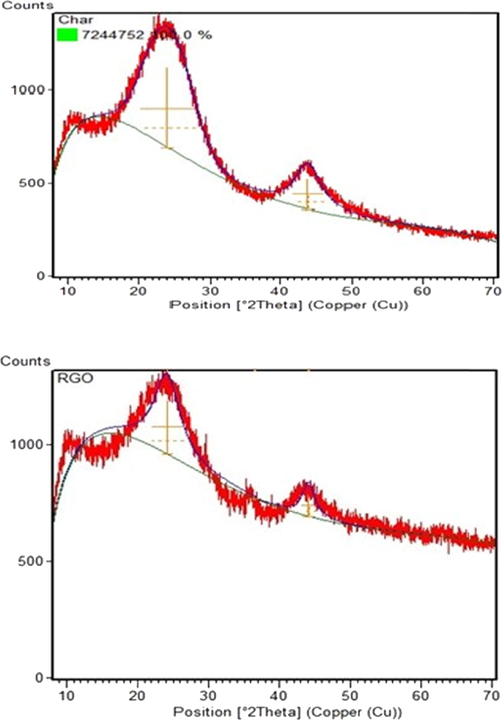
XRD pattern of (a) OPEFB biochar (b) rGO.
The presence of N, K, Fe, and Si are attributed to the nu- trients in the biochar through devolatilization via the pyroly- sis process (Claoston et al., 2014). The impurities are possibly present due to the reduction process as well (Narayanan et al., 2022). However, the presence of impurities does not interfere with the performance of rGO as the elements are completely liberated from the carbonaceous components in the rGO (Peng et al., 2016). (Sadhukhan et al., 2016) on their study also found several impurities in the rGO while obtaining high carbon ele- ment content with reduction lowering the oxygen content. The impurity may increase due to the trapping of atoms of elements such as potassium and sulfur due to the heating with nitrogen atmosphere (Nugraheni et al., 2015) that occurred both in py- rolysis and carbonization-oxidation process.
3.1.4 XRD analysis
The XRD pattern obtained from the analysis is shown in Fig. 4. For OPEFB biochar, one sharp peak is observed at 2θ = 24.09°. The peak confirmed a well-arranged layer struc- ture with a d-spacing of 3.69143 (FWHM = 7.645), following the Crystallography Open Database (COD) pattern COD2021 466,505 Xpert Highscore Database. The peak may be attributed to the crystalline cellulose in the biomaterial (Hidayah et al., 2017; Razali and Kamarulzaman, 2020). Due to short-range ordered peaks, the biochar can be assumed to be an amorphous structure. However, the observed peaks, including peak at 2θ.
= 43.81° with d-spacing of 2.06462 (FWHM = 4.5), cannot be ignored as it suggests the crystalline structure. Therefore, the biochar structure is essentially amorphous despite having some local crystalline structure of conjugated aromatic compounds (Cheng and Li, 2018).
The broad peak was observed at 2θ = 24.12° with d- spacing of 3.68680 (FWHM = 4.429778). The decrease in the d-spacing indicates the improvement in the order of the 2-dimensional material and the slight increase suggest the in- crease in oxygenated groups from the oxidation process (Nasir et al., 2017). In addition, the peak also showed the presence of a π-conjugated structure of graphene, proving the similarity between the structure of OPEFB precursor with graphene (Hi- dayah et al., 2017). On the other hand, a peak at 2θ = 44.04° with a d-spacing of 2.05460 (FWHM = 2.180433) sees an in- crease in lattice spacing in response to the increase in oxygen functional groups. The new short sharp peak at 2θ = 36.52° with d-spacing of 2.45859 (FWHM = 0.001) indicated the oxi- dation results with intercalation of oxygen functional groups in the rGO layer (Cao and Zhang, 2015).
3.2 Effect of adsorbent dosage
In controlled conditions, Fig. 5 shows the MB removal percentage increased from 93.7 % to 98.78 % before deteriorat-ing to 79.89 %, with the increase in dosage from 0.01 g to 0.10 g. As the optimum dosage is 0.05 g with the highest MB removed; therefore, the dosage was selected for other parameters.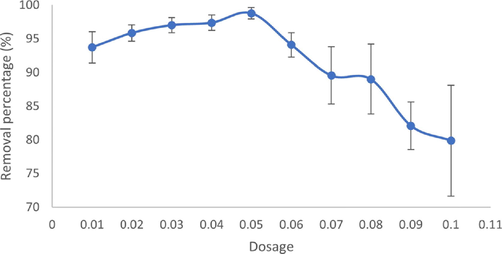
Effect of adsorbent dosage on the removal efficiency of MB (Initial dye concentration: 5 mg/L, Volume = 20 mL, T = 25 °C.
The decreasing pattern after 0.05 g probably because when the dose of adsorbent exceeds the optimal value, the dye molecules cannot access the adsorption sites (Rajumon et al., 2019). Additionally, the aggregation of the adsorbent particles was induced by increasing the adsorption dosage, and the in- crease in screening effect might reduce the surface area and thus removal efficiency (Huo et al., 2015; Singh et al., 2021; Wang et al., 2014; Zhang et al., 2011).
Interestingly, several studies (Gilbert et al., 2011; Kumar et al., 2008; Pal and Maiti, 2020; Yeddou-Mezenner, 2010) have revealed that the adsorption efficiency decreased with an in- crease in the dosage of biosorbents. In correlation, rGO pro- duced from OPEFB in this study can be categorized as biosor- bent as it is produced from biomaterial. The particle aggrega- tion occurred due to the high dosage may result in aggregation of particles and inferential or repulsive forces between the bind- ing sites, reducing the interaction between the dye and biomass and reducing the adsorbent’s surface area.
3.3 Effect of initial concentration
Fig. 6 shows the intercorrelations between the effect of the initial concentration on the adsorption capacity and dye removal efficiency. As can be seen from the graph, the dye removal efficiency was demonstrated to reach the maximum value of 99.27 % at the lowest MB concentration of 5 mg/L and is the lowest with the value of 81.02 % at the highest concentration of 45 mg/L. It is hypothesized that the increase in MB concentra- tion decreases the removal efficiency due to the saturation of the active sites of the reduced graphene oxide (rGO) despite the in- crease in adsorption capacity, qe (Azmi et al., 2016; Mahiuddin and Ochiai, 2021).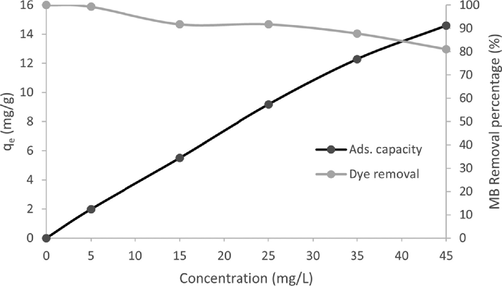
Effect of initial concentration on the removal of MB dye by rGO (rGO dosage: 0.05 g / 20 mL, T = 25 °C).
At 100 mins mark, it can be assumed that all the dyes that the rGO could adsorb have been adsorbed (Gupta and Khatri, 2017). It happened due to the saturation at a higher concen- tration of MB. Therefore, as the initial concentration increases, the binding sites on the rGO are more occupied, leaving fewer unoccupied sites. The initial concentration provides the nec- essary force to overcome the resistance of interchanging dye molecules between the aqueous and solid phases (Azmi et al., 2016).
3.4 Effect of contact time
Data in Fig. 7 shows that the adsorption capacity at a given time increases rapidly with the increase in time at the first 20 min and increases slowly for the next few minutes before reaching the plateau. Interestingly, no significant adsorption occurred after 20 min for most initial concentrations, indi- cating the adsorption had reached equilibrium. Due to the early reach of the equilibrium due to the saturation limit, the adsorp- tion can be carried very fast in 20 min to obtain the maxi- mum adsorption. In correlation, as contact time increases, the equilibrium was approached, resulting in the adsorption process becoming less efficient, thus explaining the decrease in removal percentage.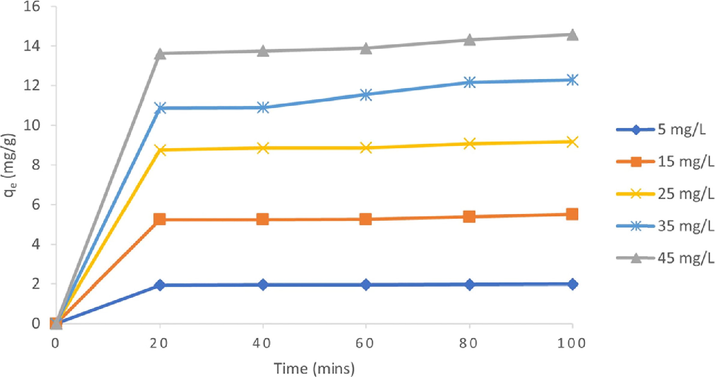
Effect of contact time on the removal of MB dye by rGO (initial dye concentration: 5, 10, 15, 20, and 25 mg/L, rGO dosage: 0.05 g / 20 mL, T = 25 °C).
3.5 Effect of pH
Fig. 8 shows the effect of pH of the initial MB solution for the adsorption of MB on rGO. In Figure 4.9, there is a clear trend of increasing removal efficiency with the increase in pH, with the highest percentage of removal at pH 11 with 95.41 % and the lowest at pH 3 with 78.85 %. The adsorption of cationic dye with rGO showed that adsorption occurred faster at higher pH, suggesting adsorption of MB on rGO occurs faster at neutral and alkaline pH (Gupta and Khatri, 2017). It might be that by decreasing the pH, more H+ ions need to compete with the cationic dye to be adsorbed by the rGO, decreasing ef- ficiency. At neutral and alkaline pH, the electrostatic attraction between the negatively charged rGO and the dye increase due to the fewer H + ions available, thus increasing the adsorption (Adel et al., 2021b).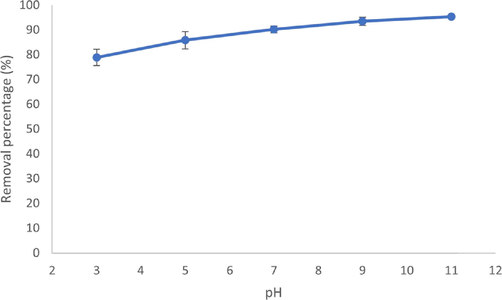
Effect of pH on the removal of MB dye by rGO (initial dye concen- tration: 5 mg/L, rGO dosage: 0.05 mg / 20 mL, T = 25 °C).
As MB is a basic thiazine dye with pKa of 2.6, MB ac- cepts protons under highly acidic conditions, making the MB di-cationic, thus increasing the MB’s polarity, leading to the low affinity between the di-cationic MB with the hydrophobic rGO surface, decreasing the efficiency. On the other hand, in the case of higher pH in neutral and alkaline conditions, the stable mono-cationic MB with moderate amphiphilicity will enhance the adsorption (Mahiuddin and Ochiai, 2021).
3.6 Adsorption isotherm
Adsorption isotherm models were used to predict the mech- anisms of adsorption processes in this study. Fig. 9 indicate the fittings, and Table 1 shows the Langmuir, Freundlich, Sips, and n-BET adsorption isotherm models with their respective parameters and error function values.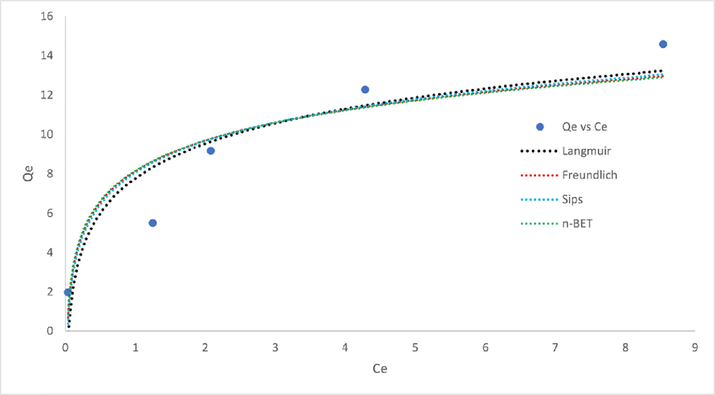
Fitting of adsorption isotherms models to experimental data.
Qm
KL
R2
SSE
RMSE
MPSD
Langmuir
19.15
0.3954
0.9617
3.948
1.147
50.5822
KF
nF
R2
SSE
RMSE
MPSD
Freundlich
6.306
2.464
0.9657
3.532
1.085
18.5629
Qs
Ks
R2
SSE
RMSE
MPSD
Sips
50.07
0.1419
0.967
3.399
1.304
31.0903
QmBET
KLBET
Ks
nBET
R2
SSE
RMSE
MPSD
n-BET
2.758
0.4697
63.82
5.502
0.9946
0.5553
0.7452
5.4784
Through the fittings, the four-parameter n-BET model fit the adsorption experimental data from the batch studies, obtaining the highest value of R2 and the lowest value of SSE, RMSE, and MPSD. The value indicates that the adsorption of MB can be described through multilayer adsorption with the assump- tion of five layers based on the nBET value of 5.502. (Ahmad et al., 2021). The nBET value of higher than 1.5 emphasizes that the adsorption occurred on the multilayer surface of rGO (Ahmad et al., 2020). The Sips value of ns more than 1.0 de- scribes the heterogeneity of the rGO surfaces (Nethaji et al., 2013), thus, describing Freundlich rather than Langmuir, ex- plaining the higher R2 and lower other error functions value of Freundlich compared to Langmuir. In addition, with the Sips favoring the Freundlich, the finding supports the multilayer ad- sorption assumed by the n-BET isotherm. Qs is used as the maximum adsorption capacity with the value of 50.07 mg/g as QmBET value only presents the maximum adsorption capacity per layer. Table 2 provides the comparison of maximum ad- sorption capacity in this study with previous literature.
Adsorbents
Max. ads (mg/g)
Reference
rGO
50.07
This study
g-C3N4 (Urea)
2.51
(Zhu et al., 2015)
Activated carbon
21.83
(Sumalinog et al., 2018)
ZnFe2O4/rGO
212.77
(Wang and Shih, 2021)
Activated Carbon
103.1
(Lim et al., 2021)
Seed hull
8.40
(Du et al., 2016)
3.7 Adsorption kinetics
Table 3 shows the value of error functions and parameters for each kinetic model. The plots of PFO, PSO, and Bangham indicate that PSO fits the adsorption kinetics with the highest R2 and the lowest SSE, RMSE, and ERRSQ values, closely fol- lowed by Bangham and PFO. However, to conclude that the adsorption is chemisorption through the determination of high fitting of PSO is misleading as the diffusion models and ther- modynamics parameters can better describe the physicochem- ical adsorption (Kajjumba et al., 2019). The good PFO fitting might be attributed to the irregular stacking of the rGO that is responsible for the physisorption. The good fitting of the Bang- ham kinetic model defines that the pores formed caused by the distorted structure through the reduction of oxygen functional groups play a major role in the adsorption process (Mezenner and Bensmaili, 2009).
K1
Qe
R2
SSE
RMSE
ERRSQ PFO
0.9134
1.958
0.9995
0.0014
0.0192
0.0088
K2
Qe
R2
SSE
RMSE
ERRSQ PSO
0.9175
1.983
0.9999
0.0003
0.0088
0.0019
Kb
Qe
R2
SSE
RMSE
ERRSQ Bangham
0.2035
1.0965
0.9998
0.0006
0.0122
0.0036
3.8 Thermodynamics
Table 4 shows the thermodynamic parameters of the adsorp- tion. To analyze the energy changes due to the adsorption pro- cess, thermodynamic parameters, including Gibbs free energy change (ΔGo), enthalpy change (ΔHo), entropy change (ΔSo), and activation energy (Eao) were determined. There is no real difference between results obtained from linear and nonlinear fitting, as Microsoft Excel could not fit the model data points into the value of Eo using the add-in solver, probably due to the restricted number of data points. The linear plotting was adapted from Van’t Hoff plots (Shikuku et al., 2018) by using 1/T (K) for the X-axis and ln k for the Y-axis, while for nonlin- ear fitting by plotting T (oC) against rate constant, k.
T (K) ΔGo (kJ/mol)
ΔHo (kJ/mol)
ΔSo (J/mol)
303.15–1.689
308.15–1.695
−1.306
1.186
313.15–1.701
The negative value of ΔGo at each different temperature in- dicated the spontaneous nature of the adsorption of MB onto rGO. The values obtained are 0 to −20 KJ/mol suggesting the physisorption process (Arias et al., 2020; Shikuku et al., 2018).
The result further validated the Freundlich isotherm and PFO, which predicted the multilayer physisorption. The ΔGo value increase with temperature rises, highlighting the exothermic na- ture of the reaction, which is unfavorable with temperature rise. The positive value of the entropy change (ΔSo) emphasizes the increase in molecular randomness at the solid/liquid interface, thus supporting the alteration of the structure of the rGO dur- ing reduction (Arias et al., 2020; Rajumon et al., 2019; Shikuku et al., 2018). The negative value of ΔHo supports the deter- mined ΔGo value by confirming the exothermic reaction with negative enthalpy of −1.306 kJ/mol.
For the determination of Eao through Arrhenius plotting, the slope value determined through the linear plotting was mul- tiplied by the ideal gas constant value of 8.314 J/K mol to obtain the −1.306 kJ/mol. The obtained value lower than 40 kJ/mol suggests the physisorption process (Inglezakis and Zor- pas, 2012). The value of activation energy results in a nega- tive value because the breaking of bonds only takes place in the chemisorption process, as the activation energy is needed to break bonds that require higher temperatures, which is negligi- ble in the case of physisorption.
3.9 Mass transfer mechanism
Table 5 shows the intraparticle diffusion parameters. The in- traparticle diffusion low R2 value does not qualify as the kinetic model to interpret the adsorption in this study. However, the obtained parameter C value of 0.916 (which is not zero) in intraparticle diffusion fitting is useful in indicating that the adsorption kinetics are not only controlled by intraparticle dif- fusion but involve complex mass transfer mechanism pathways (Ramesha et al., 2011). The increase in contact time of the ad- sorption contributed to the increase of the adsorption capacity of MB onto the rGO (Calimli et al., 2020). The Kp value of 0.5 > K greater than 0.1 interpret that the adsorption occurs strongly instan- taneously (Wu et al., 2009), in agreement with the result from batch studies.
Kp
C
R2
Intraparticle diffusion
0.0286
0.916
0.4487
The fitting of PFO signaled that the adsorption occurred due to a concentration difference attributed to the external coeffi- cient mass transfer. In addition, the negative activation energy indicates MB’s diffusion onto the surface of the rGO before mi- grating into the pores (Al-Ghouti et al., 2005), agreeing with Bangham kinetic model. The lower activation energy needed for the adsorption to happen instantaneously is supported by the parameter Kp value of the intraparticle diffusion model.
The physical adsorption behavior can be supported through the lower availability of H+ ions that directly enhance the ad- sorption by increasing the electrostatic interaction in the higher pH, thus proving that the rate-limiting step is diffusion con– trolled instead of chemical reactions (Adel et al., 2021a). The SEM characterization further suggested the involvement of Van der Waals (π-π) interactions between the rGO and dye due to the irregular stacking layers. Therefore, it can be assumed that it is an electrostatic and Van der Waals interaction, with no hint of hydrogen bonding (Wu et al., 2005), thus explaining the hy- drophobicity nature of rGO. Hence, these findings dismissed the significant role of functional groups on the rGO in the ad- sorption process.
4 Conclusion
The characterization data showed fewer oxygen-containing functional groups. The presence of high carbon content sug- gests the carbonaceous structure, and the low content of oxygen elements indicates the successful reduction of the rGO. In ad- dition, the determination of crumpled and crystalline structures supports the idea of the successful synthesis of rGO in terms of characterization.
The study found that the optimum dosage is as low as 0.05 g, and the optimum initial concentration is 5 mg/L. The investi- gation of the effect of contact time shows that no significant adsorption occurred after 20 min. The optimum pH is pH 11.
The n-BET isotherm best fits the adsorption data. The rela- tively good maximum adsorption capacity was achieved, which is 50.07 mg/g through the interpretation of Sips with the nF value of Freundlich of 2.464, suggesting heterogeneity of the adsorption. The adsorption mechanism is assumed to be ph- ysisorption on the multilayer heterogeneous surface of rGO.
The thermodynamics study showed that the adsorption was spontaneous and exothermic. The mass transfer mechanism of the adsorption is not only controlled by intraparticle diffu- sion but involves complex pathways. rGO effectively allows π-π interaction, hydrophobic association, and electrostatic in- teraction, which is advantageous when removing a wide range of dyes, including MB. The synthesized rGO is believed to have a large potential for scalability on industry-scale applications.
Acknowledgements
The authors acknowledged the financial support from the CRG-UTP-UniMAP grant (9023-00023) and Loreal-UNESCO FWIS 2020 grant (9008-00018).
References
- Characteri- zation of bio-oil and bio-char from pyrolysis of palm oil wastes. Bioenergy Res.. 2013;6:830-840.
- [Google Scholar]
- Effective removal of indigo carmine dye from wastewaters by adsorption onto mesoporous mag- nesium ferrite nanoparticles. Environ. Nanotechnol. Monit. Manage.. 2021;16
- [Google Scholar]
- Synthesis and characterization of magnetically separable and recyclable crumbled mgfe2o4/reduced graphene oxide nanoparticles for removal of methylene blue dye from aqueous solutions. J. Phys. Chem. Solids. 2021;149
- [Google Scholar]
- Ad- sorption of malachite green by activated carbon derived from gasified hevea brasiliensis root. Arabian J. Chem.. 2021;14
- [Google Scholar]
- Honeycomb-like porous-activated carbon derived from gasi- fication waste for malachite green adsorption: Equilibrium, kinetic, thermo- dynamic and fixed-bed column analysis. Desalin. Water Treat.. 2020;196:329-347.
- [Google Scholar]
- Equilibrium isotherms and kinetics modeling of methylene blue adsorption on agricultural wastes-based acti- vated carbons. Fluid Phase Equilib.. 2012;317:9-14.
- [Google Scholar]
- Ther- modynamic behaviour and the effect of temperature on the removal of dyes from aqueous solution using modified diatomite: A kinetic study. J. Colloid Interface Sci.. 2005;287:6-13.
- [Google Scholar]
- The ad- sorption of methylene blue on eco-friendly reduced graphene oxide. Nano- materials. 2020;10
- [Google Scholar]
- Preparation of activated carbon using sea mango (cerbera odollam) with microwave-assisted technique for the removal of methyl orange from textile wastewater. Desalin. Water Treat.. 2016;57:29143-29152.
- [Google Scholar]
- The study of non-linear kinetics and adsorption isotherm models for acid red 18 from aqueous solutions by magnetite nanoparticles and magnetite nanoparti- cles modified by sodium alginate. Water Sci. Technol.. 2016;74:1235-1242.
- [Google Scholar]
- Hydration behavior and dynamics of water molecules in graphite oxide. Ann Chim Phys. 1860;59:466-472.
- [Google Scholar]
- Preparation, characterization and adsorption kinetics of methylene blue dye in reduced-graphene oxide supported nanoadsorbents. J. Mol. Liq.. 2020;309
- [Google Scholar]
- Cao, N. and Zhang, Y. 2015. Study of reduced graphene oxide preparation by hummers’ method and related characterization. Journal of Nanomaterials, 2015.
- Preparation and application of biochar-based cat- alysts for biofuel production. Catalysts. 2018;8:346.
- [Google Scholar]
- Effects of pyrolysis temperature on the physicochemical properties of empty fruit bunch and rice husk biochars. Waste Manage. Res.. 2014;32:331-339.
- [Google Scholar]
- Adsorption of methyl red and methyl orange using different tree bark powder. Academic Research International. 2013;1:330-338.
- [Google Scholar]
- Studies of reduced graphene oxide and graphite oxide in the aspect of their possible application in gas sensors. Sen- sors (Switzerland). 2016;16
- [Google Scholar]
- Microwave-assisted preparation of almond shell-based activated carbon for methylene blue adsorption. Green Process. Synth,. 2016;5:395-406.
- [Google Scholar]
- Biosorptive removal of Pb2+ and Cd2+ onto novel biosorbent: Defatted carica papaya seeds. Biomass Bioenergy. 2011;35:2517-2525.
- [Google Scholar]
- Graphene nanosheet: Synthesis, molecular engi- neering, thin film, hybrids, and energy and analytical applications. Chem. Soc. Rev.. 2011;40:2644-2672.
- [Google Scholar]
- Reduced graphene oxide as an effective ad- sorbent for removal of malachite green dye: Plausible adsorption pathways. J. Colloid Interface Sci.. 2017;501:11-21.
- [Google Scholar]
- Comparison on graphite, graphene oxide and reduced graphene oxide: Synthesis and characterization. AIP Conf. Proc.. 2017;1892:1500021-1500028.
- [Google Scholar]
- High performance sponge-like cobalt sulfide/reduced graphene oxide hybrid counter electrode for dye-sensitized solar cells. J. Power Sources. 2015;293:570-576.
- [Google Scholar]
- Heat of adsorption, adsorption energy and activation energy in adsorption and ion exchange systems. De- salination and Water Treatment. 2012;39(1–3):149-157.
- [Google Scholar]
- Modelling of adsorption kinetic processes—errors, theory and application. Advanced Sorption Process Applications. 2019;2:1-19.
- [Google Scholar]
- Comparison of various error functions in predicting the optimum isotherm by linear and non-linear re- gression analysis for the sorption of basic red 9 by activated carbon. J. Hazard. Mater.. 2008;150:158-165.
- [Google Scholar]
- Adsorption of carbon dioxide (co2) by activated carbon derived from waste coffee grounds. IOP Conference Series: Earth and Environmental Science. 2021;765
- [Google Scholar]
- Lemon juice assisted green synthesis of reduced graphene oxide and its application for adsorption of methylene blue. Technologies. 2021;9:96.
- [Google Scholar]
- Kinetics and thermodynamic study of phosphate adsorption on iron hydroxide-eggshell waste. Chemical Engi- neering Journal. 2009;147:87-96.
- [Google Scholar]
- Hydrothermally synthesized zno and z-rgo nanorods: Effect of post-annealing temperature and rgo incorporation on hydrogen sensing. J. Mater. Sci.: Mater. Electron.. 2022;33(12):9455-9470.
- [Google Scholar]
- Oil palm waste-based precursors as a renewable and economical carbon sources for the preparation of reduced graphene oxide from graphene oxide. Nanoma- terials. 2017;7:1-18.
- [Google Scholar]
- Adsorption isotherms, kinetics and mechanism for the adsorption of cationic and anionic dyes onto carbonaceous particles prepared from juglans regia shell biomass. Interna- tional Journal of Environmental Science and Technology. 2013;10:231-242.
- [Google Scholar]
- Study on phase, molecular bonding, and bandgap of reduced graphene oxide prepared by heating coconut shell. Materials Science Fo- rum. 2015;827:285-289.
- [Google Scholar]
- An approach to counter sediment toxicity by immobilization of heavy metals using waste fish scale derived biosorbent. Ecotoxicol. Environ. Saf.. 2020;187
- [Google Scholar]
- Current status of textile industry wastewater management and research progress in malaysia: A review. Clean - Soil, Air, Water. 2013;41:751-764.
- [Google Scholar]
- Adsorption of methylene blue on graphene oxide prepared from amorphous graphite: Effects of ph and foreign ions. J. Mol. Liq.. 2016;221:82-87.
- [Google Scholar]
- Adsorption of textile dyes with ultrasonic as- sistance using green reduced graphene oxide: An in-depth investigation on sonochemical factors. Journal of Environmental Chemical Engineering. 2019;7
- [Google Scholar]
- Graphene and graphene oxide as effective adsorbents toward anionic and cationic dyes. J. Colloid Interface Sci.. 2011;361:270-277.
- [Google Scholar]
- Chemical characterizations of biochar from palm oil trunk for palm oil mill effluent (pome) treatment. Mater. Today:. Proc.. 2020;31:191-197.
- [Google Scholar]
- Graphene materials with different structures prepared from the same graphite by the hummers and brodie methods. Carbon. 2013;65:156-164.
- [Google Scholar]
- Large scale synthesis of reduced graphene oxide using ferrocene and hno3. Mater. Lett.. 2018;211:335-338.
- [Google Scholar]
- Studies on synthesis of reduced graphene oxide (rgo) via green route and its electrical property. Mater. Res. Bull.. 2016;79:41-51.
- [Google Scholar]
- Oleophilicity and oil-water separation by reduced graphene oxide grafted oil palm empty fruit bunch fibres. Sains Malaysiana. 2018;47:1891-1896.
- [Google Scholar]
- One-step solid state preparation of reduced graphene oxide. Carbon. 2012;50:2134-2140.
- [Google Scholar]
- Single and binary adsorption of sulfonamide antibiotics onto iron-modified clay: linear and nonlinear isotherms, kinetics, thermodynamics, and mechanistic studies. Applied Water Science. 2018;8
- [Google Scholar]
- Synergistic absorbents based on snfe2o4@zno nanopar- ticles decorated with reduced graphene oxide for highly efficient dye adsorp- tion at room temperature. RSC Adv.. 2021;11:17840-17848.
- [Google Scholar]
- Graphene oxide based coconut shell waste: synthesis by modified hummers method and characterization. Heliyon. 2020;6
- [Google Scholar]
- Eval- uation of the effectiveness and mechanisms of acetaminophen and methy- lene blue dye adsorption on activated biochar derived from municipal solid wastes. J. Environ. Manage.. 2018;210:255-262.
- [Google Scholar]
- Correlation between the adsorption ability and reduction degree of graphene oxide and tuning of adsorption of phenolic compounds. Carbon. 2014;69:101-112.
- [Google Scholar]
- Facile microwave hydrothermal synthesis of znfe2o4/rgo nanocomposites and their ultra-fast adsorption of methylene blue dye. Materials. 2021;14
- [Google Scholar]
- Kinetics and thermodynamics of the organic dye adsorption on the mesoporous hybrid xerogel. Chemical Engi- neering Journal. 2005;112:227-236.
- [Google Scholar]
- Initial behavior of intraparticle diffusion model used in the description of adsorption kinetics. Chem. Eng. J.. 2009;153:1-8.
- [Google Scholar]
- Kinetics and mechanism of dye biosorption onto an untreated antibiotic waste. Desalination. 2010;262:251-259.
- [Google Scholar]
- Yu, J. X. H. and Le, C. L. J. 2018. Entry to the stockholm junior water prize 2018. A Novel, Eco-friendly Synthesis of Reduced Graphene Oxide from Durian Rind and Sugarcane Bagasse for Water Filters.
- Fast and considerable adsorption of methylene blue dye onto graphene oxide. Bulletin of Environmental Contamination and Toxicology. 2011;87:86-90.
- [Google Scholar]
- Isoelectric point and adsorption activity of porous g-c 3 n 4. Appl. Surf. Sci.. 2015;344:188-195.
- [Google Scholar]
Appendix A
Supplementary material
Supplementary data to this article can be found online at https://doi.org/10.1016/j.arabjc.2022.104387.
Appendix A
Supplementary material
The following are the Supplementary data to this article:Supplementary Data 1
Supplementary Data 1


