

Translate this page into:
Surface modification of date palm activated carbonaceous materials for heavy metal removal and CO2 adsorption
⁎Corresponding author. a.bumajdad@ku.edu.kw (A. Bumajdad)
-
Received: ,
Accepted: ,
This article was originally published by Elsevier and was migrated to Scientific Scholar after the change of Publisher.
Peer review under responsibility of King Saud University.
Abstract
In this study, high surface area activated carbon (AC) was prepared from a local palm tree (Phoenix Dactylifera) using a variety of metal carbonates activators and finally achieved an excellent SBET of 2700 m2/g when Cs2CO3 was used as an activating agent at a temperature of 600 °C. Surface modification of AC was carried out using various nitrogen transporting agents, resulting in N-doped ACs with nitrogen content varying from 4.0 to 11.4 %, depending on the functionalizing agents and activators used. The bimodal (presence of micro- as well as meso-porosity) ACs with such excellent surface properties were studied for their CO2 uptake capacity at two different temperatures (0 and 25 °C) by isotherms recorded at pressure 1 bar and showed a remarkable uptake ability of 3.52 mmol/g (at 25 °C) and 5.6 mmol/g (at 0 °C), respectively. Also, batch experiments with variable pH, contact time, adsorbate concentrations, adsorbent dose, and temperatures were evaluated to understand the mechanism of sorption phenomena of Cr(VI) and Pb(II) achieving > 99.9 % removal capacity by the prepared ACs. Depending on the heavy metal ions being investigated, it was revealed that the pH of the solution and the amount of adsorbent had a direct impact on the total adsorption ability. Nitrogen atoms doped into the carbon frameworks were found to enhance the adsorption in the case of Pb(II) while the removal of Cr(VI) appeared to be unaffected. Maximum adsorption for Cr(VI) was observed at pH 2 and was determined to follow Freundlich isotherm while that of Pb(II) was observed at pH 7 and follows Langmuir isotherm. Best adsorption was found at an adsorbate concentration of 10 ppm and an adsorbent dose of 10 g/L. Kinetic modeling parameters showed the applicability of pseudo-second-order model perfectly.
Keywords
Activated carbon
Palm tree waste material
Heavy metal adsorption
Nitrogen doping
CO2 uptake
Water purification

1 Introduction
Hazardous metal ions like Arsenic (As), Manganese (Mn), Nickel (Ni), Chromium (Cr), Cadmium (Cd), Lead (Pb), Iron (Fe), Copper (Cu), Zinc (Zn), and Mercury (Hg) are among the key pollutants contained in wastewater from chemical industries (Lee, et al., 2017). The characteristic attributes of these heavy metals are non-biodegradability, prolonged accumulation, high toxicity, and mobility. Hence the safe and effective disposal of wastewater containing heavy metals is always a challenge to industrialists and environmentalists (Sekar et al., 2004). Dangerous levels of heavy metals in surface and ground water, mainly originate from either natural sources like a volcanic eruption and rock weathering or from anthropogenic sources like the release of unrefined effluent wastes from leather tanning, fertilizers, electroplating, batteries, wood preservatives, and painting industries (Shafeeyan et al., 2010). Many studies have shown that these metals are toxic even at low concentrations. When discovered above the tolerance level, this may then result in accumulative poisoning, cancer, and brain damage.
The hexavalent chromium (Cr(VI)) and the divalent lead (Pb(II)) ions are two of the toxic heavy metal ions which are common pollutants of the environment when present above the permissible limit, will seriously affect normal physiological functioning in humans as well as other living organisms. Chromium (Cr) is the seventh most abundant element that exists primarily in two stable oxidation states, Cr(III)) and Cr(VI), in which the hexavalent form is 100 times more toxic than the former because it is highly water-soluble, has more mobility, easily penetrable, easily oxidizable, and is a potential carcinogen (Gomez & Callao, 2006). Pb(II) in humans can lead to major issues such as harm to the kidney, liver, and reproductive system as well as negatively impact brain functions. The toxic symptoms of high lead dosage include anemia, headache, dizziness, irritability, muscle weakness, and renal damage (Abdulkarim & Al-Rub, 2004).
Among the various methods available for removing heavy metals from aqueous systems, adsorption by nano-sized adsorbents has become the most practical technique due to their high surface area and chemical activities caused by the size-quantization effect (Nasir et al., 2019). Activated Carbon (AC) can be generated either by physical activation or by chemical activation from suitable precursors. ACs are widely used for the removal of heavy metals from potable water and wastewater to reach permissible limits (Johns et al., 1999). It is evident that the introduction of different functionalities greatly improves the quality and adsorptive properties of ACs. Acidic functionalities mainly include oxygen-containing functional groups like carboxylic, lactones, phenols, carbonyls, quinones, pyrene, and ether which are generally located on the outer surfaces or edges of the basal plane of ACs. These specific outer positions are mainly considered as adsorption sites, hence the concentration of oxygen functional groups at these particular points has a great influence on the adsorption capabilities of carbon. Basic functional groups include pyrrole, pyridine, pyridone, amine, amide, quaternary nitrogen, imine, and nitro (associated with nitrogen), which imparts higher adsorption efficiency to ACs, is specifically beneficial for higher CO2 capture (Shafeeyan et al., 2010).
Considering modifying agents, the synthetic method can be classified into three main categories:(i) physical modification (ii) chemical modification, and (iii) biological modification. Among these, chemical activation refers to the carbonization of the precursor following the addition of activating agents which will limit the formation of tar and produce carbonized product with a well-developed porosity (after appropriate washing). The chemical incorporated into the interior of the precursor particle reacts with the products formed after pyrolysis and inhibits the shrinking of the particles, thus yielding a high amount of carbon with good porosity (Merzougui & Addoun, 2008; Theydan & Ahmed, 2012).
Any carbonaceous material with high carbon content and low inorganics can be used to produce ACs. Utilization of lignocellulosic biomass to produce AC for wastewater treatment helps to convert several natural wastes into value-added products. Agricultural by-products are promising raw materials in this context because of their green properties (availability, recyclability, and cost-effectiveness). Date tree-originated biomass has been considered one of the best candidates among the cheap and abundant agricultural wastes (especially in Mediterranean countries) for the facile fabrication of high quality ACs with, low toxicity, biodegradability, and high affinity toward heavy metals. On average, date palm material contains cellulose, hemicellulose, and lignin in the range of 40–50 %, 20–35 %, and 15–35 %, respectively. Both hemicellulose and cellulose have average percent elemental compositions of 44.4 wt% carbon, 49.4 wt% oxygen, and 6.2 wt% hydrogen (Jibril et al., 2008). Lignin has a three-dimensional polymer of phenyl propane units linked together by C—O—C or C—C bonds. This makes its elemental composition to be higher in carbon percentage (62 wt%) and lower in oxygen percentage (32 wt%).
Majority of the work reported for palm tree parts as raw material is on palm pits (stones) with/without the use of activators. Belhachemi et al. (2009) and, Ashour et al. (2010) adopted the physical activation method and produced AC from date pits of specific surface area (SBET) of 1443 and 1040 m2/g, respectively. An SBET of 864.8 m2/g was achieved by Abdulkarim and Al-Rub (2004) for AC from date pits for which they found that the effect of chemical modification (8-quinoline) after activation (air/H3PO4) is insignificant in the efficiency of adsorption of methylene blue and lead ion. Merzougui and addoun (2008) did chemical activation for the date pits with ZnCl2 or KOH and the SBET achived was about 880 and 1030 m2/g, respectively. Alhamed and Bamufleh reported AC with SBET of 991 m2/g from date stone with ZnCl2 as an activator (Alhamed & Bamufleh, 2009). CaO was employed as an activator by Danish et al. to produce AC from date pits and its SBET value was 962.49 m2/g (Danish et al., 2011). Palm stem was used as a raw material for oil adsorption by Jibril et al. where they investigated the effect of acid impregnation (H3PO4) and base impregnation (KOH) at an activation temperature range of 400–600 °C and they reached a maximum SBET of 1100 m2/g and 294 m2/g, respectively (Jibril et al., 2008). In another study, ferric chloride has been utilized by Theydan et al. for preparing AC from date pits of SBET = 780 m2/g (Theydan & Ahmed, 2012). Alaya et al. successfully produced microporous AC with SBET of 560 m2/g from date pits and SBET of 525 m2/g from palm leaves by activation with only steam (Alaya, et al., 2000). An SBET of 1094 m2/g (at 850 °C after 30 min activation time) was reported by Shoaib & Al-Swaidan (2016) by single-step activation in a mixture of gases (N2 and CO2). Date palm fiber was studied by Basheer et al. (2019) with KOH as activator and the obtained SBET was 669.7 m2/g (Hashemian et al., 2014).
The main aim of this study is to test the application of N-doped palm-originated ACs for the removal of two heavy metals (Cr(VI) and Pb(II)) from aqueous systems. We have prepared AC from palm stem (Ps-AC) and leaf (Pl-AC) separately by varying, activation conditions, activating agents, and nitrogen dopants, to obtain AC of good balance concerning the SBET, N content, pore distribution, etc. targeting effective removal of Cr(VI) and Pb(II) metal ions from water.
From literature, one can learned that using metal carbonates as activators is a novel approach for palm-originated ACs. Hence, in this work, different batches of ACs were prepared using different type (Na2CO3, K2CO3, Cs2CO3, CaCO3) and amount of metal carbonate activators. In addition, surface modification was carried out by employing different N-transporting agents to introdcue nitrogen-based surface functionalities which introduce delocalized electrons in aromatic carbon of the generated ACs. The specific surface area (SBET), total pores volume (Vtot), and average pore diameter (dp) of the products found to increase in the order, Ca-AC < Na-AC < K-AC < Cs-AC in agreement with the work of Fujiki and Yogo (2016) which was refered to the degree of reactivity of the carbonate salts. More focus was given to Ps-Cs2CO3 ACs as this batch possessed excellent SBET besides the other surface properties. Efforts were also directed to study the CO2 capture capacity of both synthesized functionalized and non-functionalized ACs. The success of CO2 capture applications on solid sorbents depends on the development of economic and high adsorption capacity sorbents that can be used at moderate temperatures. Thus, evaluation of modified ACs that enhance CO2-solid interactions, by nitrogen enrichments, for the influence of their chemical surface modifications on CO2 capture capacity and its variation with temperature is therefore crucial. Hence, in this study, N-tailored ACs that were produced from local palms were also tested for their application in CO2 uptake.
2 Materials and methods
2.1 Fabrication and functionalization of the adsorbent
Date palm parts are collected from local sources. It is washed several times to get rid of any impurities and dried at 90 °C overnight. Activated carbons were obtained as follows: 10 g of the dried and crushed biomass is mixed with 3 ml of concentrated HCl (36.5–38.0 vol%; J.T.Baker) and 5 ml of distilled water and impregnated with different volumes (20 to 60 ml) of 1.93 M aqueous solutions of metal carbonates (Na2CO3 (99.5 %), K2CO3 (99 %), or Cs2CO3 (99 %). All activators were purchased from Sigma-Aldrich (Germany) except for the low water-soluble CaCO3 nanopowder which consists of particle size in the range of 15–40 nm and was purchased from Sky spring nanomaterials (Houston, USA). CaCO3 (99 %) mixed directly with biomass before carbonization, instead of using as a solution. AC was prepared at 600 °C under N2 atmosphere (99.999 % from KOAC Kuwait) in a quartz tubular furnace (Carbolite STF15/180 furnace, UK) with specially designed quartz sample boats with a heating rate of 38 °C/min. A steady nitrogen gas flow was maintained throughout the pyrolysis. The resulting mass, then, was ground using a mortar followed by washing and filtration steps that were carried out until the pH of the filtrate become neutral. After drying the product in an air oven (Binder FD 115, Germany) overnight, etching was carried out to remove any cation residues which will considerably clog the pores of the carbon, thereby reducing its surface area.
Although the resulting Ps-ACs and Pl-ACs exhibited excellent surface properties, the N content was found to be very low. Hence, further functionalization was carried out for doping N into the carbon framework by nitrogen transporting reagents like 66.0–72.0 % ethylamine (EA), 99 % hexylamine (HA), 97 % N,N-dimethyldodecylamine (NNDDA), 99.5 % urea (U) and laboratory prepared dimethyldidodecylammonium bromide (DDAB). For this, the ACs produced are soaked in the reagents overnight and a second pyrolysis step is carried out at the same temperature (600 °C) except for DDAB modification. DDAB was dissolved in hot water, allowed to cool, and mixed with the primary AC prior to carbonization step that leads to N modification.
2.2 Characterization of the prepared Ps-ACs and Ps-N-ACs
The textural properties: surface area (SBET), total pore volume (Vtot), micro/mesopore volume (Vmicro & Vmeso), mean pore diameter (dp), and pore size distribution were determined for all the enriched and non-enriched samples. Nitrogen sorptiometry isotherms were measured at liquid nitrogen temperature using the automated instrument, Micromeritics Gemini VII 2390. The degassing temperature was 200 °C overnight under a vacuum. External surface area (Sext), micropores area (Smicro) and Vmicro & Vmeso are determined by t-plot method (Hu et al., 2003). Mesopore surface area (Smeso) and average pore width were determined by applying Barrett–Joyner– Halenda (BJH) method (Khalili et al., 2000; Donald et al., 2011). The Vtot values were determined from the amount of nitrogen adsorbed at P/P ͦ = 0.99. The adsorption dp were calculated from the Vmicro values and the values of SBET. XRD pattern was analyzed by Siemens/Bruker D 5000 X-ray powder diffractometer (USA). CHNS elemental analysis was performed using ELEMENTAR Vario Micro Cube Analyzer (Germany) mainly to check the elemental N content of the prepared ACs. The morphology of the adsorbent before and after heavy metal adsorption was acquired using Scanning Electron Microscope (SEM) (JEOL JSM 5700; Japan).
Surface functionalities and the effect of N-doping were assessed by various techniques. To clarify the surface chemical states of elemental content, the XPS spectrum was examined using an ESCALAB 250 xi (Thermo Scientific, UK) spectrometer using a monochromatic Al Kα radiation (1486.6 eV) with a spot size of 850 µm. The spectra acquisition and processing were carried out using the software Thermo Avantage, version v5.956. The sample was stuck on the sample holder using a double-sided carbon tape and then introduced into the preparation chamber and degassed until the proper vacuum was achieved. Then it was transferred into the analysis chamber where the vacuum was 10-10 mbar. The analysis was carried out using the following parameters: Pass energy of 20 eV, dwell time of 50 ms, and step size of 0.1 eV. Thermogravimetric were performed (Mettler Toledo TGA 2 apparatus, OH, USA) on pristine, activated carbons as well as functionalized carbons. The dried leaf and stem samples are studied by this technique in the temperature range of 25–1000 °C by simulating the conditions of sample preparation (under N2 atmosphere with a hold time of 1 h at 600 °C). For understanding the chemical structure and for functionalities on the surfaces of carbon materials, Fourier Transform Infrared Spectroscopy (FTIR) (JASCO-FTIR 6300 spectrometer, Tokyo, Japan) was utilized. The Raman analysis was performed using Raman microscope with an excitation wavelength of 785 nm line of a diode laser with an exposure time of 10 s and a grating of 1200 L/mm connected to a CCD camera (1040 × 256) detector. A magnification of L × 50 is obtained. A silicon wafer was used as an internal standard for calibration producing a Raman shift of 520.5 cm−1 with 1400 counts. Baseline corrections were performed for each spectrum using curve fitting with baseline subtract provided by Wire interface software with the proper polynomial order.
2.3 Quantitative assessment of surface acidic functionalities
Conventional acid/base titration methods studied by Boehm (1996) were used for a quantitative evaluation of acidic functional groups (carboxylic, lactone, phenol, and carbonyl) on carbon surfaces based on their selective base neutralization capacity. The acidity of a given functional group depends on its chemical environment (i.e, the size and shape of the polyaromatic layers, the presence and position of other substituents and the charge of neighboring dissociated groups). However, the difference in the acidity of the various types of functional groups is sufficiently large to allow differentiation by simple titration. A back titration method instead of direct titration was adopted using Na2CO3 as the titrator base to avoid interference due to CO2 effect because of the dissolution of CO2 from air forming HCO3− and CO32− as a side reaction (Schönherr et al., 2018). All experimental work was carried out in a batch mode. The surface chemistry was determined with the use of four independent base solutions of NaHCO3 which neutralizes the strongly acidic carboxylic groups, Na2CO3 (for lactones), NaOH (for phenols) and NaOEt (for weakly acidic carbonyl). In each adsorption experiment, 0.1 g adsorbent was added to 50 ml of the solutions with a known concentration in 100 ml Erlenmeyer flasks under room temperature. N2 gas is bubbled through each sample for 5 min to remove any oxygen present in order to avoid base-catalyzed auto-oxidation of carbon. Each mixture was subjected to continuous stirring for 48 h (25 °C,100 rpm) to ensure a complete reaction. The suspensions were filtered through syringe filters. 10 ml aliquots from each sample were taken to a screw cap bottle and added 20 ml of 0.1 N HCl. The produced aliquots were tested (by titrating all aliquots against the base solution) within an hour to avoid evaporation of the HCl. The same treatments were carried out with reference samples corresponding to four bases with the same steps (including bubbling N2 gas, shaking and filtration). The amount of Na2CO3 that reacted with the remaining moles HCl after neutralization with the base is used to calculate the number of surface acidic sites. The samples are analyzed by the potentiometric titration method with the help of Metrohm-Titrando Titrator (Switzerland).
2.4 Adsorption studies
Batch-mode adsorption studies were carried out by using the necessary adsorbents in 100 ml sealed Erlenmeyer flasks containing 50 ml of test solutions at desired pH, contact time, and adsorbent dosage levels. Different initial concentrations of Cr(VI) were prepared using CrO3 (99.9 %, Sigma Aldrich) and Pb(II) using Pb(NO3)2 (less than99.0 %, Sigma-Aldrich). The pH of the experimental solutions was adjusted by adding 0.01 N KOH and 0.01 N HCl solutions as required. The dried adsorbent was then added, and the contents in the flask were shaken in an incubator shaker (New Brunswick Scientific Co shaker, NJ, USA) at room temperature for one hour at a constant agitation speed of 100 rpm to reach adsorption equilibrium conditions. The suspensions were then filtered and tested for the presence of metal, after the attainment of equilibrium by Pinnacle 900F atomic absorption spectroscopy (AAS) (Perkin Elmer, USA). The amount of adsorbed metal ions (qe in mg/g) was calculated from the mass balance expression given,
and the percentage removal is calculated by,
Where C0 is the initial concentration (mg/L), Ce is the metal concentration (mg/L) at a given time, V is the volume of the solution (ml) and m is the weight of the sorbent (g).
Initial concentrations (C0) were ranged from 10 to 80 (mg/L). The effect of pH (ranging from 2 to 8) on the rate of adsorption were also studied at an adsorbent dosage of 10 g/L and metal ion concentration of 10 mg/L. Adsorption equilibria were studied for their suitability for Langmuir (Langmuir, 1918), Freundlich (Ng et al., 2002), and Temkin (Itodo and Itodo, 2010) isotherm models for both studied metal ions. Also, the kinetics (pseudo first-order vs pseudo second-order models (Hameed, et al., 2009) and thermodynamics (ΔG, ΔH, ΔS) of the adsorption reaction were explored (Zarei et al., 2019). More details of typical adsorption studies can be obtained from the literature (El Nemr et al., 2020). Here, most of the adsorption studies were focused on Ps-Cs2CO3 ACs sample because of the excellent surface characteristics although the Ps-K2CO3 samples were also investigated to a certain extent. The CO2 uptake capacity was determined for Ps-Cs2CO3 ACs (no N doping) and Ps-Cs2CO3-U ACs (doped with N-agent) uisng CO2 adsorption isotherms. The CO2 uptake capacities were recorded up to pressure 1 bar at temperatures 0 °C and 25 °C by Micromeritics ASAP 2020. Prior to sample analysis, 200 mg of the AC is weighed and introduced to the analyzer followed by degassing at 200 °C for 24 h. The analysis is performed after recording the final weight.
3 Results and discussion
3.1 Structural properties
3.1.1 Electron microscopy analysis
The SEM micrographs at different magnifications for K2CO3 and Cs2CO3 AC samples doped with nitrogen before (Fig. S1 a,b and e,f, respectively) and after (Fig. S1 c,d and g,h, respectively) adsorption of Pb(II) ions are given in Fig. S1. As expected, the samples exhibit irregular shapes and a presence of macropores/holes (as per SEM resolution) of different sizes and shapes which is generated during the inert pyrolysis process as a result of evolving of variety of gases. It is worth mentioning here that, not many differences are observed by SEM micrographs as a result of N-enriching or the use of different activation agents. Such microstructural changes can only be revealed by N2 sorptiometry and transmission electron microscopy (if the materials are still stable when bombarded by high energy electrons).
3.1.2 N2 Sorptiometry
Nitrogen sorptiometry isotherms for the studied AC samples are shown in Fig. 1 which depicts the effect of different activators on the surface characteristics of the ACs. The SBET, Vtot, dp are determined and found, depending on the activating agent used, to be in the range of 319–2704 m2/g, 0.23–1.59 cm3/g, and 2.0–4.9 nm, respectively (Table 1). Each activator proved to have a different effect on the isotherms. Ps-K2CO3-AC sample (Fig. 1a) exhibit Type Ib isotherm according to F. Rouquerol et al. new classification of isotherms (Rouquerol et al., 2013). Significant increase in the low-relative pressure range (P/P° less than 0.2) indicates a majority of micropores with complete overlap between adsorption and desorption curve (Xie et al., 2016; Xu et al., 2018). However, at higher relative pressure (P/P° > 0.2; i.e. above the knee), the nitrogen adsorption curves slowly increased up to a relative pressure of 0.9, then a larger increase at relative pressure above 0.9. This suggests that some extent of wider porosity (mesopores) and multilayers N2 adsorption also present with minimum external surface area (Sext). This sample (Ps-K2CO3-AC) shows no hysteresis which confirms the presence of majority of microporosity as clearly seen in the data reported in Table 1. Isotherms of AC with different activators are compared in Fig. 1a. The isotherm of Ps-Na2CO3-AC is of Type IIb which displays a H4 hysteresis loop at high relative pressure. It is worth mentioning here that Type IIb is a new classification proposed by F. Rouquerol et al. for isotherms similar to Type IV but with no plateau at high P/P° (Rouquerol et al., 2013). The emerging hysteresis loop within P/P° range from 0.4 to 0.9, commonly related to capillary condensation in the mesopores (Shoaib & Al-Swaidan, 2016; Meng et al., 2017). The presence of Types H4 hysteresis verifies the presence of slit-shaped pores, mostly in micropores range, which are commonly found in activated carbon. Isotherm for Ps-CaCO3-AC is also of Type IIb but the hysteresis is of Type H3 (Rouquerol et al., 2013) with an open-end. H3 hysteresis is usually associated with also a slit-shape pore but mostly in the meso-range. Such open end hysteresis could be due to incomplete combustion during precursor carbonization resulting in decrease of micropores generation (Tobi et al., 2019). The specific surface area was highest for the Ps-Cs2CO3-AC sample (Fig. 1b & Table 1). More mesopores area (Smeso = 1647 m2/g) were evident than micropores area (Smicro = 812 m2/g) for this AC sample, as compared with the remaining tested activators (see Table 1). This different feature is clearly due to the presence of quite profound mesopores being reflected into a clear hysteresis as a result of capillary condensation. In Fig. 1b, the isotherm (in black color) starts with a moderate rise at low relative pressures, indicating the existence of micropores followed by a clear large hysteresis loop extended from P/P° = 0.4 to 0.9 which also indicates the presence of a large amount of mesopores (Xie et al., 2016; Cazetta et al., 2018). To the best of our knowledge, this sample has the highest SBET of 2704 m2/g for studied palm-originated AC. Upon doping with urea, the surface area dropped dramatically, and the hysteresis size decreased due to a major reduction in the mesopores (see the data in red in Fig. 1b and Table 1). From Fig. 1c one can see that there is an occurrence of pore shrinkage in the case of Ps-HA and Ps-NNDDA ACs though the Ps-U, Ps-DDAB, and Ps-EA ACs showed similar well-developed pore structures.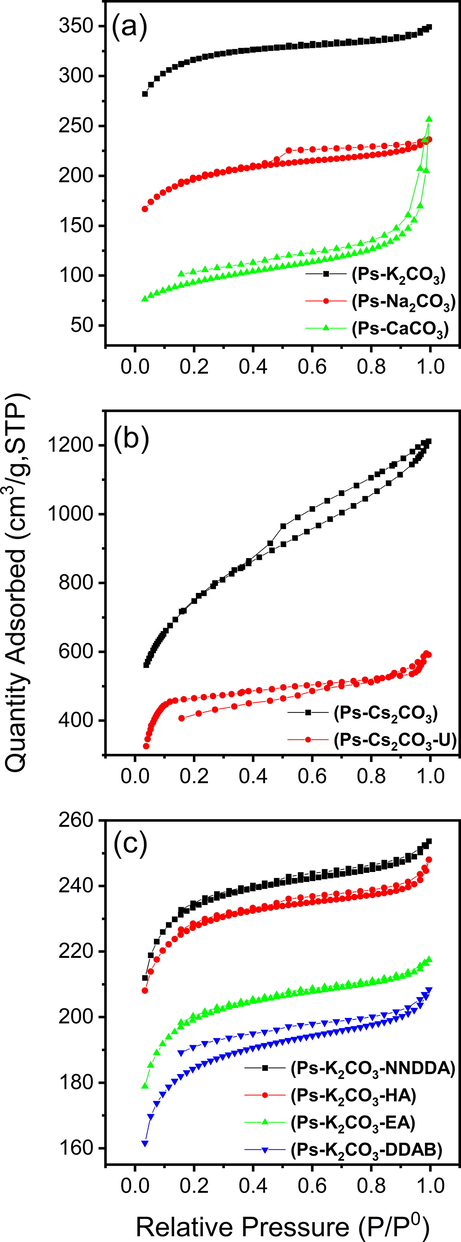
N2 sorptiometry isotherms showing (a) effect of different activators on Ps-ACs (b) before and after urea treatment for Ps-Cs2CO3-AC and (c) effect of different doping reagents on Ps-K2CO3-AC.
Sample
SBET a (m2/g)
Smicro b (m2/g)
Smeso c (m2/g)
Smeso + Sext b (m2/g)
Smicro/SBET (%)
Vtot a (cm3/g)
Vmicro b (cm3/g)
Vmeso c (cm3/g)
dp a (nm)
Ps-AC (no activator)
19
9
6
10
49
0.012
0.004
0.008
2.6
Ps-Na2CO3-AC
663
434
134
229
66
0.370
0.202
0.105
2.2
Ps-K2CO3-AC
1056
833
118
224
79
0.540
0.390
0.150
2.0
Ps-Cs2CO3-AC
2704
812
1647
1892
30
1.590
0.348
1.242
2.4
Ps-CaCO3-AC
319
159
118
161
49
0.397
0.074
0.323
4.9
Pl-AC (no activator)
2
2
0.9
0.4
86
0.004
0.001
0.003
7.8
Pl-Na2CO3-AC
410
314
62
97
77
0.230
0.147
0.087
2.3
Pl-K2CO3-AC
724
457
142
268
63
0.390
0.209
0.181
2.2
Pl-Cs2CO3-AC
1867
560
1130
1307
30
1.585
0.304
1.200
2.4
Pl-CaCO3-AC
295
109
147
186
37
0.335
0.050
0.285
4.5
Ps-K2CO3-DDAB
776
656
66
121
85
0.392
0.308
0.084
2.0
Ps-K2C03-EA
755
642
60
113
85
0.384
0.301
0.083
2.0
Ps-K2CO3-HA
663
547
64
117
83
0.336
0.256
0.080
2.0
Ps-K2CO3-U
645
557
50
88
86
0.327
0.262
0.065
2.0
Ps-K2CO3-NNDDA
616
491
71
126
80
0.322
0.229
0.093
2.1
Ps-Cs2CO3-U
1467
683
482
764
47
0.921
0.310
0.452
2.5
3.1.3 Surface parameters and pore size distribution
Table.1 allows us to compare the specific surface area and pore size characteristics for AC originated from palm stem/leaf and for the synthesized N-enriched ones. It was found that the porosities of all studied carbons possess bimodal pore structure (micro and meso) but with Cs2CO3 activator, the mesoporosity is more profound. Ps-Cs2CO3-AC also showed the highest SBET value of 2704 m2/g followed by Ps-K2CO3-AC with 1056 m2/g, then Ps-Na2CO3-AC with 663 m2/g and finally Ps-CaCO3-AC with 319 m2/g. The dramatic increase of surface parameters in Ps-Cs2CO3-AC is due to the presence of extermly high amount of mesopores (almost 70 % mesopores and 30 % micropores; see its Smicro/SBET% value in Table 1) whereas Ps-K2CO3-AC is characterized by a majority of micro- over mesopores (highest Smicro/SBET% of 79). Under the same activation conditions, the adsorption average pore diameter, dp, is ranged between 2.0 and 2.5 nm for all AC except for Ps-CaCO3-AC which was around 5 nm. These results reveal that incomplete dissolution of CaCO3 nanopowder during the activation step has altered the pore development. The reduction in SBET was observed in all N-doped ACs which is due to a great reduction of the mesoporosity (see Table 1) as the use of N-enrichment reagents and the second 600 °C thermal treatment caused blocking/collapsing of the already developed mesopores. The N2 sorptiometry parameters of ACs produced out of palm leaf (Pl samples) showed the same trend as that of stem-originated ones (Ps samples).
The trend could be further demonstrated by the pore size distribution obtained by the Horvath-Kawazoe method (Macías-García et al., 2006) (Fig. 2). On contrary to the other prepared ACs, Fig. 2 shows the presence of a distinctive high amount of mesopores in Ps-Cs2CO3-AC and Ps-Cs2CO3-U (data in black color). So, the use of Cs2CO3 activating agent resulted in ACs of bimodal extensive porosity that was reflected on its SBET values even after N-enriching using urea (see also Table 1). It is noted that, apart from the Cs2CO3-activated samples, the average pore size distribution is around 2 nm for all the N doped ACs, whereas it extends to slightly larger pore size ranges in the non-enriched ones (except Ps-K2CO3-AC sample which remains at 2 nm due to large decrease in the microporosity). From the surface area and pore size distribution of the studied samples one can conclude that some of the prepared ACs (e.g. Ps-Cs2CO3-AC and Ps-Cs2CO3-U) would possess high adsorption capacity.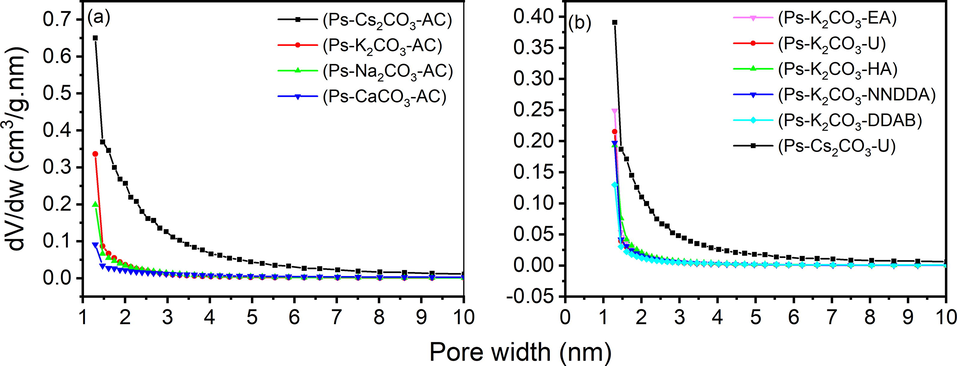
Pore size distribution using HK (Horvath-Kawazoe) method for ACs with (a) different activating agents and (b) different nitrogen doping reagents.
3.1.4 X-ray diffraction
The samples produced from palm stem and leaf parts showed very similar X-ray diffraction with characteristics comparable to those found in AC. The XRD patterns of normal and N-doped ACs are compared in Fig. S2. One strong peak at 2θ = 23° and one weak peak at 43° were emerged corresponding to d002 reflection of graphitic (sp2 hybridized) carbon and d001 corresponding to sp3 hybridized lattice reflection, respectively. The broad pattern clearly depicts the amorphous nature of activated carbon (Hashemian et al., 2014; Cazetta et al., 2018). There is a close relationship between the degree of graphitization and the interplanar spacing d002 of carbon materials, i.e. the larger the diffraction angle, the smaller will be the degree of graphitization (Xie et al., 2014). In this work, similar degree of graphitization in the N-enriched samples was found if compared to the non-enriched AC.
3.2 Thermal analysis
Thermogravimetrical analysis, TGA, was carried out under nitrogen gas to understand pyrolytic structural degradation. The dried raw samples are directed to analyze in the temperature range 25–1000 °C (Fig. S3) by simulating the conditions of sample preparation (under N2 atmosphere with a hold time of 1 h at 600 °C). A steady moderate weight loss was observed up to 250 °C. In this range the initial moisture loss is what causes the change up to 105 °C. There is no significant decrease seen over this area as the raw sample is dried at 90 °C before AC fabrication. The weight loss starting at around 160 °C can be explained as the volatilization of hemicellulose material in the sample and moisture loss from the surface. The evaporation of these smaller volatile molecules is due to the decomposition by thermal treatment (Basheer et al., 2019). The TG behavior From 250 to 380 °C is typical to most biomass materials and is associated with the decomposition of cellulose, hemicellulose, and lignin leading to the formation of carbonaceous residue at around 380 °C which decomposes in the last step with the formation of the final organic residue (Basri et al., 2013; de Andrade et al., 2015). In the carbonization process, tar is the predominant product of devolatilization in temperature above 380 °C. At higher temperatures (above 600 °C) the sample is found to be rather stable and thus the carbon at this stage can be considered a final form of AC.
The TGA curves of all N doped Ps-ACs were investigated over the temperature range of 25–800 °C, as illustrated in Fig. S3b. All enriched samples, except for Ps-DDAB, followed the same trend. Since N-doped AC samples have already undergone two stages of pyrolysis (activation and functionalization steps) at 600 °C, where the cellulose and lignin basic components have already been degraded, most of the studied samples did not show a significant change in weight until around 540 °C. By careful analysis of Fig. S3b, one can see that the whole weight loss process exhibit a three-stage degradation. The weight changes associated with temperature range 20–110 °C corresponds to a loss of adsorbed water, and that associated with temperature range 110–540 °C to surface groups formation, such as carboxylic acids and their derivatives with the evolution of CO2 as a product of decomposition, as well as decomposition of other surface groups like lactones and phenols (de Andrade et al., 2015). This was supported by the findings reported by El-Hendawy, where they found raising the temperature to 500 °C led to the effective destruction of some C⚌O, C—O, and aliphatic CH species (El-Hendawy, 2006). The third weight loss (>540 °C) is associated with further decomposition of functionalized carbon phase. Note that the pyrolsis carried out under N2 atmosphere, hence, oxidation of the carbon is minimum. Though all the N-doped ACs have similar decomposition profiles in the TG curves, the second and third weight loss steps occur with different percentages for each sample which confirms the variation of the amount of surface functional groups in AC treated with different functionalizing agents.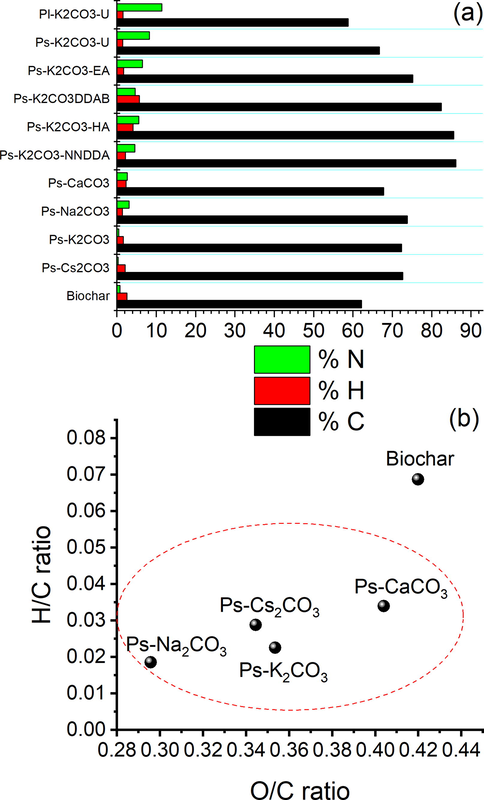
a) Elemental composition of biochar and ACs b) Van Krevelen diagram of biochar, and ACs (with different metal carbonate activators).
3.3 Elemental composition
The elemental compositions of all the Ps-ACs and Pl-ACs prepared were determined mainly to check the elemental N content (Fig. 3a). Carbon is the prominent content in all the samples with a low percentage of H with a maximum of 3.53 % (for NNDDA functionalized sample). It is noted that there is a significant increase in the percentage of N after the enrichment compared to the typical very low N content in the precursors (which is equal to or less than 1 %, see Table 2). Out of the enriched samples, the urea-treated samples showed an outstanding increase in the N content with a maximum value of 11.4 % and 8.2 % for leaf and stem originated ACs, respectively, which is the highest value ever obtained for palm-originated ACs. N content for the rest of the functionally modified samples falls in the range of 4.5–6.4 % which is of great significance as far as plant originated AC is concerned. Similar results were obtained in the case of Pl-ACs after respective chemical treatments.
Sample
Elemental Analysis (wt %)
C
H
N
Oa
Ps(Bio char)
62.12
2.53
0.75
34.60
Ps-Cs2CO3-AC
72.61
2.09
0.28
25.02
Ps-K2CO3-AC
72.34
1.63
0.46
25.57
Ps-Na2CO3-AC
73.78
1.37
3.03
21.82
Ps-CaCO3-AC
67.73
2.30
2.61
27.36
Ps- K2CO3-NNDDA
86.11
2.11
4.54
7.24
Ps- K2CO3-HA
85.58
4.10
5.52
4.80
Ps- K2CO3-DDAB
82.40
5.66
4.59
7.35
Ps- K2CO3-EA
75.19
1.70
6.43
16.68
Ps- K2CO3-U
66.72
1.46
8.21
23.61
Pl- K2CO3-U
58.72
1.54
11.43
28.31
The proportion of the carbon content was found to increase after the activation process. Changes in the elemental composition of biochar due to the activation step at 600 °C were investigated in terms of atomic H/C and O/C ratios by Van Krevelen diagram (Fig. 3b). All the ACs showed low H/C and O/C ratios if compared with the inactivated biochar demonstrating significant structural changes and dehydration occurring due to the activation process. The lower atomic H/C and O/C in ACs implies that the degree of aromatization is more compared to the pyrolysis of the precursor. The ACs produced by mixing Na-, Cs-, K-, and Ca-metal carbonates as activators showed decreased H/C and O/C which could be due to enhanced deoxygenation and dehydrogenation during the activation processes (Hwang et al., 2017; Thithai et al., 2021). This decrease in the atomic H/C and O/C ratio is most prominent in Na-metal carbonate activated samples. The ACs after N-doping showed H/C and O/C ratios which were not much different from those before doping.
3.4 Identification of functionalities
3.4.1 X-ray photoelectron spectroscopy
To clarify the surface chemical states of elemental content, XPS spectra of the ACs were examined. The characteristics of the AC surface after the introduction of N into the carbon structure are illustrated by C1s, N1s, and O1s deconvoluted XPS peaks of urea-treated AC which is the sample with the highest N content (Fig. 4). C1s spectrum can be assigned to C—C/C⚌C, C⚌N/C—O, C—N/C⚌O, and O⚌C–O at 284.6, 286.0, 287.2, and 288.7 eV, respectively. The main C1s peak was at 284.6 eV which corresponds to graphite like sp2 and sp3 hybridized carbon atoms. Also, peaks at N1s 398.3 and 400.3 eV can be attributed to N⚌C and N—C bonds, respectively (Marton et al., 1994; Rossi et al., 1994). Hence, the two observed nitrogen functional groups are sp2 pyridinic (lower amount) and sp3 pyrrolic/pyridonic (higher amount) (Pietrzak, 2009; Ilnicka & Lukaszewicz, 2015; Rehman et al., 2019). A peak at 401.5 eV, which is corresponding to graphitic N, is absent in the prepared N-doped samples. In other words, out of the typical N-bonding configurations (pyridinic N, pyrrolic N/pyridine N, graphitic N, quaternary N, and oxidative N) which may be formed in the carbon networks, only the former two groups were able to be identified by XPS in our N-modified Pl/Ps-ACs. It can be presumed that the N-modification by urea, mainly incorporates pyridinic and pyrrolic N into the carbon skeleton and these two groups can act as the adsorption sites for heavy metals (Wang et al., 2019) and CO2 (Lee et al., 2016). The O1s core level spectrum has a slightly wide peak at 532.9 eV which is assigned to phenolic groups (C-OH) and/or ether groups (C—O—C) (Xu, et al., 2018).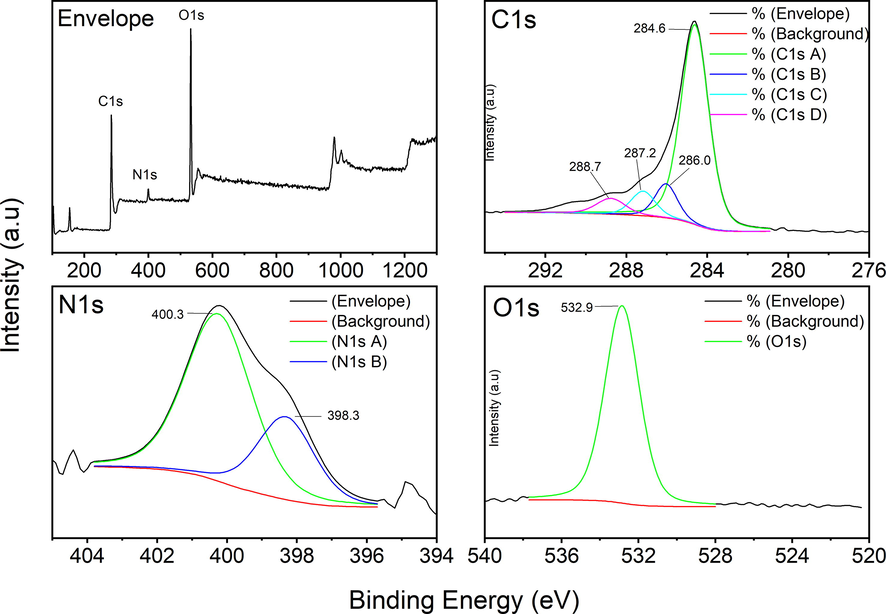
XPS envelope and deconvoluted spectra of N-enriched sample (activated with K2CO3).
3.4.2 FTIR and Raman
The FTIR spectrum of raw samples and basic AC are given in Fig. 5a and that of nitrogen modified ACs is given in Fig. 5b. The raw samples have the most crowded spectrum. A typical strong and broad absorption band between 3600 and 3400 cm−1 can be seen in the spectra shown, which is the characteristic of antisymmetric stretching vibration of free and intermolecular hydroxyl groups (O—H) in the cellulose, hemicellulose and lignin, and that of adsorbed water in the material. The broadening of this band is due to the high degree of hydrogen bonding (Ibrahim et al., 2006; Shoaib & Al-Swaidan 2016; Basheer et al., 2019). The spectrum of the raw sample is very much comparable to the one reported by Shoaib & Al-Swaidan (2016) for raw date palm fronds. We can assign the peaks at 3368 cm−1 to the stretching mode of –OH in the raw sample, 2919 cm−1 to aliphatic (–CH2) symmetrical stretching, 1735 cm−1 to C⚌O stretching (Cuhadaroglu & Uygun, 2008) and 1626 cm−1 to C⚌C and aromatic ring stretching (Sevilla et al., 2017) and scissoring bend of –OH (Xiao et al., 2011). The peak at 1426 cm−1 and 1373 cm−1 corresponds to –CH bend and rock (Shoaib & Al-Swaidan, 2016), respectively, present in alkanes. Peaks at 1330, 1245 and 1052 cm−1 are characteristic of –C—O (Shoaib & Al-Swaidan, 2016) and C—C stretching. The peak for the hydroxyl group at 3600–3400 cm−1 in the inactivated sample has disappeared or significantly diminished in the spectra of all ACs. The main three peaks in these spectra are in the range 1570 cm−1, 1400 cm−1 (very small), and 1100 cm−1 for all the basic ACs which can be attributed to C⚌C aromatic ring stretching, phenolic vibrational elongation, and C—O stretching, respectively (de Andrade et al., 2015; Shoaib & Al-Swaidan, 2016). It is evident from the FTIR results that there is no fundamental variation in the surface functional groups related to the difference in the activators used. FTIR spectra of N-enriched ACs produced are shown in Fig. 5b. There are two main peaks found in all the functionalized samples. One in the range of 1100–1200 cm−1 which can be ascribed to C—N (aliphatic) or C—O (carboxyl, hydroxy, ether, and ester) stretching vibration, and the other 1550–1570 cm−1 which could be due to stretching vibration of C⚌O, C⚌C and also to N—H (secondary amine) bend. The DDAB sample has a peak at 3413 cm−1, which could be assigned to N—H symmetric stretching vibration or O—H stretching vibration (Wang et al., 2014; Tseng et al., 2015).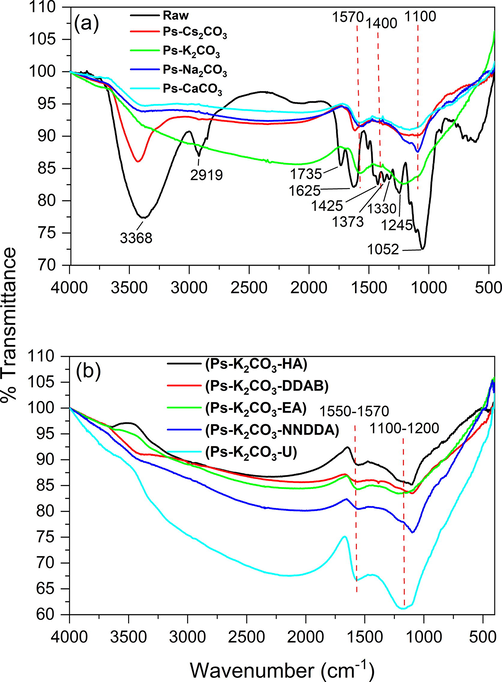
FTIR spectra of the ACs (a) Before N modifications (b) After N modifications.
Fig. 4S presents Raman spectra for K2CO3 and Cs2CO3 ACs before and after nitrogen treatment. The well-known D and G bands of graphite are in 1330 and 1577 cm−1 regions respectively. The G peak corresponds to the only allowed Raman transition in this region of the spectrum of graphite (Escribano et al., 2001). The line entered at 1577 cm−1 (G line) corresponds to the Raman allowed E2g mode in the ideal graphite and the line centered at 1330 cm−1 is the disorder-induced line which is due to the disordered portion in the carbon (Zhao et al., 2009). The ID/IG ratios for all studied samples are relatively high indicating a large extent of defects. Also, the samples treated with N-agent and processed with two-step thermal treatment (see the urea-doped ACs samples in Fig. S4) exhibit a clear higher structure defect (higher ID/IG ratio) due to introducing nitrogen into the ACs and/or the second thermal treatment (K. Li et al., 2019; Wang et al., 2019).
3.5 Quantitative assessment of acid surface functional groups
Calculation of surface chemistry is based on the consumed volumes of the remaining base in solution after completing the neutralization reaction, thus quantifying the amount of each functional group present (in mmol per gram of the carbon) using corresponding mathematical equations (Oickle et al., 2010; Schönherr et al., 2018). The number of moles of carboxyl groups was calculated directly from the titration of NaHCO3 base solution. Lactone groups were estimated by titrating Na2CO3 base solution for acidic functionalities and then subtracting the number of moles of carboxylic groups present from it. Phenolic groups were determined by titrating NaOH base solution and subtracting the collective amount of carboxylic and lactone groups from the total number of moles of acid groups reacted. Finally, to quantify carbonyl groups, the difference between total moles of acidic groups obtained by titration of Na2CO3 and the sum of all the former functionalities was calculated.
This potentiometric estimation allowed us to estimate significant quantities of acid functionalities on Ps-Cs2CO3-U and Ps-K2CO3-U ACs. The highest amount was estimated for Ps-Cs2CO3-U sample for all the four functional groups, i.e., carboxyl, lactone, phenol and carbonyl being 0.674, 0.421, 0.482, and 0.621 mmol/g respectively and Ps-K2CO3-U-ACs were estimated as 0.640, 0.326, 0.402, and 0.421 mmol/g, respectively. Potentiometric and first derivative curves of the titration are shown in Fig. S5. The more acidic groups present indicate more oxygenated functional groups, giving rise to higher adsorption of heavy metals (Hilal et al., 2013). This confirms that the prepared N-enriched activated carbons are suitable for application in the heavy metal removal from aqueous solutions.
3.6 CO2 adsorption
In a general perception, CO2 adsorption capacity depends primarily on the textural features of CO2 adsorbent employed which in turn depends on the nature of activating agent used, activating conditions and any further modifications to the adsorbent. The successful acquirement of AC (SBET = 2704 m2/g for AC) with excellent textural features and surface nitrogen functionalities with a high amount of mesopores using Cs2CO3 as activating agent encouraged us to investigate its CO2 uptake capability. Hence the AC prepared offers merits of high surface area and better CO2 diffusion pathway which can be attributed to the presence of enough amount of micro- and mesopores which make our AC specifically suitable for the study. The Ps-AC produced has displayed a very high uptake of CO2 at both low and high temperature conditions when compared to similar work in literature (Guo et al., 2020; J. Li et al., 2019; Ogungbenro et al., 2018). All CO2 isotherms showed almost no hysteresis, implying that the adsorption is completely reversible physical adsorption. The CO2 adsorption isotherm for unmodified and modified AC produced from palm biomass at two different temperatures is demonstrated in Fig. 6. The CO2 uptake capacity is found to be higher at 0 °C compared to that at room temperature in agreement with previous literature indicating an exothermic adsorption mechanism. The decrease in CO2 uptake with an increase in temperature can be attributed to the presence of van der Waals adsorbent–adsorbate interaction which will be broken at elevated temperatures due to the high kinetic energy of gas molecules.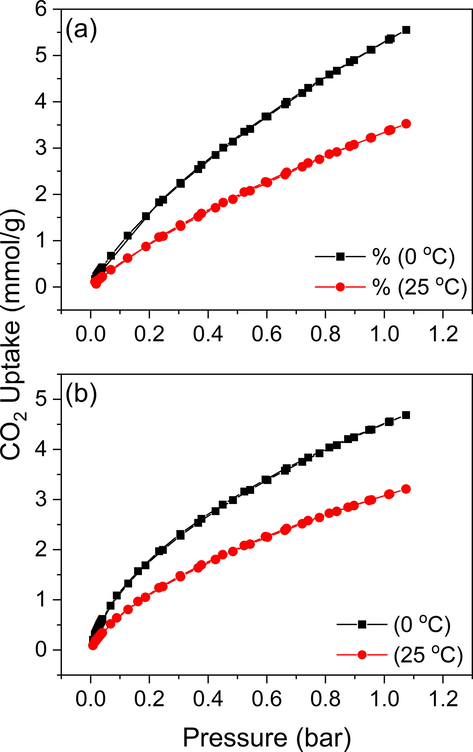
CO2 adsorption isotherms at 0 °C and 25 °C for Cs2CO3 AC before (a) and after (b) N enrichment.
Because of the affinity of basic N functional groups towards the acidic CO2 molecules, one would expect that replacing some of the carbon atoms in the carbon framework of AC by N atom would increase its CO2 capture ability. Though, the AC under our study shows a decrease in the CO2 capture capacity after N doping (Fig. 6b), at 1 bar, an uptake of 4.7 and 3.2 mmol/g were recorded at 0 °C and 25 °C, respectively. This was opposite to what we expected based on the majority of works reported in this area. This may be attributed to the change occurring in the distribution and structure of pores during the enrichment process. Also, besides the general perspective, there are a few works that reported a diminished CO2 uptake after heteroatom doping. The excessive loading of N-doping agent and the second thermal treatment caused blockage of pores in the resulting N rich ACs (this is reflected in lower SBET and porosity, see Table 1) which harms CO2 adsorption by lowering the CO2 accessibility. Besides the lower porosity, the presence of more functional groups obstruct some of the active sites (Soliman et al., 2016; Azmi & Aziz 2019; Yang et al., 2019). One can infer that the CO2 capture ability does not depend completely on a single factor like N content but coaction of multiple factors. Hence, it is important to optimize these different parameters for efficient CO2 adsorption, especially the competition between extensive N doping and the decrease in surface area. So, the findings confirm that the CO2 adsorption does not depend on the N content only but also on the porosity and SBET of the adsorbent.
3.7 Adsorption of Cr(VI) and Pb(II) metal ions
3.7.1 Effect of pH on removal
The pH value of the system is generally a key parameter during the adsorption process and has a significant effect on the removal of ions from an aqueous solution as it controls the surface charges on the adsorbent as well as the chemical nature of metallic cation. The pH of a solution can affect the surface of the adsorbent as well as the species of metal ions in the solution. Here, the removal of Cr(VI) at different pH (at 2, 4, 6, and 8) for Cs2CO3 and K2CO3 ACs was studied (Fig. 7a). A maximum adsorption was observed at pH = 2 for both ACs which was expected owing to previous literature (Ammar et al., 2021). The decrease in adsorption with an increase in pH can be inferred to be due to competition of HCrO4− and CrO42− ions with OH− ions on adsorption active sites (Chand et al., 2009; Zheng et al., 2011; Ren et al., 2019). The effect of the initial concentration of Cr(VI) ions was also studied and observed that the adsorption percentage increases with an increase in initial Cr(VI) ions concentration.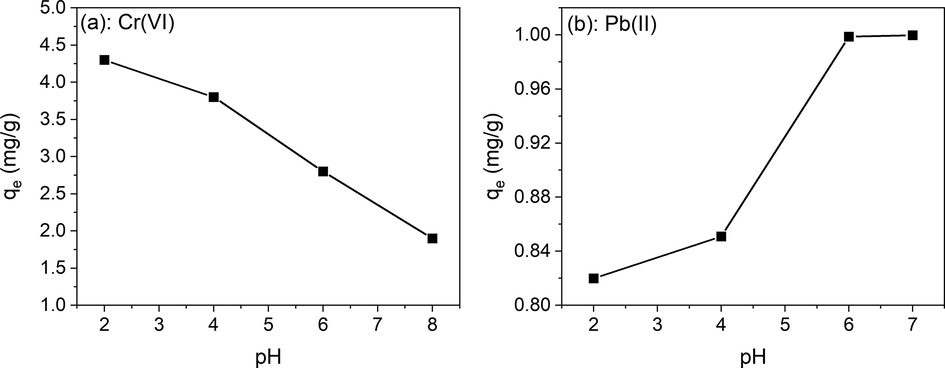
pH dependence of Cr(vi) and Pb (ii) for Ps.Cs2CO3.Urea AC (a and b respectively). Weight of adsorbent = 10 g/L, Cr(VI) and Pb(II) solutions concentration = 10 ppm, contact time = 60 min.
A pH range from 2 to 7 was also investigated for Pb(II) removal (Fig. 7b). Higher pH solutions were excluded from the study as the precipitation of Pb(OH)2 observed in the solution for pH > 7 which made the removal of Pb2+ not possible (Sekar et al., 2004; Momčilović et al., 2011; Soliman et al., 2016). It was observed that the maximum adsorption (Pb2+ removal percentage of 99.99 %) occurred at pH 7 when Pb(II) concentration is 10 ppm and AC amount is 10 g/L. Almost same percentage of removal was obtained at pH 6. Hence, pH 6 and 7 can be considered optimal for Pb(II) ions adsorption. Because of that, all further Pb(II) adsorption studies were carried out at a neutral pH of 7. In the highest sorption range, the dominant species of adsorption are Pb2+ and PbOH+. In an acidic solution, the AC’s surface being positively charged, the adsorption of these species is not favored. This explains the lower adsorption at a low pH range.
3.7.2 Adsorption isotherms
Mathematical isotherm models such as Langmuir, Freundlich, and Temkin were applied for describing the equilibrium established between the metal ions on the ACs and the ions remaining in the solution, linear forms of which can be expressed as Eqs. (3), (4), and (5) respectively (Sun et al., 2013).
where Ce (mg/L) is the equilibrium concentration of metal ion, qe (mg/g) is the amount adsorbed under equilibrium, qmax (mg/g) is the maximum adsorption amount for the corresponding heavy metal, KL (L/mg), KF (mg/g(L/mg)1/n), KT (L/g) the Langmuir, Freundlich and Temkin isotherm constants, respectively. The constant n in Freundlich model is known as the intensity parameter. The parameter B = RT/b where b is a Temkin’s model constant related to the heat of sorption in J/mol. The adsorption isotherms of Cr(VI) adsorption on urea-treated Ps-Cs2CO3 ACs are represented in Fig. 8(a,b,c). The calculated Langmuir, Freundlich and Temkin constants are summarized in Table 3. Adsorption of Cr(VI) was also investigated before doping with N. It was observed that the enrichment caused a decrease in Cr(VI) uptake. Also, the adsorption capacities were found to increase with the equilibrium concentrations of metal ions. Based on R2 value, the adsorption results for all the adsorbents were well-fitted with Freundlich isotherm which, unlike Langmuir isotherm and Temkin, indicates a multilayer adsorption mechanism for heterogeneous surface (Lin et al., 2019). The ln KF (the intercept) is a measure of adsorption capacity and the slope 1/n gives the adsorption intensity (Eq.4). The n value ranging from 2
10 implies good adsorption. n value ranging from 1
2 gives moderately good adsorption and less than 1 will be for poor adsorption (El Nemr et al., 2020).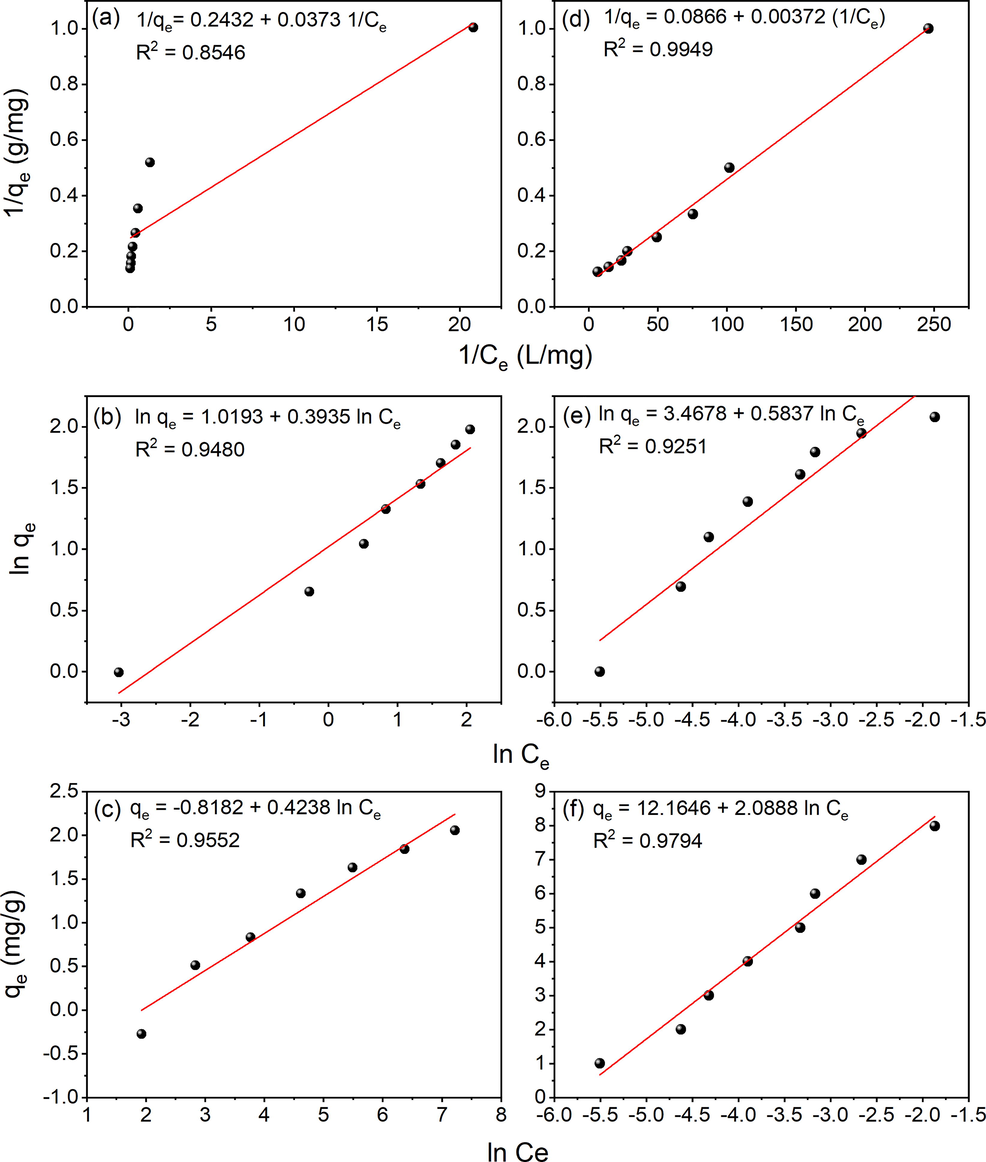
Langmuir, Freundlich, and Temkin isotherms for Cr(VI) adsorption in a, b and c respectively and that for Pb(II) adsorption in d, e and f respectively by Urea functionalized Ps-Cs2CO3 AC.
Heavy Metal
Isotherms models
Kinetic models
Langmuir
Freundlich
Temkin
Pseudo first order
Pseudo second order
qmax
KL
R2
RS
1/n
KF
R2
B
KT
R2
qe
k1
R2
qe
k2
R2
Cr(VI)
4.112
6.517
0.925
0.015
0.39
2.77
0.974
0.675
25.71
0.955
1.90
0.03
0.892
0.98
11.29
1
Pb(II)
0.004
23.280
0.997
0.444
0.58
32.07
0.962
2.089
338.23
0.990
3.41
0.06
0.685
0.99
476.38
1
The Ps-Cs2CO3 AC was found to have much more uptake ability compared to that of K2CO3 AC which can be attributed to the excellent surface area and structural properties of this AC compared to other ACs produced by different activators. The Pb(II) ions adsorption was found to increase greatly after enriching the AC with urea because of the presence of surface functional groups. The existence of different acidic groups, such as carboxyl, lactone, carbonyl and phenolic functional groups, also may contribute to the large adsorption capacity of these carbons. Thus, although chemical modification resulted in the reduction of SBET value, the added functional groups arising from the modification compensated for the decrease in sorption brought about by the reduction in the SBET. This encouraged us to investigate further the AC prepared using Cs2CO3 activation.
It is to be also noted here that adsorption capacities increased with the equilibrium concentrations of metal ions as observed in the case of Cr(VI) adsorption. The adsorption isotherms (Langmuir, Freundlich and Temkin) are given in Fig. 8 (d,e,f) and their parameters are listed in Table 3 in order to understand better the adsorption behavior based on varying concentrations of adsorbate ions solutions. Based on R2 value, the adsorption results for Pb(II) ions on all the adsorbents were best fitted with Langmuir isotherm (0.9974) than Freundlich and Temkin isotherm mechanisms indicating saturated monolayer formation of Pb(II) ions on the adsorbent. The value of KF, which is related to the adsorption capacity, was found to be 32.07 for Pb(II) adsorption which was much higher compared to Cr(VI) adsorption (2.77). The value of KL also was much higher for lead (23.28) compared to chromium (6.52). The sorption equilibrium constants listed in Table 3 can be used to predict whether the sorption of Pb(II) and Cr(VI) ions onto Ps-Cs2CO3-AC was favorable or unfavorable using the dimensionless separation parameter defined as,
As depicted, the separation factor values were always between 0 and 1 confirming the favorability of the metal ion sorption.
3.7.3 Adsorption kinetics
Adsorption kinetics of Cs2CO3 AC (N-doped) was monitored (Fig. 9) using pseudo-first order and pseudo-second order rate equations which can be represented by Eqs. (7) and (8) respectively (Sivaprakasam & Venugopal, 2019),
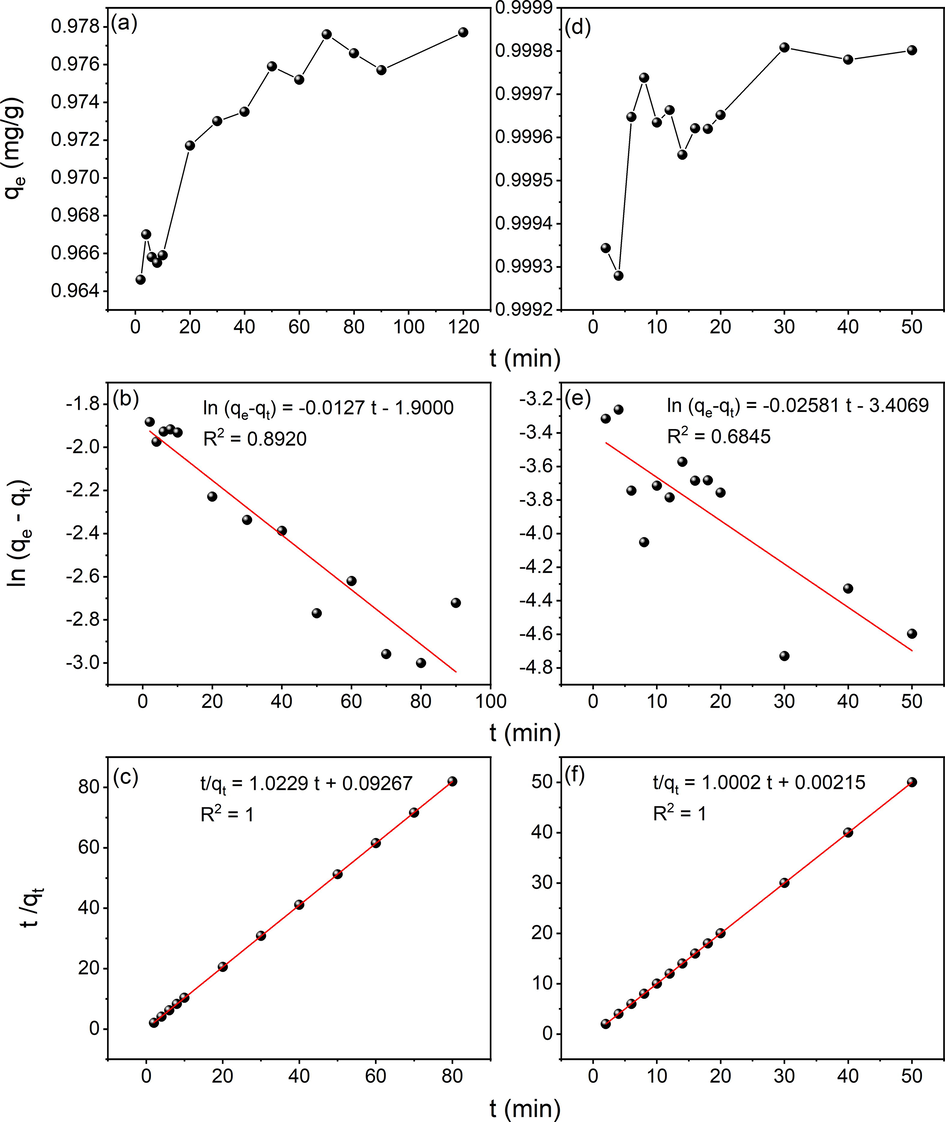
(a,d) Effect of contact time on adsorption (b,e) Pseudo-first-order model and (c,f) Pseudo-second-order model for Cr(VI) and Pb(II) respectively onto Ps-Cs2CO3 enriched using Urea.
The amount of the metal ion adsorbed at time t was given by qt (mg/g) and first-order rate constant was given by k1 (min−1). qe and k1 is calculated from the intercept and slope of the plot, respectively,
where k2 is the rate constant of second-order kinetics. The plot t/qt against t should be a straight line if pseudo-second-order kinetics was applicable whereas, the slope and intercept of the plot would give qe and k2, respectively. As obtained (Fig. 9a,b,c and Table 3), the Cr(VI) adsorption mechanism was found to be controlled by pseudo second-order kinetics with a large coefficient (R2 = 1). Moreover, the calculated qe values were also close to qe values obtained from the experimental data, suggesting high accuracy for pseudo-second order model (Karnjanakom & Maneechakr, 2019). The validity of the kinetic models was tested in the case of Pb(II) adsorption as well (Fig. 9d,e,f and Table 3) from which it is clear that pseudo-second order kinetics is also obeyed by the ACs under investigation as the application it leads to much better regression coefficient (R2 = 1) which is supported by the majority of literature (Aroua et al., 2008; Momčilović et al., 2011; Karnjanakom & Maneechakr, 2019). The values of the qe, estimated from the first order kinetic model significantly differ from experimental qe values. However, in pseudo-second order kinetic model, the qe values were very close to the experimental qe value. Similar to the finding in this study, the pseudo-second order model is extensively applied for studying physiochemical interaction in numerous environmental adsorption studies. The analysis of kinetic data by other researchers also showed that the pseudo-second order rate equation was a good fit for Pb2+ adsorption (Banat et al., 2003; Aldawsari et al., 2017). Such findings indicate that the adsorption kinetics depend on both the adsorbate and the adsorbent.
3.7.4 Thermodynamics of lead adsorption
Since the N-functionalized ACs were very efficient in removing Pb(II) ions, the thermodynamic parameters of its adsorption were studied. The standard Gibb’s energy,
Where, R is ideal gas constant (=8.314 J mol−1 K −1) and T is the temperature (K).
The apparent equilibrium constant (K) is given,
The unit of the thermodynamic equilibrium constant (K) (Eq.10) should be corrected to become dimensionless before using the Van 't Hoff equation. This is carried out using the calculation suggested by Lima et al. (2019). After such correction one can calculate the enthalpy and the entropy of the system using Eq. (11). Thus, the calculated ΔG (at 298, 308, 318, 328 and 338 K), ΔH and ΔS at adsorbate concentrations 10–80 ppm are displayed in Table 4.
Conc. (ppm)
ΔG298 (kJmol−1)
ΔG308 (kJmol−1)
ΔG318 (kJmol−1)
ΔG328 (kJmol−1)
ΔG338 (kJmol−1)
ΔH (kJmol−1)
ΔS (kJmol-1K−1)
10
−4.25
−4.46
−4.69
−4.97
−5.22
30.67
0.25
20
−4.40
−4.60
−4.82
−5.05
−5.35
26.27
0.23
30
−4.50
−4.71
−4.88
−5.11
−5.33
16.61
0.21
40
−4.56
−4.77
−4.96
−5.18
−5.46
19.78
0.22
50
−4.60
−4.79
−4.98
−5.20
−5.46
17.25
0.21
60
−4.63
−4.81
−5.01
−5.21
−5.40
11.12
0.19
70
−4.63
−4.84
−5.01
−5.25
−5.45
14.58
0.21
80
−4.60
−4.80
−5.02
−5.25
−5.44
17.54
0.21
The plot of lnKcorr as a function of 1/T provides a straight line at all 8 adsorbate concentrations investigated (Fig. S6). The ΔH and ΔS can be calculated from the slope and intercept, respectively. The thermodynamic parameters are also depicted in Table 4.
Since diffusion is an endothermic process, the increase in uptake of Pb(II) observed with temperature may be due to the desolvation of the adsorbing species, the changes in the size of pores, and/or the enhanced rate of intraparticle diffusion of adsorbate (Zarei et al., 2019). The increase in Kcorr with an increase in temperature indicates the endothermic nature of the process. As we know, physical adsorption is generally an exothermic reaction. Hence, the logical cause of the observation is that the adsorption should include endothermic chemical process. ΔG at all concentrations were negative at all the temperature ranges studied. Thus, it can be inferred that the adsorption of Pb(II) by the AC under investigation is feasible and spontaneous. Also noted a steady, but small, increase in the ΔG values with increasing temperature, i.e., a better adsorption was obtained at higher temperatures. From the standard free energy change values, a multilayer adsorption can be assumed as the ΔG for multilayer adsorption falls between − 20 kJ mol−1 and zero. In addition, the endothermic nature of Pb(II) adsorption with irreversible process was concluded from the positive values of ΔH and ΔS (Karnjanakom & Maneechakr, 2019; Sivaprakasam & Venugopal, 2019). The heat evolved during chemisorption and physisorption falls into the range of 80–200 kJ mol−1 and 2.1–20.9 kJ mol−1, respectively. The ΔH for 10 ppm and 20 ppm batches were found to be 30.67 and 26.27 kJ mol−1 respectively showing the occurrence of mainly physisorption at this concentration level. The ΔH for adsorption at higher adsorbate concentrations, however, were found to be within the range of physisorption (Zarei et al., 2019). In addition, the small positive ΔS values signify the increased randomness at the solid-solution interface upon adsorption of Pb(II) on Ps-Cs2CO3 ACs.
4 Conclusion
The date palm-originated activated carbons (Ps-ACs), that were activated with Cs2CO3, were found to have an extremely high BET surface area of 2704 m2/g and high content of bi-modal porosities. Such ACs exhibit a promising result for the adsorption of Cr(VI) and Pb(II) from an aqueous medium by reaching a removal percentage of 99.99 %. Both Cr(VI) and Pb(II) metal ion adsorption were highly pH dependent. Based on R2 value, the adsorption of Cr(VI) for all of the adsorbents was best fitted with Freundlich isotherm and that of Pb(II) with Langmuir isotherm. The introduction of functional groups by nitrogen doping provided only an enhancing effect in the Pb(II) adsorption. In general, the adsorption kinetics was quick (specially for Pb(II) ions) for the studied initial concentration range and kinetic modeling parameters showed the applicability of pseudo-second order model perfectly. The calculated thermodynamic parameters, namely ΔG, ΔH, and ΔS showed that adsorption on ACs produced is spontaneous and endothermic under-examined conditions. The bimodal porous AC with excellent surface properties also exhibited a remarkable CO2 adsorption ability of 3.52 mmol/g at 25 °C and 5.6 mmol/g at 0 °C.
This study is an attempt to benefit from an inexpensive and extremely abundant palm precursors as potential contaminants sorbents from aqueous systems and CO2 capture. Nevertheless, more advanced and tailored research in this area are still needed.
Acknowledgments
This study was supported by Kuwait Foundation for the Advancement of Sciences, KFAS, Kuwait (project no. PN1724SC03). The authors acknowledge also the support provided by the Research Administration of Kuwait University, Kuwait, under Grant Numbers GS01/01, GS01/03, GS01/05, GE01/07, GE03/08, GS03/01, GS02/01 and GS02/08.
Declaration of Competing Interest
The authors declare that they have no known competing financial interests or personal relationships that could have appeared to influence the work reported in this paper.
References
- Abdulkarim, M., Al-Rub, F.A., 2004. Adsorption of lead ions from aqueous solution onto activated carbon and chemically-modified activated carbon prepared from date pits. Adsorpt. Sci. Technol. 22, 119−134. https://doi.org/10.1260%2F026361704323150908.
- Alaya, M.N., Girgis, B.S., Mourad.W.E., 2000. Activated carbon from some agricultural wastes under action of one-step steam pyrolysis. J. Porous Mater. 7,509−517. https://doi.org/10.1023/A:1009630928646.
- Mercerized mesoporous date pit activated carbon−a novel adsorbent to sequester potentially toxic divalent heavy metals from water. PloS one. 2017;12:e0184493.
- [Google Scholar]
- Sulfur removal from model diesel fuel using granular activated carbon from dates’ stones activated by ZnCl2. Fuel. 2009;88:87-94.
- [CrossRef] [Google Scholar]
- Micro-mesoporous modified activated carbon from corn husks for removal of hexavalent chromium ions. Appl. Water Sci.. 2021;11:1-12.
- [CrossRef] [Google Scholar]
- Real-time determination of kinetics of adsorption of lead (II) onto palm shell-based activated carbon using ion selective electrode. Bioresour. Technol.. 2008;99:5786-5792.
- [CrossRef] [Google Scholar]
- Kinetic and equilibrium adsorption of methylene blue and remazol dyes onto steam-activated carbons developed from date pits. J. Saudi Chem. Soc.. 2010;14:47-53.
- [CrossRef] [Google Scholar]
- Mesoporous adsorbent for CO2 capture application under mild condition: a review. J. Environ. Chem. Eng.. 2019;7:103022
- [CrossRef] [Google Scholar]
- Banat, F., Al-Asheh, S., Makhadmeh, L., 2003. Preparation and examination of activated carbons from date pits impregnated with potassium hydroxide for the removal of methylene blue from aqueous solutions. Adsorpt. Sci. Technol. 21, 597−606. https://doi.org/10.1260%2F026361703771953613
- Synthesis and characterization of natural extracted precursor date palm fibre-based activated carbon for aluminum removal by RSM optimization. Processes. 2019;7:249.
- [CrossRef] [Google Scholar]
- Supercapacitors using binderless composite monolith electrodes from carbon nanotubes and pre-carbonized biomass residues. Biomass Bioenerg.. 2013;59:370-379.
- [CrossRef] [Google Scholar]
- Preparation of activated carbon from date pits: effect of the activation agent and liquid phase oxidation. J. Anal. Appl. Pyrolysis. 2009;86:168-172.
- [CrossRef] [Google Scholar]
- Bone char-derived metal-free N-and S-co-doped nanoporous carbon and its efficient electrocatalytic activity for hydrazine oxidation. Appl. Catal. B. 2018;225:30-39.
- [CrossRef] [Google Scholar]
- Evaluation of wheat straw and barley straw carbon for Cr (VI) adsorption. Sep. Purif. Technol.. 2009;65:331-336.
- [CrossRef] [Google Scholar]
- Cuhadaroglu, D., Uygun, O.A., 2008. Production and characterization of activated carbon from a bituminous coal by chemical activation. Afr. J. Biotechnol. 796CC7A7303. https://doi.org/10.5897/AJB08.588
- Danish, M., Hashim, R., Rafatullah, M., Sulaiman, O., Ahmad, A., 2011. Adsorption of Pb(II) ions from aqueous solutions by date bead carbon activated with ZnCl2. Clean - Soil Air Water 39, 392−399.
- Buriti palm stem as a potential renewable source for activated carbon production. Environ. Technol. Innov.. 2015;3:28-34.
- [CrossRef] [Google Scholar]
- Effects of activation agents and intrinsic minerals on pore development in activated carbons derived from a Canadian peat. Mater. Lett.. 2011;65:744-747.
- [CrossRef] [Google Scholar]
- Microporous nano-activated carbon type I derived from orange peel and its application for Cr(VI) removal from aquatic environment. Biomass Convers. Biorefin. 2020:1-19.
- [CrossRef] [Google Scholar]
- Variation in the FTIR spectra of a biomass under impregnation, carbonization and oxidation conditions. J. Anal. Appl. Pyrolysis. 2006;75(2):159-166.
- [CrossRef] [Google Scholar]
- Raman spectroscopy of carbon-containing particles. Vibrational Spectroscopy. 2001;26(2):179-186.
- [CrossRef] [Google Scholar]
- The increased CO2 adsorption performance of chitosan-derived activated carbons with nitrogen-doping. Chem. Commun.. 2016;52:186-189.
- [CrossRef] [Google Scholar]
- Chromium determination and speciation since 2000. TrAC - Trends Anal. Chem.. 2006;25(10):1006-1015.
- [CrossRef] [Google Scholar]
- Porous activated carbons derived from waste sugarcane bagasse for CO2 adsorption. Chem. Eng. J.. 2020;381:122736
- [CrossRef] [Google Scholar]
- Adsorption isotherm and kinetic modeling of 2, 4-D pesticide on activated carbon derived from date stones. J. Hazard. Mater.. 2009;163(1):121-126.
- [CrossRef] [Google Scholar]
- Preparation of activated carbon from agricultural wastes (almond shell and orange peel) for adsorption of 2-pic from aqueous solution. J. Ind. Eng. Chem.. 2014;20(4):1892-1900.
- [CrossRef] [Google Scholar]
- Adsorption of barium and iron ions from aqueous solutions by the activated carbon produced from masot ash. Life Sci. J.. 2013;10(4)
- [CrossRef] [Google Scholar]
- A simple method for developing mesoporosity in activated carbon. Sep. Purif. Technol.. 2003;31(1):47-52.
- [CrossRef] [Google Scholar]
- Manufacturing a super-active carbon using fast pyrolysis char from biomass and correlation study on structural features and phenol adsorption. RSC adv.. 2017;7:42192-42202.
- [CrossRef] [Google Scholar]
- Removal of cadmium from aqueous solutions by adsorption onto sugarcane bagasse. Am.-Eurasian J. Agric. Environ. Sci.. 2006;1(3):179-184.
- [Google Scholar]
- Synthesis of N-rich microporous carbon materials from chitosan by alkali activation using Na2CO3. Mater. Sci. Eng. B. 2015;201:66-71.
- [CrossRef] [Google Scholar]
- Sorption energies estimation using Dubinin-Radushkevich. Life Sci. J.. 2010;7(4)
- [CrossRef] [Google Scholar]
- Effects of H3PO4 and KOH in carbonization of lignocellulosic material. J. Anal. Appl. Pyrolysis. 2008;83:151-156.
- [CrossRef] [Google Scholar]
- The effect of activation method on the properties of pecan shell-activated carbons. J. Chem. Technol. Biotechnol.. 1999;74:1037-1044.
- [CrossRef] [Google Scholar]
- Adsorption behaviors and capacities of Cr(VI) onto environmentally activated carbon modified by cationic (HDTMA and DDAB) surfactants. J. Mol. Struct.. 2019;1186:80-90.
- [CrossRef] [Google Scholar]
- Production of micro-and mesoporous activated carbon from paper mill sludge: I. effect of zinc chloride activation. Carbon. 2000;38:1905-1915.
- [CrossRef] [Google Scholar]
- The adsorption of gases on plane surfaces of glass, mica and platinum. J. Am. Chem. Soc.. 1918;40(9):1361-1403.
- [CrossRef] [Google Scholar]
- Removal of copper, nickel and chromium mixtures from metal plating wastewater by adsorption with modified carbon foam. Chemosphere. 2017;166:203-211.
- [CrossRef] [Google Scholar]
- Effects of microporosity and surface chemistry on separation performances of N-containing pitch-based activated carbons for CO2/N2 binary mixture. Sci. Rep.. 2016;6:23224.
- [CrossRef] [Google Scholar]
- Mechanism of biomass activation and ammonia modification for nitrogen-doped porous carbon materials. Bioresour. Technol.. 2019;280:260-268.
- [CrossRef] [Google Scholar]
- Selective preparation of biomass-derived porous carbon with controllable pore sizes toward highly efficient CO2 capture. Chem. Eng. J.. 2019;360:250-259.
- [CrossRef] [Google Scholar]
- A critical review of the estimation of the thermodynamic parameters on adsorption equilibria. wrong use of equilibrium constant in the Van’t Hoof equation for calculation of thermodynamic parameters of adsorption. J. Mol. Liq.. 2019;273:425-434.
- [CrossRef] [Google Scholar]
- A novel strategy for Cr(VI) removal from aqueous solution via CYPH@ IL101/chitosan capsule. Int. J. Biol. Macromol.. 2019;136:35-47.
- [CrossRef] [Google Scholar]
- Study of the pore size distribution and fractal dimension of HNO3-treated activated carbons. Appl. Surf. Sci.. 2006;252:5972-5975.
- [CrossRef] [Google Scholar]
- Carbon nitride deposited using energetic species: a two-phase system. Phys. Rev. Lett.. 1994;73:118.
- [CrossRef] [Google Scholar]
- Hydrogen effects on X80 pipeline steel in high-pressure natural gas/hydrogen mixtures. Int. J. Hydrogen Energy. 2017;42(11):7404-7412.
- [CrossRef] [Google Scholar]
- Merzougui, Z., Addoun, F., 2008. Effect of oxidant treatment of date pit activated carbons application to the treatment of waters. Desalination 222(1-3), 394-403. http://dx.doi.org/10.1016%2Fj.desal.2007.01.134
- Removal of lead(II) ions from aqueous solutions by adsorption onto pine cone activated carbon. Desalination. 2011;276(1–3):53-59.
- [CrossRef] [Google Scholar]
- Adsorptive nanocomposite membranes for heavy metal remediation: recent progresses and challenges. Chemosphere. 2019;232:96-112.
- [CrossRef] [Google Scholar]
- Freundlich adsorption isotherms of agricultural by-product-based powdered activated carbons in a geosmin–water system. Bioresour. Technol.. 2002;85(2):131-135.
- [CrossRef] [Google Scholar]
- Physical synthesis and characterization of activated carbon from date seeds for CO2 capture. J. Environ. Chem. Eng.. 2018;6(4):4245-4252.
- [CrossRef] [Google Scholar]
- Standardization of the Boehm titration: part II. method of agitation, effect of filtering and dilute titrant. Carbon. 2010;48(12):3313-3322.
- [CrossRef] [Google Scholar]
- XPS study and physico-chemical properties of nitrogen-enriched microporous activated carbon from high volatile bituminous coal. Fuel. 2009;88(10):1871-1877.
- [CrossRef] [Google Scholar]
- Current progress on the surface chemical modification of carbonaceous materials. Coatings. 2019;9(2):103.
- [CrossRef] [Google Scholar]
- Preparation and characterization of porous chitosan microspheres and adsorption performance for hexavalent chromium. Int. J. Biol. Macromol.. 2019;135:898-906.
- [CrossRef] [Google Scholar]
- Physical properties of a-C: N films produced by ion beam assisted deposition. J. Mater. Res.. 1994;9:2440-2449.
- [CrossRef] [Google Scholar]
- Schönherr, J., Buchheim, J.R., Scholz, P., Adelhelm, P., 2018. Boehm titration revisited (part i): Practical aspects for achieving a high precision in quantifying oxygen-containing surface groups on carbon materials. C 4(2), 21. https://doi.org/10.3390/c4020021
- Adsorption by powders and porous solids; principles, methodology and applications. San Diego: Academic Press; 2013.
- Kinetics and equilibrium adsorption study of lead(II) onto activated carbon prepared from coconut shell. J. Colloid Interface Sci.. 2004;279(2):307-313.
- [CrossRef] [Google Scholar]
- Beyond KOH activation for the synthesys of superactivated carbon from hydrochar. Carbon. 2017;114:50-58.
- [CrossRef] [Google Scholar]
- A review on surface modification of activated carbon for carbon dioxide adsorption. J. Anal. Appl. Pyrolysis. 2010;89(2):143-151.
- [CrossRef] [Google Scholar]
- Optimization of activation temperature on the preparation of sliced porous activated carbon from date fronds by physical activation. Hem. Ind.. 2016;70(2):151-157.
- [CrossRef] [Google Scholar]
- Modelling the removal of lead from synthetic contaminated water by activated carbon from biomass of Diplocyclos Palmatus by RSM. Glob. Nest J.. 2019;21(3):319-327.
- [CrossRef] [Google Scholar]
- Removal of Pb(II) ions from aqueous solutions by sulphuric acid-treated palm tree leaves. J. Taiwan Inst. Chem. Eng.. 2016;58:264-273.
- [CrossRef] [Google Scholar]
- Adsorption of hexavalent chromium on Arundo donax Linn activated carbon amine-crosslinked copolymer. Chem. Eng. J.. 2013;217:240-247.
- [CrossRef] [Google Scholar]
- Adsorption of methylene blue onto biomass-based activated carbon by FeCl3 activation: Equilibrium, kinetics, and thermodynamic studies. J. Anal. Appl. Pyrolysis. 2012;97:116-122.
- [CrossRef] [Google Scholar]
- Physicochemical properties of activated carbons produced from coffee waste and empty fruit bunch by chemical activation method. Energies. 2021;14(11):3002.
- [CrossRef] [Google Scholar]
- Comparative analysis of physiochemical properties of physically activated carbon from palm bio-waste. J. Mater. Res. Technol.. 2019;8(5):3688-3695.
- [CrossRef] [Google Scholar]
- Adsorption of CO2 at atmospheric pressure on activated carbons prepared from melamine-modified phenol–formaldehyde resins. Sep. Purif. Technol.. 2015;140:53-60.
- [CrossRef] [Google Scholar]
- Edge-nitrogenated biochar for efficient peroxydisulfate activation: an electron transfer mechanism. Water Res.. 2019;160:405-414.
- [CrossRef] [Google Scholar]
- Polybenzoxazine-based monodisperse carbon spheres with low-thermal shrinkage and their CO2 adsorption properties. J. Mater. Chem. A. 2014;2(12):4406-4412.
- [CrossRef] [Google Scholar]
- Impact of hot compressed water pretreatment on the structural changes of woody biomass for bioethanol production. BioResour.. 2011;6(2):1576-1598.
- [Google Scholar]
- Production of biologically activated carbon from orange peel and landfill leachate subsequent treatment technology. J. Chem.. 2014;2014:491912
- [CrossRef] [Google Scholar]
- Hierarchical porous carbon microtubes derived from willow catkins for supercapacitor applications. J. Mater. Chem. A. 2016;4:1637-1646.
- [CrossRef] [Google Scholar]
- N-enriched multilayered porous carbon derived from natural casings for high-performance supercapacitors. Appl. Surf. Sci.. 2018;444:661-671.
- [CrossRef] [Google Scholar]
- One step N-doping and activation of biomass carbon at low temperature through NaNH2: an effective approach to CO2 adsorbents. J. CO2 Util.. 2019;33:320-329.
- [CrossRef] [Google Scholar]
- Novel and green nanocomposite-based adsorbents from functionalised mesoporous KCC-1 and chitosan-oleic acid for adsorption of Pb (II) Eur. Polym. J.. 2019;119:400-409.
- [CrossRef] [Google Scholar]
- Structural evolution in the graphitization process of activated carbon by high-pressure sintering. Carbon. 2009;47(3):744-751.
- [CrossRef] [Google Scholar]
- Chitosan-g-poly (acrylic acid) hydrogel with crosslinked polymeric networks for Ni2+ recovery. Anal. Chim. Acta. 2011;687(2):193-200.
- [CrossRef] [Google Scholar]
Appendix A
Supplementary material
Supplementary data to this article can be found online at https://doi.org/10.1016/j.arabjc.2022.104403.
Appendix A
Supplementary material
The following are the Supplementary data to this article:Supplementary data 1
Supplementary data 1


