

Translate this page into:
UPLC-ESI-QTOF-MS phenolic compounds identification and quantification from ethanolic extract of Myrtus communis ‘Variegatha’: In vitro antioxidant and antidiabetic potentials
⁎Corresponding author. oguntibejuo@cput.ac.za (Oluwafemi O. Oguntibeju)
-
Received: ,
Accepted: ,
This article was originally published by Elsevier and was migrated to Scientific Scholar after the change of Publisher.
Peer review under responsibility of King Saud University.
Abstract
Global public health is seriously threatened by diabetes and its complications. Although several synthetic drugs are currently employed for managing diabetes, however, the adverse effects associated with their use cannot be underestimated. Thus, the quest for a safe and cost-effective alternative is highly imperative. In the present study, the phenolic contents, antioxidant, antidiabetic, and cytotoxic potentials of 70% ethanolic crude extract of Myrtus communis ‘Variegatha’ were investigated using in vitro biochemical protocols. The total polyphenols content was 116.44 mg GAE/g, flavonols (6.74 mg QE/g), flavanols (2.46 mg CE/g) and the ferric reducing antioxidant power (FRAP) value was 1267.28 µmol AAE/g, 2,2-diphenyl-1-picrylhydrazyl (DPPH) (1165.37 µmol TE/g), and Trolox equivalent antioxidant capacity (TEAC) (775.52 µmol TE/g). High-resolution ultra-performance liquid chromatography coupled with electrospray ionisation/quadrupole-time-of-flight-mass spectrometry (UPLC-ESI-QTOF-MS) was explored to identify the phenolic compounds, most of which were flavonoids. The extract demonstrated a strong α-glucosidase inhibition potential in a concentration-dependent manner with IC50 (3.159 µg/mL), which was higher than epigallocatechin gallate (EGCG) (6.208 µg/mL), a positive control antidiabetic drug. A slight increase in glucose utilization was observed after 24 h of treatment in C3A hepatocytes at 25 μg/mL whereas an increase in glucose uptake was recorded at 25 and 50 μg/mL. The extract exhibited a cytotoxic effect (IC50 76.85 µg/mL) against C3A hepatocytes at 100 µg/mL, which correlates to the glucose utilization and uptake recorded. The findings from the study show the prospect of M. communis ‘Variegatha’ as a promising source of bioactive compounds that could be used in the development of new anti-diabetic agents, thus, further research into the plant is recommended.
Keywords
Myrtus communis ‘Variegatha’
Phytochemical compounds
Antidiabetic activity
flavonoids
antioxidant
cytotoxicity

1 Introduction
Diabetes mellitus is a chronic metabolic condition defined clinically by elevated blood glucose levels. It is one of the world's most serious public health concerns in the 21st century, affecting approximately 347 million people globally (Moodley et al., 2015; Sulaimon et al., 2020). It has been predicted that its prevalence may double by 2030 if measures were not taken (Eleazu et al., 2013). The destruction of β-cells in type 1 diabetes results in insulin insufficiency. Type 2 diabetes, on the other hand, is the most prevalent (Unnikrishnan et al., 2016); it is prompted by a gradual insulin secretory defect in the context of insulin resistance; other types include gestational diabetes, monogenic diabetes syndromes, exocrine pancreas diseases, and drug or chemical-induced diabetes (Sulaimon et al., 2020). The release of insulin hormone from the pancreas is triggered by a rise in blood glucose levels shortly after a meal (Komatsu et al., 2013). Remarkably, insulin stimulates the liver to metabolize glucose, as well as fat and muscle cells to eliminate glucose from the bloodstream, thereby normalising blood sugar levels. The blood sugar level in a diabetic patient remains high because the pancreas produces insufficient insulin (Dean and McEntyre, 2004).
Modern medical developments have led to the manufacturing of several pharmaceuticals, including insulin, which is the most common antidiabetic drug. Despite the hypoglycaemic potential of these drugs, several adverse effects are usually associated to their use (Jacob and Narendhirakannan, 2019). Due to the severity of diabetes and its complications, any choice of therapeutic invention to address this metabolic disorder must be devoid of adverse effects. As a result, natural sources of anti-diabetic agents have continued to gain significant attention over the years due to their safety and cost-effectiveness compared to the existing synthetic drugs (Sulaimon et al., 2020). Diabetes has been managed with many plants and plant-derived compounds, thus, making medicinal plants a possible source of hypoglycaemic remedies (Choudhury et al., 2018). Plants have abundant phytochemical compounds such as flavonoids, alkaloids, phenolics, and tannins that possessed anti-diabetic activity by boosting the secretion of insulin or reducing glucose absorption from the intestine to increase the effectiveness of pancreatic tissues (Kooti et al., 2016).
Myrtus communis is a Mediterranean shrub of the Myrtaceae family that grows in South Europe, West Asia, and North Africa. It may grow up to 2 m tall and prefers acidic soil that is protected from winds. Among these Myrtle species, M. communis L is the most common one. Many insects, notably honeybees, rely on the flowers as a major supply of pollen (Petretto et al., 2015). Moreover, it produces berry fruits rich in polyphenolic compounds (Hayder et al., 2008). M. communis L has been utilized as an antibacterial (Mir et al., 2020), antioxidant (Serreli et al., 2017), antidegenerative (Cevikelli-Yakut et al., 2020), anti-proliferative (Yangui et al., 2021), antidiabetic (Tas et al., 2018), and anti-inflammatory activity (Touaibia 2020). The antioxidant activity of the essential oil of M. communis L has been investigated in the literature (Petretto et al., 2016). M. communis L has also been reported to reduce oxidative stress in vitro and ex vivo (Tas et al., 2018). For example, Wu et al. (2020) reported on the antibacterial activity of phloroglucinol derivatives from M. communis L. However, the plant, Myrtus communis 'Variegata' often referred to as Variegated Myrtle, is an evergreen shrub with coloured leaves that is mostly planted in the Mediterranean region. This plant has a long and storied history of usage as a traditional antiseptic and disinfectant (Scora, 1973). Terpenoids, flavonoids, and derivatives of phloroglucinol are the primary components of Myrtus plants, according to phytochemical studies documented in the literature (Alipour et al., 2014; Ghnaya et al., 2013;).
Considering the research on M. communis L, to the state of the art, the only study on M. communis 'Variegatha' was on the antibacterial activity of its phloroglucinol derivatives; as a result, there has never been any reference of its antidiabetic potential has been documented. Therefore, the present study aimed at investigating the phytochemical compounds, antioxidant activity as well as in vitro antidiabetic and cytotoxic potentials of 70% ethanolic leaf extract of M. communis 'Variegatha' obtained from a botanical garden in Cape Town, South Africa.
2 Materials and methods
2.1 Plant collection and identification
The fresh leaves of the plant were collected on the 6 September 2021 at the Botanical Garden at Cape Peninsula University of Technology, Bellville campus, Cape Town, South Africa. The plant was authenticated by Mr. Gordon Dreyer (a botanist at the Department of Horticultural Sciences) and a specimen with a voucher number 3342 was deposited in the herbarium.
2.2 Plant extraction
The leaves were washed thoroughly with tap water followed by distilled water to remove all impurities, air-dried for 10 days at room temperature under shade and pulverized with a grinding machine. One hundred grams (100 g) of leaves powder were dissolved in 1500 mL of 70% ethanol contained in a 2000 mL flask and kept on a magnetic stirrer for 48 h (Zhao et al., 2022). Thereafter, the mixture was filtered using Whatman no. 1 filter paper and the supernatant was transferred to a rotary evaporator, where the solvent was evaporated at 48 °C under reduced pressure to collect the crude extract, and thereafter, the remaining crude extract was freeze-dried (Fig. S1), and the dried powder was kept at 4 °C until further use.
2.3 Determination of total polyphenols
To determine the total polyphenol content of the extract, the Folin-Ciocalteu technique investigated by Okafor et al. (2021) was used. The extract (1.0 mg/mL) was treated with 5 mL of 10% Folin-Ciocalteu reagent and 4 mL of 7.5 % w/v sodium carbonate. The mixture was vortexed for 15 s before being kept at 40 °C for 30 min to develop a characteristic blue color. Using a spectrophotometer, the extract's absorbance at 765 nm was determined (ANALYTIK JENA 200–2004 spectrophotometer, Germany). The total phenolic content of the extract was calculated using a curve made with gallic acid concentrations ranging from 0 to 250 mg/L; the result is represented as mg of sample gallic acid equivalent (GAE)/g.
2.4 Determination of total flavanols and flavonols
The total flavonol content was determined using the method outlined by Yermakov et al. (1987). Specifically, 2.0 mL of the extract (1 mg/mL) was combined with 2.0 mL of a 50 g/L sodium acetate solution and 3.0 mL of a 20 g/L aluminum trichloride solution. A spectrophotometer was used to test the mixture's absorbance at 440 nm after 2.5 h of incubation at 20 °C. A standard curve with quercetin concentrations ranging from 20 to 80 mg/L was used to determine the total flavonol. To express the results, milligram of quercetin equivalent per gram sample (QE/g) was employed. A colorimetric approach was used to assess the amount of total flavanol in the extract. Using 4-(Dimethylamino)-cinnamaldehyde (DMACA), the Delcour and Varebkke (1985) method was employed and the effect was determined colorimetrically at 640 nm. The result was given as milligram catechin equivalents (CE) for each gram of sample (g).
2.5 Trolox equivalent antioxidant capacity (TEAC)
The radical cation decolourization test, which employs the 2, 2′-azinobis (3-ethylbenzothiazolie-6-sulfonate) diammonium salt (ABTS) method in line with the method reported by Re et al. (1999) with minor modification was used to measure the TEAC of the extract. 8 mM ABTS (in water) and 3 mM potassium persulfate were combined to create ABTS•+, which was then allowed to stand for 16 h. The ABTS•+ solution was then diluted with ethanol (approximately 1:90, v/v) to obtain an absorbance of 0.7 ± 0.02 at 734 nm and subsequently, 100 µL diluted extract or Trolox standard solution (0–500 µM) was added to 2.4 mL ABTS•+ solution, and absorbance was measured at exactly 6 min at 734 nm by using a Multiskan Spectrum plate reader (Thermo Fisher Scientific, USA). Results were presented as micromole Trolox Equivalent per gram sample (TE)/g, with Trolox serving as the analytical reference. The standard curve was linear between 0 and 1000 µM Trolox.
2.6 Ferric reducing antioxidant property (FRAP)
The process outlined by Benzie and Strain (1996) was used for FRAP analysis. To prepare the FRAP reagent, tripyridyl triazine (TPTZ) (10 mM in 40 mM HCl), 20 mM of FeCl3·6H2O, and acetate buffer (300 mM, pH 3.6) were well mixed. Subsequently, in a 96-well plate, 10 µL of the diluted extract was added to 300 µL of the FRAP reagent, and the mixture was allowed to sit for 30 min at room temperature. The plate was then read at 593 nm (wavelength) using a Multiskan Spectrum plate reader (Thermo Fisher Scientific, USA). Ascorbic acid served as the standard antioxidant drug.
2.7 DPPH assay
Following the description of Jimoh et al. (2019), the ability of the plant extract to scavenge DPPH radicals was evaluated. Briefly, a solution of 0.135 mM DPPH was prepared in a dark bottle served as the source of the DPPH radical. The plant extract and Trolox standard were serially diluted to equivalent concentrations of 0.08, 0.04, 0.02, 0.01, and 0.005 mg/mL, respectively, then mixed in a ratio of 1:1. The mixture followed vertexing and a 30 min incubation at room temperature. Thereafter, a volume of 300 µL dispensed in a 96-welled microplate was read at an absorbance of 517 nM. The results were presented as micromole/Trolox equivalent per g dry weight (µmol TE/g).
2.8 UPLC-ESI-QTOF-MS of phenolic analysis
The LC-MS analysis was conducted using a QA Waters Synapt G2 quadrupole time-of-flight mass spectrometer. It was fitted with a Waters ultra-pressure liquid chromatography (UPLC-MS) using Waters msE technology and photodiode array detection. The phenolic method and specification of the instrument was reported by and adopted from Stander et al. (2017), in the negative ion mode with minor modifications. The solvents A and B in the positive ion mode each contained 0.1% formic acid, while the mobile phase in this mode was made up of water and acetonitrile. After 0.5 min of 100 % solvent A, the gradient switched to 100% B for over 0.5 min to 12.5 min. Thereafter, 13 min into the runtime, it then changed to 100% A for the following 2 min in a total run time of 15 min. The flow rate was 0.4 mL/min, the seal wash was 5 min, and the column temperature was maintained at 55 °C. Ionizing electrospray 275 °C desolvation temperature, 15 V cone voltage, and ESI Pos. Leucine encephalin was injected as a lock mass in the background and sodium formate was employed for calibration to get precise mass measurements. The MassLynx software platform supplied with Waters Mass spectrometers was used for manually processing each chromatogram.
2.9 Identification of compounds using UPLC-ESI-QTOF-MS
The identified metabolites were given preliminary names based on accurate mass matches that were automatically searched in databases such as Metlin, massBank, NIST, and other libraries like PubChem, mass fragmentation patterns of compounds searched in the databases, and number of carbon atoms for isotope relative abundance. All compounds were identified as unidentified using accurate mass match if their accurate mass error (AME) was more than 5 ppm (Zubarev and Makarov, 2013). To identify a particular compound based on the retention time, mass fragmentation, and ionization modes, a few standards of phenolic compounds were spiked under identical LC/MS conditions (positive and negative ion modes). Considering that it was possible to get all standards and many compounds could be detected using UPLC-MS, the MS and MS2 fragment ions of other compounds that were like those being annotated were employed. Compound structures were elucidated using MS-MS analysis of the sample's compounds that were fragmented to match to product ion mass spectra. If isotope abundances were available, the number of carbon atoms in the peak was computed as a final step. False annotations were minimized by using the predicted number of carbon atoms in the putatively recognized molecule.
2.9.1 Reagents
All reagents and chemicals were purchased from Sigma-Aldrich (St. Louis, MO, USA) unless stated otherwise. Minimal Essential Medium (MEM) and PBS with and without Ca2+ and Mg2+ were purchased from Cytiva (Marlborough, MA, USA). Foetal Bovine Serum (FBS), non-essential amino acids and penicillin/streptomycin were purchased from Biowest (Nuaillè, France). Bis-benzamide H 33,342 trihydrochloride (Hoechst) was purchased from Sigma-Aldrich (St. Louis, MO, USA). Human hepatoma derived C3A hepatocytes were purchased from American Type Culture Collection (ATCC, Manassas, Virginia, USA). MEM/EBSS and Park Memorial Institute (RPMI) 1640 Medium, as well as PBS with and without Ca2+ and Mg2+ were purchased from Cytiva (Marlborough, MA, USA).
2.9.2 Cell culture maintenance
All cell cultures were incubated at 37 °C in a humid atmosphere with % CO2. The L6 myoblast cells were grown in an antibiotic-free medium comprising RPMI 1640 and 10% foetal calf serum, while the HepG2 cells received a growth medium consisting of RPMI 1640 medium every 2 to 3 days. After 90 percent confluence, the cell lines were divided into subcultures.
2.9.3 MTT cytotoxicity assay
A final concentration of 100 mg/mL of the plant extract was obtained by reconstituting it in dimethyl sulfoxide (DMSO), which was then sonicated and kept at 4 °C until needed. The cells (C3A hepatocytes) were kept in 10 cm culture dishes with full media (MEM with 1 % non-essential amino acids, 10% FBS, penicillin/streptomycin) and incubated at 37 °C in a humid environment with 5% CO2. Afterward, the cells were seeded in 96-well plates at a density of 4000 cells per well (100 µL aliquots) and allowed to attach for an additional day. Thereafter, 100 µL of three different concentrations of the plant extract (200, 100, and 50 µg/mL) were then treated with the cells in the 96-well plate for 48 h at 37 °C, 5% CO2, and melphalan (100 mM stock) was used as a positive control at 30 μM. After aspirating the medium and treatment, 100 μL of the staining solution—Hoechst 33,342 nuclear dye (5 μg/mL)—was added to each well, and the plates were then let to sit for 30 min. The plates were immediately photographed using the DAPI and Texas Red filters after the incubation time, when 10 μL of propidium iodide (PI) solution (100 μg/mL) was added to each well.
Using a 10 Plan Fluor objective, DAPI and Texas Red filter cubes, and an ImageXpress Micro XLS Widefield Microscope (Molecular Devices), it was possible to quantify both living and dead cells. Per well, nine image sites were captured, which represents approximately 75% of the well's surface area. The MetaXpress program and the Multi-Wavelength Cell Scoring Application Module were used to analyze the acquired images. Data processing and analysis were conducted on acquired data once it was uploaded to an EXCEL spreadsheet.
2.9.4 Alpha-glucosidase determination
For this test, all chemicals and reagents were freshly prepared and purchased from Sigma-Aldrich (St. Louis, MO, USA). The α-glucosidase inhibitory test was carried out using a modified version of the Sekhon-Loodu and Rupasinghe (2019) method. Briefly, the plant extract was reconstituted in dimethyl sulfoxide (DMSO) to a final concentration of 100 mg/mL and diluted in assay buffer (potassium monobasic anhydrous phosphate (67 mM, pH 6.8)) to concentrations range of 20 – 1.25 μg/mL. Ten microlitres (10 μL) of the extract and 70 μL of the α-glucosidase from Saccharomyces cerevisiae (50 g/mL) were put to a 96-well clear plate, and the mixture was incubated at 37 °C for 10 min. Thereafter, 20 μL of p-nitrophenyl-d-glucopyranoside (10 mM) was added and the reaction was terminated by adding 25 μL Na2CO3 (100 mM) and the absorbance was measured at 410 nm using a BioTek® PowerWave XS spectrophotometer (Winooski, VT, USA). The positive control, epigallocatechin gallate (EGCG), was mixed with the enzyme and substrate without inhibitors. Sample controls and blanks, on the other hand, were mixes of sample and control, but with α-glucosidase in place of buffer, respectively. The following formula was used to determine the percentage of α-glucosidase inhibition:
IC50 values were determined using GraphPad Prism 4.0.
2.9.5 Hepatocyte glucose uptake of the plant extract
The effect of the plant extract on glucose uptake and utilisation in C3A hepatocytes was determined in accordance with the method of van de Venter et al. (2008), with modifications. The plant extract was ultrasonically reconstituted in DMSO at a stock concentration of 100 mg/mL, then kept at 4 °C until needed. The cells were kept in 10 cm culture dishes loaded with a complete medium (MEM with 1% NEAA, 10% FBS, and 1% Pen-Strep) and incubated at 37 °C in a humid environment with 5 % CO2. The cells were seeded in 96 well plates (2 × 10⁴ cells/well, 100 μL aliquots) and left overnight to attach. Incubation of the cells with the plant extract at various concentrations (25, 50, and 100 µg/mL) lasted for 24 h. Following the aspiration of the medium, 25 µL of incubation buffer (RPMI-1640 mixed with PBS containing 0.1% BSA to a final glucose concentration of 8 mM) was added to the cells before being rinsed with 100 mL of PBS and the media was removed. A positive control was employed, which was insulin (1 µg/mL). After the cells had been incubated for 4 h, 200 µL of freshly prepared glucose oxidase test reagent (0.5 M PBS, pH 7.0, 2.5 U/mL horseradish peroxidase, and 1 mU/mL glucose oxidase from Aspergillus niger) was added to the plates. A BioTek® PowerWave XS spectrophotometer was then used to measure the absorbance at 510 nm after the reaction had been incubated at room temperature for 15 min (Winooski, VT, USA). To track changes in the concentration of glucose in the used culture medium as a function of the red-colored quinoamine dye complex produced, which was measured spectrophotometrically at 510 nm, a colourimetric glucose oxidase/peroxidase assay, based on the procedure described by Trinder (1969), was used. The glucose standards were the cell-free wells with incubation buffer and full culture media. As a function of the amount of glucose (mM) left, glucose uptake and consumption were calculated and expressed as the difference between the means of the standard and test samples.
To confirm that any detected variations in glucose uptake or utilization were not caused by variations in cell viability, the MTT (3–4,5 dimethylthiazol-2,5-diphenyltetrazolium bromide) experiment was carried out. The reduction of a yellow, water-soluble tetrazolium salt to a purple, insoluble formazan product is the base of the MTT test. The absorbance was determined at 540 nm and the purple-colored formazan crystals were dissolved in dimethyl sulfoxide (DMSO). The quantity of healthy, live cells is then correlated with the formazan concentration (Twentyman and Luscombe, 1987).
2.10 Data analysis
All the data were triplicated and expressed as mean ± standard deviation. The data were analyzed using a one-way Analysis of variance (ANOVA). For the cytotoxicity test, the IC50 values were calculated using the graph pad prism. A p-value < 0.05 was considered significant.
3 Results and discussion
3.1 Phenolic contents
It has been well established that prevention appears as a potent strategy for reducing the risk of detrimental chronic conditions such as diabetes as therapy options do not always ensure a long-term recovery (Averilla et al., 2019). Interestingly, plants have been employed as a reference source for isolating lead compounds for the development of drugs that could be used in the management of chronic diseases in humans (Naz et al., 2019). Presently, the extraction of phytochemicals, such as phenolic compounds, has gained popularity since they are one of the most significant natural antioxidants or free radical terminators with a variety of therapeutic advantages and coupled with the fact that their use is associated with fewer side effects (Banothu et al., 2017; Hassan et al., 2021). It is worth noting that the solvents used in soaking and shaking for maceration extraction also play a vital role (Azwanida et al., 2015). Remarkably, previous studies have demonstrated that the solvent mixture (alcohol and water), as opposed to ethanol and other solvents, is better for the extraction of phenolic compounds (Obied et al., 2005; Moo-Huchin et al., 2019; Shahinuzzaman et al., 2019; Shahinuzzaman et al., 2020). It is important to note that the presence of water in an aqueous alcohol mixture during extraction enables the plant components to absorb water and increase in size, allowing the alcohol to easily penetrate the solid matrix and leading to higher extraction and bioactive components of the plant (Galanakis et al., 2013; Okafor et al., 2021).
In the present study, 70% (v/v) ethanol was employed to extract the phenolic compounds of M. communis 'Variegatha'. A crude extract yield of 20.22 g was obtained from 100 g of dried leaf powder in 1.5 L of 70 % (v/v) ethanol for 48 h. The polyphenols content was 116.44 ± 3.26 mg GAE/g, flavonols (6.74 ± 0.50 mg QE/g), flavanols (2.46 ± 0.03 mg CE/g). Flavonoids are the largest and predominant group of plant polyphenols with nutraceutical importance (Lokesh and Venkatarangana, 2015). Flavonols, the most predominate group of flavonoids, are present in most plants and consequently their TEAC (Singleton et al., 1999). In addition to scavenging free radicals and inhibiting enzymes that generate ROS, flavonoids also regulate the body's antioxidant defenses (Mishra et al., 2013). Also, flavonoids protect the biomembrane lipids from lipid peroxidation-caused damage. Thus, flavonoids act as antioxidants and help to prevent a variety of chronic caused by oxidative stress (Ramchoun et al., 2009).
Likewise, the antioxidant activity of plant extracts was assessed by using some well-established assays such as DPPH, TEAC and FRAP (Rajurkar and Hande 2011). The FRAP was estimated to be 1267.28 ± 38.23 µmol AAE/g, DPPH (1165.37 ± 45.21 µmol TE/g), and TEAC (775.52 ± 20.96 µmol TE/g). The results from the present study corroborate with the findings of Aryal et al. (2019) from Alternanthera sessilis and Tirado-Kulieva et al. (2021) from Mangifera indica about the strong antioxidant capacity demonstrated by the crude extract, which may be attributed to its rich phenolic compounds. Free radicals have been identified as one of the main players in endogenous enzyme inactivation and other vital cellular components caused by oxidative stress (Halliwell and Gutterdige, 2015). To restore redox equilibrium and either inhibit or reverse detrimental free radical impacts, the investigated plant extracts may modulate and neutralize these free radicals in vivo (Moriasi et al.., 2020). The 70% ethanolic leaf extract of M. communis 'Variegatha' also had a high ferric reducing power, which implies that it may reduce ferric ions to ferrous ions to assess its antioxidant potential. Intriguingly, it aids in predicting the extract's capacity to mimic the body's natural antioxidants, such as bilirubin and uric acid, in reducing oxidative stress (Singh et al., 2016).
3.2 Total antioxidant capacity
Total antioxidant capacity assays have the benefit of being able to assess the antioxidant contents of a sample in a global way (Rubio et al., 2016). Diabetes and its complications have been linked to oxidative stress, which is caused by an imbalance favouring free radicals over cellular antioxidants (Ojo et al., 2019). In the present study, ABTS, DPPH, FRAP, and TEAC assays were widely used to assess the antioxidant capacity of the extract and it was observed that the extract demonstrated strong antioxidant activity (1165.37 ± 45.21 µmol TE/g) against DPPH radical, TEAC (775.52 ± 20.96 µmol TE/g) and the significant antioxidant capacity demonstrated by the extract could be due to the presence of the phenolic compounds identified in Tables 1 and 2 (Oleinik et al., 2022). The potential of the extract to reduce ferric to ferrous was also investigated (Bartosz 2010). The FRAP was observed to be 1267.28 ± 38.23 µmol AAE/g. An important mechanism of the phenolic antioxidant effect is electron donating activity, which is frequently measured by Fe (III) reduction (Vadivukkarasi et al., 2014). The FRAP reducing power capacity of any compounds is often dependent on the existence of reductones, which serve as antioxidants by donating one atom of hydrogen to break the chain of free radicals (Meir et al., 1995; Duh et al., 1999). *H20 =[M+H-H2O]+, Na =[M+Na]+, and **= [M+NH4]+ in the positive ion mode. New means it has been reported from M. communis ‘Variegatha’ for the first time, although it has been previously identified from other plant sources.
No
tR (min)
UV λmax (nm)
m/z [M−H]-
MS/MS
Tentative name
Identification
1
1.10
215.0326
207, 209, 195, 179, 165
Xanthotoxin
New
2
1.17
191.0561
191, 89
Quinic acid
Taamalli, et al., 2014
3
1.96
231
191.0201
131, 127, 161
Quinic acid
Taamalli, et al., 2014
4
4.45
274
343.0672
191, 147, 127
Galloyl quinic acid isomer
Taamalli, et al., 2014
5
6.90
264
782.0615
316, 633, 162
Quercetagetin-7-O-galloylprocatechuoylhexoside
New
6
8.03
274
495.0761
169, 343, 191, 125
Digalloyl quinic acid
Taamalli, et al., 2014
7
8.34
265, 274
783.0643
301, 495, 708
Cornusiin C isomer 1
Taamalli, et al., 2014
8
11.47
237
431.1889
385, 421, 179
Neorehmannioside
Taamalli, et al., 2014
9
11.84
264, 349
631.0911
489, 316, 271
Quercetagetin-7-O-galloylglucoside
New
10
12.52
262, 307,
357479.0818
316, 287, 271
6-hydroxyquercetin7-O-β-glucopyranoside
New
11
13.40
259, 348
615.1011
381, 447, 477
Quercetagetin-O-procatechuoylhexoside
New
12
14.13
259, 349
463.0865
316, 300, 271
Ellagic acid hexoside
Taamalli, et al., 2014
13
16.31
256, 345
447.0943
301
Quercetin-3-O- rhamnoside
Taamalli, et al., 2014
14
17.25
244, 287, 325
359.0757
161, 197, 191
Syringic acid hexoside
New
15
17.50
244
417.2121
407, 187, 161, 179
1,3-O-Caffeoyl-dihydrocaffeoylglycerol
New
16
19.84
273
571.2371
305, 533, 247
Epigallocatechin derivative
New
17
21.95
272
567.2070
169, 447, 125, 271, 324, 461
Gallomyrtucommulone C
Taamalli, et al., 2014
18
24.03
238, 271
209.0804
503.3405117
unknown
19
24.44
288
445.2232
431, 265, 225, 165, 139, 123
Apigenin-6-C-glucoside derivative
New
20
24.66
281, 404
431.2065
209, 311
Apigenin-6-C-glucoside
New
21
24.79
281, 404
431.2066
195, 209
Apigenin-8-C-glucoside
New
No
tR (min)
UV λmax (nm)
M/z [M + H]+
MS/MS
Tentative nomenclature
Identification
22
0.68
239, 259
203.0535
192
Xanthotoxol
New
23
1.35
268
163.0614
145
Hydroxy coumarin
New
24
2.75
240, 260
479.0839
153, 125, 309
Isorhamnetin-7-O-galactoside
New
25
3.56
259, 286
319.0445
481.0957153, 319
6-hydroxyquercetin7-O-β-glucopyranoside
New
26
3.83
258, 287
319.0466
319, 147
6-hydroxyquercetin
New
27
4.20
267, 353
303.0517
155, 227
Quercetin
28
4.42
254, 370
211.1699**
193, 175, 135
Scopoletin
New
29
5.17
275
315.0713
153, 165, 221, 255
6-Hydroxykaempferol methyl ester
New
30
5.92
239, 282
221.1545*H2O
193
Xanthotoxol
New
31
6.30
248
475.1626Na
313, 375, 298, 105
Epicatechin-3-O glucoside
New
32
7.00
275
279.1611**
219, 149
Leptophyllin
New
33
7.21
273
237.1489
237
unknown
34
8.06
278, 234
313.1094Na
237
Epicatechin
New, identified using a standard
35
8.50
200.2017
unknown
36
9.39
293
496.3383
184, 125, 104, 478
Digalloyl quinic acid
Taamalli, et al., 2014
37
9.72
239, 293
433.2227
197, 179, 415, 151
Apigenin-8-C-glucoside
New
38
10.08
292
447.2373
429, 211
Apigenin-8-C-glucoside derivative
New
39
10.60
436
373.2750
653.3666373, 593, 293, 413
Epicatechin or catechin derivative
New
40
11.52
408
593.2747
533, 461, 433, 505, 277, 415
Apigenin-di-C-hexoside
New
41
11.83
264
373.2741
237
Epicatechin or catechin derivative
New
42
12.49
410
621.3067
unfragmented
Cratenacin (4111-acetylvitexin-211-O-rhamnoside)
New
The extract had a considerable reducing power potential, which served as a significant indication of its antioxidant activity by causing the Fe3+/ferricyanide complex to be reduced to the ferrous form (Sulaimon et al., 2020). Antioxidants are also reported to react with certain precursors of peroxide, thus preventing peroxide formation (Kumar et al., 2021; Sharifi-Rad et al., 2020). It has been established in the literature that non-enzymatic antioxidants such as phenolic compounds can act through one of the different antioxidant mechanisms to scavenge free radicals (Kumar et al., 2012). By either boosting the body's built-in antioxidant defense system or taking proven numerous health benefits, the plant's antioxidant capacity suggests that it may be utilized to lower the risks of chronic illnesses and prevent disease development. Therefore, the search for natural antioxidants is, therefore, a top priority (Ali et al., 2008). The antioxidant activity of medicinal plants is revealed by their involvement in reducing free radical-caused tissue injury (Kasote et al., 2015; Sylvie et al., 2014).
3.3 UPLC-ESI-QTOF-MS analysis
3.3.1 Characterisation of phenolic compounds
A total of 42 metabolites could be identified. Figure 1 and 2 show the base peak chromatogram for 70% ethanol extract of M. communis. A number of phytochemicals were identified; hydroxybenzoic acids including ellagic acid derivatives,hydroxycinnamic acids, flavonols, flavanols, flavones and coumarins and furanocoumarins
Hydroxybenzoic acids: Peaks 4, [M−H]-; m/z 343, peak 6 and 36, and 17 were considered as galloyl derivatives, which exhibited major ions in MS2 fragmentation, m/z 169 corresponding to that of gallic acid (Fig. 1) (Khallouki et al., 2015), owing to UV absorption of about 276 nm and m/z 125 [gallic acid –H2O-CO2]-. The compounds were also previously identified (Clifford et al., 2007, Taamalli et al., 2014).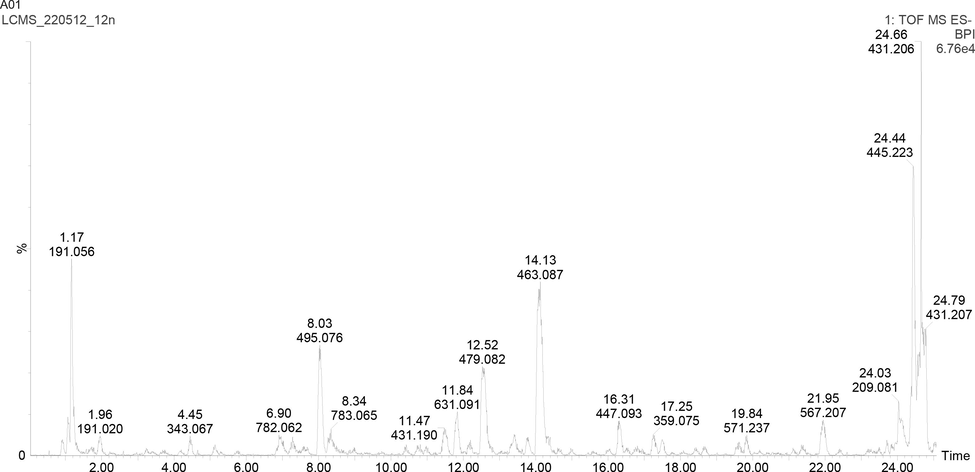
UHPLC-ESI-MS base peak chromatogram for 70% ethanol extract of M. communis ‘Variegatha’ analysed in the negative ion mode.
Hydroxycinnamic acids: two peaks, 14 and 15 peaks have been characterised and hydroxycinnamic acid derivatives. Peak 14 was tentatively identified as syringic acid hexoside; [M -H]-, m/z 359, showing a typical major fragment; 197 [syringic acid -H]-, 329 [M –H- CH3]-, 161[M –H- syringic acid]-. Peak 15 was a phenylpropane glycerides identified as 1,3-O-caffeoyl-dihydrocaffeoylglycerol in the literature with a similar MS2 fragmentation pattern (Ma et al., 2007; Kang et al., 2016).
Flavonols: Eleven compounds belonging to flavonol peaks: (5, 9, 10, 11, 12, 13, 24, 25, 26, 27 and 29) were characterised from 70% ethanol extract of M. communis. Most flavonols were detected at UV absorption at 258 and 348 nm. Peaks 27 and 13 were identified to be those of quercetin and quercetin-3-O-rhaminoside, respectively as earlier identified (Taamalli et al., 2014; Wang et al, 2001). Quercetin; [quercetin + H]+; m/z 303 with common MS2 fragment 155 [1,3A-], formed through retrocyclization cleavages of the C-ring of the aglycone involving 1 and 3 bonds (bonds 1 and 3 refer to the O—C—2 and C-3—C-4 bonds of the C-ring) (Tsimogiannis et al., 2007). Quercetin aglycone underwent sugar conjugation by the addition of a rhaminoside (146 Da) (peak 13). Peak 26, m/z 319 ion, ([M−H]- ion) was previously identified as 6-hydroxyquercetin (Parejo et al., 2004, Shahzadi and Shah, 2015). Peaks 10 and 25 were a sugar conjugates of 6-hydroxyquercetin (Parejo et al., 2004, Shahzadi and Shah, 2015). They displayed major MS m/z 481. Peaks 9 and 11 were identified as quercetagetin-7-O-galloylglucoside and quercetagetin-O-procatechuoylhexoside, respectively as previously identified (Parejo et al., 2004). The CID spectrum of the quercetagetin m/z 317 ions, ([M−H]- ion) showed MS2 main fragment, 149 [1,3B-], in negative ionisation mode ([1,3B-], bonds 1 and 3, here refers to the O—C—1 and C-3—C-4 bonds of the C-ring bond cleavage) (Tsimogiannis et al., 2007). Exhibiting the characteristic ion fragments due to the retro-Diels-Alder cleavage at m/z 149. Quercetagetin aglycone was conjugated with O-linked galloyl glucoside and procatechuoylhexoside (peaks 9 and 11) Table 1. Further esterification of procatechuoylhexoside with galloyl could give compound 5. Peaks 29 were identified as those of 6-hydroxykaempferol methyl ester, owing to UV max absorption, 339, 340 nm and prior report of this compound and as methyl ester adding 14 u on the aglycone (Parejo et al., 2005, Shahzadi and Shah, 2015). Peak 24 was identified as isorhamnetin-7-O-galactoside after glucoside conjugation to isorhamnetin aglycone (315 Da) with product ions m/z 153, 125, 309 (Parejo et al., 2004).
Ellagic acid derivatives: Peaks 7 and 12 were previously characterised as cornusiin C isomer 1 and ellagic acid hexoside (Taamalli et al., 2014).
Flavanols: Five flavanols were characterised (peaks 16, 31, 34, 39 and 41). Compound 34 was identified as epicatechin because its fragmentation pattern was consistent with that of the standard. Peak 31 was identified as epicatechin-3-O glucoside in which 162 Da was added. Peaks 16, 39 and 41 had MS2 fragments, similar to that of the aglycone largely (Escobar-Avello et al., 2019) and therefore identified as derivatives of epicatechin.
Flavones: Seven flavones from peaks 19, 20, 21, 37, 38, 40 and 42. Many of these are being reported for the first time from this plant. However, MS2 fragmentation behaviour for compounds 20, 21, 37, 40, and 42 is similar to earlier report (Stander et al., 2017). Apigenin-6-C-glucoside derivative was identified from peak 38 due to similar fragmentation pattern and UV absorption with that of peak 20 and 21.
3.4 Coumarins and furanocoumarins
Coumarins and furanocoumarins were detected at peaks 1, 22, 23, 28, 30 and 32. Most of which exhibited UV λmax at 274 nm, characteristic of coumarin. Peak 1 was identified in negative ion mode as xanthotoxin consistent with previous reports (Kerebba et al., 2022; Yang et al., 2010). Peak 23 was identified as umbelliferone (hydroxyl coumarin) peak, consistent with the literature (Yang et al., 2010). Peak 28 was tentatively identified as scopoletin via its ammonium adduct in the positive ion mode with MS2 of characteristic ion, m/z 193 [M + H]+, 175 [M + H- OH]+ and 135 [M + H-OCH3 –OH-O]+. From Fig. 2, peaks 22 and 30 were identified to be furanocoumarin; xanthotoxol (8-hydroxypsorale), as identified in the previous report (Kerebba et al., 2022; Yang et al., 2010), although they have been reported from this plant for the first time. Peak 32 was identified as leptophyllin in accordance with the literature (Yang et al., 2010). It displayed with [M + NH4]+; m/z 279 and MS2 fragments m/z 219 [M + H- CO2]+ Table 2.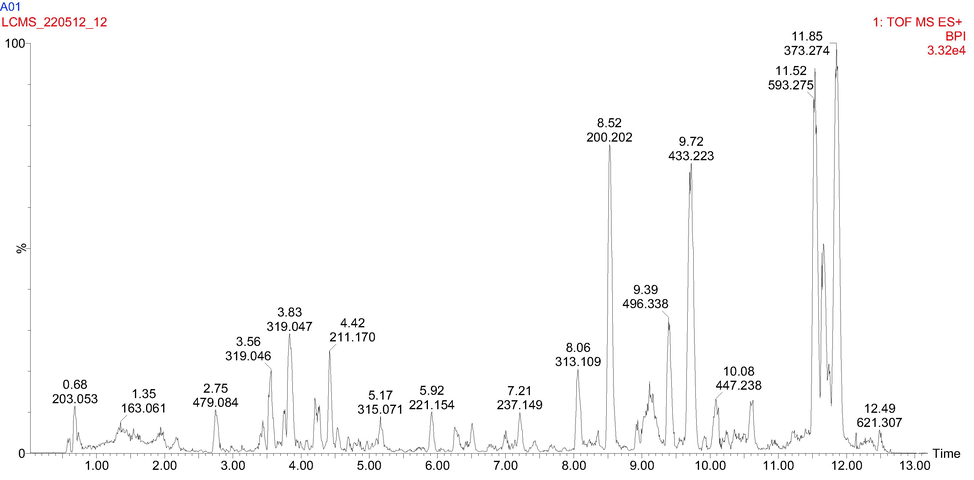
UHPLC-ESI-MS base peak chromatogram for 70% ethanol extract of M. communis ‘Variegatha’ analysed in the positive ion mode.
3.4.1 UPLC-QTOF-MS quantitation of phenolic compounds
The UV/vis absorptions, capable of distinguishing phenolic subclasses, were considered a starting point for compound quantification. Based on the qualitative analysis, four chemical markers, namely phenolic acids and derivative (neochlorogenic acid (peak 1), caffeic acid (peak 3), ferulic acid (peak 6), and coumaric acid (peak 5), flavonol (peak 7), dihydrochalcone (peak 8), and flavano-3-ols (peak 2/4) were selected for simultaneous quantitative determination (Fig. 3). They were the most abundant in many reported plant ethanolic extracts. They have been well represented in this study. Based on the UV spectrum of the markers, UV detection wavelengths were chosen. The phenolic acids and derivatives had the strongest UV absorption at 300, 308, and 325 nm, whereas flavonols at 254, 255, and 354 nm, dihydrocalcones at 284 nm, and finally flavan-3-ol at 277 nm.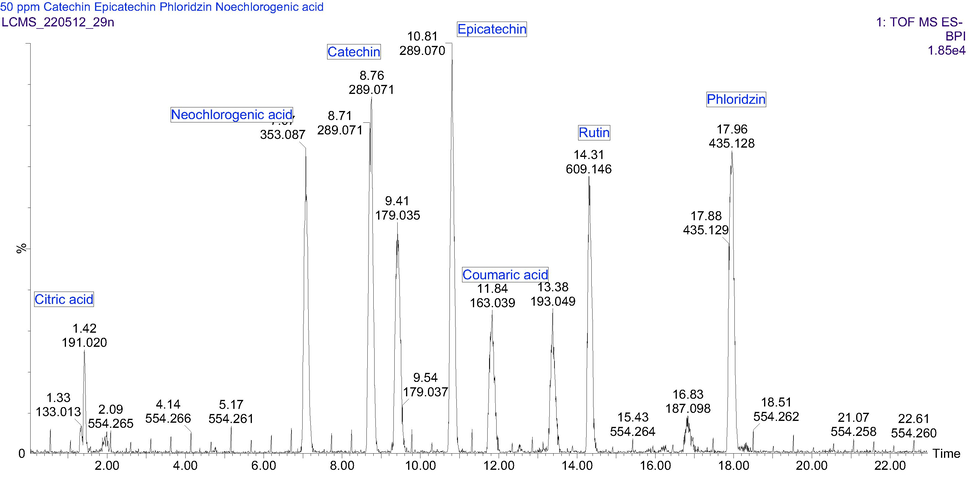
UHPLC-ESI-MS base peak chromatogram for the standard mix in negative ion mode.
Different concentrations of the standard mixture (3.9, 7.8, 15.6, 31.3, 62.5, 125.0, and 250.0 mg/L), were injected for quantification. The linearity of the calibration curve was checked by plotting the peak areas against the series of standard solution concentrations (mg/L) and determining the correlation coefficient using a linear regression model. In all cases, the system was linear when r greater than 0.99. Limits of quantification and detection LOQ and LOD respectively, presented in Table 3 were calculated by the parameters of the analytical curves (standard deviation of the response and slope). The standard deviation of the y-intercepts of regression lines was used as the standard deviation of the blank. The LODs and LOQs were estimated as 3.3 and 10 times the standard deviation of the blank/slope ratio of the calibration curve, respectively. According to LODs and LOQs, the phenolic compounds were highly detectable and quantifiable using the methods specified in the 70% ethanol extract of M. communis 'Variegatha' (Fig. 4). (Table 3). This approach may be used to profile phenolic compounds from the samples examined, according to the observed limits of detection and quantification. The quantification of phenolic compounds has been expressed as neochlorogenic acid, caffeic acid, ferulic acid, coumaric acid, rutin, catechin, epicatechin, phloridzin equivalents. NB: Limit of detection (LOD), Limit of quantification (LOQ).
No
Name
tR (min)
UVλmax (nm)
Regression equation
Linear range mg/L
R2
LOD mg/L
LOQ mg/L
1
Neochlorogenic acid
7.1
300, 325
y = 3.0x + 7.9
3.9–31.3
0.994
10.0
30.4
2
Catechin
8.7
278
y = 1.6x + 94.2
3.9–31.3
0.999
5.3
16.0
3
Caffeic acid
9.4
300, 325
y = 1.9x-1497.4
3.9–15.6
0.993
6.2
18.9
4
Epicatechin
10.8
277
y = 1.2x + 1859.3
3.9–31.3
0.996
4.0
12.2
5
p-Coumaric acid
11.8
300, 308
y = 3.9x + 2855.3
7.8–62.5
0.993
12.9
39.1
6
Ferulic acid
13.4
300, 323
y = 4.2x + 1098.7
7.8–31.3
1.000
13.8
41.7
7
Rutin
14.5
254, 255, 354
y = 1.9x + 449.7.3
7.8–31.3
0.994
6.1
18.6
8
Phloridzin
17.9
284
y = 1.4x + 1603.3
3.9–15.6
1.000
4.7
14.2
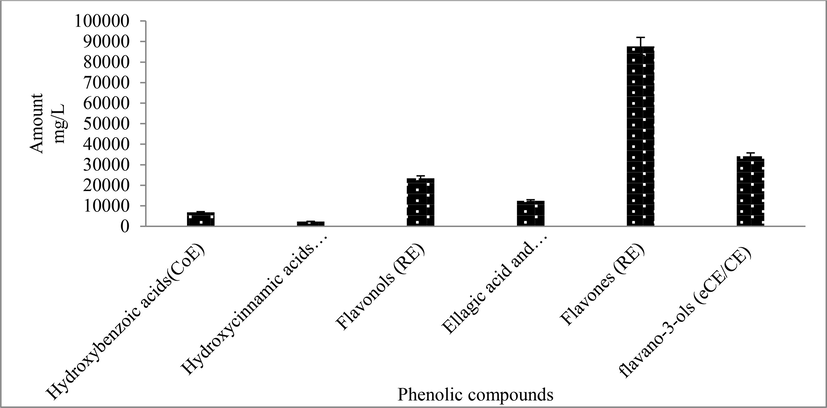
The amount of phenolic compounds quantitated from 70 % ethanol extracts of M. communis ‘Variegatha’. CoE = coumaric acid equivalents, CE = Catechin equivalents, CAE = caffeic acid equivalent, RE = rutin equivalent, eCE = epicatechin equivalent.
3.5 Alpha-glucosidase inhibition
In the present study, Fig. 5 depicts the inhibition of alpha-glucosidase activity by an ethanolic extract of Myrtus communis ‘Variegatha’. Remarkably, a concentration-dependent (1.25–20 µg/ml) manner was observed and the highest activity (98.95%) was attained at the higher concentration of 20 µg/mL, which is higher than the control drug, EGCG (45.87 µg/mL ≈100 µM). From the above result, the plant extract exhibited a strong alpha-glucosidase inhibition, with an IC50 of 3.159 ± 1.03 µg/mL comparable to that of the positive control EGCG (6.208 ± 1.02 µg/mL ≈ 13.54 µM). The alpha-glucosidase inhibitory activity recorded in the present study is highest than those reported in the literature. For instance, the ethanol extract of Myrica gale demonstrated the highest inhibition of alpha-glucosidase with IC50 values (27 mg/L) (Sekhon-Loodu and Rupasinghe, 2019). Extract from Cornus capitata Wall. showed inhibition effect, with 98.37% inhibition (IC50 12.5 µg/mL) (Bhatia et al., 2019). With IC50 values of 12.5 µg/mL and 24.8 µg/mL, respectively, both 50% ethanol and Tamarix nilotica crude in aqueous inhibited alpha-glucosidase in a concentration-dependent manner (Daou et al., 2022).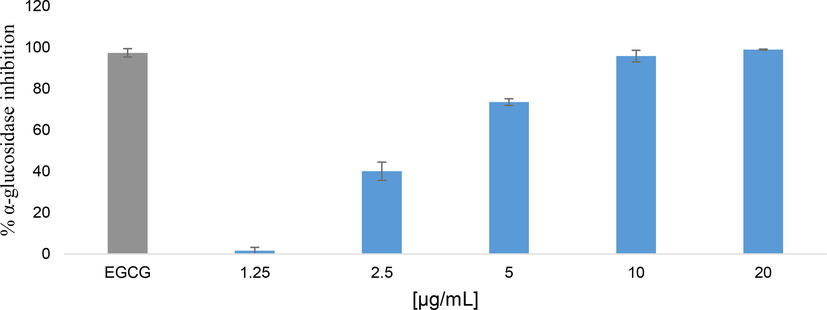
Alpha-glucosidase inhibition effect of ethanolic extract of Myrtus communis ‘Variegatha’. ECGC (100 µM) was used as a positive control. Error bars indicate the standard deviation of the mean.
The quest for novel drugs from natural resources, particularly plants, has become a promising strategy for treating postprandial hyperglycemia to validate the traditional claims of some medicinal plants (Kifle et al., 2020; Pringle et al., 2021). Alpha glucosidase catalyses the final stage of starch digestion by hydrolysing terminal glucose molecules from the non-reducing ends of oligosaccharides. The breakdown of dietary starch and conversion of the oligosaccharides to glucose by the carbohydrate hydrolytic enzymes alpha-amylase and alpha-glucosidase results in an increase in postprandial glucose (Ojo et al., 2019; Sekhon-Loodu and Rupasinghe, 2019). Maltase-glucoamylase (MGAM) and sucrose-isomaltase (SI), two membrane-bound enzymes found in the brush edge of epithelial cells in the small intestine, are alpha-glucosidase (Tundis et al., 2010; Rose et al., 2018). Alpha-glucosidase inhibitors prevent postprandial hyperglycaemia by slowing down the digestion of carbohydrates and consequently the rate at which glucose can be absorbed and enter the general circulation. Alpha-glucosidase inhibitors such as acarbose act via a competitive inhibition mechanism and should ideally bind to all four catalytic domains of the enzyme for it to effectively inhibit the hydrolysis of oligosaccharides (Roskar et al., 2015). Thus, alpha-glucosidase inhibitors are frequently used as oral antidiabetic drugs in the early stages of T2D to combat postprandial hyperglycaemia and obesity (Ojo et al., 2019). As a result, the quest for alpha-glucosidase inhibitors from natural sources such as plants has gained attention.
In this study α-glucosidase inhibitory compounds such as, ellagic acid hexoside, quercetin, and their conjugates, eriodictyol, catechin and epicatechin, coumarins such as leptophyllin and Xanthotoxol. For example, quercetin, and their conjugates are strong α-glucosidase inhibitors (You et al., 2012). Catechin has suppressed the activation of NF-κB system through the inhibition of pro-inflammatory cytkines productions (Mostafa et al., 2014), eriodictyol also suppresses the activation of NF-κB system and reduces TNF-α, intercellular adhesion molecule 1 (ICAM-1), vascular endothelial growth factor (VEGF), and endothelial NOS (eNOS) (Zhang et al., 2012). Epicatechin has previously exhibited α-glucosidase inhibitory activity of IC50 = 29.85 ± 2.20 compared with quercetin (IC50 = 5.30 ± 0.11 mol/L) (Shibano et al., 2008). Quercetin showed IC50 = 0.53 mmol/L, vs 1.7 mmol/L for acarbose, a positive control (Escandón-Rivera et al., 2012). Vitexin, one of the compounds identified in this study has previously demonstrated inhibitory activity against α-glucosidase obtained from rat intestine with IC50 of 0.51 mmol/L (Shibano et al., 2008). Many polyphenols and coumarins with similar skeleton to ones identified here have shown promising α-glucosidase inhibitory activity. For example, coumarins compounds with isolated from the root extract of Rosa rugosa showed potent sucrase inhibitory activity (61.88 ± 3.19% to 84.70 ± 3.07%) at a concentration of 1.0 mmol/L (IC50 ranging between 0.25 ± 0.04 to 0.48 ± 0.12 mmol/L), and the activity was comparable with that of acarbose (50.96 ± 2.97 % inhibition, IC50 < 0.5 mmol/L) (Thaoet al., 2014). Gallic acid, an important constituent of many plants’ species (Zhao et al., 2009), showed strong inhibitory activity against glucosidase both in vitro and in vivo; its IC50 value (24.3 mol/L) was lower than that of acarbose (59.5 mol/L). Methyl gallate obtained from the dried stem and bark extracts of Terminalia superb (IC50 = 11.5 mol/L) (Wansi et al., 2007) and propyl gallate isolated from green tea extracts (IC50 = 11.5 mol/L, Ki = 43.12 mol/L) (Gamberucci et al., 2006) showed strong α-glucosidase inhibitory activity.
3.6 Glucose utilization
Fig. 6 depicts the glucose utilization of 70% ethanolic extract of Myrtus communis ‘Variegatha’ in C3A hepatocytes at different concentrations (25, 50, and 100 µg/mL). The highest glucose utilization was attained at 25 μg/mL while at higher concentrations a slight decrease in glucose utilization was recorded. The glucose utilization potential of the extract may be due to the presence of phytochemicals compounds identified in Tables 1 and 2. The presence of these phytochemical compounds may reduce the increase in postprandial glucose level and different mechanisms of action may be involved in which they achieved this action (Das and Devi 2015). The phytochemical substances can cause the fluids of the small intestine to thicken, which also makes it more challenging for glucose to permeate into the bloodstream from the lumen. Additionally, glucose has the capacity to form bonds with phytochemicals, which lowers the concentration of those compounds in the small intestine lumen. Furthermore, the phytochemicals may inhibit carbohydrate-digestive enzymes, which break down starch, limiting the digestion of carbohydrates and reducing postprandial hyperglycemia. The findings from the present study corroborate with the reports of other research reports documented in the literature (Aladejana et al., 2020; Hassan et al., 2017; Odeyemi and Dewar 2019).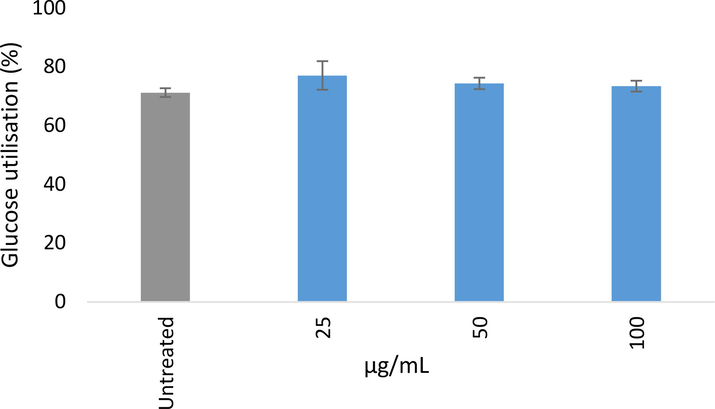
Glucose utilisation (%) after 24 h of treatment in C3A hepatocytes. Results were normalised to cell viability as determined using the MTT assay. Error bars indicate the standard deviation of the mean of at least 3 replicates from a single experiment.
3.7 Glucose uptake
A family of glucose transporters (GLUTs), which serve as vehicles to carry sugar across the cell surface, distribute glucose (Sayem et al., 2018). This rapid glucose-transport mechanism is also essential for the body's ability to store insulin-dependent glucose in muscle and adipose tissues after meals, helping the body continuously to maintain appropriate blood glucose levels (Bouche et al., 2004). Fig. 7 depicts the effects of ethanolic extract of M. communis ‘Variegatha' on glucose uptake in C3A hepatocytes at different concentrations. It was observed that the glucose uptake effect decreases with an increase in the extract concentration. At 25 µg/mL, the highest glucose absorption effect (70.21%) was recorded, and the effects at 25 µg/mL (70.21%) and 50 g/mL (63.50%) were both higher than the standard antidiabetic drug, insulin (62.67%). At 100 µg/mL, the insulin had a higher glucose uptake effect than the extract (56.23%). It has been established that glucose uptake by cells is influenced by the type of cells used in the assay. Glucose uptake in human body cells, for example, differs significantly from those of other eukaryotic cells such as yeast cells. It is interesting to note that the internal concentration of glucose in cells, as well as the rate at which glucose is metabolized in the cells, have a great influence on glucose uptake (Rehman et al., 2018).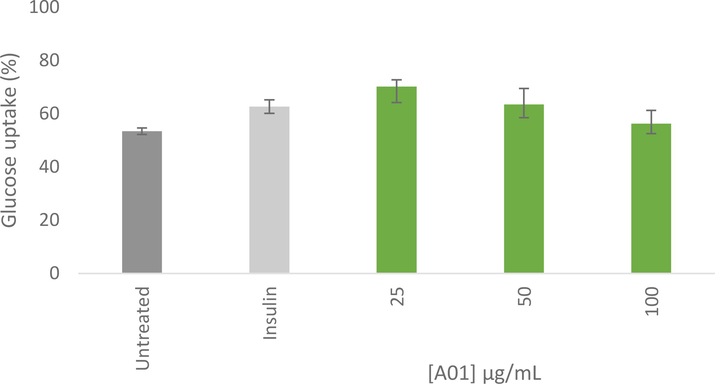
Glucose uptake (%) after 4 h in C3A hepatocytes, following 24 h pre-treatment. Results were normalised to cell viability as determined using the MTT assay. Error bars indicate the standard deviation of the mean of at least 3 replicates from a single experiment.
Once the internal sugar is converted into other metabolites, the internal glucose concentration drops, thereby favouring high glucose uptake into the cell. The glucose uptake by C3A hepatocytes mediated by the extract could be attributable to both facilitated diffusion and enhanced glucose metabolism, according to the findings of this study. According to past research, insulin binds to the tautomeric insulin receptor subunit on the cell membrane of myocytes, triggering a series of processes that drive the translocation of the GLUT 4 receptor into the membrane and enable glucose absorption into the cytosol (Sayem et al., 2018). Polyphenols' hypoglycemic effects are primarily explained by their capacity to inhibit the absorption of carbohydrates in the intestine, alter glucose uptake by altering enzyme activities, enhance β-cell function and insulin action, start the release of insulin, and possess antioxidant and anti-inflammatory properties (Iwai et al., 2006).
3.8 Cytotoxicity assay
The cytotoxic test was carried to determine the most practicable and best concentration for use in anti-diabetic drug administration (Buttner et al., 2021). The MTT assay is a sensitive and quantitative colourimetric assay used to measure the viability of cells (Mosmann, 1983). 3-(4,5-dimethylthiazol-2yl)-2,5-diphenyl tetrazolium bromide (MTT) is water soluble and yields a yellow colour when prepared in medium or buffers. The test is based on the theory that the water-soluble yellow tetrazolium can be reduced by cellular dehydrogenase enzymes of living cells to generate the purple, insoluble formazan result. Due to the impermeability of the cell membrane, this purple formazan product is unable to leave live cells and instead accumulates inside the cell (van Meerloo et al., 2011). Therefore, the amount of formazan product formed is directly proportional to the number of living cells. After solubilization of the formazan product using DMSO the amount produced can be measured and quantified spectrophotometrically at 540 nm (Lin et al., 2019; Kamiloglu et al., 2020). In this study, the cytotoxic effect of M. communis ‘Variegatha’ was assessed against C3A cells and the results is depicted in Fig. 8. After 48 h of treatment, processed live cells are shown in Fig. 8. At the lowest concentration of 50 µg/mL, the extract demonstrated approximately 50% cell death, and the number of viable cells decreased with increasing concentrations. To accurately estimate an IC50, the plant extract was tested at various concentrations. The concentration of an extract that will make 50 % of cells non-viable is known as an IC50. In the present study, the IC50 value is 76.85 µg/mL (P < 0.05).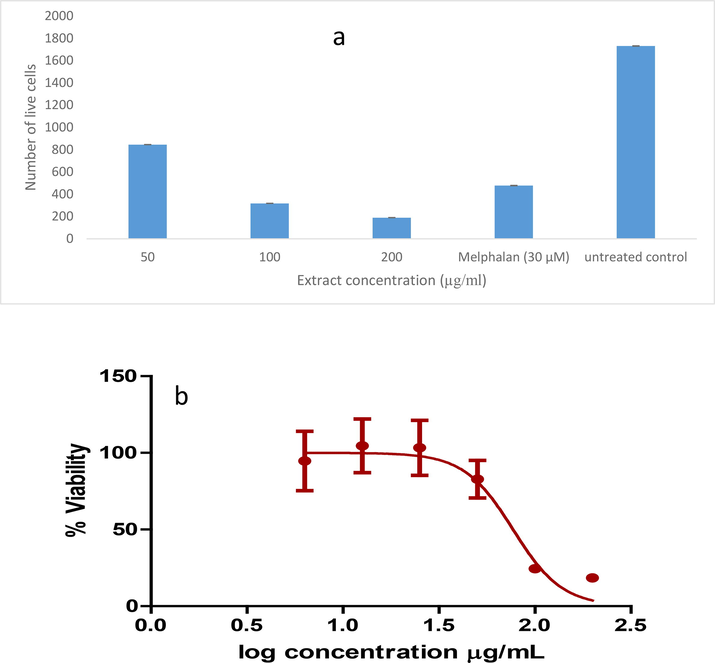
Cytotoxicity of M. communis ‘Variegatha' tested against C3A cells. Cells were treated for 48 h. Error bars indicate the standard deviation of quadruplicate values done as a single experiment. Cytotoxicity assay of ethanolic extract of M. communis ‘Variegatha’ by MTT assay. The IC50 is generated from GraphPad Prism.
Based on UPLC-ESI-QTOF-MS identification and quantification, flavonols and flavones flavanols were the most identified subgroups of flavonoids in the ethanol extract. Flavonoids and phenols are important components of diets and medications due to their inherent health-promoting properties, which include antioxidative, anti-inflammatory, antimutagenic, anti-carcinogenic, antimicrobial, antidiabatic and larvicidal properties (Panche et al., 2016). The antioxidant activity is both the individual and joint effect of the metabolites in the plant sample. Our study reveals that the antioxidant activities of the ethanol extracts correlate with the number of peaks or phytochemicals. In the present study, the cytotoxic effect of the studied extract could be due to the identified phytochemicals in the extract, particularly flavonoids. Phenolic acids, for both solvents of extraction, is the highest annotated class of compound. According to the report by Saibabu et al. (2015), phenolic compounds help in disease prevention and therapy through cell growth promotion using their antioxidants and anti-inflammatory properties (Saibabu et al., 2015), which is contrary to the activity of flavonoids, particularly against cancerous cells. This implies that flavonoids do not promote cell proliferation, unlike phenolic acids. Other classes of compounds with health benefits such as coumarins and related compounds were also annotated in the ethanolic extract of M. communis ‘Variegatha’. These compounds have become relevant in recent years due to their various biological activities. Coumarins and related compounds in their natural or synthetic forms have been reported to be used as antibiotics (Musicki et al., 2000), anti-inflammatory and antinociceptive (Tosun et al., 2009), photochemotherapy and anti-HIV therapy (Bartnik and Facey, 2017), cancer and antioxidant (Akkol et al., 2020).
4 Conclusion
The present study was the first to investigate the in vitro antidiabetic potential of a 70 % ethanolic extract of M. communis “Variegatha”. Identification of the phytochemical compounds in the plant extract revealed that it comprises of phenolic acids, flavanols, and flavonols and the crude extract demonstrated a strong inhibitory effect on α-glucosidase, which was more effective as compared to epigallocatechin gallate (EGCG), a positive control antidiabetic drug and this indicates that the plant could be used to ameliorate postprandial hyperglycaemia. Furthermore, the highest glucose utilization was attained at 25 μg/mL while at higher concentrations a slight decrease in glucose utilization was recorded. Furthermore, it was found that the glucose uptake effect decreases with an increase in the extract concentration. The biological effects exhibited by the plant extract is due to the identified phytochemical compounds as previously document, which indicates it as a promising source for the isolation of lead compounds that could be used for the development of new antidiabetic agents. Taking this into consideration, further studies such as in silico molecular docking of the identified compounds with carbohydrates digestive enzymes as well as in vivo studies are encouraged. Additionally, targeted isolation of bioactive compounds responsible for these biological activities is of much significance in studying the biological activities of this plant. Thus, the present findings would be useful for future research directions on the application of traditional medicinal plants in the development of nutraceuticals and pharmaceuticals.
Funding
This research was funded by Cape Peninsula University of Technology, Grant No CPUT-RJ23 granted to OO Oguntibeju and The APC was funded by Cape Peninsula University of Technology.
Acknowledgments
The authors duly acknowledgement Cape Peninsula University of Technology, South Africa for their financial support.
Declaration of Competing Interest
The authors declare that they have no known competing financial interests or personal relationships that could have appeared to influence the work reported in this paper.
References
- Coumarins and Coumarin-related compounds in pharmacotherapy of cancer. Cancers (Basel). 2020;12:1-25.
- [Google Scholar]
- Aladejana, A.E., Bradley, G. and Afolayan, A.J., 2020. In vitro evaluation of the anti-diabetic potential of Helichrysum petiolare Hilliard & BL Burtt using HepG2 (C3A) and L6 cell lines. F1000Research, 9
- Review of pharmacological effects of Myrtus communis L. and its active constituents. Phytother. Res.. 2014;28:1125-1136.
- [Google Scholar]
- Total phenolic content, flavonoid content and antioxidant potential of wild vegetables from Western Nepal. Plants. 2019;8(4):96.
- [Google Scholar]
- Potential health benefits of phenolic compounds in grape processing by-products. Food Sci. Biotechnol.. 2019;28(6):1607-1615.
- [Google Scholar]
- A review on the extraction methods uses in medicinal plants, principle, strength and limitation. Med. Aromat. Plants.. 2015;4:3-8.
- [Google Scholar]
- Phytochemical screening and evaluation of in vitro antioxidant and antimicrobial activities of the indigenous medicinal plant Albizia odoratissima. Pharm. Biol.. 2017;55(1):1155-1161.
- [Google Scholar]
- Non-enzymatic antioxidant capacity assays: Limitations of use in biomedicine. Free Radic. Res.. 2010;201044:711-720.
- [Google Scholar]
- The ferric reducing ability of plasma (FRAP) as a measure of antioxidant power: the FRAP assay. Anal. Biochem.. 1996;239(1):70-76.
- [Google Scholar]
- In vitro evaluation of the α-glucosidase inhibitory potential of methanolic extracts of traditionally used antidiabetic plants. BMC Complement. Altern. Med.. 2019;19(1):1-9.
- [Google Scholar]
- An in vitro assessment of the potential antidiabetic activity and cytotoxic effects of ethanolic and aqueous extracts from three invasive Australian acacias. S. Afr. J. Bot.. 2021;141:1-11.
- [Google Scholar]
- Myrtus communis improves cognitive impairment in renovascular hypertensive rats. J. Physiol. Pharmacol.. 2020;71(5)
- [Google Scholar]
- An update on natural compounds in the remedy of diabetes mellitus: A systematic review. J. Tradit. Complement. Med.. 2018;8(3):361-376.
- [Google Scholar]
- Profiling and characterization by LC–MSn of the galloylquinic acids of green tea, tara tannin, and tannic acid. J. Agric. Food Chem.. 2007;55:2797-2807.
- [Google Scholar]
- In vitro α-glucosidase inhibitory activity of Tamarix nilotica shoot extracts and fractions. Plos one. 2022;17(3):e0264969.
- [Google Scholar]
- In vitro glucose binding activity of Terminalia bellirica. Asian J. Pharm. Clin. Res.. 2015;8(2):320-323.
- [Google Scholar]
- The genetic landscape of diabetes [Internet]. Bethesda: National Center for Biotechnology Information (US); 2004.
- A new colourimetric assay for flavanoids in Pilsner beers. J. Insi. Brew.. 1985;91:37-40.
- [Google Scholar]
- Antioxidant activity of the aqueous extract of harn jyur (Chrysanthemum morifolium Ramat) Lebensm. Wiss Technol.. 1999;32:269-277.
- [Google Scholar]
- Ameliorative potential of ginger (Z. officinale roscoe) on relative organ weight in Streptozotocin induced diabetic rats. Int. J. Biomed. Sci.. 2013;9(2):82-90.
- [Google Scholar]
- α-Glucosidase inhibitors from Brickellia cavanillesii. J. Nat. Prod.. 2012;75(5):968-974.
- [Google Scholar]
- Phenolic profile of grape canes: novel compounds identified by LC-ESI-LTQ-Orbitrap-MS. Molecules. 2019;24:3763.
- [Google Scholar]
- A knowledge base for the recovery of natural phenols with different solvents. Int. J. Food Prop.. 2013;16(2):382-396.
- [Google Scholar]
- Green tea flavonols inhibit glucosidase II. Biochem. Pharmacol.. 2006;72(5):640-646.
- [Google Scholar]
- Comparative chemical composition and antibacterial activities of Myrtus communis L. essential oils isolated from Tunisian and Algerian population. J. Plant Pathol. Microbiol.. 2013;4:133-137.
- [Google Scholar]
- Free Radicals in Biology & Medicine (5th ed.). Oxford University Press; 2015. p. :961.
- Flavonoids from Tetracera indica Merr. induce adipogenesis and exert glucose uptake activities in 3T3-L1 adipocyte cells. BMC Complement, Altern. Med.. 2017;17(1):1-14.
- [Google Scholar]
- Health benefits and phenolic compounds of Moringa oleifera leaves: a comprehensive review. Phytomedicine. 2021;93:153771
- [Google Scholar]
- In vitro antioxidant and antigenotoxic potentials of myricetin-3-O-galactoside and myricetin-3-O-rhamnoside from Myrtus communis: Modulation of expression of genes involved in cell defence system using cDNA microarray. Toxicol. In Vitro. 2008;22:567-581.
- [Google Scholar]
- α-Glucosidase inhibitory and antihyperglycemic effects of polyphenols in the fruit of Viburnum dilatatum Thunb. Agric. Food Chem.. 2006;54:4588-4592.
- [Google Scholar]
- Jacob, B. and Narendhirakannan, R.T. 2019. Role of medicinal plants in the management of diabetes mellitus: a review. 3 Biotech 9(1), 1-17
- Antioxidant and phytochemical activities of Amaranthus caudatus L. harvested from different soils at various growth stages. Scient. Rep.. 2019;9(1):1-14.
- [Google Scholar]
- Improved antibacterial activities of coumarin antibiotics bearing 5′,5′-dialkylnoviose: biological activity of RU79115. Bioorg. Med. Chem. Lett.. 2000;10:1695-1699.
- [Google Scholar]
- Identification and characterization of phenolic compounds in hydromethanolic extracts of sorghum wholegrains by LC-ESI-MSn. Food Chem.. 2016;211:215-226.
- [Google Scholar]
- Significance of antioxidant potential of plants and its relevance to therapeutic applications. Int. J. Biol. Sci.. 2015;11(8):982-991.
- [Google Scholar]
- UHPLC-ESI- QTOF-MS/MS characterisation of phenolic compounds from Tithonia diversifolia (Hemsl.) A. gray and antioxidant activity. Chem. Select. 2022;7:e202104406.
- [Google Scholar]
- Identification of polyphenolic compounds in the flesh of Argan (Morocco) fruits. Food Chem.. 2015;179:191-198.
- [Google Scholar]
- Evaluation of in vitro and in vivo anti-diabetic, anti-hyperlipidemic and antioxidant activity of flower crude extract and solvent fractions of hagenia abyssinica (rosaceae) J. Exp. Pharmacol.. 2020;12:151.
- [Google Scholar]
- Glucose-stimulated insulin secretion: a newer perspective. J. Diabetes Investig.. 2013;4:511-516.
- [Google Scholar]
- The role of medicinal plants in the treatment of diabetes: a systematic review. Electron Phys.. 2016;8(1):1832-1842.
- [Google Scholar]
- Antioxidant activities of Indigofera cassioides Rottl. Ex. DC. using various in vitro assay models. Asian Pac. J. Trop. Biomed.. 2012;2(4):256-261.
- [Google Scholar]
- Evaluation of cockerel spermatozoa viability and motility by a novel enzyme based cell viability assay. Br. Poult. Sci.. 2019;60(4):467-471.
- [Google Scholar]
- Exemplified screening standardization of potent antioxidant nutraceuticals by principles of design of experiments. J. Funct. Food.. 2015;17(260–270):37.
- [Google Scholar]
- Characterization of active phenolic components in the ethanolic extract of Ananas comosus L. leaves using high-performance liquid chromatography with diode array detection and tandem mass spectrometry. J. Chromatogr. A. 2007;1165(1–2):39-44.
- [Google Scholar]
- Determination and involvement of aqueous reducing compounds in oxidative systems of various senescing leaves. J. Agric Food Chem.. 1995;43:1813-1817.
- [Google Scholar]
- GC-MS analysis of Myrtus communis extract and its antibacterial activity against Gram-positive bacteria. BMC Complement. Altern. Med.. 2020;20(1):1-9.
- [Google Scholar]
- Scientific validation of the medicinal efficacy of Tinospora cordiofolia. Scient. World J. 2013
- [Google Scholar]
- Antioxidant, antidiabetic and hypolipidemic effects of Tulbaghia violacea Harv. (Wild Garlic) Rhizome methanol extract in a diabetic rat model. BMC Complement. Altern. Med.. 2015;15:408.
- [Google Scholar]
- Effect of extraction solvent on the phenolic compounds content and antioxidant activity of Ramon nut (Brosimum alicastrum) Chem. Pap.. 2019;73(7):1647-1657.
- [Google Scholar]
- Moriasi, G., Ireri, A., Ngugi, M.P. 2020. In vitro antioxidant activities of the aqueous and methanolic stem bark extracts of Piliostigma thonningii (Schum.). Journal of evidence-based integrative medicine, 25, p.2515690X20937988.
- Effect of green tea and green tea rich with catechin on blood glucose levels, serum lipid profile and liver and kidney functions in diabetic rats. Biological. 2014;7:7-12.
- [Google Scholar]
- In vitro and in vivo antidiabetic properties of phenolic antioxidants from Sedum adenotrichum. Front. Nutr.. 2019;6:177.
- [Google Scholar]
- Bioactivity and analysis of biophenols recovered from olive mill waste. J. Agric. Food Chem.. 2005;53(4):823-837.
- [Google Scholar]
- In vitro antidiabetic activity affecting glucose uptake in hepg2 cells following their exposure to extracts of Lauridia tetragona (Lf) RH Archer. Processes. 2019;8(1):33.
- [Google Scholar]
- In-vitro anti-diabetic and antioxidant efficacy of methanolic extract of encephalartos ferox leaves. Pharmacogn. Mag.. 2019;11(3)
- [Google Scholar]
- Phenolic content, antioxidant, cytotoxic and antiproliferative effects of fractions of Vigna subterraenea (L.) verdc from Mpumalanga, South Africa. Heliyon. 2021;7(11):e08397.
- [Google Scholar]
- In vitro antioxidant extracts evaluation from the residue of the Hevea brasiliensis seed. Sci. Reports. 2022;12(1):1-14.
- [Google Scholar]
- Characterization of acylated flavonoid-O-glycosides and methoxylated flavonoids from Tagetes maxima by liquid chromatography coupled to electrospray ionization tandem mass spectrometry. Rapid Communications in Mass Spectrometry. 2004;18(23):2801-2810.
- [Google Scholar]
- Phenolic content, antioxidant and physico-chemical properties of Sardinian monofloral honeys. Int. J. Food Sci.. 2015;50(2):482-491.
- [Google Scholar]
- Variability of chemical composition and antioxidant activity of essential oils between Myrtus communis var. Leucocarpa DC and var. Melanocarpa DC. Food Chem.. 2016;197:124-131.
- [Google Scholar]
- Comprehensive in vitro antidiabetic screening of Aspalathus linearis using a target-directed screening platform and cellomics. Food Funct.. 2021;12(3):1020-1038.
- [Google Scholar]
- Estimation of phytochemical content and antioxidant activity of some selected traditional Indian medicinal plants. Indian J. Pharm. Sci.. 2011;73(2):146.
- [Google Scholar]
- Study on antioxidant and hypolipidemic effects of polyphenol rich extract from Thymus vulgaris and Lavendula multifida. Pharmacogn. Res.. 2009;1:106-112.
- [Google Scholar]
- Antioxidant activity applying an improved ABTS radical cation decolourization assay. Free Radic. Biol. Med.. 1999;26:1231-1237.
- [Google Scholar]
- 2018. BioMed Res Inter: In vitro antidiabetic effects and antioxidant potential of Cassia nemophila pods; 2018.
- Structural studies of the intestinal α-Glucosidases, Maltase-glucoamylase and Sucrase-isomaltase. JPGN. 2018;66:S11-S13.
- [Google Scholar]
- Spectrophotometric assays for total antioxidant capacity (TAC) in dog serum: an update. BMC Veter. Res.. 2016;12(1):1-7.
- [Google Scholar]
- 2015. Sci: Therapeutic potential of dietary phenolic acids. Adv. Pharmacol; 2015.
- Action of phytochemicals on insulin signaling pathways accelerating glucose transporter (GLUT4) protein translocation. Molecules. 2018;23(2):258.
- [Google Scholar]
- Essential leaf oil variability in green, variegated and albino foliage of Myrtus communis. Phytochemistry. 1973;12:153-155.
- [Google Scholar]
- Evaluation of antioxidant, antidiabetic and antiobesity potential of selected traditional medicinal plants. Front. Nutr.. 2019;6:53.
- [Google Scholar]
- Phenolic compounds, volatiles and antioxidant capacity of white myrtle berry liqueurs. Plant Foods Hum. Nutr.. 2017;72:205-210.
- [Google Scholar]
- Optimization of extraction parameters for antioxidant and total phenolic content of Ficus carica L. Latex from white genoa cultivar. Asian J. Chem.. 2019;31:1859-1865.
- [Google Scholar]
- In vitro antioxidant activity of Ficus carica L. latex from 18 different cultivars. Sci. Rep.. 2020;10(1):1-14.
- [Google Scholar]
- Acylated flavonol glycosides from Tagetes minuta with antibacterial activity. Front. Pharmacol.. 2015;6:195.
- [Google Scholar]
- Lifestyle, oxidative stress, and antioxidants: back and forth in the pathophysiology of chronic diseases. Front. Physiol.. 2020;11:694.
- [Google Scholar]
- Antioxidant constituents in the dayflower (Commelina communis L.) and their α-glucosidase-inhibitory activity. J. Nat. Med.. 2008;62(3):349-353.
- [Google Scholar]
- Evaluation of antiamnesic effect of extracts of selected Ocimum species using invitro and in-vivo models. J. Ethnopharmacol.. 2016;193:490-499.
- [Google Scholar]
- Analysis of total phenols and other oxidation substrates and antioxidants by means of Folin-Ciocalteau reagent. Methods Enzymol.. 1999;299:152-178.
- [Google Scholar]
- Analysis of phenolic compounds in Rooibos Tea (Aspalathus linearis) with a comparison of flavonoid- based compounds in natural populations of plants from different regions. J. Agric. Food Chem.. 2017;2017(65):10270-10281.
- [Google Scholar]
- In vitro antidiabetic potentials, antioxidant activities and phytochemical profile of african black pepper (Piper guineense) Clin. Phytosci.. 2020;6(1):1-13.
- [Google Scholar]
- Comparison of in vitro antioxidant properties of extracts from three plants used for medical purpose in Cameroon: Acalypharacemosa, Garcinia lucida and Hymenocardia lyrate. Asian Pac. J. Trop. Biomed.. 2014;4(2):S625-S632.
- [Google Scholar]
- UPLC–QTOF/MS for a rapid characterisation of phenolic compounds from leaves of Myrtus communis L. Phytochem. Anal.. 2014;25:89-96.
- [Google Scholar]
- Tas, S., Tas, B., Bassalat, N. and Jaradat, N., 2018. In-vivo, hypoglycemic, hypolipidemic and oxidative stress inhibitory activities of Myrtus communis L. fruits hydroalcoholic extract in normoglycemic and streptozotocin-induced diabetic rats. Biomed. Res. (0970-938X), 29(13).
- Rat intestinal sucrase inhibition of constituents from the roots of Rosa rugosa Thunb. Bioorg. Med. Chem. Lett.. 2014;24(4):1192-1196.
- [Google Scholar]
- Phenolic compounds of mango (Mangifera indica) by-products: Antioxidant and antimicrobial potential, use in disease prevention and food industry, methods of extraction and microencapsulation. Scientia Agropecuaria. 2021;12(2):283-293.
- [Google Scholar]
- Anti-inflammatory and antinociceptive activity of coumarins from Seseli gummiferum subsp. corymbosum (Apiaceae) Zeitschrift fur Naturforsch. – Sect. C J. Biosci.. 2009;64:56-62.
- [Google Scholar]
- Composition and anti-inflammatory effect of the common Myrtle’s (Myrtus communis L.) essential oil growing wild in Algeria. Phytotherapie. 2020;18(3–4):156-161.
- [Google Scholar]
- Determination of glucose in blood using glucose oxidase with an alternative oxygen acceptor. Ann. Clin. Biochem.: Int. J. Biochem. Lab. Med.. 1969;6:24-27.
- [Google Scholar]
- Characterization of flavonoid subgroups and hydroxy substitution by HPLC-MS/MS. Molecules. 2007;12:593-606.
- [Google Scholar]
- Natural products as alpha-amylase and alpha-glucosidase inhibitors and their hypoglycaemic potential in the treatment of diabetes: an update. Mini Rev. Med. Chem.. 2010;4:315-331.
- [Google Scholar]
- A study of some variables in a tetrazolium dye (MTT) based assay for cell growth and chemosensitivity. Br. J. Cancer. 1987;56(3):279-285.
- [Google Scholar]
- Diabetes mellitus and its complications. India Nat. Rev. Endocrinol.. 2016;12:357-370.
- [Google Scholar]
- Evaluation of free radical scavenging activity of various leaf extracts from Kedrostis foetidissima. Biochem. Anal.. 2014;10:2161-11009.
- [Google Scholar]
- Antidiabetic screening and scoring of 11 plants traditionally used in South Africa. J. Ethnopharmacol.. 2008;119(1):81-86.
- [Google Scholar]
- α-Glucosidase inhibitory constituents from stem bark of Terminalia superba (Combretaceae) Phytochemistry. 2007;68(15):2096-2100.
- [Google Scholar]
- Phloroglucinol derivatives from Myrtus Communis ‘Variegata’ and their antibacterial activities. Chem. Biodivers.. 2020;17(8):e2000292.
- [Google Scholar]
- A practical strategy for the characterization of coumarins in Radix Glehniae by liquid chromatography coupled with triple quadrupole-linear ion trap mass spectrometry. J. Chromatogr. A. 2010;1217:4587-4600.
- [Google Scholar]
- Phytochemicals, antioxidant and anti-proliferative activities of Myrtus communis L. genotypes from Tunisia. S. Afr. J. Bot.. 2021;137:35-45.
- [Google Scholar]
- Yermakov, A.I., Arasimov, V.V., Yarosh, N.P. Agropromizdat; Leningrad: 1987. Methods of Biochemical Analysis of Plants.
- Anti-diabetic activities of phenolic compounds in muscadine against alpha-glucosidase and pancreatic lipase. LWT-Food Sci. Technol.. 2012;46(1):164-168.
- [Google Scholar]
- Effect of eriodictyol on glucose uptake and insulin resistance in vitro. J. Agric. Food Chem.. 2012;60:7652-7658.
- [Google Scholar]
- Extraction, purification and in vitro antioxidant activity evaluation of phenolic compounds in California Olive Pomace. Foods. 2022;11(2):174.
- [Google Scholar]
- α-Glucosidase inhibitory constituents from Toona sinensis. Chem. Nat. Compd.. 2009;45(2):244-246.
- [Google Scholar]
Appendix A
Supplementary material
Supplementary data to this article can be found online at https://doi.org/10.1016/j.arabjc.2022.104447.
Appendix A
Supplementary material
The following are the Supplementary data to this article:Supplementary data 1
Supplementary data 1


