

Translate this page into:
Bioanalytical method validation, biopharmaceutical and pharmacokinetic evaluation of GSK-650394, a serum- and glucocorticoid-regulated kinase 1 inhibitor
⁎Corresponding author. hjmaeng@gachon.ac.kr (Han-Joo Maeng)
-
Received: ,
Accepted: ,
This article was originally published by Elsevier and was migrated to Scientific Scholar after the change of Publisher.
Abstract
GSK-650394 is an inhibitor of serum- and glucocorticoid-regulated kinase 1 that displays potency for treating cancer, hypertension, cardiovascular and neuronal diseases, such as Parkinson’s disease. However, the biopharmaceutical properties and pharmacokinetics of GSK-650394 have not been studied extensively. Also, there are currently no bioanalytical assays available for this new drug candidate. In this study, we developed a simple and sensitive liquid chromatography-tandem mass spectrometry method to quantify GSK-650394 in rat plasma and validated its selectivity, linearity, accuracy and precision, sensitivity, matrix effects, extraction recovery, and stability, following the United States Food and Drug Administration guidelines. In vitro studies showed the biopharmaceutical properties of GSK-650394, including its low solubility in water and simulated gastrointestinal fluids, passive transport in Caco-2 cell monolayers, high plasma protein binding, and primary metabolism by glucuronide conjugation in the small intestine and liver of rats. Following intravenous administration (2 mg/kg) to rats, GSK-650394 exhibited low total clearance (11.18 ± 1.28 mL/min/kg) and volume of distribution at steady-state (346.1 ± 120.6 mL/kg). Following oral administration (2, 5, and 10 mg/kg) to rats, GSK-650394 underwent enterohepatic circulation, with low bioavailability (∼9%). The insignificant difference in bioavailability among three oral doses suggests that GSK-650394 may follow linear pharmacokinetics up to an oral dose of 10 mg/kg. In addition, the total form of parent drug and glucuronide conjugate in rat plasma from three oral doses showed a much higher value of area under the plasma concentration versus time curve than the parent drug, indicating that the primary metabolism process of GSK-650394 was glucuronidation. Our findings suggest that the low oral bioavailability of GSK-650394 is associated with its low solubility, instability under acidic gastric conditions, and extensive glucuronidation metabolism.
Keywords
LC-MS/MS
Validation
GSK-650394
SGK1 inhibitor
Pharmacokinetics

- SGK1
-
Serum- and glucocorticoid-regulated kinase 1
- LC-MS/MS
-
Liquid chromatography-tandem mass spectrometry
- LLOQ
-
Lower limit of quantification
- QC
-
Quality control
- LQC
-
Low QC
- MQC
-
Middle QC
- HQC
-
High QC
- UHQC
-
Ultra-high QC
- ESI
-
Electrospray ionization
- RE
-
Relative error
- CV
-
coefficient of variation
- RSD
-
Relative standard deviation
- MRM
-
Multiple reaction monitoring
- IS
-
Internal standard
- AUC
-
Area under the plasma concentration versus time curve
- HPLC
-
high-performance liquid chromatography
- NADPH
-
nicotinamide adenine dinucleotide phosphate
- UDPGA
-
uridine diphosphate glucuronic acid
- UHPLC
-
ultra-high-performance liquid chromatography
- RLMs
-
Rat liver microsomes
- HLMs
-
human liver microsomes
Abbreviations
1 Introduction
Serum- and glucocorticoid-inducible kinase-1 (SGK1) is a serine/threonine kinase that belongs to the acylglycerol kinase family (Dattilo et al., 2020). It is upregulated by serum and glucocorticoids in rat mammary tumor cells or by cell shrinkage in humans (Firestone et al., 2003, Lang et al., 2009). SGK1 has been revealed to play a crucial role in the hormonal regulation of several carriers, pumps, ion channels, and transcription factors or regulators, such as stimulation of Na+-glucose co-transporter SGLT1 to increase glucocorticoid-induced intestinal glucose uptake (Dieter et al., 2004), enhancement of cellular glucose uptake from the circulation into the liver, skeletal muscle, and fat tissue (Boini et al., 2006), and activation of renal Na+ retention to increase blood pressure in animal models with a high-fructose diet or a high-fat diet pretreatment (Huang et al., 2006a, Huang et al., 2006b). Thus, SGK1 is a potential target for the treatment of various cancers. It is highly expressed in lung fibrosis (Waerntges et al., 2002), prostate cancer, colorectal carcinoma, glioblastoma, breast cancer, and endometrial cancer (Sang et al., 2021, Zhu et al., 2020). SGK1 acts as an essential Akt-independent mediator of the phosphatidylinositol 3-kinase/mammalian target of the rapamycin signaling pathway in cancer (Sang et al., 2021, Zhu et al., 2020). It also mediates the glucocorticoid-induced resistance of breast cancer cells to chemotherapy and involves the glucocorticoid- or colony-stimulating factor 1 pathway, which enhances the invasiveness, motility, and adhesiveness of breast cancer cells (Tangir et al., 2004, Wu et al., 2004). In addition, it has been reported that SGK1 is related to asphyxia cardiac arrest-induced brain injury and neurological deficits (Lee et al., 2020), schizophrenia, Alzheimer’s disease, and depression (Lang et al., 2004, Michalski and Fahnestock, 2003, Schniepp et al., 2004, Tsai, 2004, Weickert et al., 2003). Collectively, the inhibition of SGK1 results in favorable effects in Parkinson’s disease (Kwon et al., 2021), prostate cancer (Sherk et al., 2008), bone metastasis diseases (Zhang et al., 2020), diabetes, and other metabolic disorders (Li et al., 2016).
GSK-650394 [2-cyclopentyl-4-(5-phenyl-1H-pyrrolo[2,3-b]pyridin-3-yl)benzoic acid] was first synthesized by GlaxoSmithKline, as an inhibitor of serum- and glucocorticoid-regulated kinases. It inhibits SGK1 and SGK2 with IC50 values of 62 and 103 nM, respectively (Sherk et al., 2008). GSK-650394-mediated inhibition of SGK1 exhibits significant antitumor effects against human prostate cancer (PCa) cell lines, by inducing autophagy-dependent apoptosis via the mammalian target of the rapamycin-Foxo3a pathway (Liu et al., 2017). In non-small cell lung cancer, GSK-650394 enhances cellular immune response and promotes tumor cell apoptosis (Tang et al., 2018). Inhibition of SGK1 by GSK-650394 provides neuroprotection against cardiopulmonary arrest-induced hypoperfusion, neuroinflammation, neuronal cell death, and learning or memory deficits (Lee et al., 2020), and reduces infarct size in early cerebral ischemia–reperfusion, with decreased blood–brain barrier disruption (Chi et al., 2021). GSK-650394 is a potential candidate for treating Parkinson’s disease and other neurodegenerative disorders that involve the common pathology of glia-mediated neuroinflammation (Kwon et al., 2021). Recently, GSK-650394 was identified as an in vitro inhibitor of SARS-CoV-2 RNA-dependent RNA polymerase activity (Bertolin et al., 2021, Diffley, 2021). GSK-650394 has become a potential new drug candidate for the treatment of complicated pathologies, and as a result, various preclinical studies on GSK-650394 have been conducted to date (Alamares-Sapuay Judith et al., 2013, Andrukhova et al., 2012, Peng et al., 2013, Xiao et al., 2019, Yang et al., 2022, Zhang et al., 2018, Zhu et al., 2021, Zhu et al., 2022). However, no quantitative assay has been reported for determining GSK-650394 in biological samples such as plasma. Other SGK inhibitors, such as EMD638683 and SI113 have been investigated; however, no quantitative assays and pharmacokinetics data are available so far (Marano et al., 2016). Therefore, there is a need for the development and validation of a bioanalytical method for GSK-650394 determination in plasma. In addition, the biopharmaceutical properties and in vivo pharmacokinetic profiles of GSK-650394 have not been reported or evaluated in detail. Thus, the present study aimed to develop and validate a bioanalytical method for the determination of GSK-650394 in rat plasma using liquid chromatography-tandem mass spectrometry (LC-MS/MS), and extensively investigate its in vitro biopharmaceutical properties as well as intravenous (IV) or oral pharmacokinetics in rats.
2 Materials and methods
2.1 Materials and reagents
GSK-650394 (>98 % purity) was purchased from Adooq Biosciences (Irvine, CA, USA). Ondansetron (hydrochloride dihydrate form) obtained from Cadila pharmaceuticals (Ahmedabad, India) was used as the internal standard (IS). High-performance liquid chromatography-grade water, acetonitrile, and methanol were obtained from Honeywell Burdick and Jackson Co. (Ulsan, Korea). Formic acid was purchased from Sigma-Aldrich (St. Louis, MO, USA). All other chemicals and reagents used were of analytical grade.
2.2 Bioanalytical method validation
2.2.1 Preparation of standards and quality control (QC) samples
Working standard solutions of GSK-650394 (1–10,000 ng/mL) were prepared through the serial dilution of the GSK-650394 stock solution [1 mg/mL in dimethyl sulfoxide (DMSO)] with methanol. The stock solution of IS was prepared in methanol (1 mg/mL). Calibration standards in rat plasma were prepared by spiking 10 µL of each working standard solution to 90 µL of blank rat plasma, to obtain final GSK-650394 concentrations of 0.1, 0.5, 1, 5, 10, 20, 100, 200, and 1000 ng/mL. QC samples were prepared in rat plasma at lower limit of quantitation (LLOQ, 0.1 ng/mL), low QC (LQC, 0.3 ng/mL), middle QC 1 (MQC1, 40 ng/mL), middle QC 2 (MQC2, 400 ng/mL), and high QC (HQC, 800 ng/mL). For GSK-650394 extraction, 200 µL of IS solution (50 ng/mL in methanol) was added to 100 µL of the standard or QC samples. After vortexing for 1 min, the mixture was centrifuged (14,000 rpm, 4 °C, 15 min), and the supernatant was collected for LC-MS/MS analysis.
2.2.2 LC-MS/MS instrumentation and chromatographic conditions
A 5500 Triple Quad™ mass spectrometer (Applied Biosystems-SCIEX, Concord, ON, Canada) coupled with an Agilent LC 1200 binary pump system (Agilent Technologies, Santa Clara, CA, USA) and a CTC analytics autosampler (CTC Analytics AG, Zwingen, Switzerland) was used for sample analysis. A Synergi™ 4 µm Polar-RP column 80 Å (75 × 2 mm, Phenomenex, Torrance, CA, USA) connected to a SecurityGuard™ guard cartridge (4.0 × 3.0 mm, Phenomenex) was used for chromatographic elution. An isocratic elution using a mobile phase of acetonitrile and 0.1 % formic acid in water (70:30, v/v) was performed at a flow rate of 0.2 mL/min. The sample injection volume was 2.5 µL and the autosampler was maintained at 10 °C. The electrospray ionization source was operated in the positive mode. Working MS parameters including declustering potential, collision energy, and collision cell exit potential were optimized to obtain the maximum responses of GSK-650394 and the IS. The operating parameters of the LC-MS/MS system are listed in Table S1. The multiple reaction monitoring (MRM) transitions for GSK-650394 and the IS were m/z 383.1 → 314.5 and m/z 294.2 → 170.0, respectively. Mass data were acquired using Analyst 1.5.2 software and the peak areas were integrated automatically using SCIEX OS offline 1.6 software (Applied Biosystems-SCIEX).
2.2.3 Validation of bioanalytical method
The LC-MS/MS bioanalytical method for GSK-650394 was validated in terms of selectivity, linearity, accuracy and precision, dilution integrity, matrix effect, extraction recovery, and stability according to the guidelines of the United States Food and Drug Administration and the European Medicines Agency, as previously described (ICH, 2019, Nguyen et al., 2021, US-FDA, 2018). Selectivity was evaluated using blank rat plasma from six individual sources. The chromatograms for blank plasma, plasma spiked with IS (i.e., zero calibrator), plasma spiked with GSK-650394 and IS, and plasma samples from rats after oral administration of GSK-650394 were assessed for selectivity. The GSK-650394 standards in plasma (0.1–1000 ng/mL) were used to evaluate the linearity of the assay. Calibration curves were constructed by plotting the peak area ratios of GSK-650394 to the IS against the nominal standard concentration of GSK-650394. The calibration equation and correlation coefficient were determined using weighted (1/x2) least-squares linear regression analysis. During linearity runs, accuracy was calculated as the difference between the observed value and nominal value, while precision was evaluated in terms of the coefficient of variation (CV%). The acceptable criteria for accuracy and precision were set within ± 20 % for LLOQ and ± 15 % for other levels. The linearity of the assay was evaluated using correlation coefficient (R2) values, with an acceptance criterion of ≥ 0.990. The limit of detection (LOD) was calculated using the equation:
where σ is the standard deviation of the intercept of the regression line and m is the slope of the calibration curve. The LOD was also experimentally determined using a signal-to-noise ratio of ≥ 3:1. The LLOQ was defined as the lowest concentration of GSK-650394 that can be quantitatively determined with the accuracy and precision of ≤ 20 % and a signal-to-noise ratio of ≥ 10:1.
The accuracy and precision of the assay were evaluated using QC samples at five different concentrations (LLOQ, LQC, MQC1, MQC2, and HQC). To assess intra-day accuracy and precision, five replicates of QC samples were analyzed within one day. For inter-day accuracy and precision, five replicates of QC samples were analyzed on five different days. The acceptable criteria for accuracy and precision were set within ± 20 % for LLOQ and ± 15 % for other levels. In addition, the dilution integrity of the assay was assessed to identify its reliability for the quantification of samples with concentrations exceeding the upper limit (Yoon et al., 2020). Standards with a concentration of 8000 ng/mL [ultra-high QC (UHQC)] were diluted 10 times with blank rat plasma to obtain a QC sample (800 ng/mL) for the accuracy and precision tests, with the acceptable criteria within ± 15 %.
The matrix effect was assessed by evaluating three replicates of LQC, MQC1, MQC2, and HQC using six different sources of blank rat plasma, to identify the effects of endogenous components of rat plasma on the ionization of GSK-650394 and the IS. The absolute matrix effect was determined by comparing the mean peak areas of GSK-650394 spiked in the extracted blank plasma (set 1) with those of a neat solution of the compound in methanol (set 2), at equivalent concentrations. The relative matrix effect was the variability in the peak areas of the samples from set 1, which was expressed as precision (CV%). The extraction recovery was evaluated to determine the efficiency and reproducibility of the sample extraction process. The peak areas of the extracted samples (set 3) were compared with those of set 1 samples.
The stability of the stock solutions of GSK-650394 (500 ng/mL) and IS (50 ng/mL) was evaluated by comparing the peak response of a freshly prepared solution in methanol with that of the solution stored for short-term (room temperature ∼ 25 °C, 4 h) or long-term (−20 °C, 3 months). The stability of GSK-650394 in rat plasma samples was investigated under different storage conditions using QC (LQC and HQC) samples. Short-term stability was evaluated with QC samples placed under laboratory conditions (∼25 °C) for 4 h, whereas for long-term stability, QC samples were stored at − 20 °C for 3 months. For freeze–thaw stability, QC samples were frozen at − 20 °C and thawed at room temperature, over three repeated cycles. Processed QC samples were stored in an autosampler (4 °C) for 24 h and reanalyzed for post-preparative stability. Samples were considered stable with differences of ≤ 15 % in peak areas between the intensities of GSK-650394 from tested samples and those from freshly prepared samples.
2.3 In vitro biopharmaceutical studies
2.3.1 Solubility
The solubility of GSK-650394 in water, fasted state simulated gastric fluid (FaSSGF, pH 1.6), fasted state simulated intestinal fluid (FaSSIF, pH 6.5), or fed state simulated intestinal fluid (FeSSIF, pH 5.0) was investigated. The components and preparation of these simulated solutions are described in supplementary Method S1 and Table S2. An excess amount of GSK-650394 (∼1 mg) was added to a microcentrifuge tube containing 1 mL of water or simulated gastrointestinal fluid, which were then shaken (200 rpm, 25 °C, 48 h) to reach equilibrium. After centrifugation (3000 rpm, 10 min), the supernatants were filtered through a 0.2 µm membrane and the aliquot was used to determine the drug concentration. GSK-650394 analysis was performed with an ultra-high-performance liquid chromatography (UHPLC) system, which consists of a multisampler (G7167B), flexible pump (G7104A), multicolumn thermostat (MCT-G7116B), and DAD detector (G7117A). A Synergy™ 4 µm, Polar-RP column 80 Å (150 × 2.0 mm, Phenomemex) connected with a SecurityGuard™ ULTRA column guard was used for chromatographic elution. An isocratic elution using a mobile phase of acetonitrile and 0.1 % formic acid in water (70:30, v/v) was performed at a flow rate of 0.2 mL/min. The sample injection volume was 10 µL, the autosampler was maintained at 4 °C, the column temperature at 25 °C, and the detector wavelength was 294.1 nm.
2.3.2 Stability in simulated gastrointestinal fluids
The stability in simulated gastrointestinal fluids was evaluated by spiking 5 µL of GSK-650394 into 495 µL of FaSSGF, FaSSIF, or FeSSIF solution, to obtain a final concentration of 1 µM. After incubation (200 rpm, 37 °C), 50 µL of the sample was collected at 0, 30, 60, 120, and 240 min. Next, the samples were added to 100 µL methanol, vortexed, and centrifuged (14,000 rpm, 4 °C, 15 min). The supernatants were injected into the UHPLC system for GSK-650394 analysis.
2.3.3 Permeability in Caco-2 cells
The human colon epithelial cancer cell line (Caco-2) was cultured in 500 mL Dulbecco’s modified Eagle medium with high glucose and 10 % fetal bovine serum (FBS), 1 % penicillin, 1 % gentamicin, and 1 % Minimum Essential Medium with non-essential amino acids, at 37 °C, in an atmosphere with 5 % CO2 and 95 % relative humidity. Caco-2 monolayers were seeded at a density of 6 × 10⁵ cells/cm2 in 1.12 cm2 transwell plates and cultured for 3 weeks. The cells were fed with a medium containing 20 % FBS every-two days for the first week. For the following two weeks, the cells were fed daily with a medium containing 10 % FBS.
A bidirectional transport study was performed as previously described (Kang et al., 2019, Maeng et al., 2012, Son et al., 2021). Cell monolayers were washed three times with transport media (pH 7.4 Hanks’ Balanced Salt Solution containing 10 mM hydroxyethylpiperazine-N'-2-ethanesulfonic acid, 25 mM glucose, and 0.35 g of sodium bicarbonate), and then pre-incubated in transport media for 3 min, at 37 °C. Drug transport was examined by introducing 10, 20, and 100 µM GSK-650394 on the apical or basolateral sides. Doxorubicin hydrochloride (10 µM), atenolol (100 µM), and metoprolol (50 µM) were used as system control compounds. The samples were collected in a basolateral or apical chamber for apical-to-basolateral (A-to-B) and basolateral-to-apical (B-to-A) directions, respectively, at 30, 60, 90, and 120 min before UHPLC analysis. The apparent permeability coefficient (Papp, cm/s) was calculated using the following equation:
where dQ/dt (nmol/min) is the derivative of the accumulated drug amount on the receiver side and interval time, S is the surface area of the membrane of the transwell plate (cm2), and C0 is the initial drug concentration in the donor chamber (nmol/mL).
2.3.4 Plasma stability
Similar to its stability in simulated gastrointestinal fluids, the stability of GSK-650394 in rat plasma was evaluated by spiking 5 µL of GSK-650394 into 495 µL of rat plasma (Son et al., 2021). After incubation for 0, 15, 30, 60, 120, 180, and 240 min, 50 µL samples were collected and added to 100 µL of a cold IS solution, to terminate the reaction, followed by vortex-mixing and centrifugation (14,000 rpm, 4 °C, 15 min). The samples were analyzed using LC-MS/MS, following which the remaining percentage was calculated. Procaine and metformin were used as a positive and negative control, respectively.
2.3.5 Metabolism study
In this study, the phase I cytochromes P450 (CYPs) and phase II uridine diphosphate-glucuronyltransferase (UGT) metabolic reactions for GSK-650394 were investigated. In vitro phase I and II metabolism studies using rat liver microsomes (RLMs) were carried out as previously described, with slight modifications (Doan et al., 2020, Nguyen et al., 2022). Briefly, for the phase I metabolism study, a reaction mixture consisting of RLMs (0.5 mg/mL protein), 0.1 mM nicotinamide adenine dinucleotide phosphate in phosphate buffer (pH 7.4) was preincubated at 37 °C, for 5 min, with oscillation (200 rpm). To initiate the reaction, 5 µL GSK-650394 solution in methanol (100 µM) was added to the mixture to obtain a final concentration of 1 µM. At predetermined time points (0, 15, 30, 60, 120, and 240 min), 50 µL of the incubation sample was collected and mixed with 100 µL of ice-cold IS solution, followed by vortexing to terminate the enzymatic reaction. The supernatant collected after centrifugation was injected into the LC-MS/MS system to determine the remaining GSK-650394 level. Verapamil, buspirone were used as positive controls, and metformin was used as a negative control.
For the UGTs reaction, a mixture of RLMs (1 mg/mL protein), 8 mM MgCl2, alamethicin (25 µg/mL), 1 µM GSK-650394, and phosphate-buffered saline (PBS) pH 7.4 was prepared. The mixture was pre-incubated on ice for 30 min to allow the formation of alamethicin pores, followed by a second incubation (200 rpm, 37 °C, 5 min). Next, 20 µL of 20 mM uridine diphosphate glucuronic acid (UDPGA) was added to initiate the metabolism reaction. At 0, 5, 15, 30, 45, and 60 min, 50 µL of the mixture was collected and immediately added to 100 µL of ice-cold IS solution, followed by vortex-mixing to terminate the enzymatic reaction. After centrifugation, the supernatant was collected for LC-MS/MS analysis. To further study the kinetics of the GSK-650394 UGTs reaction in RLMs, different concentrations of GSK-650394 (0.2, 0.5, 1, 5, 10, 50, 100, and 200 µM) were used. The substrate (GSK-650394) concentration (µM) versus metabolic rate (or the disappearance rate of GSK-650394, nmol/min/mg protein) profiles were interpreted using Michaelis–Menten kinetics. Parameters including Vmax (the maximum metabolism velocity) and Km (the substrate concentration at which metabolism occurs at half of Vmax or the Michaelis–Menten constant) were estimated by non-linear regression analysis using Prism 8.4.2 software (GraphPad, San Diego, CA, USA). Hepatic intrinsic clearance (CLint) was calculated as Vmax/Km.
In vitro UGTs phenotyping studies were further conducted using RLMs and human liver microsomes (HLMs) (Han et al., 2021, Harper and Brassil, 2008). The reaction mixture was prepared as previously described for the UGTs reaction study. After pre-incubation for 30 min on ice, specific UGT inhibitors (Table S3) were added to the mixture, followed by a second incubation (5 min, 37 °C, 200 rpm). The reaction was initiated by the addition of 20 µL of 20 mM UDPGA. At the time points of 0 and 15 min, 50 µL of the mixture was collected. The subsequent steps were similar to those in the UGTs reaction study.
The in vitro glucuronidation metabolism in the rat tissue S9 fraction was also carried out as previously reported, with some modifications (Han et al., 2021, Jeong et al., 2019). Briefly, the small intestine, spleen, kidney, heart, brain, lung, and liver of three rats were excised and homogenized in a buffer solution containing 50 mM Tris-HCl and 1 mM ethylenediaminetetraacetic acid (pH 7.4), using a tissue homogenizer. After centrifugation (9000 × g, 4 °C, 30 min), the supernatants (tissue S9 fraction) were collected and stored at –80 °C. The metabolic reaction mixture included the tissue S9 fraction (1 mg/mL protein), 8 mM MgCl2, alamethicin (25 µg/mL), 1 µM GSK-650394, and PBS pH 7.4. The reaction and sample preparation were performed as described for the in vitro UGTs phenotyping study.
2.3.6 Protein binding study in plasma
Plasma protein binding was evaluated using the equilibrium dialysis technique, with a rapid equilibrium dialysis device, according to the manufacturer’s protocol (Pierce Biotechnology, Thermo Fisher Scientific Inc., Waltham, MA, USA) (Kim et al., 2016, Waters et al., 2008). The protein binding of warfarin and lamivudine were investigated as positive and negative controls, respectively. Briefly, 200 µL of spiked plasma sample and 400 µL of isotonic PBS as a dialysis buffer were added to the sample chamber and adjacent chamber, respectively. The device was then incubated (150 rpm, 37 °C, 4 h) to reach equilibrium, following which an aliquot (50 µL) of samples from the plasma and the adjacent chamber was collected into separate microcentrifuge tubes. For sample preparation, equal volumes of blank buffer or blank plasma were added to the plasma or buffer tubes, respectively. Next, 300 µL of IS solution in methanol (10 ng/mL of ondansetron for GSK-650394, 1 µg/mL of zidovudine for lamivudine, and 100 ng/mL of phenacetin for warfarin) was added to the mixture, followed by vortex-mixing and centrifugation, before analysis using the LC/MS-MS system. The percentage of the bound drug was calculated as follows:
2.4 In vivo pharmacokinetic studies
Male Sprague-Dawley rats (7 weeks old, 250–270 g, Orient Bio Inc., Seongnam, South Korea) were allowed free access to food and water, in a conditionally controlled vivarium, with an average temperature of 25 °C and a 12 h/12 h light/dark cycle. All rats were acclimated to the conditions for at least 1 week before the experiments. The animal study protocol was approved by the Animal Care and Use Committee of Gachon University (approval no.: GIACUC-R2021006, approved on May 13th, 2021).
In vivo rat pharmacokinetic studies were performed as reported previously (Balla et al., 2021, Doan et al., 2020, Vo et al., 2022). The rats were anesthetized with intraperitoneal injections (20 mg/kg) of Zoletil® (Vibrac, Westlake, TX, USA) and Rompun® (Bayer AG, Leverkusen, Germany). Subsequently, the rats were cannulated through the femoral artery using polyethylene tubes (Clay Adams, Parsippany, NJ, USA) for blood sampling. For IV administration, GSK-650394 (1 mg/mL) was dissolved in a vehicle mixture of DMSO:polyethylene glycol 400:distilled water (10:60:30, v/v/v). Four rats were IV administered a dose of 2 mg/kg. For oral administration, a GSK-650394 dosing solution (5 mg/mL) was prepared in a vehicle mixture of DMSO: cremophor EL:polyethylene glycol 400:distilled water (10:10:60:20, v/v/v/v). The rats were made to fast overnight and then randomly divided into three groups (n = 6), which received 2, 5, and 10 mg/kg oral doses of GSK-650394. Blood samples were collected via a rat femoral artery cannula, and equal volumes of saline were injected to compensate for fluid loss. For IV administration, the sampling times were 0 (prior to drug administration), 1, 5, 15, 30, 60, 120, 240, and 480 min. Blood samples for oral administration were collected at 0, 5, 15, 30, 60, 120, 240, 360, 480, 720, and 1440 min. The plasma collected after centrifugation of blood (14,000 rpm, 4 °C, 15 min) was stored at –20 °C until analysis. In vivo samples were also prepared as described in Section 2.2.1.
To determine the total concentration of GSK-650394 in parent drug and glucuronide conjugate form after oral administration, 20 µL of plasma was pretreated with 50 µL of 0.1 M sodium acetate buffer (pH 5.0) and 25 µL of 2000 U/mL β-glucuronidase in 0.2 % sodium chloride solution (Dashnyam et al., 2018). The reaction mixture was incubated (200 rpm, 37 °C, 1 h), and then 10 µL of this mixture was added to 10 µL of methanol and 50 µL of IS solution, followed by vortexing to terminate the reaction. After centrifugation, the supernatant was collected for LC-MS/MS analysis. Calibration standards were prepared from blank plasma using the same procedure as mentioned above, except that 10 µL of the blank reaction mixture was added to 10 µL of GSK-650394 standard stock solution (0.5–1000 ng/mL).
2.5 Pharmacokinetic and statistical analyses
The peak plasma concentration (Cmax) and time to reach Cmax (Tmax) for oral administration were directly determined from plasma concentration–time profiles. Other pharmacokinetic parameters were estimated using WinNonlin® 8.3 software (Pharsight Co., Mountain View, CA, USA). Non-compartmental pharmacokinetic analysis was used to calculate the elimination rate constant (k), elimination half-life (t1/2), area under the time curve (AUC) from zero to the last time (AUClast) and to infinity (AUCinf), total clearance (CL), and apparent distribution volume at steady state (Vss). Data are expressed as mean ± standard deviation. Unpaired Student's t-test or ANOVA was performed using Prism 8.4.2 software (GraphPad). A p-value < 0.05 was considered a statistically significant difference.
3 Results and discussion
3.1 Development and validation of the LC-MS/MS method
We developed a simple and sensitive LC-MS/MS method to quantify GSK-650394 in rat plasma. The chemical structures of GSK-650394 and ondansetron (IS) are shown in Fig. 1. GSK-650394 and ondansetron were protonated in the positive electrospray ionization mode. The protonated forms [M + H]+ at m/z 383.1 and 294.2 were selected as the precursor ions for GSK-650394 and ondansetron, respectively. The most prominent fragment ion of GSK-650394 in the produced ion spectra was at m/z 314.5, resulting from the loss of the cyclopentyl group (Fig. 1A). The MRM transition of 383.1 → 314.5 was, therefore, selected for GSK-650394. In the case of ondansetron, the product ion at m/z 212.1 was due to the loss of the C4H6N2 (2-methyl-1H-imidazole) group from m/z 294.2 (the protonated ondansetron). This product ion underwent ring expansion and loss of C2H2O (ketene), resulting in the formation of a product ion at m/z 170.0 (Talluri et al., 2015). The product ion at m/z 170.0 was the most prominent in the product ion spectra of ondansetron (Fig. 1B). Therefore, the MRM transition of m/z 294.2 → 170.0 was chosen for ondansetron, similar to that in previous studies (Duong et al., 2019, Nguyen et al., 2020). The working parameters of the LC-MS/MS system, including declustering potential, collision energy, and collision cell exit potential, were optimized for the maximum responses of GSK-650394 and IS. Typical solvents for LC-MS/MS analysis, such as acetonitrile, methanol, and formic acid in water solution, and several reverse-phase columns were tested to obtain good separation of GSK-650394 and IS, with adequate retention times. Finally, the mobile phase consisting of acetonitrile and 0.1 % formic acid in water (70:30, v/v) and a Synergi™ Polar-RP column with a 4-min isocratic mode at a flow rate of 0.2 mL/min were employed for GSK-650394 analysis. This LC condition allowed the elution of GSK-650394 and the IS at 2.45 and 2.07 min, respectively.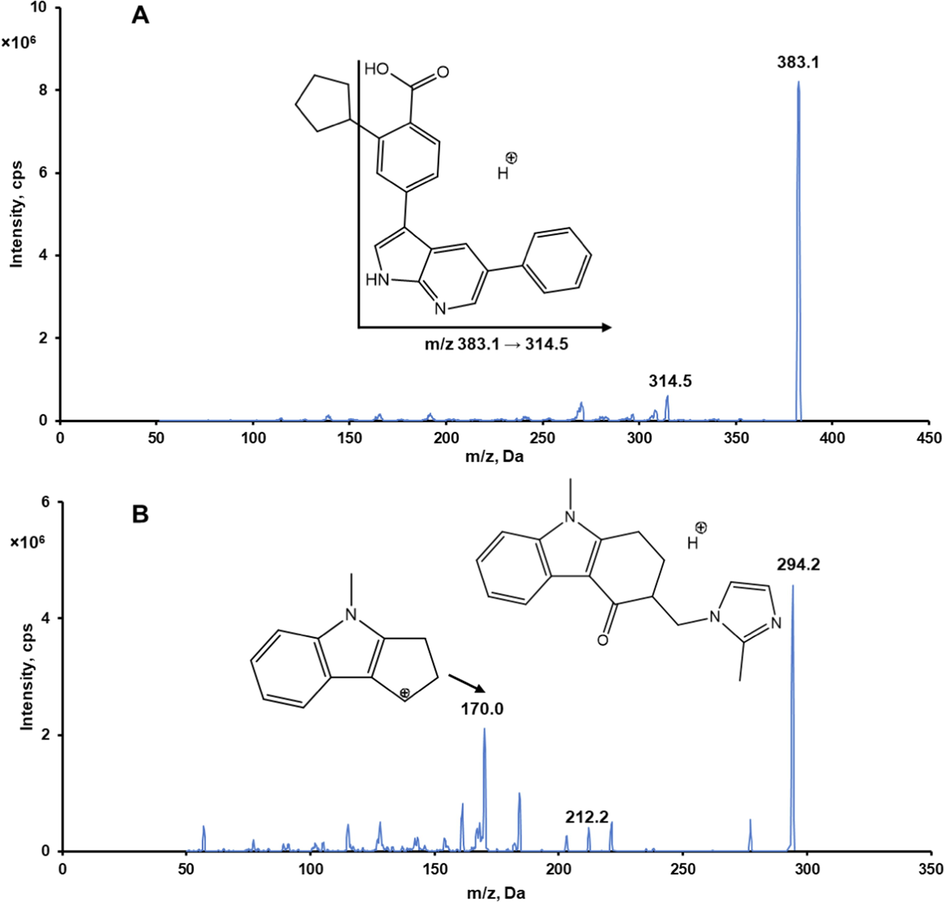
Representative product ion spectra of GSK-650394 (A) and ondansetron (B) in positive ionization mode.
The developed LC-MS/MS method was validated in terms of selectivity, linearity, accuracy and precision, sensitivity, matrix effects, extraction recovery, and stability, following the US FDA guidelines. Typical chromatograms of blank rat plasma, zero calibrators, GSK-650394 standard samples at LLOQ, and rat plasma samples from pharmacokinetic studies are shown in Fig. 2. There was no interference in the retention times of GSK-650394 or the IS in the chromatograms of blank rat plasma samples (Fig. 2A). Only IS peaks were observed for the zero calibrators (Fig. 2B). In the LLOQ samples, GSK-650394 and IS peaks were obtained with retention times of approximately 2.45 and 2.07 min, respectively (Fig. 2C and D). In addition, the rat plasma samples from pharmacokinetic studies showed negligible differences in the retention times of GSK-650394 and the IS, as compared to those of the standard rat plasma samples. Therefore, the selectivity of the developed method for GSK-650394 was considered to be adequate.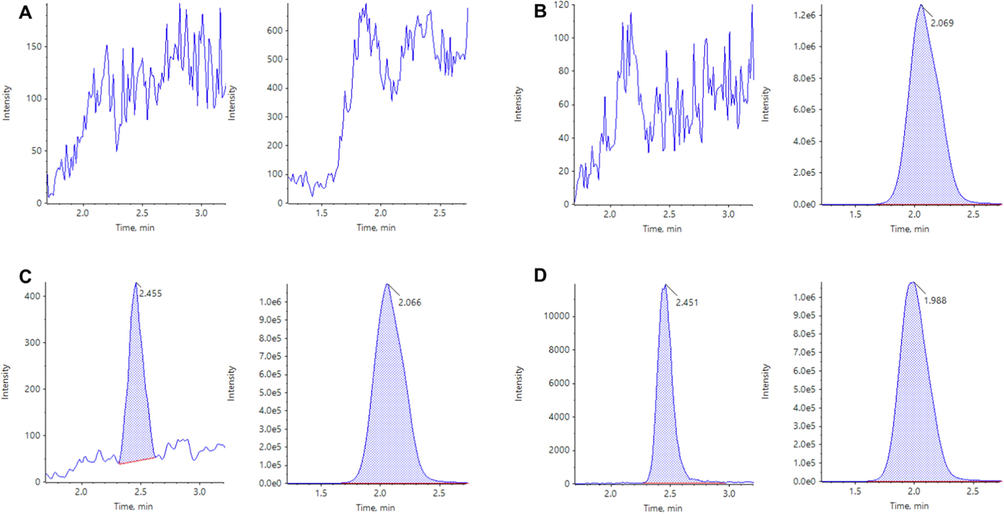
Multiple reaction monitoring LC-MS/MS chromatograms of GSK-650394 (left) and ondansetron (right) obtained by deproteinization of blank plasma (A), zero calibrator (B), LLOQ (C), and rat plasma sample at 15 min after oral administration of GSK-650394 at a dose of 2 mg/kg (D).
The calibration curves of GSK-650394 in rat plasma were linear in the concentration range of 0.1–1000 ng/mL, with the calibration equation of y = (0.0354 ± 0.00026) × + (0.00002 ± 0.00004) [R2 = 0.99862 ± 0.00071, upon weighted (1/x2) least-squares linear regression analysis], where y and × refer to peak area ratio and concentration of GSK-650394 in rat plasma, respectively. The precision was 0.89 %–12.81 %, while accuracy was 90.42 %–107.63 %. Thus, the response (GSK-650394/IS peak area ratio) was directly proportional to the rat plasma concentration ratio of GSK-650394 to IS, indicating the linearity of the LC-MS/MS assay in the range of 0.1–1000 ng/mL. The LLOQ of GSK-650394 was 0.1 ng/mL, with a signal-to-noise ratio of 30 (Fig. 2C). The LLOQ had an accuracy of 99.8 % and a precision of 1.4 %. The LOD was 0.04 ng/mL as calculated using Equation (1). A similar LOD value was obtained when using the signal-to-noise ratio criterion of 3:1 in the experimental determination.
The accuracy and precision of the method were within acceptable limits (Table 1). The intra- and inter-day accuracies ranged from 96.5 % to 106.4 % and 94.1 % to 105.0 %, respectively. The intra- and inter-day precisions were ≤ 2.0 and ≤ 5.8, respectively. Satisfactory accuracy and precision were obtained for the UHQC samples, indicating that the assay had sufficient dilution integrity and reliability to quantify GSK-650394 in samples that exceeded the upper limit.
Nominal concentration
(ng/mL)
Intra-day (n = 5)
Inter-day (n = 25)
Calculated
concentration
(ng/mL)
Precision
(CV, %)
Accuracy
(%)
Calculated
concentration
(ng/mL)
Precision
(CV, %)
Accuracy
(%)
0.1
0.1
1.4
99.8
0.1
4.7
96.5
0.3
0.29
1.7
97.6
0.29
4.6
95.9
40
40.8
1.5
102.1
39.1
5.8
97.7
400
425.5
1.8
106.4
419.9
4.5
105.0
800
801.7
2.0
100.2
769.4
4.8
96.2
800a
772.0
1.9
96.5
752.4
5.0
94.1
The extraction recovery and matrix effect were assessed at four levels (LQC, MQC1, MQC2, and HQC) for GSK-650394 and at a concentration of 50 ng/mL for the IS, using six different sources of rat plasma (Table 2). In all plasma sources, the extraction recovery ranged from 94.8 % to 108.9 % for all investigated levels of GSK-650394 and from 94.7 to 103.7 % for IS, suggesting that the simple protein precipitation method is suitable for the extraction of GSK-650394 and IS from rat plasma. The absolute matrix effect was 89.3 %–107.8 % for GSK-650394 and 90.4–93.6 % for IS in all six plasma sources. For the relative matrix effect, the precision of set 2 was comparable to that of set 1, with all values below 6.2 %. Therefore, the assay showed no notable matrix effect for GSK-650394 and the IS in rat plasma.
Concentration
(ng/mL)
Extraction recovery (%)a
Absolute matrix effect (%)b
Precision
(CV, %)
Precision
(CV, %)
GSK-650394
Set 1
Set 2
0.3
100.0–108.9
89.3–104.6
1.1–4.1
2.0
40
95.6–105.4
100.2–107.8
0.8–6.2
4.5
400
94.8–106.5
99.3–102.2
1.4–3.9
2.2
800
95.4–105.3
93.9–101.9
1.0–3.9
2.6
IS
50
94.7–103.7
90.4–93.6
1.1–3.0
3.1
The short-term and long-term stabilities of stock solution were 101.6 ± 2.3 % and 97.0 ± 1.4 % for GSK-650394 and 102.0 ± 6.6 % and 103.5 ± 0.7 % for the IS, respectively. The stability of GSK-650394 was assessed under different storage and handling conditions, at LQC and HQC (Table 3). The bias in peak intensities was<15 % for the freshly prepared samples in all cases, indicating that GSK-650394 was stable during the sample handling process and storage conditions. Collectively, the analysis method was linear in the concentration range of 0.1–1000 ng/mL, with adequate selectivity, sensitivity, accuracy and precision, extraction recovery, and matrix effects.
Storage condition
Concentration (ng/mL)
Stability (%)
Autosampler
(24 h, 4 °C)0.3
102.9 ± 0.6
800
103.4 ± 1.6
Freeze-thaw
(3 cycles, –20 °C)0.3
107.2 ± 2.1
800
97.4 ± 2.5
Short-term
(4 h, 25 °C)0.3
98.1 ± 1.3
800
100.6 ± 0.2
Long-term
(3 months, –20 °C)0.3
94.8 ± 5.0
800
99.5 ± 2.6
3.2 In vitro biopharmaceutical studies
Drug solubility and permeability are important biopharmaceutical parameters for the assessment of the extent of oral intestinal absorption. The solubility of GSK-650394 in water, FaSSGF (pH 1.6), FaSSIF (pH 6.5), and FeSSIF (pH 5.0) were found to be 83.6 ± 45.5, 151.0 ± 40.0, 1416.0 ± 16.0, and 3200 ± 27 ng/mL, respectively. Although the solubility in the simulated intestinal fluids was higher than that in the simulated gastric fluid, it was still below 0.1 mg/mL; thus, GSK-650394 is classified as a practically insoluble drug (Takagi et al., 2006). The biological stability of GSK-650394 in FaSSGF, FaSSIF, and FeSSIF is shown in Fig. 3A. Notably, GSK-650394 was remarkably unstable in the acidic gastric fluid (49.5 % remaining after 4-h incubation) but relatively stable in the neutral intestinal fluids.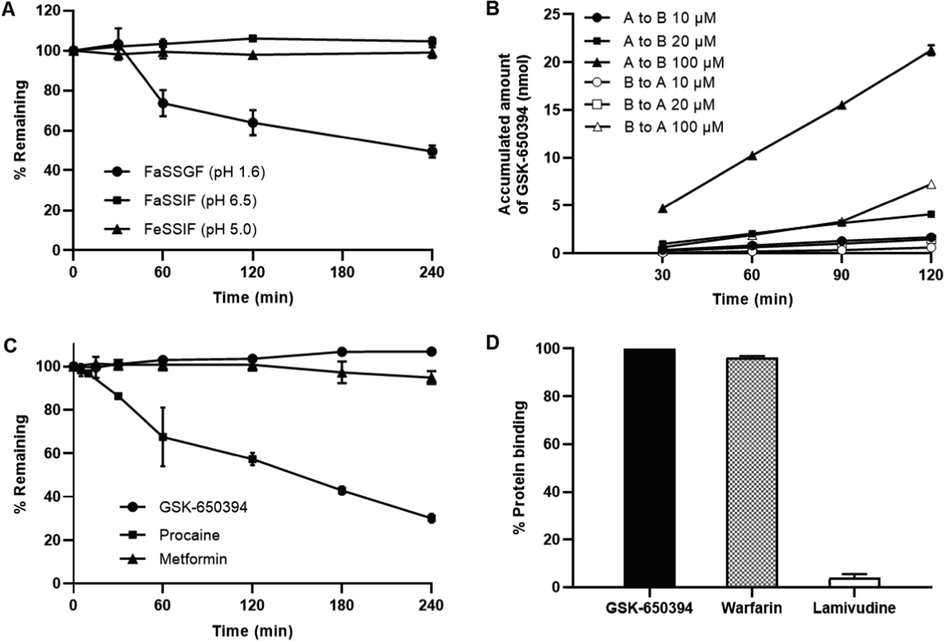
(A) Stability of GSK-650394 in simulated fluids (FaSSGF, FaSSIF, and FeSSIF). (B) The cumulative amount of GSK-650394 transported across the Caco-2 cell monolayer from the apical to basolateral or basolateral to apical direction. (C) Percentages of remaining of GSK-650394, Procaine (positive control), and Metformin (negative control) after incubation in rat blank plasma. (D) Percentage of protein binding of GSK-650394, Warfarin (positive control) and Lamivudine (negative control) in rat plasma. Data are expressed as means ± standard deviations (SDs) (n = 3).
Fig. 3B shows the cumulative amount of GSK-650394 transported across the Caco-2 cell monolayer. When the initial concentration of GSK-650394 was increased, the apparent permeability was higher but insignificant. However, the permeability from the apical to basolateral direction was much higher than that from the basolateral to apical direction. The apparent permeability coefficients of GSK-650394 and three compounds for system controls are listed in Table 4. The efflux ratio [Papp (B-to-A)/Papp (A-to-B)] value of doxorubicin, a P-glycoprotein substrate, was 5.10, which was similar to our previous reported (Kang et al., 2019). Atenolol and metoprolol are well-known low and high permeable makers for absorption direction, respectively. Our results were in agreement with previously reported data, which showed a Papp (A-to-B) value of < 2 (10–6 cm/s) for atenolol, and a Papp (A-to-B) value of > 10 (10–6 cm/s) for metoprolol, suggesting the low permeability and high permeability of these compounds, respectively (Bansal et al., 2007, Press, 2011). These data show the robustness of our Caco-2 permeability assay. For GSK-650394, the Papp (A-to-B) value were 22.15 ± 1.28, 25.71 ± 2.00, and 27.24 ± 1.12 (10–6 cm/s) at initial concentrations of 10, 20, and 100 µM, respectively, indicating high membrane permeability in the human intestinal epithelium. Uptake ratios [Papp (A-to-B)/Papp (B-to-A)] > 2 revealed that the compound permeated not only by transcellular passive diffusion but also by an active influx transporter in the gastrointestinal tract (Di and Kerns, 2016b), which may require additional studies.
Compound
Papp (A-to-B)
(10–6 cm/s)
Papp (B-to-A)
(10–6 cm/s)
Papp (A-to-B)/Papp (B-to-A)
(Uptake ratio)
GSK-650394 10 µM
22.15 ± 1.28
8.89 ± 3.27
2.49
GSK-650394 20 µM
25.71 ± 2.00
9.80 ± 1.20
2.62
GSK-650394 100 µM
27.24 ± 1.12
10.54 ± 0.13
2.58
Doxorubicin 10 µM
0.121 ± 0.004
0.610 ± 0.045
0.20
Atenolol 100 µM
1.79 ± 1.53
N.D.
N.D.
Metoprolol 50 µM
37.84 ± 0.68
N.D.
N.D.
When the metabolic stability of GSK-650394 was investigated in rat plasma, the compound was stable after 4 h of incubation at physiological temperature (Fig. 3C), indicating that GSK-650394 was not affected by the decomposition reaction of enzymes in rat plasma. The extenisive hydrolysis in plasma of procaine (positive control) and the stability of metformin (negative control) in plasma were in agreement with previous report (Brandon et al., 2021, Wanjari et al., 2008, Zhang et al., 2012). GSK-650394 also showed a high protein binding in rat plasma (>99 %) (Fig. 3D). The protein binding of lamivudine (negative control, 3.9 %) and warfarin (positive control, 96.3 %) confirmed the reliability of the study (Qu et al., 2019, Taylor et al., 2022).
In RLMs, the percentage of remaining GSK-650394 decreased gradually to 92.1 % at 1 h and 66.2 % at 4 h (Fig. 4A), indicating that it was relatively stable in the phase I reactions, such as CYPs reaction. The extensive metabolism of positive control (buspirone and verapamil), which were in agreement with data from previous reports (Aguiar et al., 2018, Siramshetty et al., 2020), and the stability of negative control (metformin) confirmed the reliability of our study. In contrast to the phase I metabolism, the phase II (UGTs) reaction study resulted in a rapid decrease in GSK-650394 after 15 min of incubation (Fig. 4B), indicating a noticeable glucuronidation reaction of GSK-650394. Based on this predominant metabolism of GSK-650394, we sequentially implemented a concentration-dependent study of the glucuronidation reaction. As shown in Fig. 4C, the disappearance rate of GSK-650394 within 15 min was concentration-dependent. The estimated values of Km, Vmax, and CLint were 89.54 ± 25.56 µM, 4.03 ± 0.55 nmol/min/mg protein, and 46.59 ± 8.93 µL/min/mg protein, respectively. These results will contribute to a better understanding of the metabolism of GSK-650394 in the phase II glucuronidation reaction and facilitate further related studies of this compound, such as metabolic mechanisms or drug-drug interaction studies.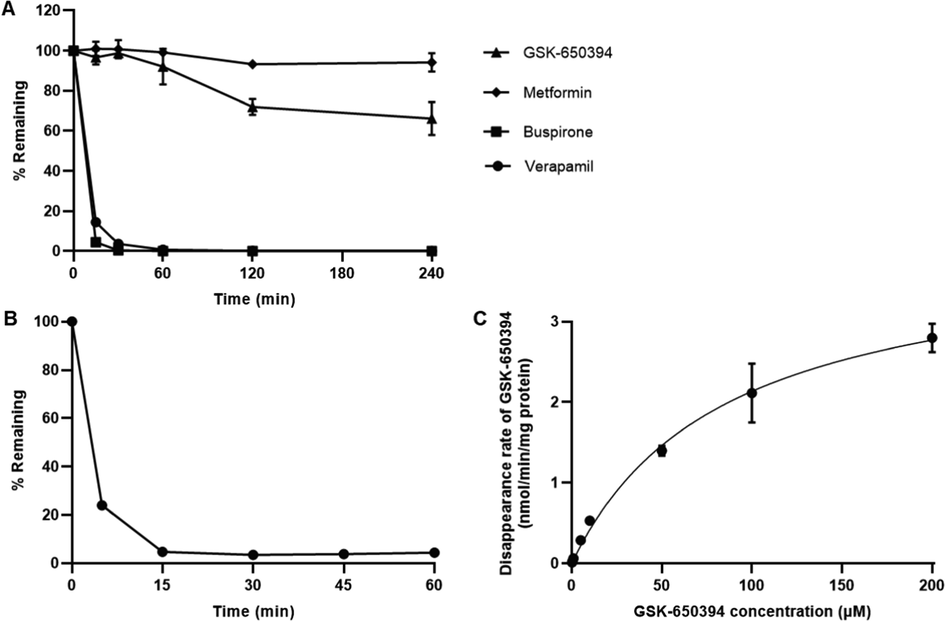
(A) Percentages of remaining of GSK-650394, verapamil, and buspirone (positive controls in rat liver microsomes (RLMs) with NADPH. (B) Percentages of remaining of GSK-650394 in RLMs with UDPGA and alamethicin. (C) Michaelis–Menten kinetic of GSK-650394 (0–200 µM) glucuronidation in RLMs. Data are expressed as means ± SDs (n = 3).
With the predominant UGT reaction of GSK-650394, it is important to investigate which UGT isoforms are involved in its metabolism, to avoid drug-drug interactions. Glucuronide conjugation is catalyzed by various isoforms of glucuronosyltransferase enzymes, which can be identified using recombinant enzyme isoforms or microsomal studies with chemical inhibitors (Shargel et al., 2015). In this study, we further evaluated the glucuronidation reaction of GSK-650394 in RLMs and HLMs, with or without selective and non-selective UGT chemical inhibitors. In rats, the percentage of GSK-650394 was significantly increased in the presence of 50 µM atazanavir, 50 µM troglitazone, 50 µM niflumic acid, 50 and 200 µM mefenamic acid, 200 µM and 1 mM quinidine, and 200 µM diclofenac (Fig. 5A). This result likely indicates that the UGT 1A1, 1A6, 1A9, and 2B7 subfamilies in RLMs are involved in the metabolism of GSK-650394. In HLMs, all tested UGT inhibitors significantly increased the percentage of remaining GSK-650394 (Fig. 5A), suggesting that the metabolism of GSK-650394 in humans might be related to the UGT 1A1, 1A3, 1A4, 1A6, 1A9, and 2B7 subfamilies. UGT inhibitors employed in this study were identified for human UGTs (Kiang et al., 2005, Lee et al., 2019, Uchaipichat et al., 2006). This could be attributed to the significant inhibition for all UGT isoforms in the case of HLM but not RLM. In addition, GSK-650394 was glucuronidated at a higher rate in RLM than in HLM, except in the presence of 200 µM quinidine. A similar observation was also reported for propofol analogs (Shimizu et al., 2003). The differences in UGTs reaction kinetics of GSK-650394 in RLM and HLM should be considered in further studies.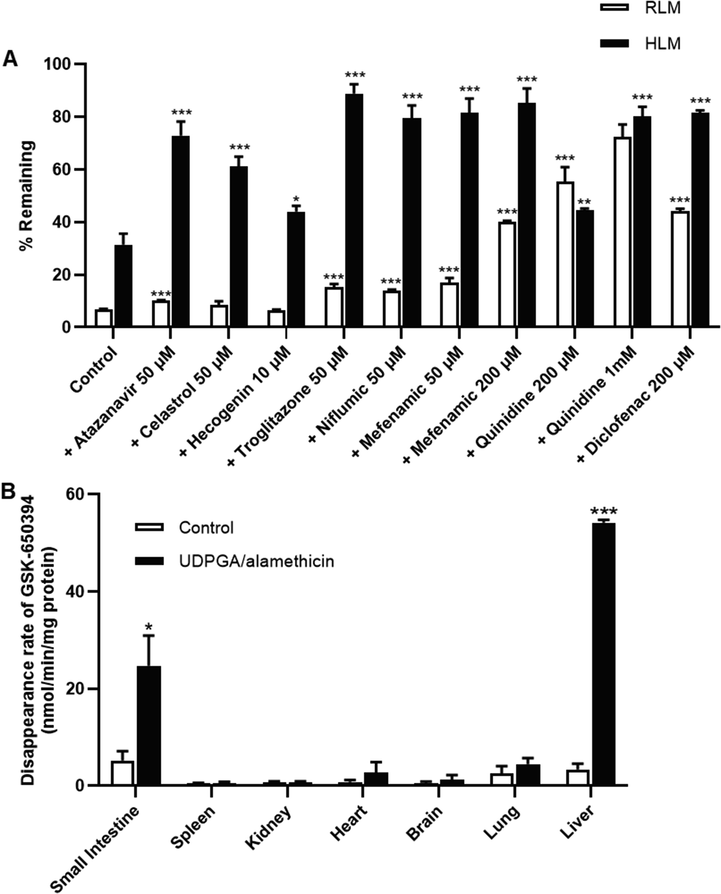
(A) Percentages of remaining of GSK-650394 after 15 min incubation in rat or human liver microsomes in the absence or presence of selective UGTs inhibitors. (B) In vitro glucuronidation metabolism velocity of GSK-650394 in rat tissue S9 fractions including small intestine, spleen, kidney, heart, brain, lung, and liver. Data are expressed as means ± SDs (n = 3). * p < 0.05, ** p < 0.01, *** p < 0.001 compared with control.
Subsequently, we assessed the glucuronidation metabolism velocity of GSK-650394 in different tissues using various rat tissue S9 fractions in the absence and presence of UDPGA/alamethicin, where UDPGA was used as a co-substrate for reaction catalysis and alamethicin was used as a pore-forming peptide that increased the velocity of in vitro glucuronidation, without affecting enzyme activity (Di and Kerns, 2016c). Interestingly, the disappearance rate of GSK-650934 increased significantly in the rat small intestine and liver (Fig. 5B), indicating that glucuronide conjugation of GSK-650394 occurs mainly in these tissues in vivo.
3.3 In vivo pharmacokinetic studies
The average plasma concentrations of GSK-650394 versus time profiles, following IV (2 mg/kg) and oral administration (2, 5, and 10 mg/kg) in rats, are shown in Fig. 6. The pharmacokinetic parameters estimated by non-compartmental analysis for IV and oral administration are shown in Table 5 and Table 6, respectively. GSK-650394 presented a short half-life (t1/2) of 102.2 ± 59.94 min and rapidly disappeared in rat plasma, after 8 h of IV administration. A low Vss was observed (346.1 ± 120.6 mL/kg). The calculated CL was 11.18 ± 1.28 mL/min/kg, which was relatively low compared with the hepatic blood flow rate of rats (55 mL/min/kg). The low CL and Vss can be explained by the high plasma protein binding of GSK (>99 %, Fig. 3D), with negligible metabolism in rat plasma and low metabolism in phase I microsomal reaction (Fig. 3C and 4A) (Di and Kerns, 2016a). After oral administration, GSK-650394 was rapidly absorbed into the circulation system and a second peak was observed in the terminal phase. The first peak of plasma concentration occurred at 15–30 min, followed by the second peak at 480–720 min, as the biliary-excreted drug could be reabsorbed from the intestine back into the bloodstream. This phenomenon occurred for all of the doses, suggesting that GSK-650394 undergoes enterohepatic circulation after oral administration (Colburn et al., 1979, Lenneras and Regårdh, 1990). The average maximum concentrations in plasma (Cmax), without considering the first and the second peaks of each rat PK profile, were not directly proportional to the dose. When considering the first and second peak separately, the Cmax value for the first peak (Cmax1) was not in proportion to the dose, which is likely due to the rapid absorption at initial time points, limited solubility in the intestine and the variations in each rat plasma concentration–time profile. However, for the second peak, the Cmax2/Dose values were similar for three doses (9.507 ± 5.191, 8.363 ± 3.600, and 10.40 ± 5.745 (ng/mL)/Dose for the dose of 2, 5, and 10 mg/kg, respectively), suggesting the linearity in the second plasma peak concentration following oral administration of three different doses. Notably, the AUClast/Dose ratios were not significantly different among three doses of 2, 5, and 10 mg/kg (8.141 ± 1.932, 8.173 ± 2.195, and 8.356 ± 2.413 (µg×min/mL)/Dose, respectively). Similarly, there are insignificant differences in AUCinf/Dose ratios obtained from three doses. GSK-650394 showed a low absolute oral bioavailability of approximately 9 % at all doses. These results suggest that GSK-650394 may follow linear pharmacokinetics up to an oral dose of 10 mg/kg with low oral bioavailability (Shargel et al., 2015). k, elimintion rate constant; t1/2, half life of elimination; C0, the theoretical plasma concentration of drug at t = 0; AUClast, the area under the plasma concentration versus time curve from time 0 to the last time point of concentration measurements; AUCinf, the total area under the plasma concentration versus time curve from time 0 to time infinity; CL, total clearance; Vss, volume of distribution at steady-state. Cmax, the plasma peak concentration; Tmax, time to reach Cmax; CL/F, oral clearance; BA, dose-normalized bioavailability based on AUClast; N.A., not available.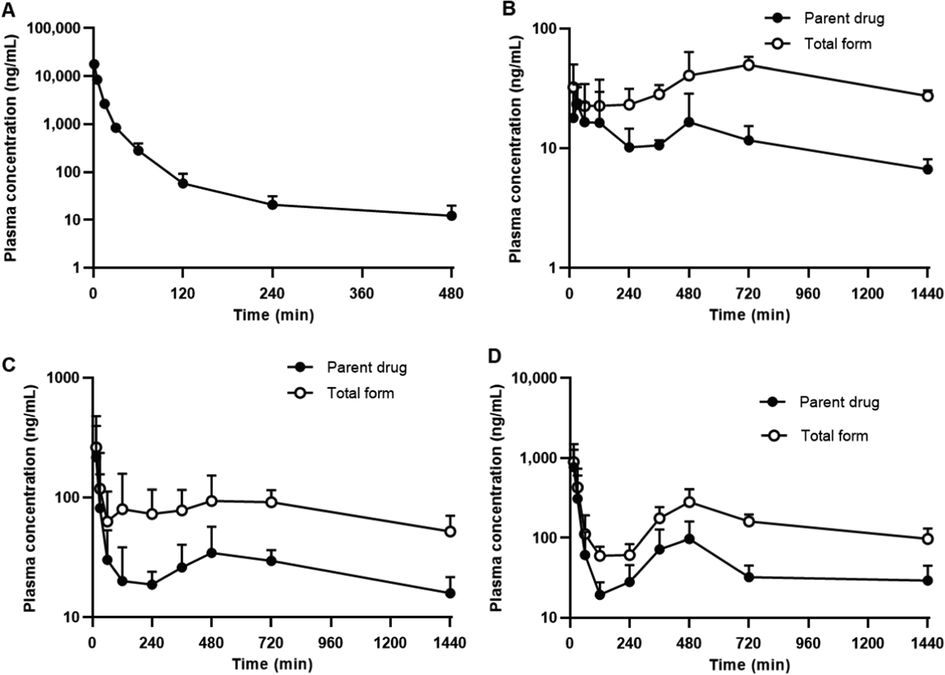
GSK-650394 concentration–time profiles in rat plasma after (A) intravenous administration (2 mg/kg) and oral administration at dose of (B) 2 mg/kg (C) 5 mg/kg, and (D) 10 mg/kg. Closed symbols indicate parent drug and open symbols indicate total form concentration. Data are expressed as means ± SDs (n = 6).
PK parameters
Values
k (1/min)
0.008 ± 0.003
t1/2 (min)
102.2 ± 59.94
C0 (µg/mL)
20.15 ± 3.28
AUClast (µg×min/mL)
178.9 ± 20.7
AUCinf (µg×min/mL)
180.5 ± 20.2
CL (mL/min/kg)
11.18 ± 1.28
Vss (mL/kg)
346.1 ± 120.6
Parameter
Parent drug
Total form (parent drug
+ glucuronide conjugate)
2 mg/kg
5 mg/kg
10 mg/kg
2 mg/kg
5 mg/kg
10 mg/kg
k (1/min)
0.0009 ± 0.0005
0.0010 ± 0.0007
0.0011 ± 0.0006
N.A.
N.A.
N.A.
t1/2 (min)
1002 ± 587.0
1242 ± 1155
828.9 ± 455.6
N.A.
N.A.
N.A.
Cmax (ng/mL)
31.32 ± 9.343
231.4 ± 177.4
769.1 ± 502.0
51.71 ± 17.89
281.4 ± 193.0
899.6 ± 601.3
Tmax (min)
192.5 ± 225.8 (15–480)
90.83 ± 190.7 (15–480)
15.00 ± 0.00
422.5 ± 297.0 (15–720)
210.0 ± 311.5 (15–720)
92.50 ± 189.8 (15–480)
AUClast (µg×min/mL)
16.28 ± 3.86
40.86 ± 10.97
84.36 ± 25.07
48.21 9.522
115.0 ± 36.65
232.2 ± 37.11
AUCinf
(µg×min/mL)26.08 ± 4.71
69.94 ± 19.47
124.72 ± 59.67
N.A.
N.A.
N.A.
AUClast(µg×min/mL)/Dose ()
8.141 ± 1.932
8.173 ± 2.195
8.356 ± 2.413
24.11 ± 4.761
23.01 ± 7.329
23.22 ± 3.711
AUCinf(µg×min/mL)/Dose
13.04 ± 2.36
13.99 ± 3.89
12.47 ± 5.97
N.A.
N.A.
N.A.
CL/F (mL/min/kg)
78.72 ± 13.59
76.0 ± 21.41
95.78 ± 40.87
N.A.
N.A.
N.A.
BA (%)
9.102 ± 2.160
9.138 ± 2.454
9.343 ± 2.699
N.A.
N.A.
N.A.
To determine the glucuronide conjugate concentration, we performed β-glucuronidase treatment on rat plasma samples to reverse the metabolite to the parent form. As shown in Fig. 6B, C, and D the total form concentration (parent drug + glucuronide conjugate) was much higher than that of the parent form for all administered doses. The AUClast of the total forms increased with the dose (48.21 ± 9.522, 115.0 ± 36.65, and 232.2 ± 37.11 µg×min/mL for the dose of 2, 5, and 10 mg/kg, respectively). However, the AUClast/Dose ratio remained similar for all doses (24.11 ± 4.761, 23.01 ± 7.329, and 23.22 ± 3.711 (µg×min/mL)/Dose, respectively) and was much higher than that of the parent drug alone. These in vivo results were in agreement with the in vitro data, suggesting the primary metabolism of GSK-650394 is glucuronidation reaction. The extensive phase II metabolism of GSK-650394, in combination with its low solubility and instability under acidic gastric conditions, resulted in its low oral bioavailability, which was observed in the present pharmacokinetic studies. These findings are critical for the development of GSK-650394 dosage forms for clinical applications. GSK-650394 could be classified as class II based on the Biopharmaceutics Classification System (BCS) with low aqueous solubility and high permeability (Amidon et al., 1995). The poor solubility and instability of GSK-650394 result in low absorption and low oral bioavailability, and expects to exert limited pharmacological effects of GSK-650394 when administered orally. Enhancement of surface area or solubility is the main strategy to improve the bioavailability of BCS class II compounds (Marano et al., 2016, Nasir et al., 2021). Thus, different drug delivery carrier approaches can be employed to improve the oral bioavailability of GSK-650394, such as complexation, solid dispersions, micelles, emulsions, liposomes, polymeric nanoparticles, and solid lipid nanoparticles (Bhalani et al., 2022). These systems can improve the solubility of GSK-650394 and facilitate its absorption in the gastrointestinal tract. In addition, drug stability can be also enhanced due to the protective effects of the carriers. The development of an analog or prodrug can overcome the extensive phase II metabolism of GSK-650394. Another potential strategy to bypass liver metabolism is to develop intranasal, buccal, sublingual, or rectal dosage forms (Lam et al., 2020). These approaches can be useful to improve the bioavailability of GSK-650394 in preclinical and further clinical studies.
4 Conclusions
In this study, a sensitive, reproducible, and reliable LC-MS/MS method for the analysis of GSK-650394 in rat plasma samples was developed and successfully validated following the FDA guidelines. In vitro studies revealed that GSK-650394 is practically insoluble in water and gastrointestinal fluid, highly permeable in Caco-2 cell monolayers, stable in rat plasma, and unstable in gastric fluid. The metabolism of GSK-650394 is primarily associated with phase II glucuronide conjugation, which occurs mainly in the small intestine and liver of the rat S9 fraction. The low CL and Vss values of GSK-650394 obtained from rat pharmacokinetic studies were in agreement with the high plasma protein binding. Following oral administration at three different doses (2, 5, and 10 mg/kg), GSK-650394 encountered enterohepatic circulation, with a low bioavailability (∼9%) for all doses, which could be attributed to its poor solubility, instability in gastric fluid, and extensive phase II metabolism. β-glucuronidase pretreatment of plasma samples resulted in a much higher AUClast/dose ratio of the total form than that of the parent form only, confirming that the predominant metabolism of the compound is likely glucuronide conjugation. This in vitro and in vivo pharmacokinetic information could be useful for improving the druggability of the potential new drug candidate, GSK-650394.
CRediT authorship contribution statement
Qui-Dong Le: Methodology, Formal analysis, Investigation, Data curation, Writing – original draft. Van-An Duong: Methodology, Formal analysis, Validation, Data curation, Writing – review & editing, Visualization. Sang-Hun Lee: Resources, Conceptualization. Thi-Thao-Linh Nguyen: Conceptualization, Formal analysis, Investigation, Writing – review & editing, Visualization, Supervision. Han-Joo Maeng: Conceptualization, Validation, Writing – review & editing, Supervision, Project administration, Funding acquisition.
Acknowledgements
This work was supported by the Gachon University Research Fund of 2020 (GCU-202008420005) and the Basic Science Research Program through the National Research Foundation of Korea (NRF), funded by the Ministry of Science, ICT, and Future Planning (NRF-2021R1F1A1060378).
Declaration of Competing Interest
The authors declare that they have no known competing financial interests or personal relationships that could have appeared to influence the work reported in this paper.
References
- Discovery of Marinoquinolines as Potent and Fast-Acting Plasmodium falciparum Inhibitors with in Vivo Activity. J. Med. Chem.. 2018;61:5547-5568.
- [CrossRef] [Google Scholar]
- Serum- and Glucocorticoid-Regulated Kinase 1 Is Required for Nuclear Export of the Ribonucleoprotein of Influenza A Virus. J. Virol.. 2013;87:6020-6026.
- [CrossRef] [Google Scholar]
- A theoretical basis for a biopharmaceutic drug classification: the correlation of in vitro drug product dissolution and in vivo bioavailability. Pharm Res.. 1995;12:413-420.
- [CrossRef] [Google Scholar]
- FGF23 acts directly on renal proximal tubules to induce phosphaturia through activation of the ERK1/2–SGK1 signaling pathway. Bone. 2012;51:621-628.
- [CrossRef] [Google Scholar]
- Effects of 1α,25-Dihydroxyvitamin D3 on the Pharmacokinetics of Procainamide and Its Metabolite N-Acetylprocainamide, Organic Cation Transporter Substrates, in Rats with PBPK Modeling Approach. Pharmaceutics.. 2021;13:1133.
- [Google Scholar]
- Concurrent determination of topotecan and model permeability markers (atenolol, antipyrine, propranolol and furosemide) by reversed phase liquid chromatography: Utility in Caco-2 intestinal absorption studies. J. Chromatogr. B. 2007;859:261-266.
- [CrossRef] [Google Scholar]
- Identifying SARS-CoV-2 antiviral compounds by screening for small molecule inhibitors of Nsp12/7/8 RNA-dependent RNA polymerase. Biochem. J. 2021;478:2425-2443.
- [Google Scholar]
- Bioavailability Enhancement Techniques for Poorly Aqueous Soluble Drugs and Therapeutics. Biomedicines.. 2022;10
- [CrossRef] [Google Scholar]
- Serum- and Glucocorticoid-Inducible Kinase 1 Mediates Salt Sensitivity of Glucose Tolerance. Diabetes. 2006;55:2059-2066.
- [CrossRef] [Google Scholar]
- A Systematic Study of the In Vitro Pharmacokinetics and Estimated Human In Vivo Clearance of Indole and Indazole-3-Carboxamide Synthetic Cannabinoid Receptor Agonists Detected on the Illicit Drug Market. Molecules. 2021;26:1396.
- [Google Scholar]
- Inhibition of serum and glucocorticoid regulated kinases by GSK650394 reduced infarct size in early cerebral ischemia-reperfusion with decreased BBB disruption. Neurosci. Lett.. 2021;762:136143
- [Google Scholar]
- A pharmacokinetic model for enterohepatic recirculation in the rat: phenolphthalein, a model drug. Drug Metab. Dispos.. 1979;7:100-102.
- [Google Scholar]
- β-Glucuronidases of opportunistic bacteria are the major contributors to xenobiotic-induced toxicity in the gut. Sci. Rep.. 2018;8:1-12.
- [Google Scholar]
- The Emerging Role of SGK1 (Serum- and Glucocorticoid-Regulated Kinase 1) in Major Depressive Disorder: Hypothesis and Mechanisms. Front. Genet.. 2020;11
- [CrossRef] [Google Scholar]
- Chapter 19 - Pharmacokinetics. In: Di L., Kerns E.H., eds. Drug-Like Properties (Second Edition). Boston: Academic Press; 2016. p. :267-281.
- [Google Scholar]
- Chapter 27 - Transporter Methods. In: Di L., Kerns E.H., eds. Drug-Like Properties (Second Edition). Boston: Academic Press; 2016. p. :339-350.
- [Google Scholar]
- Chapter 29 - Metabolic Stability Methods. In: Di L., Kerns E.H., eds. Drug-Like Properties (Second Edition). Boston: Academic Press; 2016. p. :371-386.
- [Google Scholar]
- Regulation of glucose transporter SGLT1 by ubiquitin ligase Nedd4-2 and kinases SGK1, SGK3, and PKB. Obes. Res.. 2004;12:862-870.
- [Google Scholar]
- Author's overview: identifying SARS-CoV-2 antiviral compounds. Biochem. J. 2021;478:2533-2535.
- [CrossRef] [Google Scholar]
- Differential effects of 1α, 25-dihydroxyvitamin D3 on the expressions and functions of hepatic CYP and UGT enzymes and its pharmacokinetic consequences in vivo. Pharmaceutics.. 2020;12:1129.
- [Google Scholar]
- Nanostructured lipid carriers containing ondansetron hydrochloride by cold high-pressure homogenization method: Preparation, characterization, and pharmacokinetic evaluation. J. Drug Delivery Sci. Technol.. 2019;53:101185
- [CrossRef] [Google Scholar]
- Stimulus-dependent regulation of serum and glucocorticoid inducible protein kinase (SGK) transcription, subcellular localization and enzymatic activity. Cell. Physiol. Biochem.. 2003;13:1-12.
- [CrossRef] [Google Scholar]
- Investigation of the Factors Responsible for the Poor Oral Bioavailability of Acacetin in Rats: Physicochemical and Biopharmaceutical Aspects. Pharmaceutics.. 2021;13:175.
- [Google Scholar]
- Reaction phenotyping: current industry efforts to identify enzymes responsible for metabolizing drug candidates. AAPS J.. 2008;10:200-207.
- [Google Scholar]
- Blunted hypertensive effect of combined fructose and high-salt diet in gene-targeted mice lacking functional serum-and glucocorticoid-inducible kinase SGK1. American Journal of Physiology-Regulatory, Integrative and Comparative Physiology.. 2006;290:R935-R944.
- [Google Scholar]
- Resistance of mice lacking the serum-and glucocorticoid-inducible kinase SGK1 against salt-sensitive hypertension induced by a high-fat diet. American Journal of Physiology-Renal Physiology.. 2006;291:F1264-F1273.
- [Google Scholar]
- ICH, 2019. ICH Guideline M10 on Bioanalytical Method Validation ang Study Samples Analysis, European Medicines Agency, International Council for Harmonization. https://www.ema.europa.eu/en/documents/scientific-guideline/ich-guideline-m10-bioanalytical-method-validation-step-5_en.pdf.
- Physiologically-based pharmacokinetic modeling for drug-drug interactions of procainamide and N-acetylprocainamide with cimetidine, an inhibitor of rOCT2 and rMATE1, in rats. Pharmaceutics.. 2019;11:108.
- [Google Scholar]
- Polyethylene glycol-decorated doxorubicin/carboxymethyl chitosan/gold nanocomplex for reducing drug efflux in cancer cells and extending circulation in blood stream. Int. J. Biol. Macromol.. 2019;125:61-71.
- [CrossRef] [Google Scholar]
- UDP-glucuronosyltransferases and clinical drug-drug interactions. Pharmacol. Ther.. 2005;106:97-132.
- [CrossRef] [Google Scholar]
- Development and validation of a highly sensitive LC-MS/MS method for the determination of acacetin in human plasma and its application to a protein binding study. Arch Pharm Res.. 2016;39:213-220.
- [CrossRef] [Google Scholar]
- SGK1 inhibition in glia ameliorates pathologies and symptoms in Parkinson disease animal models. EMBO Mol. Med.. 2021;13:e13076.
- [Google Scholar]
- Transmucosal drug administration as an alternative route in palliative and end-of-life care during the COVID-19 pandemic. Adv Drug Deliv Rev.. 2020;160:234-243.
- [CrossRef] [Google Scholar]
- Targeting SGK1 in diabetes. Expert Opin. Ther. Targets. 2009;13:1303-1311.
- [CrossRef] [Google Scholar]
- State of the art of the neurotrophin hypothesis in psychiatric disorders: implications and limitations. J. Neural Transm.. 2004;111:387-411.
- [Google Scholar]
- Upregulation of serum and glucocorticoid-regulated kinase 1 exacerbates brain injury and neurological deficits after cardiac arrest. American Journal of Physiology-Heart and Circulatory Physiology.. 2020;319:H1044-H1050.
- [Google Scholar]
- Ginsenoside Rc Is a New Selective UGT1A9 Inhibitor in Human Liver Microsomes and Recombinant Human UGT Isoforms. Drug Metab. Dispos.. 2019;47:1372.
- [CrossRef] [Google Scholar]
- Pharmacokinetics of pafenolol in the rat: A suitable model for studying absorption mechanisms of a drug exhibiting unusual absorption properties in man. Biopharm. Drug Dispos.. 1990;11:619-631.
- [Google Scholar]
- SGK1 inhibitor reverses hyperglycemia partly through decreasing glucose absorption. J Mol Endocrinol.. 2016;56:301-309.
- [Google Scholar]
- SGK1 inhibition induces autophagy-dependent apoptosis via the mTOR-Foxo3a pathway. Br. J. Cancer. 2017;117:1139-1153.
- [Google Scholar]
- Effects of 1α,25-dihydroxyvitamin D3 on transport and metabolism of adefovir dipivoxil and its metabolites in Caco-2 cells. Eur. J. Pharm. Sci.. 2012;46:149-166.
- [CrossRef] [Google Scholar]
- Development of micro-fibrous solid dispersions of poorly water-soluble drugs in sucrose using temperature-controlled centrifugal spinning. Eur. J. Pharm. Biopharm.. 2016;103:84-94.
- [CrossRef] [Google Scholar]
- Pro-brain-derived neurotrophic factor is decreased in parietal cortex in Alzheimer’s disease. Mol. Brain Res.. 2003;111:148-154.
- [Google Scholar]
- Improved bioavailability of oxcarbazepine, a BCS class II drug by centrifugal melt spinning: In-vitro and in-vivo implications. Int J Pharm.. 2021;604:120775
- [CrossRef] [Google Scholar]
- Preparation of an oil suspension containing ondansetron hydrochloride as a sustained release parenteral formulation. Drug Deliv. Transl. Res.. 2020;10:282-295.
- [CrossRef] [Google Scholar]
- Development and Validation of a Bioanalytical LC-MS/MS Method for Simultaneous Determination of Sirolimus in Porcine Whole Blood and Lung Tissue and Pharmacokinetic Application with Coronary Stents. Molecules. 2021;26:425.
- [Google Scholar]
- Development of an LC-MS/MS Method for ARV-110, a PROTAC Molecule, and Applications to Pharmacokinetic Studies. Molecules. 2022;27:1977.
- [Google Scholar]
- Spinal Serum-Inducible and Glucocorticoid-Inducible Kinase 1 Mediates Neuropathic Pain via Kalirin and Downstream PSD-95-Dependent NR2B Phosphorylation in Rats. J. Neurosci.. 2013;33:5227.
- [CrossRef] [Google Scholar]
- Optimization of the Caco-2 Permeability Assay to Screen Drug Compounds for Intestinal Absorption and Efflux. In: Turksen K., ed. Permeability Barrier: Methods and Protocols. Totowa, NJ: Humana Press; 2011. p. :139-154.
- [Google Scholar]
- Pharmacokinetic, metabolic stability, plasma protein binding and CYP450s inhibition/induction assessment studies of N-(2-pyridylmethyl)-2-hydroxiymethyl-1-pyrrolidinyl-4-(3-chloro-4-methoxy-benzylamino)-5-pyrimidine-carboxamide as potential type 5 phosphodiesterase inhibitors. Anim Cells Syst (Seoul).. 2019;23:155-163.
- [CrossRef] [Google Scholar]
- SGK1 in human cancer: emerging roles and mechanisms. Frontiers. Oncology. 2021;2987
- [Google Scholar]
- Retinal colocalization and in vitro interaction of the glutamate receptor EAAT3 and the serum-and glucocorticoid-inducible kinase SGK1. Invest. Ophthalmol. Vis. Sci.. 2004;45:1442-1449.
- [Google Scholar]
- Applied biopharmaceutics & pharmacokinetics. McGraw-Hill; 2015.
- Development of a small-molecule serum-and glucocorticoid-regulated kinase-1 antagonist and its evaluation as a prostate cancer therapeutic. Cancer Res.. 2008;68:7475-7483.
- [Google Scholar]
- Glucuronidation of Propofol and Its Analogs by Human and Rat Liver Microsomes. Biol. Pharm. Bull.. 2003;26:216-219.
- [CrossRef] [Google Scholar]
- Retrospective assessment of rat liver microsomal stability at NCATS: data and QSAR models. Sci. Rep.. 2020;10:20713.
- [CrossRef] [Google Scholar]
- Comparison of Pharmacokinetics and Anti-Pulmonary Fibrosis-Related Effects of Sulforaphane and Sulforaphane N-acetylcysteine. Pharmaceutics.. 2021;13:958.
- [Google Scholar]
- A provisional biopharmaceutical classification of the top 200 oral drug products in the United States, Great Britain, Spain, and Japan. Mol. Pharm.. 2006;3:631-643.
- [CrossRef] [Google Scholar]
- Selective separation and characterization of the stress degradation products of ondansetron hydrochloride by liquid chromatography with quadrupole time-of-flight mass spectrometry. J. Sep. Sci.. 2015;38:1625-1632.
- [CrossRef] [Google Scholar]
- Serum and glucocorticoid-regulated kinase 1 (SGK1) is a predictor of poor prognosis in non-small cell lung cancer, and its dynamic pattern following treatment with SGK1 inhibitor and γ-ray irradiation was elucidated. Oncol. Rep.. 2018;39:1505-1515.
- [Google Scholar]
- SGK1, a potential regulator of c-fms related breast cancer aggressiveness. Clin. Exp. Metastasis. 2004;21:477-483.
- [Google Scholar]
- Lamivudine. StatPearls [Internet], StatPearls Publishing; 2022.
- Down-regulation of the Trk-B signal pathway: the possible pathogenesis of major depression. Med. Hypotheses. 2004;62:215-218.
- [Google Scholar]
- Selectivity of substrate (trifluoperazine) and inhibitor (amitriptyline, androsterone, canrenoic acid, hecogenin, phenylbutazone, quinidine, quinine, and sulfinpyrazone) “probes” for human udp-glucuronosyltransferases. Drug Metab. Dispos.. 2006;34:449.
- [CrossRef] [Google Scholar]
- US-FDA, 2018. FDA Guidance for Industry: Bioanalytical Method Validation. https://www.fda.gov/downloads/drugs/guidances/ucm070107.Pdf.
- Effects of 1α,25-dihydroxyvitamin D3 on the pharmacokinetics and biodistribution of ergothioneine, an endogenous organic cation/carnitine transporter 1 substrate, in rats. J. Pharm. Investig.. 2022;52:341-351.
- [CrossRef] [Google Scholar]
- Excessive transcription of the human serum and glucocorticoid dependent kinase hSGK1 in lung fibrosis. Cell. Physiol. Biochem.. 2002;12:135-142.
- [Google Scholar]
- Rapid and Simple RPHPLC Method for the Estimation of Metformin in Rat Plasma. Indian J Pharm Sci.. 2008;70:198-202.
- [CrossRef] [Google Scholar]
- Validation of a Rapid Equilibrium Dialysis Approach for the Measurement of Plasma Protein Binding. J. Pharm. Sci.. 2008;97:4586-4595.
- [CrossRef] [Google Scholar]
- Reduced brain-derived neurotrophic factor in prefrontal cortex of patients with schizophrenia. Mol. Psychiatry. 2003;8:592-610.
- [Google Scholar]
- Microarray analysis reveals glucocorticoid-regulated survival genes that are associated with inhibition of apoptosis in breast epithelial cells. Cancer Res.. 2004;64:1757-1764.
- [Google Scholar]
- Spinal Serum- and Glucocorticoid-Regulated Kinase 1 (SGK1) Signaling Contributes to Morphine-Induced Analgesic Tolerance in Rats. Neuroscience. 2019;413:206-218.
- [CrossRef] [Google Scholar]
- Platelet CFTR inhibition enhances arterial thrombosis via increasing intracellular Cl− concentration and activation of SGK1 signaling pathway. Acta Pharmacol. Sin. 2022
- [CrossRef] [Google Scholar]
- Determination of KD025 (SLx-2119), a Selective ROCK2 Inhibitor, in Rat Plasma by High-Performance Liquid Chromatography-Tandem Mass Spectrometry and Its Pharmacokinetic Application. Molecules. 2020;25:1369.
- [Google Scholar]
- Increased intracellular Cl− concentration promotes ongoing inflammation in airway epithelium. Mucosal Immunol.. 2018;11:1149-1157.
- [CrossRef] [Google Scholar]
- Determination of metformin in rat plasma by HILIC-MS/MS combined with Tecan automation and direct injection. Biomed. Chromatogr.. 2012;26:1163-1169.
- [CrossRef] [Google Scholar]
- Serum-and glucocorticoid-inducible kinase 1 is essential for osteoclastogenesis and promotes breast cancer bone metastasis. Mol. Cancer Ther.. 2020;19:650-660.
- [Google Scholar]
- Zhu, R., G. Yang, Z. Cao, et al., 2020. The prospect of serum and glucocorticoid-inducible kinase 1 (SGK1) in cancer therapy: a rising star. Therapeutic Advances in Medical Oncology. 12, 1758835920940946.
- Vasopressin-stimulated ORAI1 expression and store-operated Ca2+ entry in aortic smooth muscle cells. J. Mol. Med.. 2021;99:373-382.
- [CrossRef] [Google Scholar]
- Requirement of Na+/H+ Exchanger NHE1 for Vasopressin-Induced Osteogenic Signaling and Calcification in Human Aortic Smooth Muscle Cells. Kidney Blood Press. Res.. 2022;47:399-409.
- [CrossRef] [Google Scholar]
Appendix A
Supplementary material
Supplementary data to this article can be found online at https://doi.org/10.1016/j.arabjc.2022.104462.
Appendix A
Supplementary material
The following are the Supplementary data to this article:Supplementary data 1
Supplementary data 1


