

Translate this page into:
High-performance liquid chromatography method development for the quality control of Ginkgonis Semen
⁎Corresponding authors. Fax: +82 42 823 6566. devilkkt@nate.com (Kyung Tae Kim), kangjss@cnu.ac.kr (Jong Seong Kang)
-
Received: ,
Accepted: ,
This article was originally published by Elsevier and was migrated to Scientific Scholar after the change of Publisher.
Peer review under responsibility of King Saud University.
Abstract
Ginkgonis Semen (GS) is the seed of Ginkgo biloba Linné and a valuable material for herbal medicines and functional foods in China, Japan and Korea. The main bio-compounds of GS are GA, GB and GC like the leaves. There are many studies for the analysis of ginkgolides in the leaves or leaves extract of G. biloba because the leaves extract is a valuable material in pharmaceutical industries. However, there is no efficient analytical method for the quality control of GS based on the quantitation of ginkgolides because of matrix effect induced by different chemical composition. So, there are no content criteria of GS in Pharmacopoeia of Korea, Japan and China until now. This study aimed to develop HPLC method using ginkgolides based on the quantitation of GA, GB and GC for the quality control of GS with the optimization of sample preparation to enhance the analytical sensitivity and reproducibility. At first, defatting process using petroleum ether and liquid–liquid extraction were applied for sample preparation to remove matrix effect. The HPLC-ELSD method was developed with the mobile phase of a 0.5% aqueous acetic acid and methanol–acetonitrile solution (1:1 ratio) under gradient conditions. GA, GB and GC contents in GS were different between Korea and China. The mean quantity of Korean samples was 4.85 ± 2.33 μg/g GA, 48.38 ± 5.10 μg/g GB, and 37.83 ± 7.64 μg/g GC. Those contents of Chinese samples were higher than Korean samples as 9.39 ± 2.51 μg/g GA, 123.59 ± 26.24 μg/g GB and 53.39 ± 4.97 μg/g GC. It indicated that the discrimination of GS between Korea and China could be achieved by marker compound contents. Furthermore, the geographical discrimination of GS between Korea and China was confirmed by PCA using the quantitative data of marker compounds. By statistical analysis, the calculated content criteria of GS by regression method were 2.35 μg/g of GA, 29.20 μg/g of GB, and 27.75 μg/g of GC, based on dry weight. Thus, our HPLC method shows potential toward the development of a universal quality control methodology to quantify GS quality and origin.
Keywords
Ginkgolides
Ginkgonis Semen
Quality control
Quantitative analysis
HPLC-ELSD

1 Introduction
Ginkgo biloba is a species of Ginkgoaceae and an ancient family of gymnosperms that have survived for nearly 170 million years (Strømgaard and Nakanishi, 2004). G. biloba is native to China and harvested in Korea and China, then introduced to Japan approximately 800 years ago. This plant is introduced to Europe and North America in the eighteenth century (Beek and Montoro, 2009). Young trees have large elongated wooden trunk with average height of 30 m. Leaves are in unique fan-shape and turn to golden yellow in the autumn. Ripe fruits from G. biloba are yellow, rotting flesh and fermented odor with edible seed inside (McKenna et al., 2001). This plant is one of valuable plants in pharmaceutical and functional food industries because of its various biological and pharmaceutical functions.
The medicinal activities of G. biloba were first recognized at Chen Noung Pen T’sao, making it the first known Chinese Pharmacopoeia entry over 5000 years ago (Diamond et al., 2000). Root, leaf and seed of G. biloba are all used as medicinal materials, but the utilization and the bioactivities of each part are different. The root is utilized in the form of extract for herbal prescriptions to treat brain diseases such as Alzheimer’s, dementia, and traumatic brain injury in countries including Germany and the United States (Kleijnen and Knipschild, 1992; Landes, 1997). The leaf is main material of the best-selling herbal medications to improve blood circulation that are sold annually 250 million dollars in the United States (DeKosky et al., 2008). Flavonoid and terpene trilactone are active compounds for the pharmacological effects of leaf extracts (Bastianetto et al., 2000). G. biloba seed, Ginkgo Semen (GS), is used to treat cough, asthma, enuresis, alcohol misuse, pyogenic skin infections and worm infestations in the intestinal tract (Beek and Montoro, 2009). Among three medicinal materials of G. biloba, GS is much more consumed than other parts for food ingredients of desserts, glazed fruit, beverages and tipple (Bastianetto et al., 2000), and is widely used in Korea, Japan and China as a traditional medicine (Strømgaard and Nakanishi, 2004).
GS contains ginkgolides, flavonoids, ginkgolic acids, and phenylpropanol (Zhou et al., 2012a, 2012b). It is reported that the pharmacological potency of G. biloba derives from flavonoids and ginkgolides (Luo et al., 2013). Flavonoids show antioxidant activity, free radical scavenging activity and enzyme inhibition, while ginkgolides have protective effects on central nervous system, such as traumatic brain injury, ischemia and cerebrovascular. (Maclennan et al., 2002) In pharmacokinetic study, bioavailability of flavonoids is poor due to low absorption and quick elimination, whereas for ginkgolides, bioavailability is nearly complete (Mahadevan and Park, 2008). Flavonoids are common compounds that are also present within other plants; however, ginkgolides are unique compound of G. biloba. Three specific types of ginkgolides that are ginkgolide A (GA), ginkgolide B (GB), and ginkgolide C (GC), are related to different types of pharmaceutical activities. Ginkgolides, particularly GB, generally act as antagonists to platelet-activating factor receptors used in the treatment of inflammatory and neurodegenerative diseases (Diamond et al., 2000). GA and GB modulate the peripheral benzodiazepine receptor, providing proof that these compounds have neuroprotective effects (Amri et al., 1996). Therefore, ginkgolide compounds are generally considered to be the active component in medications containing G. biloba (Kaur et al., 2009). GA, GB and GC are used as marker compounds for controlling the quality of G. biloba in Chinese Pharmacopoeia (The State Commission of Pharmacopoeia, 2015).
Until now, most of analytical researches have focused on analyzing G. biloba leaves using GA, GB, and GC as marker compounds because they are commonly used in commercial products. However, few GS analysis methods have been reported in the literature; specifically, there are few high-performance liquid chromatography (HPLC) studies of GA, GB, and GC in GS. This is likely due to two reasons. First, ginkgolides absorb ultraviolet (UV) light poorly, making HPLC-UV analysis difficult (Beek, 2002). Second, the chemical compositions of GS and G. biloba leaves are different; the detection intensity of ginkgolides is weaker in GS than in G. biloba leaves, resulting in a large matrix effect.
Recently, in Chinese scientific journal, Lou et al. (2011) analyzed GA, GB, and GC as marker compounds using an HPLC evaporative light scattering detector (ELSD). Luo et al. (2013) performed a fingerprint analysis of G. biloba and GS using ultra-high performance liquid chromatography with tandem quadrupole/flight mass spectrometry (LC-Q-TOF/MS). Zhou et al. (2014) used triple-quadrupole tandem mass spectrometry (UAE-UHPLC-TQ/MS2) to analyze GS constituents. Despite the advances, the reported methods are too complex process of sample preparation to use for the quality control of GS. Additionally, published HPLC-ELSD methods do not show good reproducibility. In fact, we struggled to attain a similar HPLC-ELSD chromatogram pattern for GS to that reported by Lou et al. (2011), possibly due to differences in the instrumentation or testing conditions; however, commercial quality assurance could not be secured in this case. It indicated that the HPLC-ELSD method of Lou et al. has a problem of reproducibility. Additionally, the LC-MS/MS method requires a costly set up that draws on materials and instruments from small-scale suppliers, which would be difficult to scale up into full commercialization. Significantly, no one study has produced criteria for evaluating the quality of GS; additionally, no specific content criteria for GS are recognized in Pharmacopoeias in major markets including Korea and China, despite the high quantities of product in circulation within these markets. Related to this is a lack of analytical methods that can be used to determine the geographical origin of GS, which is important as price differs depending on origin. Therefore, the development of a simple, reproducible HPLC method to identify GS origin is needed to elucidate criteria useful for GS quality control.
Given this, our study presents a simple, reproducible method of analyzing GS by HPLC-ELSD using GA, GB, and GC as marker compounds. As it was possible to determine geographical origin by parsing marker compound content using principle component analysis (PCA) of resultant data, we suggest that this method has the potential for commercial quality control applications for GS products.
2 Materials and methods
2.1 Chemicals and samples
All standard compounds (ginkgolide A, ginkgolide B and ginkgolide C) were purchased from ALB Technology (Hong Kong, China); all chemical structures for standard compounds are shown in Fig. 1. HPLC grade methanol, acetonitrile and ethyl acetate were purchased from Burdick & Jackson (Morris Plains, NJ, USA) and acetic acid was purchased from Merck (Darmstadt, Germany). Distilled water was produced by a Milli-Q purification system (Millipore, USA). Fifteen GS samples (eight Korean and seven Chinese samples) were purchased from various suppliers for medicinal herbs in China and Korea (Supplementary Table 1). The collected samples were dried at 30 °C for 24 h and then kept in the sealed pack at 4 °C before use.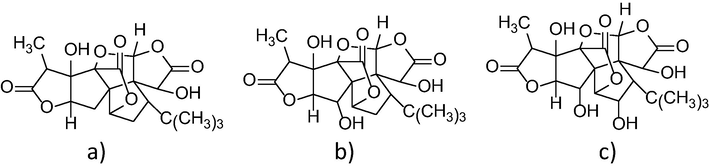
Chemical structure of (a) ginkgolide A (GA), (b) ginkgolide B (GB), and (c) ginkgolide C (GC).
2.2 Preparation of sample and standard solutions
For sample preparation, the methods of Kaur et al. (2009) and Li and Fitzloff (2002) were modified. Each dried GS was ground and passed through a sieve (850 μm). Each powdered GS sample (6 g) was put into 50 mL falcon tube and mixed with petroleum ether (45 mL) and extracted by sonication for 1 h at 40 kHz to defat. The liquid phase was removed by filtration and left for 1 h under the ventilation hood to remove petroleum ether. The residue was dissolved in 90% methanol (45 mL) and sonicated for 1 h at 40 kHz. Methanol extract was filtered using filter paper (Whatman No. 4) and evaporated to dryness. The dried extract was then recovered by adding water (20 mL). This liquid was partitioned using ethyl acetate (40 mL) three times for liquid-liquid extraction. All ethyl acetate partitions were merged and evaporated, and then methanol (0.6 mL) was added to dissolve the residue. Samples GS-9, GS-11, GS-13, and GS-14 were diluted twice with methanol for HPLC analysis because they contained greater concentrations of the marker compounds according to a preliminary test. Standard mixtures of GA, GB and GC were prepared using methanol to final concentrations of 0.2 mg/mL, 1 mg/mL and 2 mg/mL, respectively, and kept at 4 °C until use. All sample and standard solutions were filtered using a 0.2-μm syringe filter prior to HPLC injection.
2.3 HPLC analysis
HPLC analysis was achieved using a Shimadzu LC-10AD series system (Kyoto, Japan) consisting of two pumps, a column oven, and an autosampler coupled with a Sedex 55 ELSD detector (Sedere, France). An Optimapak C18 column (250 × 4.6 mm, 5 μm, RStech, Daejeon, Korea) was used as the stationary phase. A column temperature of 30 °C and a flow rate of 1.0 mL/min were used. The ELSD operated under 2.0 bar of N2 gas flow, and a temperature of 90 °C. To optimize chromatographic separation, mobile phase composition (methanol–water, acetonitrile–water, and methanol–acetonitrile–water) and types of additives (formic acid, acetic acid, ammonium formate, and ammonium acetate) were verified.
2.4 LC-MS/MS analysis
LC-MS/MS analysis was performed using a Shimadzu Prominence™ UFLC system (Kyoto, Japan) linked to a Shimadzu LCMS-8040 system (Kyoto, Japan) in positive and negative mode. Electrospray ionization (ESI) mass spectrometry was operated under optimized conditions, with an interface voltage of −3.5 kV for negative mode and 4.5 kV for positive mode. The conditions included nebulizing gas of 3 L/min, drying gas of 15 L/min, a desolvation line temperature of 250 °C, and a heat block temperature of 400 °C. The stationary phase was Optimapak C18 (250 × 4.6 mm, 5 μm, RSTech, Daejeon, Korea). Other analytical conditions were the same as those used for HPLC-ELSD analysis. MS/MS scans were obtained by the collision of precursor ions with nitrogen gas, with a collision energy set at 16 eV for GA and −18 eV for GB and GC.
2.5 Method validation
The developed HPLC method was validated by linearity, the limit of detection (LOD), limit of quantitation (LOQ), precision, accuracy, repeatability, and recovery. Linearity was verified by the correlation coefficient of the calibration curve between peak area and standard concentration. For the calibration, five different concentrations of GA standard (20, 40, 60, 80, 120 μg/mL) and GC (100, 200, 300, 400 and 600 μg/mL) were used. In case of GB, six different standard concentrations (0.2, 0.4, 0.6, 0.8, 1.2 and 1.6 mg/mL) were used. LOD and LOQ were estimated by diluting standard solutions until signal-to-noise ratios of 3 and 10, respectively, were attained. The intraday precision and accuracy were verified by analyzing three (low, medium, and high) standard concentrations four times a day. The inter-day precision and accuracy were examined over four consecutive days. Repeatability was estimated by six consecutive injections. Recovery was examined by spiking three levels (80%, 100%, and 120% of sample concentration) in triplicate; fortified samples were extracted using the same procedure described in Section 2.2, and analyzed by HPLC. Recovery test results were expressed as percentages (%) and relative standard deviations (RSDs).
2.6 Statistical analysis
All measurements were performed at least in triplicate and expressed as the mean ± SD. RSD was calculated by the percentage of SD divided by the mean. Significance was evaluated at a 95% confidence level (p < 0.05 at t-tests). Shapiro-Wilk normality test was performed using R program (Freeware version 3.2.4) with null hypothesis as all is normal distribution at first, and then Relative standard deviation (RSD) method and linear regression method were applied to establish the content criteria of marker compounds (Kim et al., 2015). Quantitative results of the three marker compounds were parsed using PCA to discriminate GS by geographical location origin; this was done using Minitab software (Minitab Inc., State College, PA, USA).
3 Results and discussion
3.1 Sample preparation
We observed an unstable chromatogram baseline (possibly due to the background GS matrix), and could not detect marker compounds without modification of the sample preparation process. Fat and polar compounds within GS may present the largest contribution to such matrix effects. Dried G. biloba seeds contain 3% fat, which can increase viscosity, causing compounds to agglomerate (Beek, 2005). Both fat and polar compounds can reduce the separation efficiency and compound selectivity by decreasing interactions between the compound and the stationary phase. In fact, GA content in GS was lower than GB and GC as shown in Table 3 and the retention time of GA was nearby that of GB. The detection of GA was more influenced than other two ginkgolides by matrix effect because GA content was ten times lower than GB. To improve baseline stability, enhance separation, and improve detection of marker compounds, we attempted to optimize the sample preparation process by performing defatting to stabilize the baseline. According to Lou et al. (2011), petroleum ether is an efficient solvent to remove fat within GS during the extraction process and was thus used in sample preparation. After defatting of GS with petroleum ether, the chromatogram baseline of GS sample became stable (Supplementary Fig. 1c) and the weight loss of all samples by defatting was 3.32 ± 0.45% (Supplementary Table 2). The fat content in GS is 3% (Beek, 2005), so it is considered that the fat in GS is eliminated efficiently. Additionally, the selection of extraction solvent and method were verified to improve detection and separation of marker compounds. We used 90% methanol as extracting solvent, noting that Kaur et al. (2009) determined that 90% methanol optimized yield of ginkgolides from the leaves of G. biloba, resulting in a cleaner chromatogram than other methanol ratios. However, marker compound peaks were not clearly detected after sonication with 90% methanol at GS. The detection problem of maker compounds at GS was considered by matrix effect induced different chemical composition compared to the leaves of G. biloba. So, LLE was applied and the ethyl acetate phase of LLE was collected for the analysis of GA, GB and GC. After LLE, the detection and separation of GA were highly improved without the interference with other peaks. Especially, the detection of GA was clarified. These results show that defatting and LLE are fundamental preparation processes necessary to eliminate matrix effects for the detection of marker compounds GA, GB, and GC.
3.2 HPLC method development
Separation of GA and GB was not achieved when water–acetonitrile was used as the mobile phase, even when an acidic modifier (0.5% formic acid and 0.5% acetic acid) was added. Therefore, methanol was suggested as an alternative mobile phase. Use of methanol resulted in peak tailing or fronting, which was observed for standard compounds under water–methanol conditions. This problem was not resolved upon addition of formic acid and acetic acid ranging in concentration from 0.1% to 1%. Additionally, ammonium formate and ammonium acetate (used as an acidic modifier) degraded standard compounds. Hence, a solution of water and a mixture of methanol and acetonitrile (1:1 ratio) were used as mobile phases. The addition of 0.5% acetic acid into the aqueous phase improved both peak resolution and the shape of standard compounds (Fig. 2); thus, two eluents of 0.5% acetic acid in water (solvent A) and methanol/acetonitrile (1:1, solvent B) were used with elution program from 25% B to 45% B in 30 min. All GS sample chromatogram and standard mixture are shown in Fig. 3. Among GS samples, there was no specific pattern to discriminate GS origin between Korean and Chinese.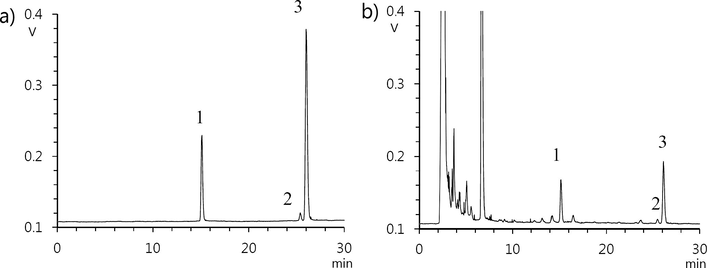
HPLC chromatogram of (a) standards and (b) GS sample. Peak identification: 1. GC, 2. GA, 3. GB. HPLC conditions: Column; Optimapak C18, eluents; 0.5% acetic acid in water (A), methanol/acetonitrile (1:1) (B), gradient; 0 min - 25% B, 30 min - 45% B, flow rate; 1 mL/min, injection volume; 10 μL.
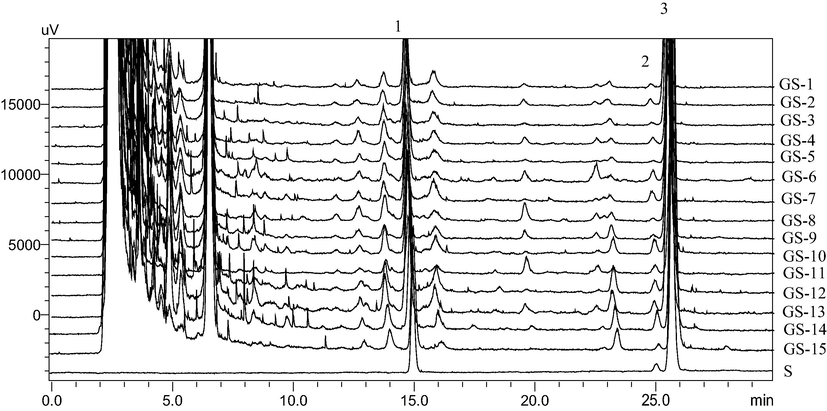
Comparative chromatogram of 15 samples and standard compounds: S. standard mixture. 1. GC, 2. GA, 3. GB.
3.3 LC-MS/MS analysis of marker compounds
Peak identification within sample chromatograms derived from LC-MS/MS analysis was performed by comparing our results with chromatograms of standard compounds. In deciding between atmospheric pressure chemical ionization (APCI) and ESI, ESI was chosen to analyze GA, GB and GC because these marker compounds are unstable at high temperatures (Sakabe et al., 1967). Given this, the ionization and fragmentation of ginkgolides were investigated using tandem MS with ESI in negative and positive mode (Supplementary Fig. 2). At LC-MS analysis, GA, GB and GC were detected both of positive and negative modes. At LC-MS/MS analysis, GB and GC were analyzed in negative mode, and GA was in positive mode considering the intensity of precursor ion (Fig. 4). In the total ion current (TIC) chromatogram, GB (retention time (RT) = 31.1 min) and GC (RT = 24.7 min) were observed in their deprotonated forms [M − H]− at m/z 423 and m/z 439; GA was present in its [M + H2O]+ form at a RT of 30.8 min in sample and standard. Product ions examined by LC-MS/MS were located at m/z of 317, 327, 345 and 409 for GA; 69, 113, 125, 367, 395 for GB; and 69, 113, 125, 383, 411 for GC (Fig. 4). The fragmentation process that marker compounds undergo within the analysis was investigated based on principles derived from chemical structure and mass fragmentation (Chen et al., 2007; Pretsch et al., 2009). According to Chen et al. (2007) and Pretsch et al. (2009), the main fragmentation ion is the most stable form, and will therefore be the most abundant. The defragmentation process and the suggested resultant chemical structure of product ions of GA, GB, and GC are shown in Fig. 5. GA-b (m/z 345) is formed when GA-a loses two water molecules and a lactone group (m/z 409); GA-b likely then decomposes into GA-c (m/z 317) and GA-d (m/z 327) when a water or lactone group is respectively lost. The formation of the product ion [M+H+ - H2O] can be explained by collision-induced heterolytic cleavage, where water is eliminated through a 1, 4-hydrogen rearrangement mechanism (Chen et al., 2007; Pretsch et al., 2009). The structure of GB and GC are similar, where GB has one more hydroxyl group than GB. Considering both LC-MS/MS data and principles of chemical structural defragmentation, we hypothesize that GB and GC will show similar fragmentation patterns. Specifically, we theorize that GB-b, GC-b, and GB-c, GC-c are formed by the loss of one and two lactone groups from GB-a and GC-a, respectively. GB-c and GC-c are likely to decompose into the smaller ions GB-d and GC-d (m/z 125), GB&GC-e (m/z 113), and GB&GC-f (m/z 69).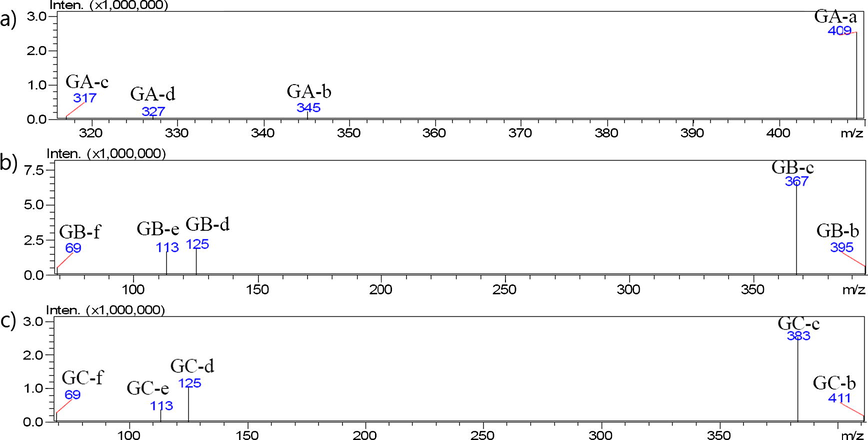
LC-ESI-MS/MS spectra of separated (a) GA, (b) GB and (c) GC from standard. MS conditions: Interface voltage; −3.5 kV (negative mode), 4.5 kV (positive mode), nebulizing gas flow rate; 3 L/min, drying gas; 15 L/min, desolvation line temp.; 250 °C, heat block temp.; 400 °C, collision energy; 16 eV (GA), −18 eV (GB, GC).

Proposed mass fragmentation pathway of GA, GB and GC.
3.4 Method validation
This HPLC method was validated by examining linearity, LOD, LOQ, precision, accuracy, and recovery. Linearity showed r2 > 0.999 in the concentration ranges 20–120 μg/mL for GA, 200–1600 μg/mL for GB, and 100–600 μg/mL for GC. The LODs and LOQs of three marker compounds were less than 30.0 μg/mL and 10.0 μg/mL, respectively (Table 1). Precision ranged from 0.6% to 2.6% within a single day, and from 0.2% to 2.7% between days. Overall, evaluated precision values were less than 5%, which satisfies the limits set by the Validation Guideline of the Ministry of Food and Drug Safety in Korea (2014). Intra-day and inter-day accuracies of GA, GB, and GC ranged from 95.0% to 104.2% (Table 2). Repeatability was verified by comparing RT and peak area over six continuous injections; the subsequent variation in RT was within 0.03 min, and RSDs from the peak areas were 1.73% for all marker compounds (Table 3). The recoveries of all three marker compounds varied from 95.81% to 104.29%, with RSDs of 0.35% to 3.48% (Table 4), indicating that the method developed in this study is well validated.
Analytes
Regression equation
r2
Range (μg/mL)
LOD (μg/mL)
LOQ (μg/mL)
GA
y = 109.69x – 1881
0.9991
20–120
8.0
20.0
GB
y = 381.1x − 60,743
0.9993
200–1600
10.0
30.0
GC
y = 246.92x − 19,433
0.9991
100–600
5.0
15.0
Analytes
Intra-day
Inter-day
Conc. (μg/mL)
Founda (μg/mL)
Accuracy (%)
RSD (%)
Founda (μg/mL)
Accuracy (%)
RSD (%)
GA
40
38.1 ± 1.0
95.3
2.6
38.0 ± 1.0
94.9
2.7
80
76.0 ± 0.8
95.0
1.1
78.5 ± 2.1
98.1
2.7
120
122.6 ± 2.1
102.2
1.7
123.3 ± 3.3
102.8
2.7
GB
400
383.7 ± 6.1
95.9
1.6
388.5 ± 0.6
97.1
0.2
800
762.0 ± 4.2
95.3
0.6
762.8 ± 3.9
95.3
0.5
1600
1625.4 ± 16.3
101.6
1.0
1596.5 ± 42.6
99.8
2.7
GC
200
191.6 ± 4.5
95.8
2.3
191.3 ± 4.5
95.7
2.4
400
396.7 ± 5.8
99.2
1.5
398.0 ± 5.8
99.5
1.5
600
614.5 ± 13.0
102.4
2.1
625.2 ± 16.3
104.2
2.6
Analytes
Repeatability
RT (min)
Contenta (μg/mg)
RSD (%)
GA
25.00 ± 0.02
39.33 ± 0.38
1.73
GB
25.65 ± 0.02
620.51 ± 7.37
1.60
GC
14.80 ± 0.03
289.32 ± 2.40
1.14
Analytes
Concentration
Recovery (%)
RSD (%)
Original (μg/mL)
Spiked (μg/mL)
Founda (μg/mL)
GA
29.75
35
36.02 ± 0.63
102.92
1.76
29.75
30
30.72 ± 0.24
102.41
0.79
29.75
25
25.35 ± 0.72
101.42
2.82
GB
410.66
480
464.44 ± 9.41
96.09
2.03
410.66
410
417.06 ± 8.46
101.72
2.03
410.66
340
345.59 ± 11.48
101.64
3.32
GC
248.10
300
287.43 ± 8.56
95.81
2.98
248.10
250
250.67 ± 0.88
100.27
0.35
248.10
200
208.57 ± 7.26
104.29
3.48
3.5 Differentiating on the basis of geographical origin
The developed method was applied to quantify the GA, GB, and GC concentrations within GS and used these fingerprints to determine the origin of GS as either from Korea or China (Supplementary Table 3). The GA content of Chinese samples ranged from 7.83 to 12.71 μg/g (mean = 9.39 ± 2.51 μg/g) (Fig. 6), and Korean samples ranged from 2.92 to 8.32 μg/g (4.85 ± 2.33 μg/g). The GB content in GS ranged from 87.33 to 155.87 μg/g in Chinese samples (mean = 123.59 ± 26.25 μg/g) and 40.69–57.31 μg/g (mean = 48.38 ± 5.10 μg/g) in Korean samples. The GC content in Chinese samples ranged from 47.05 to 58.97 μg/g (mean = 53.39 ± 4.97 μg/g), while Korean samples ranged from 24.68 to 50.78 μg/g (mean = 37.83 ± 7.64 μg/g). Overall, Chinese samples demonstrated higher concentrations of GA, GB, and GC than Korean samples. Additionally, PCA was able to clearly parse GS on the basis of its geographical origin (Fig. 7). Differences in concentrations of these marker compounds may arise from geographical and environmental differences, providing a clear way of fingerprinting GS origin.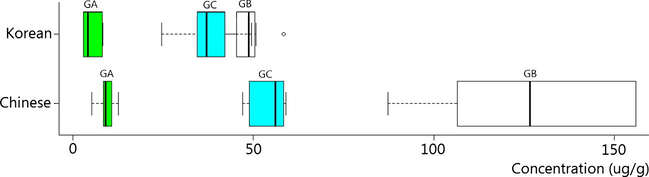
Boxplot of the content of GA, GB and GC in Korean and Chinese GS samples.
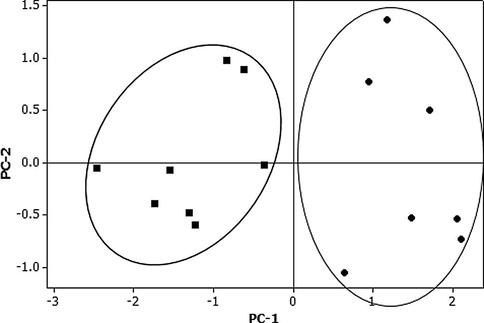
Principal component analysis of GS samples for Korean (■) and Chinese samples (●).
Additionally, we found that G. biloba leaves contain significantly greater concentrations of marker compounds than GS. According to Yao et al. (2013), extracts of G. biloba leaves contained 104.3–529.1 μg/g of GA, 343.5–612.3 μg/g of GB, and 140.1–862.8 μg/g of GC. Therefore, the discrimination between leaf and seed or the mixing of both can be verified by the content of GA, GB and GC. The quantity of marker compounds in GS was ordered as GB > GC > GA, which is the same as in G. biloba leaves.
3.6 Content criteria
Until now, there have been no criteria to assess the quality of GS. Interestingly, although large markets for GS exist within Korea, China, and Japan, there are no recognized standards in Pharmacopoeias within these countries to evaluate consumer products containing GS. The number of GS samples used in this study is not sufficient to confirm the content criteria of GS. However, we try to suggest the content criteria of GA, GB, and GC for the quality control of GS to establish prospective marker compounds and content criteria for Pharmacopeia. To establish content criteria, normality test should be applied to select the calculation method between RSD and regression at first. The normality of data should be verified with p-value and histogram together. In addition, the fail ratio of samples by selected content criteria should be considered to establish calculation method and content criteria because the content criteria having high fail ratio of samples are hard to apply in Pharmacopoeia.
At first, Shapiro–Wilk normality test was performed to verify the normal distribution of the quantitation data of maker compounds by R program. The p-values for GA, GB, and GC were 0.20, 0.01, and 0.58, indicating that GA and GC concentrations demonstrate a normal distribution (p > 0.05) when null hypothesis was that all data were normal distribution. RSD method seems to be suitable to establish content criteria for GA and GC but the histograms of GA and GC data were far away normal distribution (Supplementary Fig. 3). Furthermore, the fail ratio of each marker compound for GS samples was same between RSD and regression (Supplementary Table 4). Therefore, regression method was selected finally to establish the content criteria of GA, GB and GC in GS. The confirmed content criteria of GS in this study were 2.35 μg/g of GA, 29.20 μg/g of GB, and 27.75 μg/g of GC, based on dry weight.
4 Conclusions
This study presents a simple and reproducible HPLC method to detect gingkolide A, B, and C; this method is a step toward establishing a quality control methodology for GS. This HPLC method used ELSD; the reproducibility of the method was verified. We noted that marker concentrations in GS could be ordered as GB > GC > GA; we also noted that the concentrations of these three marker compounds in GS were lower than in extracts from G. biloba leaves. The concentrations of these marker compounds in GS differed according to geographical origin; Chinese samples held greater GA, GB, and GC concentrations than Korean samples. The geographical origin was clearly parsed by PCA of GC samples. This study suggests that concentrations of 2.35 μg/g of GA, 20.87 μg/g of GB, and 27.75 μg/g of GC could be used as content criteria to characterize GC samples. We suggest that our HPLC-ELSD method, and the resultant content criteria derived, could be used toward formulating a universal quality control methodology to quantify GS quality and origin.
Acknowledgment
This research was supported by Basic Science Research Program through the National Research Foundation of Korea (NRF) funded by the Ministry of Education (2009-0093815).
References
- In vivo regulation of peripheral-type benzodiazepine receptor and glucocorticoid synthesis by Ginkgo biloba extract EGb 761 and isolated ginkgolides. Endocrinology. 1996;137:5707-5718.
- [Google Scholar]
- The Ginkgo biloba Extract (EGb 761) protects and rescues hippocampal cells against nitric oxide-induced toxicity. J. Neurochem.. 2000;74:2268-2277.
- [Google Scholar]
- Chemical analysis of Ginkgo biloba leaves and extracts. J. Chromatogr. A. 2002;967:21-55.
- [Google Scholar]
- Ginkgo biloba. Amsterdam: Harwood Academic Publishers; 2005. p. :18.
- Chemical analysis and quality control of Ginkgo biloba leaves, extracts, and phytopharmaceuticals. J. Chromatogr. A. 2009;1216:2002-2032.
- [Google Scholar]
- LC/MS: theory, instrumentation, and applications to small molecules. In: Kazakevich Y., LoBrutto R., eds. HPLC for Pharmaceutical Scientists. New Jersey: John Wiley & Sons; 2007. p. :313.
- [Google Scholar]
- Ginkgo biloba for prevention of dementia a randomized controlled trial. J. Am. Med. Assoc.. 2008;300:2253-2262.
- [Google Scholar]
- Ginkgo biloba extract: mechanisms and clinical indications. Arch. Phys. Med. Rehabil.. 2000;81:668-678.
- [Google Scholar]
- Optimization of extraction technique and validation of developed RP-HPLC-ELSD method for determination of terpene trilactones in Ginkgo biloba leaves. J. Pharm. Biomed. Anal.. 2009;50:1060-1064.
- [Google Scholar]
- Specification and analysis of multiple marker compounds for quality control of Mori Cortex Radicis by HPLC. Bull. Korean Chem. Soc.. 2015;36:117-122.
- [Google Scholar]
- Landes P Market report: whole foods magazine’s 2nd annual herb market survey for U.S. health food stores. HerbalGram. 1997;40:52.
- [Google Scholar]
- Simultaneous determination of terpene lactones and flavonoid aglycones in Ginkgo biloba by high-performance liquid chromatography with evaporative light scattering detection. J. Pharm. Biomed. Anal.. 2002;30:67-75.
- [Google Scholar]
- Fingerprint of Ginkgo Semen by HPLC-ELSD. Chin. Tradit. Patent Med.. 2011;33:1465-1469.
- [Google Scholar]
- Fingerprint analysis of Ginkgo biloba extract and Ginkgo Semen in preparations by LC-Q-TOF/MS. J. Food. Drug. Anal.. 2013;21:27-39.
- [Google Scholar]
- The CNS effects of Ginkgo biloba extracts and ginkgolide B. Prog. Neurobiol.. 2002;67:235-257.
- [Google Scholar]
- Multifacted therapeutic benefits of Ginkgo biloba L.: chemistry, efficacy, safety, and uses. J. Food. Sci.. 2008;73:R14-R19.
- [Google Scholar]
- Efficacy, safety, and use of Ginkgo biloba in clinical and preclinical applications. Altern. Ther. Health Med.. 2001;7:70-86. 88–90
- [Google Scholar]
- Ministry of Food and Drug Safety, 2014. Korean Pharmacopoeia, Part II, p. 1851.
- Structure Determination of Organic Compounds – Tables of Spectral Data (fourth ed.). Berlin: Springer; 2009. p. :354-384.
- The structure of ginkgolide a, a novel diterpenoid trilactone. Chem. Commun.. 1967;6:259-261.
- [Google Scholar]
- Chemistry and biology of terpene trilactones from Ginkgo biloba. Angew. Chem. Int. Ed. Engl.. 2004;43:1640-1658.
- [Google Scholar]
- Pharmacopoeia of People’s Republic of China. Beijing: The Medicine Science and Technology Press of China; 2015. p. :108.
- Determination of terpene lactones in Ginkgo biloba leaves in different ages by UPLC-TQ-MS. Chin. J. Chin. Mater. Med.. 2013;3:376-380.
- [Google Scholar]
- Study on chemical constituents of Ginkgo biloba kernel. Chin. Pharm. J.. 2012;47:1362-1365.
- [Google Scholar]
- Two new nonacosanetriols from Ginkgo biloba sarcotesta. Chem. Phys. Lipids. 2012;165:731-736.
- [Google Scholar]
- An optimized ultrasound-assisted extraction and simultaneous quantification of 26 characteristic components with four structure types in functional foods from ginkgo seeds. Food Chem.. 2014;158:177-185.
- [Google Scholar]
Appendix A
Supplementary material
Supplementary data associated with this article can be found, in the online version, at http://dx.doi.org/10.1016/j.arabjc.2016.10.007.
Appendix A
Supplementary material
Supplementary Figs. 1–3 and Tables 1–4
Supplementary Figs. 1–3 and Tables 1–4
Supplementary material contains Figs. 1–3 and Tables 1–4.


