

Translate this page into:
DFT analysis and bioactivity of 2-((E)-(4-methoxybenzylimino)methyl)phenol and its Ni(II) and Pd(II) complexes
⁎Corresponding authors. amalina9487@salam.uitm.edu.my (Amalina Mohd Tajuddin), anouarelhassane@yahoo.fr (El Hassane Anouar)
-
Received: ,
Accepted: ,
This article was originally published by Elsevier and was migrated to Scientific Scholar after the change of Publisher.
Peer review under responsibility of King Saud University.
Abstract
This paper reports the synthesis, characterisation and DFT analysis of an N,O bidentate Schiff base, ((E)-(4-methoxybenzylimino)methyl)phenol, (L1c) and its Ni(II) and Pd(II) complexes. The structures were elucidated via elemental analysis, UV–Visible, NMR, IR and single crystal X-ray diffraction. Complexation of L1c with Ni(II) and Pd(II) was observed to induce different degrees of bathochromic effect on n → π∗ and π → π∗ electronic transitions. A comparison of the experimental data of UV–Visible, NMR, IR and X-ray with those calculated using DFT and TD-DFT methods where five hybrid functionals were tested in gas, IEF-PCM and SS-PCM models was also carried out. The results show that the reproduction of maximum absorption bands n → π∗ and π → π∗ is strongly related to the tested hybrid functionals and solvatochromic effects. Relatively good concordance was obtained between experimental and calculated NMR chemical shifts, IR and X-ray parameters. A bioactivity evaluation against HCT116 and Escherichia coli displayed that the parent ligand L1c is a more superior anticancer and antibacterial agent than the positive controls of 5FU and gentamicin respectively. However, both complexes showed poor activity as anticancer agent and no activity observed against tested bacteria.
Keywords
Schiff base
Ni(II)
Pd(II)
HCT116
Escherichia coli
DFT

1 Introduction
Although Schiff bases have been synthesised and studied extensively their continuing interest is driven by their applications in various fields and potential use in industries (Schiff, 1864). They have been reported to show antibacterial (Khan et al., 2009; Chohan et al., 2006, 2004; Kabeer et al., 2001), anticancer (Tarafder et al., 2002), antifungal (Chohan et al., 2006; Guo et al., 2007) and antileishmanial (Taha et al., 2013) activities. Phenolic Schiff bases are powerful antioxidants and free radical scavengers (Mohammed Khan et al., 2012a,b). The presence of a C⚌N (azomethine) functional group bearing lone electron pair of electrons in Schiff bases is responsible for their ability to adsorb onto metal surfaces, rendering them effective corrosion inhibitors for various metals such as mild steel (Abdul Ghani et al., 2014; Zainoldin et al., 2012), copper (Li et al., 1999; Ju et al., 2008), and aluminium (Negm and Zaki, 2008; Yurt et al., 2006) in acidic media (Sauri et al., 2013). In the field of coordination chemistry, Schiff bases are widely used as ligands (Mohd Tajuddin et al., 2010). Schiff bases are versatile compounds as privileged ligands, and are attractive due to their ease of synthesis. They are able to coordinate with different metals in various oxidation states to form a wide range of complexes (Ebrahimipour et al., 2014). In this regard, palladium(II) and nickel(II) Schiff base complexes have attracted much attention due to their useful applications in both chemical and biological processes (Ebrahimipour et al., 2014). Many reports have shown that these metal complexes have been used in catalysis, especially in carbon-carbon bond formation, such as Heck (Pattanayak et al., 2013), Suzuki (Cui et al., 2010) and oxidation (Ramakrishna et al., 2010) reactions. They show excellent catalytic activities in various reactions at high temperatures (>100 °C) and in the presence of moisture (Gupta and Sutar, 2008).
Quantum chemical calculations are powerful tools to support experimental spectroscopic data such as 1H and 13C NMR chemical shifts (Gauss, 1992, 1993, 1995), UV–vis absorption (Bak et al., 1995; Bauernschmitt and Ahlrichs, 1996; Casida et al., 1998) and X-ray structure parameters (Mendoza-Wilson and Glossman-Mitnik, 2005; Vázquez-Vuelvas et al., 2011). In order to predict excited states, several approaches have been utilised including the TD-DFT method (Bauernschmitt and Ahlrichs, 1996; Casida et al., 1998; Furche and Ahlrichs, 2002; Quartarolo and Russo, 2011; Ramos Sousa et al., 2012; Alberto et al., 2014a,b; Mazzone et al., 2013). Numerous studies proved that the hybrid functionals B3LYP and PBE0 are appropriate to estimate the excited state energies of natural compounds (Jacquemin et al., 2007; Jacquemin et al., 2004, 2006, 2007; Woodford, 2005). We previously showed that B3P86 and B3LYP hybrid functionals were suitable to reproduce the first excited state of a series of natural polyphenols, such as flavonoids and chalcones (Anouar et al., 2012). In a recent study, Lumpi et al. used B3LYP, PBE0 and M06-2X hybrid functionals to predict the absorption and emission spectra of oligothiophene-based compounds and showed that the M06-2X hybrid functional gave more accurate results than PBE0 and B3LYP (Lumpi et al., 2013). Quartarolo and Russo applied TD-DFT (using PBE0 hybrid functional in gas and CPCM solvent models) and ab initio multi-Ref. coupled cluster with the resolution of identity approximation (RICC2) approaches to predict the UV/vis spectra of pyranoanthocyanins, a class of derived anthocyanin molecules; they concluded that the use of larger basis sets results in little improvement of excitation energies, and that the conformational effect has a slight influence on the λMAX predictions (i.e., λMAX of the weighted Boltzmann and that of the stable conformer show similar values) (Quartarolo and Russo, 2011). In another study, the pure hybrid functionals B3LYP and PBE0, and long-range corrected hybrid functionals ωB97X and ωB97XD have been tested to predict the absorption electronic spectra of the isopentaphyrin derivative and its lutetium complex; the results showed that the reproduction of absorption bands was dependent on the absorption band types (e.g., the lowest excitation energy band for the free-base isopentaphyrin is well predicted by the ωB97XD hybrid functional) (Ramos Sousa et al., 2012).
Regarding the 1H and 13C NMR, the gauge-independent atomic orbital (GIAO) method is one of the most common approaches used to calculate nuclear magnetic shielding tensors (σiso) (Wolinski et al., 1990; Cheeseman et al., 1996).
In the present study, L1c phenolic Schiff base and its complexes, Ni(L1c)2 and Pd(L1c)2, were synthesised (Figs. 1 and 2). The current study aimed to determine complexation effect on n → π∗ and π → π∗ maximum absorption bands of L1c phenolic Schiff base by using TD-DFT hybrid functionals B3LYP, B3P86, CAM-B3LYP, M06-2X and PBE0 combined with LanL2DZ basis set in gas, and in a polarisable continuum model (PCM), for which IEF-PCM and SS-PCM formalisms are considered. In addition, the metal complexation effects were also tested on 1H and 13C NMR chemical shifts, IR vibrational modes and X-ray crystallographic data using the same hybrid functionals. The biological activity of L1c and its complexes was evaluated against human colorectal cancer cell line HCT116 and Gram negative bacteria E. coli.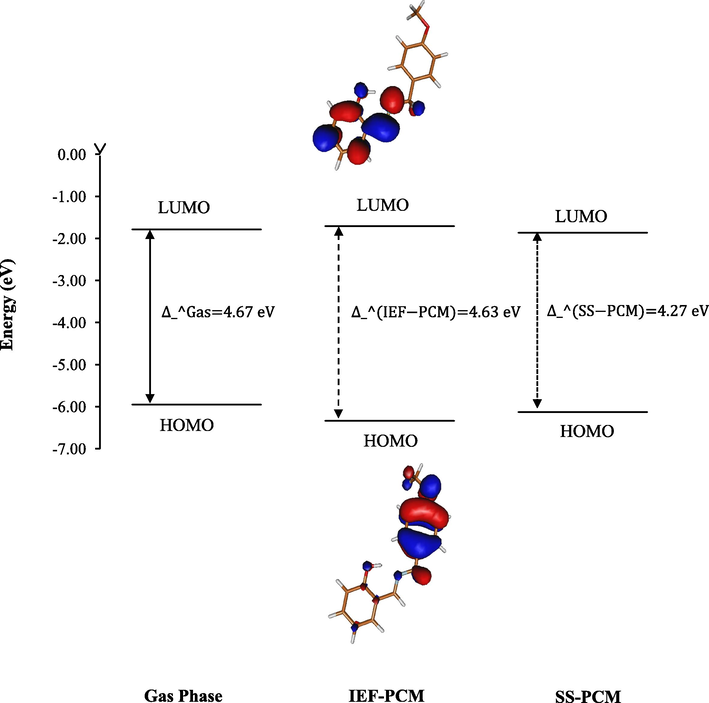
HOMO and LUMO energies of L1c in gas, and solvent obtained at the B3LYP level of theory.
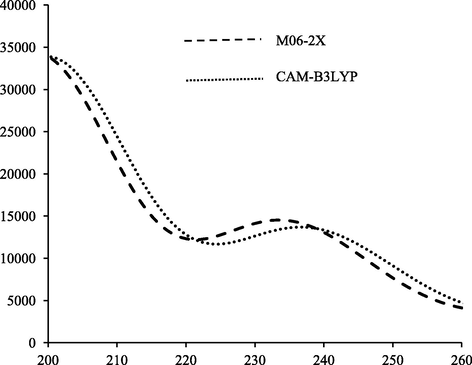
The predicted UV–vis spectra of L1c obtained using M06-2X and CAM-B3LYP functionals.
2 Materials and methods
All chemicals and solvents were used as purchased. Solvents were dried and freshly distilled prior to usage. Microanalyses for C, H and N were determined using a Thermo Finnigan Flash Elemental Analyzer 2000. Melting points were determined in evacuated capillaries using Buchii-B454 and were not corrected. 1H and 13C NMR spectra were recorded on a Bruker Varian spectrometer (300 MHz) in deuterated CDCl3. Chemical shifts (δ) were reported in ppm relative to Si(CH3)4, using the residual solvent resonances as internal references. The UV–vis spectra were obtained in chloroform in the 200–900 nm range using Perkin Elmer UV–vis Lambda 35 spectrophotometer at room temperature. The infrared spectra (IR) in KBr pellets were recorded using a Perkin Elmer Spectrum GX spectrophotometer (Perkin Elmer, Waltham, MA, USA) in the range of 400–4000 cm−1. Single crystal X-ray experiments were performed on Bruker D-QUEST diffractometer (Bruker, AXS Inc., Madison, WI, USA) using graphite-monochromated Mo-Kα radiation (λ = 0.71073 Å).
2.1 Synthesis of Schiff base L1c
An ethanolic solution of salicylaldehyde (40 mmol, 4.8897 g) was added dropwise into 4-methoxybenzylamine (40 mmol, 5.6979 g) in 10 mL ethanol in a round-bottomed flask to give a bright yellow solution. The mixture was stirred for 15 min (Scheme 1). The mixture was left in an ice bath upon which a yellow semicrystalline solid appeared. The solid was filtered off, washed with ice-cold ethanol and air-dried at room temperature. The resulted product was identified as 2-((E)-(4-methoxybenzylimino)methyl)phenol, a phenolic Schiff base named L1c. Yellow solid; yield, 68%; m.p. 62–65 °C. Anal. Calcd. for C15H15NO2 (241.29 g mol−1): C, 74.67; H, 6.27; N, 5.80; Found: C, 74.77; H, 6.28; N, 5.97. IR (KBr, cm−1): 3457 (OH), 2935 (C—H stretch), 1630 (C⚌N), 1326 (C—N), 1248 (C—O). UV–vis (CHCl3) λmax (ε, M−1 cm−1) = 258 (8500), 287 (11,250). 1H and 13C NMR (300 MHz, CDCl3) are presented in Table 1 and Table 1S in Supplementary Materials.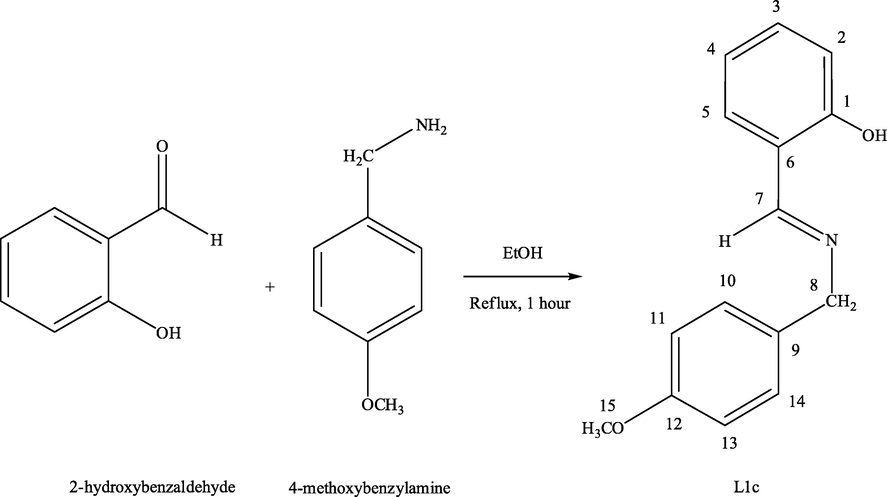
Synthesis of phenolic Schiff base L1c.
B3LYP
B3P86
CAM-B3LYP
M06-2X
PBE0
Exp.
Gas
IEF-PCM
Gas
IEF-PCM
Gas
IEF-PCM
Gas
IEF-PCM
Gas
IEF-PCM
1H NMR
H1
13.6
13.7
13.9
13.9
13.6
13.5
13.3
13.4
13.7
13.8
13.5
H2
7.3
7.1
7.1
7.1
7.3
6.9
7.4
7.3
7.2
7.1
6.9
H3
7.3
7.3
7.2
7.2
7.3
7.3
7.4
7.4
7.2
7.3
7.3
H4
6.9
7.0
6.8
6.9
6.9
7.3
7.0
7.1
6.9
6.9
7.3
H5
7.0
7.2
7.0
7.1
7.1
7.3
7.2
7.3
7.0
7.1
7.3
H7
8.3
8.3
7.9
8.0
8.2
8.4
8.4
8.4
8.1
8.1
8.4
H8
4.9
5.0
5.2
5.2
4.8
4.8
4.6
4.8
5.0
5.1
4.8
H10
7.0
7.1
6.9
7.0
7.0
7.3
7.1
7.2
7.0
7.1
7.3
H11
7.2
7.0
7.1
7.0
7.2
6.9
7.3
7.1
7.1
7.0
6.9
H13
6.6
6.7
6.6
6.7
6.6
6.9
6.7
6.8
6.6
6.7
6.9
H14
7.5
7.3
7.4
7.3
7.5
7.3
7.6
7.4
7.5
7.3
7.3
H15
4.1
4.0
4.5
4.3
4.2
3.8
3.7
3.6
4.2
4.1
3.8
13C NMR
C1
163
160
163
162
161
160
150
156
159
161
165
C2
119
116
119
118
119
118
113
120
114
118
117
C3
131
129
132
132
132
132
125
133
128
132
132
C4
117
116
117
118
118
118
111
120
116
118
119
C5
131
129
131
131
132
132
123
132
127
132
131
C6
117
115
117
117
116
116
110
118
113
117
116
C7
167
166
167
169
167
169
159
168
155
169
161
C8
64
62
63
63
63
63
53
61
64
63
63
C9
127
126
127
128
127
128
121
130
125
128
129
C10
126
125
127
127
127
128
120
128
111
127
114
C11
118
115
119
118
119
118
112
120
126
118
130
C12
157
154
156
155
155
154
145
152
152
155
158
C13
110
108
110
110
111
111
104
112
126
111
130
C14
125
122
125
124
126
125
118
126
111
125
114
C15
61
60
62
63
61
62
50
59
57
63
55
2.2 Synthesis of Pd(L1c)2 and Ni(L1c)2 complexes
Pd(OAc)2 (2.5 mmol, 0.5618 g) in 10 mL of MeCN was added to a solution of L1c (5 mmol, 1.2074 g) in 10 mL of MeCN (Scheme 2). The resulting mixture was then stirred and refluxed for 4 h upon which a turmeric yellow solid was formed. The solid formed was filtered off, washed with ice-cold MeCN and air-dried at room temperature. The solid product was recrystallised from chloroform yielding yellow crystal. Turmeric yellow solid; yield, 91%; m.p. 230–238 °C. Anal. Calcd. for C30H28N2O4Pd (586.97 g mol−1): C, 61.39; H, 4.81; N, 4.77; Found: C, 61.63; H, 3.67; N, 4.71. IR (KBr, cm−1): 2926 (C—H stretch), 1606 (C⚌N), 1342 (C—N), 1318 (C—O), 596 (Pd—N), 434 (Pd—O). UV–vis (CHCl3) λmax (ε, M−1 cm−1) = 285 (23,750), 399 (3000). 1H and 13C NMR (300 MHz, CDCl3) are presented in Table 2 and Table 2S.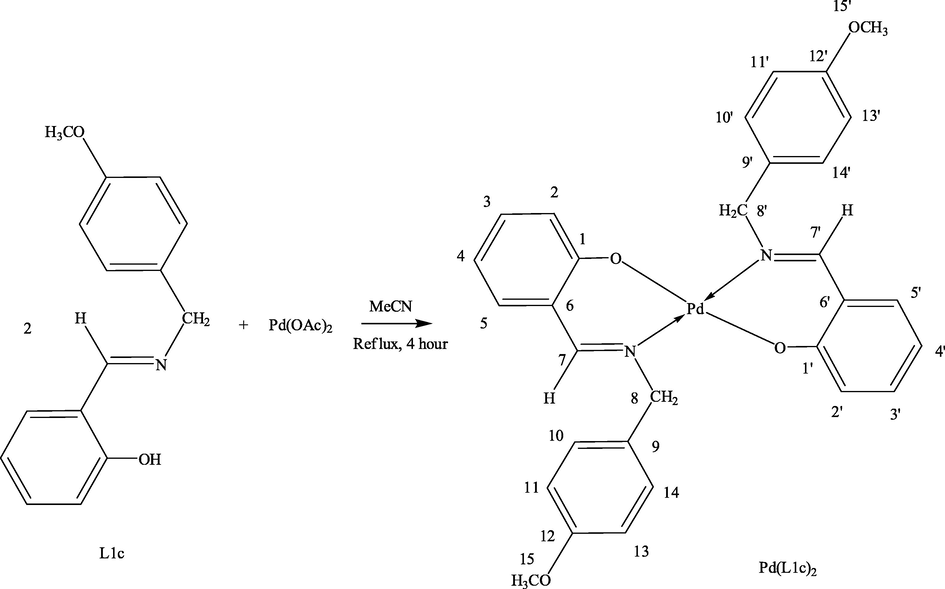
Synthesis of Pd(L1c)2 complex.
B3LYP
B3P86
CAM-B3LYP
M06-2X
PBE0
Exp.
Gas
IEF-PCM
Gas
IEF-PCM
Gas
IEF-PCM
Gas
IEF-PCM
Gas
IEF- PCM
1H NMR
H2
6.8
6.8
6.8
6.9
6.8
6.9
6.9
7.0
6.8
6.9
6.6
H3
7.0
7.1
7.0
7.2
7.0
7.2
7.0
7.2
7.0
7.2
7.2
H4
6.5
6.6
6.5
6.8
6.5
6.7
6.5
6.8
6.5
6.8
7.2
H5
6.6
6.8
6.6
7.0
6.6
7.0
6.7
7.0
6.6
7.0
7.4
H7
7.6
7.7
7.5
7.7
7.6
7.7
7.5
7.6
7.5
7.7
7.7
H8
6.3
6.1
6.4
4.6
6.2
4.6
5.8
4.6
6.4
4.6
5.0
H10
6.8
7.0
6.8
7.1
6.8
7.1
6.9
7.1
6.8
7.1
7.4
H11
6.9
6.8
6.9
7.0
6.9
6.9
6.9
7.0
6.9
7.0
6.6
H13
6.3
6.5
6.3
6.6
6.3
6.6
6.5
6.7
6.3
6.6
6.6
H14
7.9
7.7
7.9
7.7
8.0
7.8
8.1
7.8
7.9
7.7
7.4
H15
4.0
3.8
4.0
4.4
4.0
4.5
4.0
4.4
4.0
4.4
3.9
13C NMR
C1
164
163
159
162
162
162
160
160
162
162
163
C2
125
125
159
125
126
125
128
128
126
125
163
C3
135
135
120
136
136
136
136
136
136
136
120
C4
119
119
133
119
119
119
120
120
119
119
135
C5
137
138
129
138
138
138
137
138
137
138
130
C6
122
122
133
122
120
120
122
124
121
122
134
C7
165
165
155
166
167
167
167
166
166
166
159
C8
69
68
64
68
69
69
67
67
68
67
59
C9
134
134
128
134
133
133
135
135
133
134
129
C10
131
131
114
132
131
132
132
132
131
132
114
C11
120
120
130
120
121
120
122
122
121
120
131
C12
159
159
154
158
157
156
155
155
158
158
158
C13
114
115
130
115
115
115
116
116
115
115
131
C14
134
134
114
134
135
134
135
135
135
134
114
C15
66
67
61
67
66
67
63
62
66
67
55
In a similar procedure, nickel(II) acetate tetrahydrate, Ni(OAc)2·4H2O (2.5 mmol, 0.6216 g) was used, which resulted in the formation of Ni(L1c)2 complex as a green solid. X-ray quality green single crystals were obtained by slow evaporation in chloroform at room temperature. Green solid; yield, 43%; m.p. 196–199 °C. Anal. Calcd. for C30H28N2O4Ni (539.25 g mol−1): C, 66.82; H, 5.23; N, 5.19; Found: C, 67.03; H, 5.28; N, 5.15. IR (KBr, cm−1): 2925 (C—H stretch), 1605 (C⚌N), 1391 (C—N), 1325 (C—O), 598 (Ni—N), 437(Ni—O). UV–vis (CHCl3) λmax (ε, M−1 cm−1) = 297 (5000), 389 (2500).
2.3 Computational methods
Ground-state geometry optimisation of L1c phenolic Schiff base, Ni(L1c)2 and Pd(L1c)2 complexes was carried out using five different hybrid functionals B3LYP, B3P86, CAM-B3LYP, M06-2X and PBE0 combined with LanL2DZ basis set (Becke, 1993). The frequency analyses were performed at the same level of theory. The ground state minima were confirmed by the absence of imaginary frequencies. The vibrational modes were calculated at the same level of theory and scaled by a factor of 0.9679 (Andersson and Uvdal, 2005).
Excited singlet state (ES) energies were calculated using TD-DFT method. The maximum absorption bands, vertical electronic excitations and oscillator strengths (f > 0 for allowed transition) were calculated (Furche and Ahlrichs, 2002; Scalmani et al., 2006). The predicted 1H and 13C NMR magnetic isotropic shielding tensors (σ) were calculated using the standard Gauge-Independent Atomic Orbital (GIAO) approach (Gauss, 1993), using the aforementioned hybrid functionals. The isotropic shielding values were used to calculate the isotropic chemical shifts δ with respect to tetramethylsilane (Si(CH3)4). δiso(X) = σTMS(X) − σiso(X), where δiso is isotropic chemical shift and σiso isotropic shielding constant. The predicted chemical shifts were obtained using the equation δexp = aδcal + b, where δcal = δiso.
The solvent effects were taken into account implicitly using polarisable continuum model (PCM) (Tomasi et al., 2005). In this model, the solute is embedded into a shape-adapted cavity surrounded by a dielectric continuum solvent, described by its dielectric constant (e.g., εCDCl3 = 4.7113). The PCM has been reported to correctly model major solvent effects such as electrostatic effects of the medium providing no specific solute-solvent interactions such as hydrogen bond interactions, dipole-dipole interactions, or induced dipole-dipole interactions are considered (Jacquemin et al., 2009). Recently, Liu et al. reported that dipole-dipole interactions between coumarin and solvent molecules lead to large red shifts (Liu et al., 2013). For excited state energy calculations or time-dependent density functional theory (TD-DFT) calculations, solvent effects were considered by using IEF-PCM and state-specific solvation (SS-PCM) (Improta et al., 2006, 2007).
In a previous study, we tested both models to predict λMAX of terrein stereoisomers using different hybrid functionals, and the results proved that combination of SS-PCM formalism with M06-2X hybrid functional is reliable for excited-state predictions (Lumpi et al., 2013). All theoretical calculations were performed using Gaussian 09 package (Trucks et al., 2009).
3 Results and discussion
3.1 Ultraviolet-visible spectroscopy
The experimental and calculated n → π∗ and π → π∗ maximum absorption bands of L1c, Ni(L1c)2 and Pd(L1c)2 are reported in Tables 3 and 4, respectively.
Gas
IEF-PCM
SS-PCM
Exp.
λMAX
EMAX
f
λMAX
EMAX
f
λMAX
EMAX
f
λMAX
EMAX
B3LYP
L1c
327
3.80
0.09
323
3.84
0.11
310
4.00
0.08
287
4.33
Ni(L1c)2
404
3.07
0.07
400
3.10
0.08
397
3.12
0.06
389
3.20
Pd(L1c)2
419
2.96
0.04
416
2.98
0.08
412
3.01
0.06
399
3.12
B3P86
L1c
327
3.79
0.09
324
3.83
0.10
311
3.99
0.06
287
4.33
Ni(L1c)2
403
3.08
0.06
401
3.09
0.07
398
3.11
0.06
389
3.20
Pd(L1c)2
419
2.96
0.06
416
2.98
0.08
412
3.01
0.06
399
3.12
CAM-B3LYP
L1c
295
4.21
0.14
292
4.25
0.18
289
4.29
0.13
287
4.33
Ni(L1c)2
332
3.73
0.23
332
3.73
0.27
327
4.40
0.21
389
3.20
Pd(L1c)2
344
3.60
0.18
344
3.61
0.23
339
3.66
0.17
399
3.12
M06-X2
L1c
289
4.29
0.14
286
4.33
0.18
284
4.37
0.14
287
4.33
Ni(L1c)2
314
3.94
0.30
316
3.92
0.35
389
3.20
Pd(L1c)2
331
3.74
0.22
332
3.74
0.24
327
3.79
0.18
399
3.12
PBE0
L1c
319
3.88
0.07
317
3.92
0.11
304
4.08
0.11
287
4.33
Ni(L1c)2
379
3.27
0.08
378
3.28
0.11
374
3.31
0.08
389
3.20
Pd(L1c)2
397
3.12
0.08
395
3.14
0.11
391
3.18
0.08
399
3.12
Gas
IEF-PCM
SS-PCM
Exp.
λMAX
EMAX
f
λMAX
EMAX
f
λMAX
EMAX
f
λMAX
EMAX
B3LYP
L1c
255
4.86
0.32
256
4.84
0.33
252
4.93
0.34
230
5.41
Ni(L1c)2
297
4.18
0.16
262
4.73
0.31
297
4.18
0.09
234
5.31
Pd(L1c)2
296
4.19
0.21
297
4.18
0.34
294
4.22
0.21
246
5.06
B3P86
L1c
252
4.91
0.32
254
4.89
0.33
249
4.97
0.28
230
5.41
Ni(L1c)2
302
4.11
0.05
259
4.78
0.20
298
4.16
0.07
234
5.31
Pd(L1c)2
294
4.21
0.23
296
4.20
0.36
293
4.24
0.23
246
5.06
CAM-B3LYP
L1c
238
5.21
0.30
240
5.18
0.38
238
5.21
0.31
230
5.41
Ni(L1c)2
222
5.58
0.18
236
5.24
0.50
232
5.33
0.66
234
5.31
Pd(L1c)2
229
5.43
0.83
232
5.34
0.83
227
5.46
0.75
246
5.06
M06-X2
L1c
235
5.28
0.33
236
5.25
0.42
235
5.29
0.34
230
5.41
Ni(L1c)2
217
5.70
1.23
221
5.61
1.47
234
5.31
Pd(L1c)2
225
5.51
0.61
228
5.45
1.40
220
5.64
0.49
246
5.06
PBE0
L1c
246
5.05
0.21
251
4.93
0.40
244
5.09
0.32
230
5.41
Ni(L1c)2
280
4.42
0.14
261
4.74
0.12
280
4.43
0.13
234
5.31
Pd(L1c)2
281
4.41
0.27
282
4.39
0.40
280
4.44
0.24
246
5.06
The spectra were recorded in chloroform (CHCl3) where the maximum absorption bands λMAX due to n → π∗ for L1c, Ni(L1c)2 and Pd(L1c)2 were detected at 287, 389 and 399 nm respectively. Upon complexation, there is a significant increase in energy level difference between the non-bonding molecular orbital (n) with the pi anti-bonding molecular orbital (π∗). This shift to longer wavelengths with Δλ of about 100 nm reflects a large bathochromic shift or a red shift caused by the change in the electronic environment of the ligand as the result of chelation with Ni(II) and Pd(II).
The λMAX for π → π∗ transition for L1c, Ni(L1c)2 and Pd(L1c)2 were observed at 230, 234 and 246 nm, respectively. There is a slight increase of about 4–16 nm indicating a smaller degree of bathochromic shift where the energy level difference between π and π∗ molecular orbitals became only slightly bigger upon complexation with Ni(II) and Pd(II). Fixing the energy level of the π∗ orbital arbitrarily, the experimental values indicated that both the n and π orbitals became stabilised to lower energy levels upon complexation with n experiencing a bigger degree of stabilisation than π.
The calculated λMAX values were obtained in gas and solvent media using polarisable continuum model (PCM). For solvated model, the integral equation formalism (IEF-PCM) and surface and simulation (SS-PCM) formalism were applied. The predictions were carried out using B3LYP, B3P86, CAM-B3LY, M06-2X and PBE0 hybrid functionals. The comparison of the experimental and calculated values is discussed below.
3.1.1 n → π∗ absorption band
Calculated n → π∗ absorption bands for L1c, Ni(L1c)2 and Pd(L1c)2 are reported in Table 3. The B3LYP, B3P86 and PBE0 hybrid functionals failed to reproduce the experimental n → π∗ absorption band for L1c. They underestimate the experimental value by 40, 40 and 32 nm, respectively. In IEF-PCM and SS-PCM formalisms, the variations were reduced to 36, 37, 30 nm, and 23, 24 and 17 nm, respectively. However, the calculated n → π∗ absorption bands for L1c by using M06-2X and CAM-B3LYP hybrid functionals are comparable with the experimental values. The M06-2X hybrid functional gave better reproduction than CAM-B3LYP. Indeed, by using M06-2X (CAM-B3LYP) the variation to the experimental value in gas, IEF-PCM and SS-PCM is quite small of 2 (8), 1 (5) and 3 (2) nm, respectively.
In agreement with the experimental observation, a large bathochromic effect upon complexation i.e. shifting to significantly longer wavelengths was observed in all the calculated λMAX. This red shift can be explained by the stabilisation of HOMO orbitals. For instance, by using B3LYP hybrid functional, HOMO orbital was stabilised by 0.38 and 0.18 eV in IEF-PCM and SS-PCM, respectively. However, LUMO orbital was only slightly stabilised in IEF-PCM and SS-PCM, with relative energies of 0.08 and 0.07 eV, respectively (Fig. 1). As can be seen from HOMO and LUMO orbitals delocalisation in Fig. 1, HOMO-LUMO electronic transition induces a charge transfer from methoxybenzyl to salicyl moiety in L1c.
In a previous study (Anouar et al., 2012), we tested several hybrid functionals and basis sets to predict λMAX of a series of polyphenols; we showed that B3LYP and B3P86 are the most reliable for reproducing the maximum absorption bands. In another study, Jacquemin et al. (2004) showed that PBE0 and B3LYP were most suitable to reproduce λMAX of a series of anthraquinones. In fact, the reproducibility of λMAX depends mainly on the basic skeleton of the studied compounds, which explains the results obtained here. Recently, in an unreported study, we tested different hybrid functionals to predict λMAX of terrein stereoisomers; the results showed that the best reproductions were obtained using M06-2X hybrid functional and SS-PCM formalism.
3.1.2 π → π∗ absorption band
The experimental absorption at 230 nm in UV–vis spectrum of L1c ligand corresponds to π → π∗ electronic transition (Table 4) between HOMO-3 (or HOMO-2) and LUMO orbitals. In gas phase, this absorption band was well reproduced by using M06-2X and CAM-B3LYP hybrid functionals with standard deviations of 5 and 8 nm, respectively (Fig. 2).
On the contrary, the B3LYP, B3P86 and PBE0 hybrid functionals failed in reproduction of π → π∗ with standard deviations of 25, 22 and 16 nm, respectively. In IEF-PCM, a bathochromic shift of 1–4 nm for π → π∗ was obtained by using different tested hybrid functionals. In the SS-PCM formalism, a bathochromic shift of 1–6 nm was obtained using different hybrid functionals with regard to IEF-PCM model. In summary, for both electronic transitions n → π∗ and π → π∗ the best reproductions were obtained using M06-2X and CAM-B3LYP hybrid functionals in gas, IEF-PCM and SS-PCM.
3.2 1H and 13C NMR spectroscopy
The structure of the Schiff base L1c and its complexes Ni(L1c)2 and Pd(L1c)2 were elucidated via NMR. The 1H and 13C NMR spectra of the synthesised compounds were recorded in deuterated chloroform (CDCl3) using TMS as internal standard. The experimental 1H NMR spectrum of L1c Schiff base showed the presence of an iminic proton (HC⚌N—) at δ 8.4 (1H, s, H7), methylene protons (—CH2—) at δ 4.8 (2H, s, H8), methoxy protons (Ar—OCH3) at δ 3.8 (3H, s, H15), phenolic proton at δ 13.5 (1H, s, H1) and multiplets of aromatic protons δ 6.3–7.3 (Table 1 and Table 1S). The predicted 1H NMR chemical shifts were calculated using five hybrid functionals (Table 1) as mentioned in Section 2.3. The correlation coefficients of regression curves between the experimental and predicted 1H NMR chemical shifts are reported in the Supplementary material (Table 3S). In the gas phase, the best correlation was obtained using B3LYP hybrid functional with a R2 of 98.76% (Table 3S). However, the variation between the other hybrid functionals is varied from 0.16 to 2.177. Taking the solvent effects into consideration, the correlation curves are relatively improved compared with those in gas phase (Table 3S). For instance, using B3P86 a variation of 1.23% was obtained between R2 in PCM and gas phases. The complexation of L1c with Pd(II) induces the disappearance of phenolic proton at 13.5 ppm, due to its deprotonation, and the related oxygen involved in an ionic bond with central Pd(II). The rest of the 1H NMR chemical shifts were slightly affected by the complexation. For instance, small downfield and upfield shifts were observed for methylene —CH2— proton (by 0.2 ppm) and olefinic proton (by 0.7 ppm), respectively. The predicted 1H NMR chemical shifts for Pd(L1c)2 obtained using the tested hybrid functionals are shown in Table 2. Likewise, theoretical calculations showed downfield and upfield shifts of 1H NMR chemical shifts in the complexes. The correlation coefficients of regression curves between the experimental and the predicted 1H NMR chemical shifts for Pd(L1c)2 complex are reported in the Supplementary material (Table 4S). In PCM, except B3LYP, all tested hybrid functionals could reproduce 1H NMR chemical shifts with an R2 of 90% (Table 4S).
The 13C NMR spectrum of L1c Schiff base displayed fifteen carbon signals: one methoxy (—OCH3), one methylene bridge (—CH2—), nine methine (—CH—) and four quaternary carbons (Scheme 1 and Table 3). The 13C NMR chemical shifts (with respect to TMS) were calculated using five tested hybrid functionals in gas and solvent by using IEF-PCM formalism (Tables 1 and S1). As can be seen from the correlation coefficients obtained between the experimental and the predicted 13C NMR chemical shifts (Table 3S), all the tested hybrid functionals lead to similar results with an R2 of 93 % in gas and solvent models. Similarly, the complexation of L1c induced downfield and upfield shifts of some 13C NMR chemical shifts. However, these can be considered negligible, as the variation between 13C NMR chemical shift of L1c and Pd(L1c)2 was too small, between 1 and 4 ppm. In the complexes, the best correlation between experimental and predicted 13C NMR chemical shifts was obtained using M06-2X hybrid functional, with an R2 of 78% (Table 4S).
In summary, the correlation curves (or correlation coefficients) obtained with 1H NMR were better than those with 13C NMR, probably due to the sensitivity of 1H compared to 13C, which has low isotropic abundance. Theoretically, the predicted 13C NMR chemical shifts were less independent of the choice of methodology (i.e., similar R2 obtained with different hybrid functionals). On the other hand, the predicted 1H NMR chemical shifts were more dependent on the skeleton form of the ligand or complex, and to the choice of methodology. For instance, in L1c, the best correlation was obtained using B3LYP hybrid functional, while in Pd(L1c)2, the best correlations were obtained using M06-2X, B3P86 and PBE0 hybrid functionals (Tables 3S and 4S).
3.3 Infrared spectroscopy
The experimental values of νC⚌N (C⚌N) recorded a decrease of 12 and 25 cm−1 when L1c was complexed with Ni(II) and Pd(II), respectively (Table 5). Following the Planck’s equation of E = hν, lowering the frequency indicates a weakening of the imine bond. This could be due to the inductive effect of the Lewis acid-base interaction between the ligand and the metal centre where a lone pair of electrons is donated by the imine N to the metal centre, forming an M—N dative covalent bond, reducing the electron density on the C⚌N. The opposite is observed to be true for νC—O. Upon complexation, the stretching frequency of C—O was shown to increase by 70 and 77 cm−1 for Ni(II) and Pd(II) complexes, respectively (Table 5). The M—O bond formed upon complexation is an ionic bond when the phenolic proton is replaced by the metal causing the C—O bond to become stronger with the octet completing transfer of an electron from M to O. Cal = Calculated; Scal = Scaled; Exp = Experimental.
Hybrid functionals
Vibration mode (cm−1)
L1c
Ni(L1c)2
Pd(L1c)2
Cal
Scal
Exp
Cal
Scal
Exp
Cal
Scal
Exp
B3LYP
1660
1607
1630
1642
1589
1618
1654
1601
1605
B3P86
1678
1624
1630
1686
1632
1618
1666
1612
1605
CAM-B3LYP
1710
1655
1630
1715
1660
1618
1711
1656
1605
M06-2X
1728
1672
1630
1718
1663
1618
1711
1656
1605
PBE0
1694
1639
1630
1700
1646
1618
1678
1624
1605
The calculated νC⚌N (C⚌N) stretching harmonic vibrational frequencies of L1c Schiff base and its complexes, Ni(L1c)2 and Pd(L1c)2, are also reported in Table 5.
The calculated vibrational frequencies were obtained using the tested hybrid functionals, and the obtained values were scaled by a factor of 0.9679 (Mendoza-Wilson and Glossman-Mitnik, 2005). For νC⚌N, the theoretical reproduction was successful with a low variation of 6 and 9 cm−1 obtained using B3P86 and PBE0 hybrid functionals. For Pd(L1c)2 complex, both B3LYP and B3P86 could well reproduce the experimental νC⚌N vibration, with variation of 4 and 7 cm−1, respectively. However in Ni(L1c)2, the reproduction of νC⚌N was less successful for all the tested hybrid functionals with variations ranging from 14 to 45 cm−1. The complexation of L1c induces a bathochromic shift of νC—O (C—O) at 1248 cm−1 to 1325 and 1348 cm−1 for Ni(L1c)2 and Pd(L1c)2, respectively. However, the complexation effect on the vibration modes theoretically depends on the method chosen. The best correlation was obtained through B3P86 hybrid functional where the complexation of L1c with Pd induces a decrease of vibration by 12 cm−1.
3.4 X-ray crystallography
Single crystals of Ni(L1c)2 and Pd(L1c)2 were subjected to X-ray crystallography investigation to determine their structures. The crystals were obtained by slow evaporation of chloroform solution at room temperature. Both complexes crystallised in monoclinic system with space group P21/c. The crystal system and refinement parameters for Ni(L1c)2 and Pd(L1c)2 are given in Table 6. The molecular structures of the complexes Ni(L1c)2 and Pd(L1c)2 with numbering scheme are shown in Figs. 3 and 4.
Compound
Ni(L1c)2
Pd(L1c)2
Empirical formula
C30H28N2O4Ni
C30H28N2O4Pd
Formula weight
539.26
586.94
Temperature (K)
−173
273
Wavelength (Å)
0.7107
0.7107
Crystal system
Monoclinic
Monoclinic
Space group
P21/c
P21/c
Unit cell dimensions (Å)
a = 12.184(2); b = 5.673(10); c = 17.762(3)
a = 12.329(4); b = 5.647(19); c = 18.291(6)
β (°)
β = 95.682(10)
β = 96.658(6)
Volume (Å3)
1221.92(4)
1264.90(7)
Z
4
2
Absorption coefficient (mm−1)
0.84
0.77
Crystal size (mm)
0.52 × 0.30 × 0.16
0.50 × 0.19 × 0.10
θ range (°)
1.7–32.7
1.7–28.4
Index ranges
−18 ⩽ h ⩽ 17
−16 ⩽ h ⩽ 16
−8 ⩽ k ⩽ 8
−7 ⩽ k ⩽ 7
−26 ⩽ l ⩽ 26
−24 ⩽ l ⩽ 20
F (0 0 0)
564
600
Goodness-of-fit on F2
1.091
1.072
Final R indices
R1 = 0.0308, wR2 = 0.0818
R1 = 0.0362, wR2 = 0.0802
R indices (all data)
R1 = 0.0385, wR2 = 0.0894
R1 = 0.0532, wR2 = 0.0865
CCDC no.
1,014,286
1,513,134
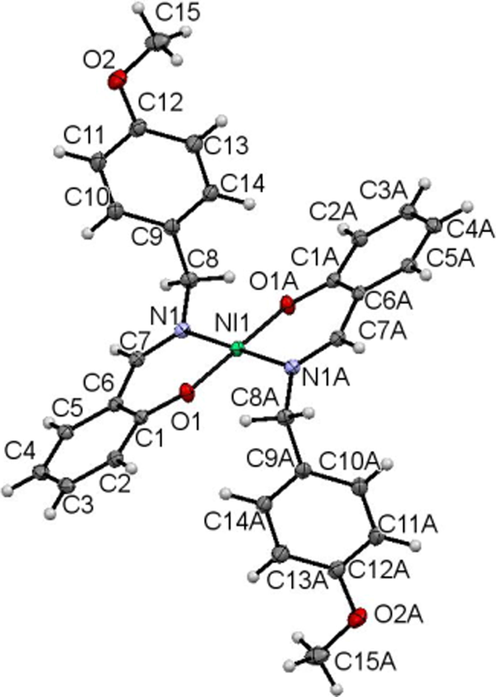
ORTEP diagram of Ni(L1c)2 drawn at 50% probability ellipsoids.
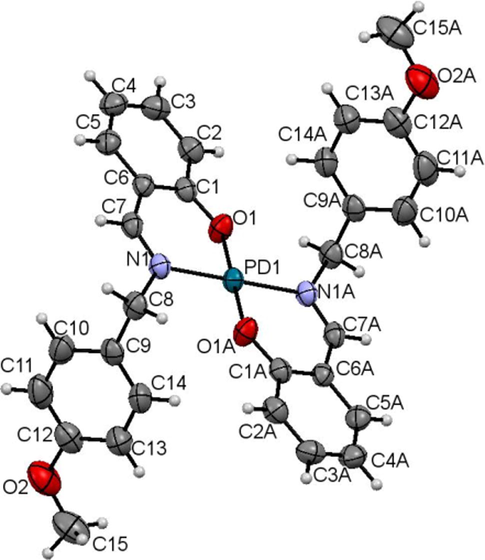
ORTEP diagram of Pd(L1c)2 drawn at 50% probability ellipsoids.
Both complexes are symmetrically generated at the metal centres. Each complex has two ligands coordinated to the metal via nitrogen and oxygen atoms in bidentate manner to form a distorted square planar environment. The bond angles about the central Ni1 atom of O1-Ni-N1 and O1A-Ni-N1A are 87.69(4) and 92.31(4), respectively. The bond angles about Pd1 are slightly less distorted as shown by the O1-Pd-N1 and O1A-Pd-N1A of 91.20(8) and 88.81(8)°, respectively.
The Ni1-N1, Ni1-O1, Pd1-N1 and Pd1-O1 lengths of 1.9191(11), 1.8407(9), 2.023(2) and 1.984(2) Å, respectively are consistent with the normal metal-O and metal-N bond lengths observed in other similar nickel(II) complexes (Bahron et al., 2011) and Pd(II) complexes (Mohd Tajuddin et al., 2010; Adrian et al., 2008). Other bond lengths and angles in the coordinated ligand are in normal ranges. The O1-C1, N1-C7 and N1-C8 bond lengths in both complexes are comparable (Table 7) and in agreement with those reported in the analogous complexes (Adrian et al., 2008).
Bond length/angle
Ni(L1c)2
Pd(L1c)2
O1-C1
1.3085(14)
1.310(3)
N1-C7
1.297(16)
1.286(3)
N1-C8
1.486(15)
1.486(3)
M-O1
1.8410(9)
1.9481(19)
M-N1
1.9200(11)
2.1023(4)
N1-M-O1
87.69(4)
88.81(8)
N1-M-O1A
92.31(4)
91.91(8)
Overall, the complexes display an essentially planar bidentate metal /O1/N1/C1/C6/C7 6-membered ring coordination with maximum deviation of 0.152 and 0.149 Å for Ni1 and Pd1 atoms, respectively. The O2/(C8-C15) p-methoxybenzyl groups in both complexes are planar with maximum deviation of 0.074(2) Å for C15 atom from the least square plane in the nickel complex. In both complexes the two methoxybenzyl groups are facing in opposite direction almost perpendicular to the 6-membered bidentate ring with dihedral angle of 82.77(5) and 82.45(10)° in nickel and palladium complexes respectively.
Z-matrix coordinates of L1c, Ni(L1c)2 and Pd(L1c)2 were calculated within the five tested hybrid functionals in gas and PCM (Table 5S). Generally, good agreements were obtained between calculated structural and experimental X-ray parameters (Table 6S). In both phases, the standard errors between the experimental and calculated bond lengths of L1c and its complexes Ni(L1c)2 and Pd(L1c)2 obtained with different hybrid functionals were very negligible with variation less than 0.09 Å. In the case of bond angles, the standard errors vary from 1 to 5°. These low values explain the good correlations obtained for bond lengths and bond angles (R2 ⩾ 90°). However, the torsion angle standard errors and correlation coefficient strongly depended on the form of Schiff base (free or coordinated to Ni and Pd). For the free Schiff base, all the torsion angles were well-reproduced (100%). However, for the complexes, the standard errors varied. For Pd(L1c)2, the standard errors were less than 3°, while for Ni(L1c)2 they were varied between 1° and 34°. The lowest standard errors were obtained with CAM-B3LYP, M06-2X. In summary, X-ray crystallography parameters were well-reproduced by different hybrid functionals.
3.5 Biological activity screening
Table 8 shows biological activity of L1c and its complexes against HCT116 and E. coli. The results reveal that the ligand L1c is more active as anticancer and antibacterial agents than its complexes. The ligand is about 17 times more potent in killing the HCT116 colorectal cancer cells than the complexes. Similarly, the ligand also showed a strong antibacterial activity against E. coli with inhibition zone of 19.33 mm, better than the positive control Gentamicin (15.50 mm). Surprisingly, the antibacterial activity disappeared when the ligand is complexed with nickel and palladium metals.
Compound
Empirical formula
Molecular weight (g/mol)
Colour
Anticancer activity against HCT116 (IC50, μM)
Antibacterial activity against E. coli (Zone of inhibition, mm)
L1c
C15H15NO2
241.29
Yellow
9.95 (active)
19.33 (active)
Pd(L1c)2
C30H28N2O4Pd
586.97
Turmeric yellow
>170.37 (not active)
0.00 (not active)
Ni(L1c)2
C30H28N2O4Ni
539.25
Green
>185.44 (not active)
0.00 (not active)
Positive control
5.76 5-FU
15.50 (Gentamicin)
4 Conclusion
((E)-(4-methoxybenzylimino)methyl)phenol Schiff base, named L1c and its complexes Ni(L1c)2 and Pd(L1c)2, were successfully synthesised. The molecular structures of the synthesised compounds were confirmed by spectroscopic and X-ray techniques. The experimental data were compared to the calculated DFT and TD-DFT calculation results. For UV–vis reproduction, the results showed that CAM-B3LY and M06-2X are the most suitable. NMR chemical shift predictions showed that the 1H NMR chemical shifts are strongly influenced by the tested hybrid functionals, whereas the 13C chemical shift is less influenced. The reproduction of the IR vibrations modes was also dependent on the tested hybrid functionals. Finally, the entire tested hybrid functionals were successfully reproduced as experimental X-ray parameters. The influence of complexation of L1c is more emphasised in UV–vis and IR spectroscopy. However, in the case of NMR chemical shifts and X-ray parameter predictions, the complexation effects are negligible. The chelation of nickel and palladium to the ligand L1c reduced significantly the anticancer and antibacterial property against the tested cell and microbe.
Acknowledgement
The authors would like to acknowledge the Ministry of Higher Education of Malaysia for the research funding through Research Acculturation Grant Scheme (600-RMI/RAGS 5/3 (8/2015) and Universiti Teknologi MARA for the use of research facilities and Universiti Kebangsaan Malaysia Center for Research and Instrumentation Management (CRIM) for the chemical crystallography studies.
References
- Malay. J. Anal. Sci.. 2014;18:507-513.
- Inorg. Chim. Acta. 2008;361:1261-1266.
- J. Chem. Theory Comput.. 2014;10:4006-4013.
- J. Comput. Chem.. 2014;35:2107-2113.
- J. Chem. Phys. A. 2005;109:2937-2941.
- Food Chem.. 2012;131:79-89.
- Acta Crystallogr. E. 2011;67:m1010-m1011.
- Theoret. Chim. Acta. 1995;90:441-458.
- Chem. Phys. Lett.. 1996;256:454-464.
- J. Chem. Phys.. 1993;98:5648-5652.
- J. Chem. Phys.. 1998;108:4439-4449.
- J. Chem. Phys.. 1996;104:5497-5509.
- J. Enzyme Inhib. Med. Chem.. 2004;19:161-168.
- J. Enzyme Inhib. Med. Chem.. 2006;21:193-201.
- J. Enzyme Inhib. Med. Chem.. 2006;21:95-103.
- Inorg. Chem. Commun.. 2010;13:81-85.
- Polyhedron. 2014;79:138-150.
- J. Chem. Phys.. 2002;117:7433-7447.
- J. Chem. Phys.. 2002;117:7433.
- Chem. Phys. Lett.. 1992;191:614-620.
- J. Chem. Phys.. 1993;99:3629-3643.
- Ber. Bunsen-Ges.. 1995;99:1001-1008.
- Carbohydr. Res.. 2007;342:1329-1332.
- Coord. Chem. Rev.. 2008;252:1420-1450.
- J. Phys. Chem.. 2006;125:054103.
- J. Phys. Chem.. 2007;127:074504.
- J. Chem. Phys.. 2004;121:1736-1743.
- J. Am. Chem. Soc.. 2006;128:2072-2083.
- J. Chem. Theory Comput.. 2007;4:123-135.
- Spectrochim. Acta Mol. Biomol. Spectrosc.. 2007;67:334-341.
- J. Chem. Theory Comput.. 2009;5:2420-2435.
- Corros. Sci.. 2008;50:865-871.
- Asian J. Chem.. 2001;13:496-500.
- Lett. Drug Des. Discov.. 2009;6:363-373.
- Corros. Sci.. 1999;41:1273-1287.
- J. Phys. Chem. C. 2013;117:14731-14741.
- ChemPhysChem. 2013;14:1016-1024.
- Can. J. Chem.. 2013;91:902-906.
- J. Mol. Struct-Theochem.. 2005;716:67-72.
- Med. Chem.. 2012;8:705-710.
- Med. Chem.. 2012;8:452-461.
- Acta Crystallogr. E. 2010;66 m1100–m1100
- Colloids Surface A. 2008;322:97-102.
- Polyhedron. 2013;51:275-282.
- J. Chem. Theory Comput.. 2011;7:1073-1081.
- Catal. Commun.. 2010;11:498-501.
- J. Phys. Chem. B. 2012;116:10816-10823.
- Mater. Res. Innov.. 2013;13:4.
- J. Chem. Phys.. 2006;124:094107.
- Just. Lieb. Ann. Chem.. 1864;131:118-119.
- Bioorg. Med. Chem. Lett.. 2013;23:3463-3466.
- J. Biochem. Mol. Biol. Biophys.. 2002;6:85-91.
- Chem. Rev.. 2005;105:2999-3093.
- Gaussian 09, Revision A.02. 2009.
- J. Mol. Struct.. 2011;987:106-118.
- J. Am. Chem. Soc.. 1990;112:8251-8260.
- Chem. Phys. Lett.. 2005;410:182-187.
- Appl. Surf. Sci.. 2006;253:919-925.
- Electrodeposition of salicylideneaniline and its corrosion behavior. In: Advanced Materials Research. Trans Tech Publ; 2012. p. :385-389.
- [Google Scholar]
Appendix A
Supplementary material
Supplementary data associated with this article can be found, in the online version, at http://dx.doi.org/10.1016/j.arabjc.2016.11.005.
Appendix A
Supplementary material
Supplementary data 1
Supplementary data 1


