

Translate this page into:
Growth phase diagram and X-ray excited luminescence properties of NaLuF4:Tb3+ nanoparticles
⁎Corresponding authors. luhb@fmmu.edu.cn (Hongbing Lu), wenlizhang1121@163.com (Wenli Zhang) wenli1121@fmmu.edu.cn (Wenli Zhang)
-
Received: ,
Accepted: ,
This article was originally published by Elsevier and was migrated to Scientific Scholar after the change of Publisher.
Abstract
X-rays are energy sources exhibiting extended penetration depths, and they have attracted increasing attention in industry and for clinical application. With the rapid development of nanomaterials and X-ray excited luminescent nanoparticles (XLNPs), new modalities for bioimaging and cancer therapy have been developed, such as X-ray luminescent computed tomography (XLCT) and X-ray excited photodynamic therapy (X-PDT). To meet the requirements of biomedical applications, XLNPs must exhibit high luminescence intensities, appropriate size distributions (less than100 nm) and negligible cytotoxicity. Due to the optical properties associated with f-electrons, rear earth (RE) elements are highly suitable for creating XLNPs. NaREF4 nanoparticles (NPs) have been shown to be suitable hosts with high luminescence intensities, controllable sizes, and biocompatibility for X-ray-based biomedical applications. Syntheses of NaLuF4 NPs doped with rare earth elements for upconversion applications have been systematically studied. However, for X-ray excited applications, the doping levels of the NPs must be totally different, which greatly affects the morphologies and sizes of the NaLuF4 NPs. Thus, in this paper, nucleation, phase transitions, morphologies and sizes, and luminescence properties of Tb3+-doped NaLuF4 NPs were systematically studied. OA-capped NaLuF4:Tb3+ NPs were synthesized via coprecipitation processes with different reaction temperatures and reaction times to study the nucleation mechanism systematically, and the morphologies, size distributions and crystal phases were characterized with TEM and XRD. The morphologies, size distributions and crystal phases of these NPs were seriously influenced by the reaction temperature and reaction time. At 295 ℃, the NP sizes increased with prolonged reaction time, and the crystalline phase was a mixture of cubic and hexagonal phases. At 300 ℃ and 310 ℃, the pure hexagonal phase was obtained after 20 min and 35 min reaction times, respectively. The luminescence strengths of these NPs were associated with the particle sizes, crystalline phases, and Tb3+ doping levels. Stronger luminescence was achieved with larger particle sizes and purer hexagonal crystal phases. In addition, the 15 % doping level for Tb3+ provided the maximum luminescence intensity. The present work provides insights into the mechanism of NaLuF4:Tb3+ nanocrystal growth.
Keywords
X-ray excited optical luminescence
Growth phase diagram
NaLuF4: Tb
X-ray Excited luminescent nanoparticles

1 Introduction
X-rays have been widely used in clinical diagnostic imaging and radiotherapy. In addition, due to the physical properties of high energy X-ray photons, which have unlimited penetration depths and eliminate the autofluorescence backgrounds seen in tissues with UV/Vis/NIR light sources, X-rays have also attracted considerable attention in new modalities of bioimaging and cancer therapy. In the past decade, with the assistance of nanotechnology, novel X-ray excited luminescent nanoparticle (XLNP)-based bioimaging and cancer therapies have been established, such as X-ray luminescent computed tomography (XLCT) and X-ray excited photodynamic therapy (X-PDT) (Gao et al., 2017, Zhang et al., 2017, Zhang et al., 2017, Gao et al., 2018, Liu et al., 2018, Pu et al., 2018, Zhang et al., 2018, Liu et al., 2019). In both XLCT and X-PDT, X-ray excited optical luminescence (XEOL) of the XLNPs is essential.
A wide range of XLNPs, such as LaF3:Ce3+, Gd2O2S, Tb2O3, LiYF4:Ce3+, SrAl2O4:Eu2+, GdEuCl2, NaGdF4:Eu3+, and NaLuF4:Tb3+, have been explored in the fields of X-PDT, XLCT, and X-ray excited optical imaging during the past 2 decades (Chen and Zhang 2006, Abliz et al., 2011, Bulin et al., 2013, Sudheendra et al., 2014, Zou et al., 2014, Chen et al., 2015, Kaščáková et al., 2015, Chen et al., 2017, Zhang et al., 2017, Zhang et al., 2018). Among these XLNPs, lanthanide (Ln)-doped XLNPs have attracted considerable interest due to their rich optical properties, which exhibit broad spectral ranges from 300 nm to 3000 nm with narrow emission bands. Notably, NaREF4 (RE: Rare earth) nanoparticles doped with Ln have been systematically studied as ideal upconversion nanoparticle (UCNP) hosts with high quantum yield efficiencies and minimal toxicities. Compared with NaGdF4 as the XLNP host, NaYF4 and NaLuF4 have been proven to emit stronger XEOL intensity (Ou et al., 2021, Pei et al., 2021). Due to the ample presence of electron/hole traps, NaLuF4 exhibits luminescence lasting for up to 30 days, which is suitable for in vivo excitation-free imaging and therapy to avoid radiation damage to tissues (Pei et al., 2021). However, similar to XLNPs, NaLuF4:Ln3+ studies on controlled syntheses, crystalline phase structures, and XEOL properties are still in their infancy (Sudheendra et al., 2014, Naczynski et al., 2015, Zhang et al., 2017, Zhang et al., 2018).
In contrast to the compositions, syntheses, and luminescence mechanisms of UNCPs, NaREF4-based XLNPs usually have only one doped species that serves as the luminescent center ion, such as Tb3+, Eu3+, Er3+, Tm3+ or Nd3+, without doping of Yb3+ or Nd3+. Yb3+ or Nd3+ dopants could be considered “impurities”, which are used to affect the crystalline phase, luminescent intensity, and nanoparticle sizes. Furthermore, the β-phases of NaLuF4 XLNPs are preferred because of their higher XEOL intensities compared with those of α-phase crystalline structures (Li et al., 2017, Zhang et al., 2019). Syntheses of β-NaLuF4 NPs doped with Yb3+, Tm3+, Er3+, Eu3+ and Tb3+, which were introduced for upconversion applications, have been systematically reviewed previously (Yi and Chow 2006, Jia et al., 2009, Shi et al., 2011, Zeng et al., 2012, Liu et al., 2013). However, for XEOL-related applications, the growth phase and morphology of a β-NaLuF4 host with a single lanthanide ion dopant serving as the luminescent center would differ from those of the UCNP NaLuF4.
It is important to systematically study nucleation, phase transitions, Ostwald ripening, and luminescence properties of single-doped NaLuF4 XLNPs. Thus, in this paper, a time–temperature-phase-size diagram was obtained from the effects of different reaction times and temperatures on the growth processes of NaLuF4 and constitutes a significant approach for size and phase control in NaLuF4 synthesis for the first time. In addition, the XEOL properties of as-synthesized NaLuF4:Tb3+ with different particle size and crystal phases have been systematically studied. This paper will provide an experimental and theoretical guidance for the lanthanide element doping design in the field of XEOL-based in vivo imaging and photodynamic therapy.
2 Materials and methods
2.1 Materials
LuCl3·6H2O and TbCl3·6H2O were purchased from Shanghai Yuanye Chemical Reagent Co., ltd. Oleic acid (OA, technical grade, 90 %), 1-octadecene (ODE, technical grade, 90 %), NH4F (ACS reagent, ≥98 %) and NaOH (reagent grade, ≥98 %) were purchased from Sigma-Aldrich.
2.2 Synthesis of NaLuF4:15 % Tb3+ NPs
OA-stabilized NaLuF4:15 % Tb3+ NPs were synthesized via a coprecipitation process adopted from the literature with slight modifications (Liu et al., 2013). LuCl3·6H2O (0.85 mmol) and 0.15 mmol of TbCl3·6H2O were mixed with 6 mL of OA and 15 mL of ODE in a 100 mL four-neck round bottom flask at room temperature. The mixture was heated to 160 ℃ with vigorous stirring under argon for 1 hr to form a homogenous solution. This solution was naturally cooled to room temperature. A 10 mL methanol stock solution containing 4 mmol of NH4F and 2.5 mmol of NaOH was injected into the flask at a rate of 1 mL/min with a syringe pump. The mixture was stirred vigorously at room temperature for 1 hr and at 60 ℃ for another 1 hr to evaporate the methanol. Subsequently, the mixture was degassed at 120 ℃ for 20 min and heated to the specific reaction temperature (160–310 ℃) at a rate of 10 ℃/min. The mixture was maintained at this temperature for a specific reaction time. After cooling to room temperature, the as-synthesized NPs were washed with cyclohexane and ethanol three times to remove excess OA molecules on the NP surfaces.
2.3 Characterization
The crystal phase of the NaLuF4:15 % Tb3+ NPs was determined by X-ray diffraction (XRD) on a D/Max-3c diffractometer (DX-2700) with Cu-Ka radiation (λ = 1.5406 Å) at 40 kV and 30 mA. All sample was characterized in solid state with a mass of 50–100 mg. The scan range was from 10° to 70° with steps of 0.05°. Transmission electron microscopy (TEM) with a JEOL JEM-2100 system operating with an accelerating voltage of 200 kV was used to determine the morphologies of as-synthesized NPs. The specimen of TEM was prepared by 0.01 mg/mL NPs dispersed in cyclohexane. The X-ray excited emission spectra of XLNPs were determined with a Zolix Fluorescence Spectrometer (Zolix Omni-λ) equipped with an X-ray source (Oxford Industry) as the excitation source. The X-ray source was set to 80 kV and 0.7 mA with a 15 cm distance to the specimen, which was in a concentration of 20 mg/mL dispersed in cyclohexane. The scanning range of XEOL spectrum was from 450 nm to 650 nm in a step of 5 nm.
3 Results and discussion
3.1 Impacts of reaction temperature and reaction time on the sizes and morphologies of NPs
NaLuF4:15 % Tb3+ NPs were synthesized via a high-temperature coprecipitation process. Oleic acid was used as both the solvent and NP capping agent with 1-octadecene as the cosolvent. To understand the growth mechanism of NaLuF4 NPs, the reaction conditions, such as temperature and reaction time, were carefully controlled. The X-ray excited luminescent nanoparticles of NaLuF4:15 % Tb3+ were successfully synthesized at different reaction temperatures ranging from 160 to 310 °C with different reaction times. Notably, for the synthesis temperatures 160 °C and 190 °C, no NPs were observed via TEM. When the reaction temperature reached 210 °C, NaLuF4:15 % Tb3+ NPs with irregular shapes were observed using TEM, and the particles showed sizes of 7.49 ± 5.49 nm with two size distribution peaks located at 3 and 13 nm, respectively, as shown in Fig. 1a and S1a. With the reaction temperature at 240 °C, the particle size did not show an obvious increase upon prolonging the reaction time from 60 min (3.53 ± 0.75 nm) to 120 min (4.69 ± 1.15 nm), as shown in Fig. 1b and S1b-c. When the reaction temperature reached 270 °C and the system reacted for 120 min, the NPs were still irregular in shape with a size of 9.13 ± 2.56 nm, as demonstrated in Fig. 1c and S1d.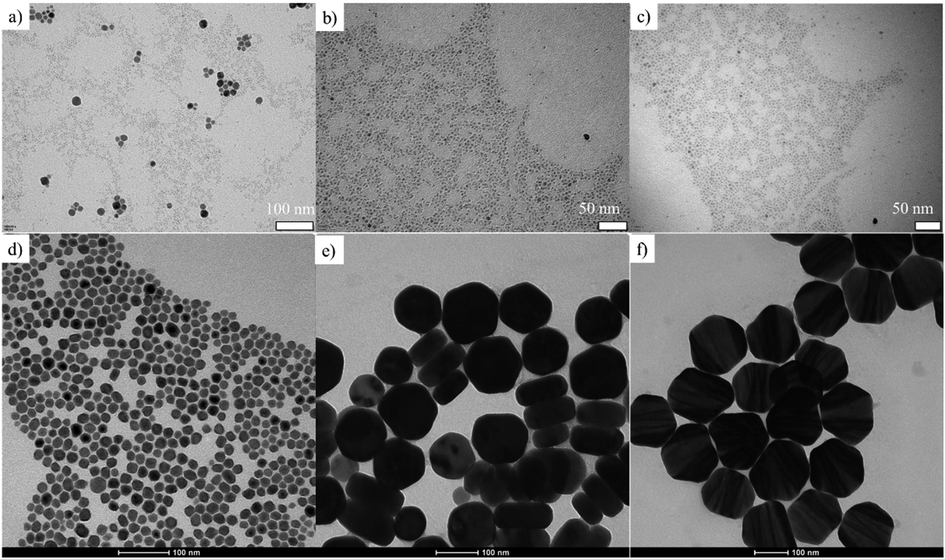
TEM images of NaLuF4:15 % Tb3+ nanoparticles prepared via reactions at a) 210 ℃ for 120 min, b) 240 ℃ for 120 min, c) 270 ℃ for 120 min, d) 295 ℃ for 45 min, e) 300 ℃ for 60 min and f) 310 ℃ for 25 min.
The morphologies and size distributions of NPs synthesized at 295 °C for 15–120 min were characterized by TEM, as shown in Fig. 1d and Fig. S2-3. The NPs formed at 295 °C for less than 45 min showed sizes less than 10 nm and were spherical in shape, while NPs formed with reaction times exceeding 60 min at 295 °C showed much larger sizes up to 500 nm, a broadened size distribution and irregular morphologies. The nanocrystals exhibited rapid growth at 295 °C after 45 min and the size distribution of the NPs was broadened, as illustrated in Fig. 2a.
When the reaction temperature reached 300 °C, as demonstrated in Fig. 1e and Fig. S4-5, the NPs formed with reaction times less than 25 min were spherical. The initial 25 min of the reaction led to relatively slow nanocrystal growth with an average NP size below 20 nm. Notably, upon prolonging the reaction time to 30 min, stick-like and cuboid-like NPs were found via TEM because the nanocrystals in the (0001) plane grew faster than those growing in the [0001] direction, as reported in the literature (Liu et al., 2013); this differed from nanocrystal growth at 295 °C, which was isotropic. Nanocrystal growth accelerated between 25 min and 30 min, and the average size of the NPs was 65 nm. By prolonging the reaction time up to 120 min, the average sizes of the NPs continued to increase up to 164 nm. As demonstrated in Fig. 2b, the nanocrystal growth rate followed a stair-like trend. Between the reaction periods of 25–30 min and 45–60 min, accelerated nanocrystal growth was found.
NPs formed at a reaction temperature of 310 °C were spherical in shape and monodispersed in cyclohexane when the reaction time was less than 25 min, as demonstrated in Fig. 1f and Fig. S6a. By prolonging the reaction time up to 60 min, stick-like NPs were formed, as shown in Fig. S6. Compared with the NPs grown at 300 °C, many more stick-like NPs were observed, which meant that the probability of growth in the [0001] direction increased with increasing temperature. The average sizes of the NPs increased with increasing reaction time at 310 °C and reached 211 nm, as illustrated in Fig. S7. In addition, the nanocrystal growth rate was much faster during the reaction time period between 15 and 25 min and then slowed down, as demonstrated in Fig. 2c.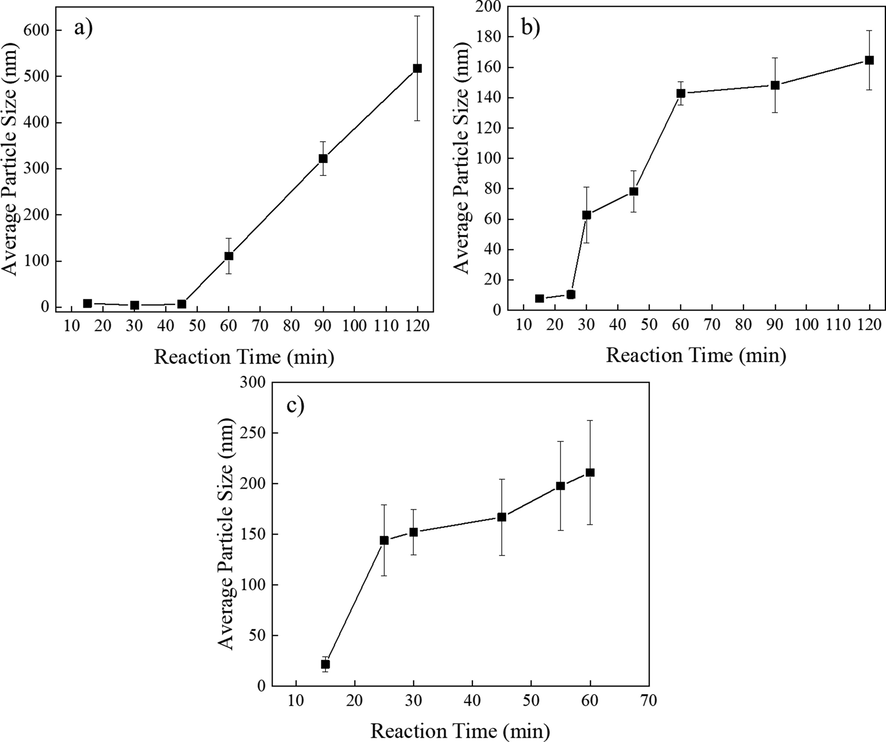
Average sizes of NPs obtained from TEM images: a) NPs formed at 295 ℃, b) NPs formed at 300 ℃, and c) NPs formed at 310 ℃.
3.2 Influence of reaction temperature and reaction time on the NP crystalline phase formed
For NaLuF4 NPs, two crystalline phases resulted, the cubic (α) and hexagonal phases (β) (Liu et al., 2013). Hexagonal NaLuF4 NPs showed at least a fold stronger luminescence intensity than the cubic phase (Li et al., 2015). To further investigate the crystalline structures and phase purities of the as-prepared NP samples, the XRD patterns of NaLuF4:15 % Tb3+ NPs formed with different reaction temperatures and times are illustrated in Table 1. Notably, in the reactions that occurred at 160 °C and 190 °C, no NaLuF4:15 % Tb3+ NPs were formed, but only pure NaF was identified by XRD when the reaction reached equilibrium, as demonstrated in Fig. S8a-b; this might explain why no nanoparticles were observed via TEM. For syntheses run at 210 °C and 240 °C, as shown in Fig. S8c-d, α-phase NaLuF4 nanocrystals started to form in combination with NaF formation. Since the reaction temperature reached 270 °C, both α- and β-phase nanocrystals were formed when the reaction reached equilibrium (Fig. S8e).
min
℃
15
25
30
45
55
60
90
120
160
NaF
190
NaF
NaF
210
α + NaF
240
α + NaF
α + NaF
270
α + β
α + β
α + β
295
α + β
α + β
α + β
α + β
α + β
α + β
300
α + β
α + β
β
β
β
β
β
310
α + β
β
β
β
β
β
When the reaction temperatures reached 295 °C and above, all diffraction peaks matched well with the values for the (1 0 0), (1 1 0), (1 0 1), (2 0 0), (1 1 1), (2 0 1), (2 1 0), (2 1 1), (1 0 2), and (1 1 2) planes of β-NaLuF4 (JCPDS No. 27–0726) and α-NaLuF4 (JCPDS No. 27–0725), as demonstrated in Fig. 3a and S9-10. Both α- and β-phases were present in all samples reacted at 295 °C, as shown in Fig. S10. Notably, with increasing reaction time at 295 °C, the proportions of the β crystalline phase in the samples increased. With increasing reaction time, α-phase crystals were transformed into β-phase crystals. However, until the reaction ran for 120 min at 295 °C, an ultrasmall peak at 2θ = 56° for the α-phase could still be found. Based on the XRD and morphology data, the mixed crystalline phase might enhance nanoparticle growth and morphological irregularity, as shown in Fig. 3d.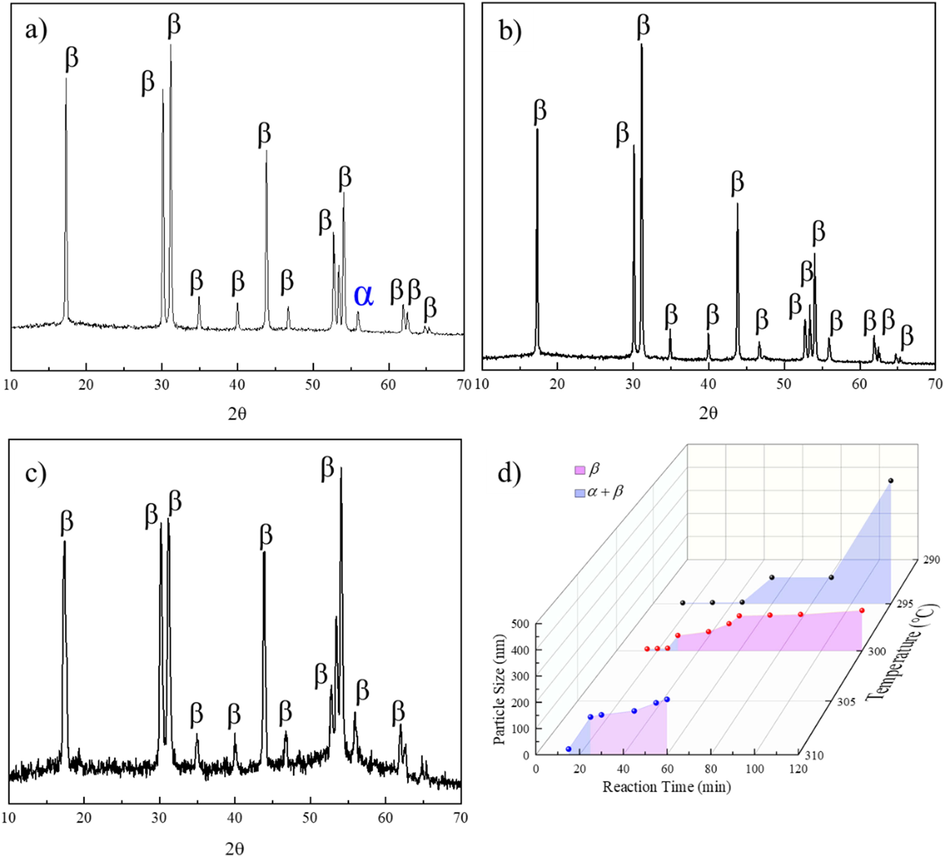
XRD patterns obtained when the reaction reached equilibrium for NaLuF4:15 % Tb3+ synthesized at a) 295 ℃, b) 300 ℃, and c) 310 ℃. d) Growth phase diagram for NaLuF4:15 % Tb3+ synthesized at 295–310 ℃.
As demonstrated in Fig. 3b and S11, pure β-phase nanocrystals were obtained when the reaction reached equilibrium at 300 °C. For the first 25 min of the reaction, a mixture of α- and β-phase nanocrystals was formed. Similar to the reaction run at 295 °C, the percentage of α-phase nanocrystals decreased significantly with longer reaction times. Pure β-phase NPs were synthesized when the reaction time reached 30 min. Notably, the mixed crystalline phases caused enhanced nanocrystal growth, and morphological irregularity was also observed, as shown in Fig. 2b (the slope between 25 and 30 min) and in Fig. 3d.
When the reaction temperature reached 310 °C, both α and β phases were observed during the first 15 min of reaction, as demonstrated in Fig. 3c and S12. For reactions lasting longer than 25 min, the crystal structures of all samples were pure β-phases. Analyses indicating a combination of particle sizes and small (>10 nm) cubic-phase NPs were found since Ln3+ (Lu3+, Tb3+) and Na+ were randomly distributed within the cationic sublattices of cubic-phase NPs and occupied relatively fixed cationic sites in hexagonal-phase NPs. In summary, the reaction temperature and reaction time both influenced the crystal phase structures and purities of the as-synthesized NPs, as shown in Fig. 3d.
3.3 Impacts of crystal phase and size on luminescence strength
Upon X-ray excitation, NaLuF4:15 % Tb3+ NPs were excited to generate secondary electrons, which directly or indirectly excited the Tb3+ to emit visible light in the region 450–650 nm (G. and B.C., 1994). To assess the X-ray excited optical luminescence (XEOL) of NaLuF4:15 % Tb3+ NPs, the XEOL emission spectra of the as-prepared NPs were recorded and are illustrated in Fig. S13-14. The NaLuF4:15 % Tb3+ NPs showed characteristic peaks for Tb3+ due to doping of Tb3+ as the luminescent center; the peaks were located at 490, 544, 586, and 625 nm and corresponded to the 5D4 → 7FJ (J = 3, 4, 5, and 6) transitions of Tb3+, respectively, independent of nanoparticle size, which was consistent with the Judd-Ofelt theory (Zhang et al., 2007, Liu et al., 2009, Zhang et al., 2018). However, no emission peaks for 5D3 → 7FJ (J = 4, 5, and 6) transitions were observed due to self-quenching effect resulting from the relatively high Tb3+ doping level (Tian et al., 2007). The relative intensity of the electric dipole transition 5D4 → 7F5 (544 nm) was higher than that associated with the magnetic dipole transition 5D4 → 7F3 (625 nm) in all cases, which suggested crystallographic sites without inversion symmetry for Tb3+, which was consistent with the emission peaks observed for NaLuF4:15 % Tb3+ NPs, as described in our previous report (Zhang et al., 2018).
Notably, the luminescence strength was affected by the particle sizes and the crystalline phases of the NPs. Thus, the particle size- and crystalline phase-dependent XEOL intensity was studied further, as illustrated in Fig. 4 and Fig. S13-14. The XEOL intensities from NPs made at three different reaction temperatures showed that the luminescence strength increased with increasing particle size because a decreased specific surface area is favorable for inhibiting nonradiative relaxation pathways (Wang et al., 2010). Combined with crystalline phase and particle size data, the integrated XEOL intensities of NPs synthesized at 295 °C showed a linear-like trend and increased with increasing particle size when the crystals comprised a mixture of the α and β phases (Fig. 4a). When the reaction temperature reached 300 °C, the integrated XEOL intensity of the as-synthesized NPs increased relatively slowly with increasing particle size when the α-phase crystal was present, as demonstrated in Fig. 4b. The integrated XEOL intensity increased sharply for pure β-phase nanocrystals. For the synthesis run at 310 °C, the integrated XEOL intensity did not show a sharp increase instead of a linear-like increase when the crystalline phase changed from α + β to pure β-phase, which might be due to the small number of α-phase nanocrystals present in the sample. When the NPs all formed the pure hexagonal phase, the luminescence intensity was only size dependent, which is consistent with the literature (Dong et al., 2015).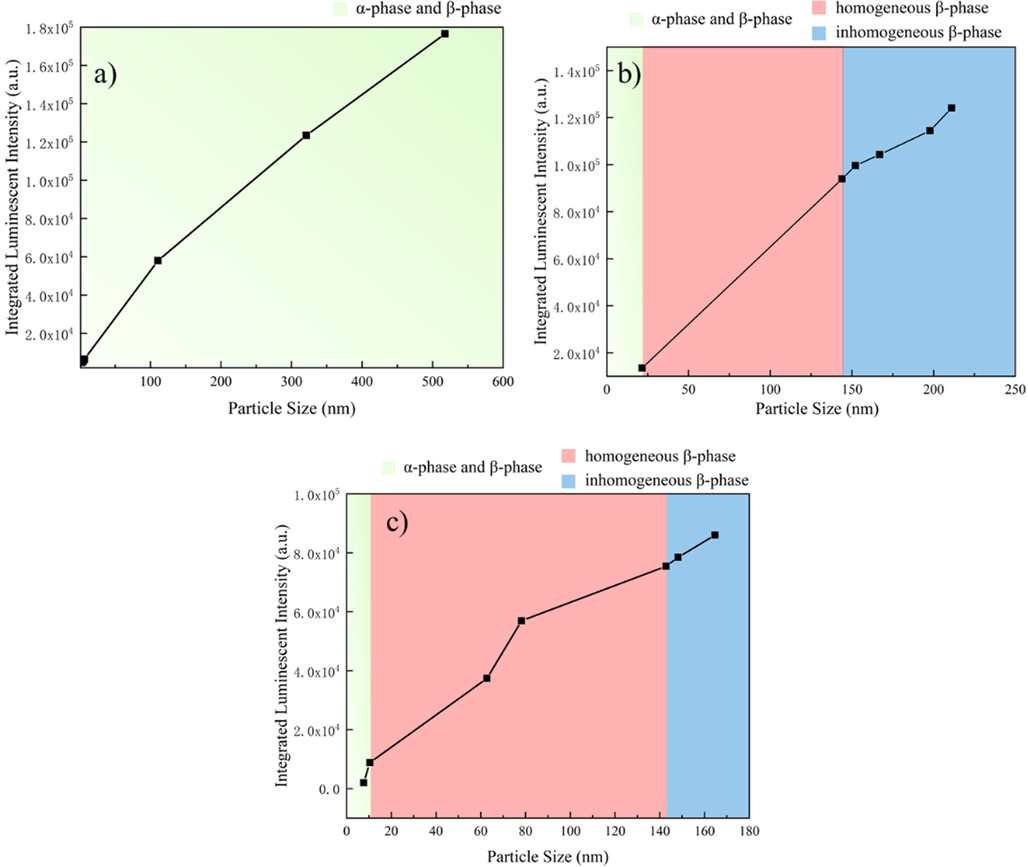
Relationship between the average sizes and crystalline phases of NPs and the integrated luminescence intensities of NPs formed at d) 295 ℃, e) 300 ℃, and f) 310 ℃.
In summary, the crystalline phases and nanoparticle sizes were mainly affected by the synthesis temperature and time. To obtain pure hexagonal-phase NPs, a temperature of at least 300 °C must be achieved. In addition, the luminescence strength of the NPs was determined by both the crystalline phase and particle sizes.
3.4 Impact of Tb3+ doping level on luminescence intensity
The doping level of the luminescent centers was another main factor affecting the luminescence strength (Zhang et al., 2017). NaLuF4:Tb3+ NPs with different Tb doping levels (3–21 %) were successfully synthesized at a reaction temperature of 300 ℃. As illustrated in Fig. S15, the morphologies of these NPs were mainly spherical and tube-like. The NP sizes were mainly distributed around approximately 160 nm without significant differences among the samples, as demonstrated in Fig. S16. As illustrated in Fig. 5, the XEOL intensities increased with increases in the Tb3+ doping level and reached 15 %. With doping levels above 15 %, the luminescence intensities decreased due to self-quenching effects involving interactions between Tb3+ ions, which was also observed in our previous study (Zhang et al., 2018). In addition, all characteristic emission peaks of 5D4→7FJ (J = 3–6) could be observed. The relative intensity of peak at 545 nm, which represents the electric dipole transition 5D4→7F5, is higher than the peak at 625 nm, which represents the magnetic dipole transition 5D4→7F4. It suggests a crystallographic site without inversion symmetry for Tb3+. It is worth to note that no emission peaks from transition 5D3→7FJ (J = 3–6) were observed due to the high doping concentration caused self-quenching effect.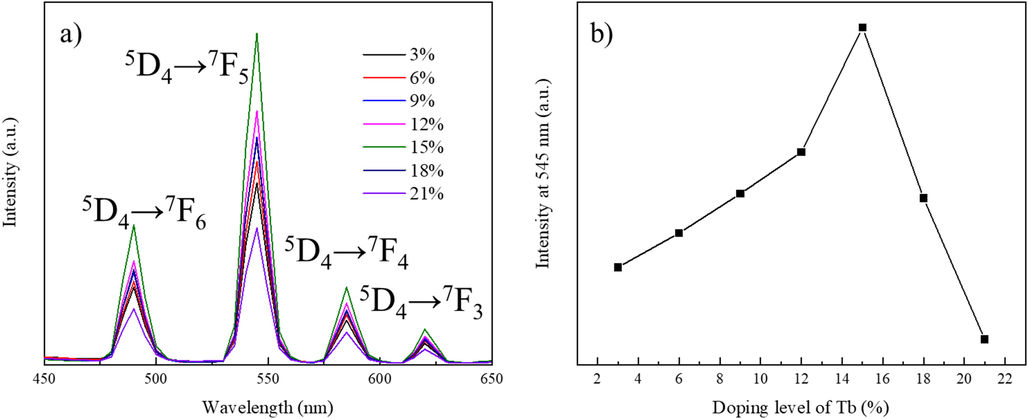
a) X-ray excited luminescent spectrum of NaLuF4:3–21 % Tb3+ NPs. b) Relationship between the Tb doping level and the luminescence intensity at 545 nm.
The XEOL efficiencies of NaLuF4:15 % Tb3+ NPs were further studied by changing the X-ray tube voltage. The X-ray excited luminescence spectrum was recorded with different tube voltages ranging from 45 kV to 80 kV and with a consistent current of 0.5 mA. As illustrated in Fig. 6a, the XEOL intensities of all peaks increased with increasing tube voltage and followed a linear-like trend. Notably, the slopes for each peak showed approximate ratios of 5.2:1.3:3.1:1.4, which corresponded with the XEOL intensity for each peak, as illustrated in Fig. 6b. The integrated XEOL intensities showed an increasing linear trend, which indicated that the overall XEOL efficiency was not affected by varying the tube voltage (Fig. 6c). The chemical compositions of these NPs were characterized with EDX to confirm that pure NaLuF4:15 % Tb3+ NPs were synthesized, as shown in Fig. S17.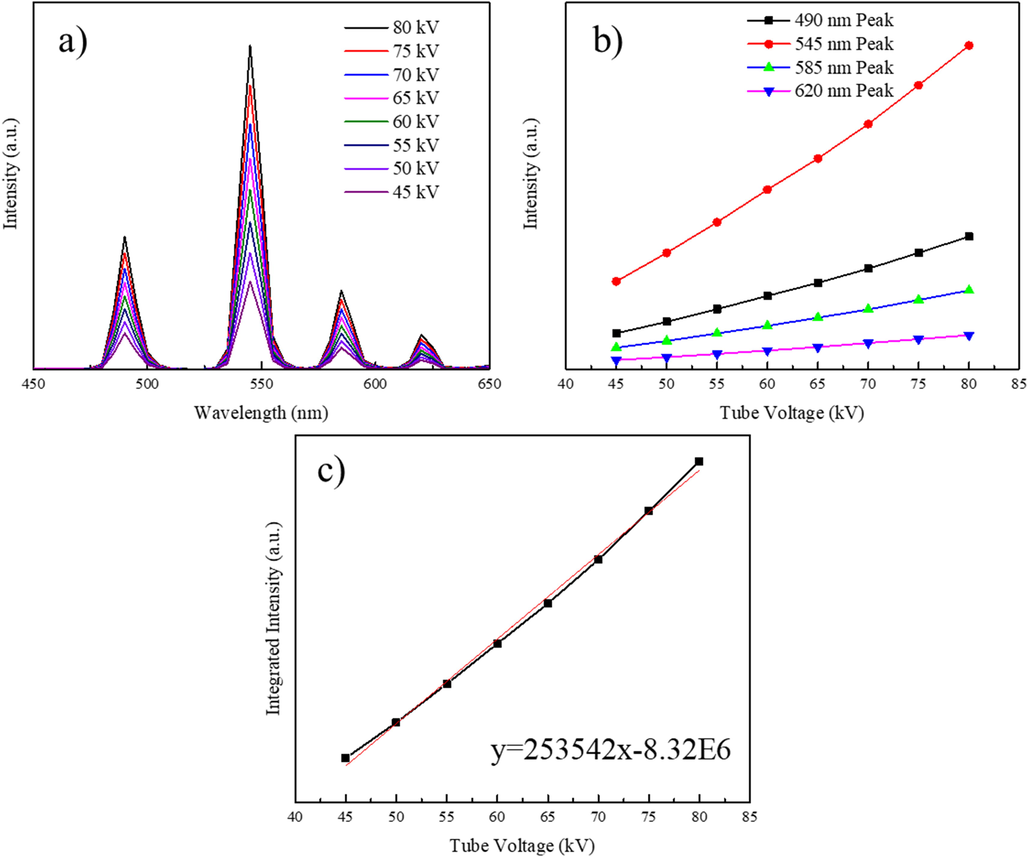
A) the x-ray excited luminescence spectrum of naluf4:15 % Tb3+ NPs excited with different tube voltages. b) Relationship between luminescence intensities for different characteristic peaks of NaLuF4:15 % Tb3+ NPs and X-ray tube voltages. c) Relationship between the luminescence intensity for NaLuF4:15 % Tb3+ and X-ray tube voltages.
4 Conclusion
In summary, the mechanism for NaLuF4:Tb3+ NP growth and the impact on luminescence strength have been systematically studied. Systematic experiments revealed that the reaction temperature and reaction time were effective variables for regulating the sizes, morphologies, and crystalline phases. Increasing the reaction temperature and reaction time favored formation of the hexagonal crystalline phase for NaLuF4:Tb3+ NPs. With a reaction temperature of 295 ℃, the NPs were enlarged up to 500 nm and showed a stick-like morphology due to inhibition of growth in the [0001] direction, and the NPs exhibited a mixture of the cubic and hexagonal phases. When the NPs were synthesized at 300 ℃ or 310 ℃, pure hexagonal phases were obtained for the NPs after 30 min and 25 min reaction times, respectively. Maximum NP sizes of 180 nm and 220 nm were achieved at 300 ℃ and 310 ℃, respectively. Notably, many more stick-like NPs were observed in samples synthesized at 300 ℃ and 310 ℃ due to greater inhibition of growth in the [0001] direction. The luminescence strengths of pure hexagonal phase NPs were positively correlated with particle size. The doping level of the luminescent center was another key factor affected the luminescence strength. With systematic evaluation, a Tb3+ doping level of 15 % was identified as the optimal doping level that showed the strongest luminescence.
Conflict of Interest
No potential conflict of interest was reported by the authors.
Acknowledgment
This work was supported by the Natural Science Basic Research Program of Shaanxi (No. 2022JM-510), the National Key Research and Development Program of China (No. 2021YFC1200100, 2021YFC1200104), and the National Natural Science Foundation of China (No. 31700865). Natural Science Foundation of Shaanxi Province (2020JZ-28)and Key Research and development plan of Shaanxi Province (2021SF-192).
References
- Novel applications of diagnostic X-rays in activating a clinical photodynamic drug: Photofrin II through X-ray induced visible luminescence from“ rare-earth” formulated particles. J. Xray Sci. Technol.. 2011;19:521-530.
- [Google Scholar]
- X-ray-induced singlet oxygen activation with nanoscintillator-coupled porphyrins. J. Phys. Chem. C. 2013;117:21583-21589.
- [Google Scholar]
- Nanoscintillator-Mediated X-ray Inducible Photodynamic Therapy for In Vivo Cancer Treatment. Nano Lett.. 2015;15:2249-2256.
- [CrossRef] [Google Scholar]
- LiGa5O8:Cr-based theranostic nanoparticles for imaging-guided X-ray induced photodynamic therapy of deep-seated tumors. Mater. Horiz.. 2017;4:1092-1101.
- [CrossRef] [Google Scholar]
- Using nanoparticles to enable simultaneous radiation and photodynamic therapies for cancer treatment. J. Nanosci. Nanotechnol.. 2006;6:1159-1166.
- [Google Scholar]
- Dong, H., S.-R. Du, X.-Y. Zheng, et al., 2015. Lanthanide nanoparticles: from design toward bioimaging and therapy. Chemical reviews. 115, 10725-10815.
- G., B. and G. B.C., 1994. Luminescent Materials. Berlin, German, Springer-Verlag Berlin Heidelberg.
- Resolving adjacent nanophosphors of different concentrations by excitation-based cone-beam X-ray luminescence tomography. Biomed. Opt. Express. 2017;8:3952-3965.
- [Google Scholar]
- Sparse view cone beam X-ray luminescence tomography based on truncated singular value decomposition. Opt. Express. 2018;26:23233-23250.
- [Google Scholar]
- Facile chemical conversion synthesis and luminescence properties of uniform Ln3+ (Ln= Eu, Tb)-doped NaLuF4 nanowires and LuBO3 microdisks. Inorg. Chem.. 2009;48:10193-10201.
- [Google Scholar]
- X-ray-induced radiophotodynamic therapy (RPDT) using lanthanide micelles: Beyond depth limitations. Nano Res.. 2015;8:2373-2379.
- [CrossRef] [Google Scholar]
- Li, Y., Y. Dong, Tuerxun·Aidilibike, et al., 2017. Growth phase diagram and upconversion luminescence properties of NaLuF4:Yb3+/Tm3+/Gd3+ nanocrystals. RSC Advances. 7, 44531-44536. https://doi.org/10.1039/C7RA07902H.
- Lab on upconversion nanoparticles: optical properties and applications engineering via designed nanostructure. Chem. Soc. Rev.. 2015;44:1346-1378.
- [Google Scholar]
- Upconversion luminescence imaging of cells and small animals. Nat. Protoc.. 2013;8:2033.
- [CrossRef] [Google Scholar]
- Magnetic/Upconversion Fluorescent NaGdF4:Yb, Er Nanoparticle-Based Dual-Modal Molecular Probes for Imaging Tiny Tumors in Vivo. ACS Nano. 2013;7:7227-7240.
- [CrossRef] [Google Scholar]
- Cone-beam x-ray luminescence computed tomography based on x-ray absorption dosage. J. Biomed. Opt.. 2018;23:026006
- [Google Scholar]
- Regularized reconstruction based on joint L 1 and total variation for sparse-view cone-beam X-ray luminescence computed tomography. Biomed. Opt. Express. 2019;10:1-17.
- [Google Scholar]
- Monodisperse, size-tunable and highly efficient β-NaYF4:Yb, Er(Tm) up-conversion luminescent nanospheres: controllable synthesis and their surface modifications. J. Mater. Chem.. 2009;19:3546-3553.
- [Google Scholar]
- X-ray-Induced Shortwave Infrared Biomedical Imaging Using Rare-Earth Nanoprobes. Nano Lett.. 2015;15:96-102.
- [CrossRef] [Google Scholar]
- High-resolution X-ray luminescence extension imaging. Nature. 2021;590:410-415.
- [CrossRef] [Google Scholar]
- X-ray-activated persistent luminescence nanomaterials for NIR-II imaging. Nat. Nanotechnol.. 2021;16:1011-1018.
- [CrossRef] [Google Scholar]
- Spectral-resolved cone-beam X-ray luminescence computed tomography with principle component analysis. Biomed. Opt. Express. 2018;9:2844-2858.
- [Google Scholar]
- Facile synthesis of β-NaLuF 4: Yb/Tm hexagonal nanoplates with intense ultraviolet upconversion luminescence. CrstEngComm. 2011;13:3782-3787.
- [Google Scholar]
- NaGdF4:Eu3+ Nanoparticles for Enhanced X-ray Excited Optical Imaging. Chem. Mater.. 2014;26:1881-1888.
- [CrossRef] [Google Scholar]
- Tian, Y., W. Cao, X. Luo, et al., 2007. Preparation and luminescence property of Gd2O2S:Tb X-ray nano-phosphors using the complex precipitation method. Journal of Alloys and Compounds. 433, 313-317. https://doi.org/https://doi.org/10.1016/j.jallcom.2006.06.075.
- Direct Evidence of a Surface Quenching Effect on Size-Dependent Luminescence of Upconversion Nanoparticles. Angew. Chem. Int. Ed.. 2010;49:7456-7460.
- [CrossRef] [Google Scholar]
- Synthesis of hexagonal-phase NaYF4: Yb, Er and NaYF4: Yb, Tm nanocrystals with efficient up-conversion fluorescence. Adv. Funct. Mater.. 2006;16:2324-2329.
- [Google Scholar]
- Bi-functional NaLuF 4: Gd 3+/Yb 3+/Tm 3+ nanocrystals: structure controlled synthesis, near-infrared upconversion emission and tunable magnetic properties. J. Mater. Chem.. 2012;22:9870-9874.
- [Google Scholar]
- A general approach for transferring hydrophobic nanocrystals into water. Nano Lett.. 2007;7:3203-3207.
- [CrossRef] [Google Scholar]
- Low-Dose X-ray Excited Photodynamic Therapy Based on NaLuF4:Tb3+–Rose Bengal Nanocomposite. Bioconjug. Chem.. 2019;30:2191-2200.
- [CrossRef] [Google Scholar]
- Cone Beam X-ray Luminescence Computed Tomography Based on Bayesian Method. IEEE Trans. Med. Imaging. 2017;36:225-235.
- [Google Scholar]
- Sub-10 nm Water-Dispersible β-NaGdF4:X% Eu3+ Nanoparticles with Enhanced Biocompatibility for in Vivo X-ray Luminescence Computed Tomography. ACS Appl. Mater. Interfaces 2017
- [CrossRef] [Google Scholar]
- Ultra-high FRET efficiency NaGdF4: Tb3+-Rose Bengal biocompatible nanocomposite for X-ray excited photodynamic therapy application. Biomaterials. 2018;184:31-40.
- [Google Scholar]
- X-ray-induced nanoparticle-based photodynamic therapy of cancer. Nanomedicine. 2014;9:2339-2351.
- [CrossRef] [Google Scholar]
Appendix A
Supplementary data
Supplementary data to this article can be found online at https://doi.org/10.1016/j.arabjc.2023.104672.
Appendix A
Supplementary data
The following are the Supplementary data to this article:Supplementary data 1
Supplementary data 1


