

Translate this page into:
The elimination of arsenic from natural gas condensate via pulse sieve-plate column: Experimental and application of DFT for chemical structure
⁎Corresponding authors. kraiwanp@nu.ac.th (Wikorn Punyain), ura.p@chula.ac.th (Ura Pancharoen)
-
Received: ,
Accepted: ,
This article was originally published by Elsevier and was migrated to Scientific Scholar after the change of Publisher.
Peer review under responsibility of King Saud University.
Abstract
Abstract
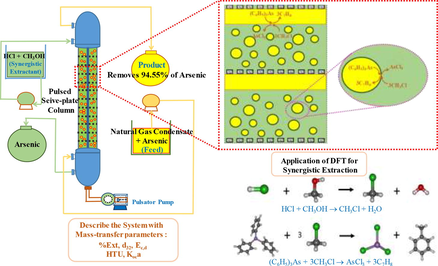
This work focuses on the elimination of arsenic ions from natural gas condensate via pulse sieve-plate column. The extraction of arsenic ions using the extractants: hydrochloric acid (HCl), Methanol (MeOH) and HCl/MeOH are investigated via density functional theory (DFT). The DFT method clearly demonstrates the synergistic reaction mechanism of the extractant HCl/MeOH, providing an improved extraction effect greater than the use of single extractants. Applying optimal conditions: MeOH (5 M), HCl (1 M), feed flowrate (55 ml/min), extractant flowrate (220 ml/min) and pulse velocity (2 cm/s), it is found that the pulse sieve-plate column leads to an increase in extraction of triphenylarsine. Mass-transfer parameters, including the Sauter mean diameter: 1.917 mm, the axial dispersion coefficient of the continuous phase: 0.012 m2/s, the extract percentage: 94.55%, the overall mass transfer coefficient: 1.228x10⁻³ s−1 as well as height of a transfer unit (HTU): 22.92 cm are also calculated under optimal conditions.
Keywords
Arsenic
Natural Gas Condensate
HCl/MeOH
DFT
Pulse Sieve-Plate Column

Nomenclature
- ΔG°
-
standard Gibbs free energy change
- ΔH°
-
standard enthalpy change
- ΔS°
-
standard entropy change
- a
-
interfacial area per unit volume (m2/m3)
- A
-
pulse amplitude (m)
- Af
-
pulsation intensity (m/s)
- c
-
concentration of solute (mol/L)
- C
-
concentration (mol/L)
- CD
-
drag coefficient (0.6)
- D
-
distribution ratio
- d0
-
hole diameter (m)
- d32
-
Sauter mean diameter (m)
- dcol
-
column diameter (m)
- di
-
diameter of drop i (m)
- do
-
hole diameter (m)
- E0
-
axial dispersion coefficient at zero flow rate (m2/s)
- Ei
-
axial dispersion coefficient for phase i (m2/s)
- EXP
-
Experiment
- F
-
pulse frequency (Hz)
- G
-
acceleration due to gravity (m/s2)
- H
-
column length (m)
- H
-
plate spacing (m)
- HTU
-
overall height of transfer unit (m)
- K
-
overall mass transfer coefficient (m/s)
- Kex
-
extraction equilibrium (-)
- L
-
column length (m)
- NTU
-
number of transfer unit
- Q
-
volumetric flow rate (m3 /s)
- R
-
chemical reaction of extraction
- S
-
column cross-section area (m2)
- S.C.
-
synergistic coefficient
- T
-
temperature (K)
- t
-
Time
- u
-
superficial velocity (m/s)
- V
-
volume (m3)
- x
-
mass fraction of arsenic ions in the continuous phase
- Y
-
mass fraction of arsenic ions in the dispersed phase
- Z
-
column height (m)
- µ
-
viscosity (kg/m.s)
- α
-
fractional free area of the plate
- ρ
-
density (kg/m3)
- σ
-
interfacial tension (N/m)
Greek letters
- c
-
continuous phase
- cal
-
calculated value
- d
-
dispersed phase
- eq
-
equilibrium
- i
-
inlet
- o
-
outlet
Subscripts
1 Introduction
Natural gas is an important combustible fuel that can be used in conjunction with oil due to the higher price of oil (Khan et al., 2020). For this reason, an exploration of natural gas resources has been actively conducted both inland and offshore. Depending on temperature and pressure, natural gas is present in both gaseous and liquid forms, and is referred to as natural gas and condensate, respectively (Wang et al., 2022). In the condensate, arsenic compounds are found mostly in the form of triphenylarsine (C6H5)3As (Bal et al., 1989; Krupp et al., 2007). Arsenic is a toxin that adversely affects human beings (Sangtumrong et al., 2007; Lothongkum et al., 2011). Exposure to arsenic can result in many health problems such as damage to organs, liver, lungs, kidneys, nervous system, high blood pressure, diabetes, and cancer of the bladder (Shraim, 2017; Hassan and Hrdina et al., 2022; Steinwinder and Zhao et al., 2005). The maximum contaminant level (MCL) of arsenic ions required by the World Health Organization (WHO) is no>0.01 mg/l (Mohammed et al., 2020). Excessive amounts of arsenic in natural gas condensate can reduce the efficiency of catalysts in the manufacturing process (Ryndin et al., 2001). For this reason, arsenic must be removed from the natural gas condensate prior to use in manufacturing.
Removal of arsenic has been studied using various methods: adsorption (Hassan and Hrdina, 2022; Leslie and María, 2020; Kolhea et al., 2017), coagulation (Hu et al., 2015), ion exchange (Luo et al., 2019), oxidation (Hu et al., 2015), precipitation (Da Silva et al., 2018), and biological treatment (Sandhi et al., 2018). The use of such methods can result in wasted energy, expensive materials, pollution, and the generation of toxic sludge (Rana et al., 2018; Mohdee et al., 2022). Another method for heavy metal treatment commonly used in various industries is solvent extraction (Pancharoen et al., 2009). Solvent extraction is generally applied in pharmaceuticals and oil–gas processing because it is reliable, fast, economically feasible, and less sludge is produced (Bouhoun Ali et al., 2012; Natarajan, 2017; Wattal, 2017). The most widely used unit of operation for solvent extraction is the external pulsed sieve-plate column (PSPC) where the counterflow between heavy (organic feed) and light (solvent) phases and the sheared forces create smaller droplets as the fluids pass through the sieve plates, resulting in improved performance of mass transfer (Theobald et al., 2020; Yadav and Patwardhan, 2007; Ferreira et al., 2010; Gameiro et al., 2010).
In Table 1, past research has investigated the separation of arsenic from both aqueous and solid phases using the commercial solvents: Aliquat 336, TBP, DEHP, TOPO and Cyanex with the result that removal efficiencies exceeded 50–100% (Wisniewski, 1997; Iberhan and Wiśniewski, 2002; (Güell et al., 2010; Suren et al., 2021). However, the extraction of arsenic from the organic phase, particularly the natural gas condensate, has been found to be rather limited. To separate arsenic from the organic feed, studies available use either acid- or alcohol-based solvents. Yet, removal efficiencies obtained have not been satisfactory (Delaney, 1988). Perez et al., (2007) and Chakrabarty et al., (2010) reported that the performance of metal extraction can be improved via synergistic extraction by adding acid solution as a co-extractor to alcohol. LLE - Liquid-liquid Extraction, SLE - Solid Liquid Extraction, HFSLM - Hollow Fibre Supported Liquid Membrane.
Researcher
Ion target
Feed
Method
Extract or Solvent Type
% Extraction
% Stripping
Takashi et al., 1979
As(III)
Aqueous phase
LLE
Hydrochloric acid and Benzene
N/A
95
Delaney et al., 1988
As
Shale oil
LLE
Hydrochloric acid and Phosphorous Trichloride
28.3
N/A
Ralf et al., 1991
As
Industrial aquous phase
LLE
Hydrosamic acid
N/A
66
Wisniewski et al., 1997
As(III), As(V)
Aqueous phase
LLE
Cyanex 923
54 As(III), 50 As(V)
N/A
Iberhan et al., 2002
As(III)
Aqueous phase
LLE
Cyanex 925, Cyanex 301
70
N/A
Shuzo et al., 2002
As
Kuruboku soil
SLE
Hydrochloric acid, Nitric acid, Sulfuric acid,
98
N/A
.
Acetic acid and Perchloric acid
Pizarro et al., 2003
As
Rice, Fish, Chicken, Soil
SLE
Water, Methanol and Phosphoric acid
99
N/A
Yuan et al., 2005
As
Straw
SLE
Water, Methanol, Ethanol and Acetronitrite
89.3
N/A
Mir et al., 2007
As
Soil
SLE
Water and Methanol
70
N/A
Guell et al., 2010
As(III), As(V)
Aqueous phase
LLE
Aliquat 336
100
N/A
Suren et al., 2021
As
Aqueous phase
HFSLM
Aliquat 336, TBP, DEHP, TOPO, Cyanex 471
100
98
Of late, one of the important theoretical models used to explain the science of solids and chemistry is density functional theory (DFT) (Mohdee et al., 2021). DFT is a technique applied to determine surface corrosion inhibition efficiency and to analyze experimental data (Blajiev and Hubin, 2004; Sertçelik et al., 2020). Besides, the most powerful and commonly used tool for predicting molecular parameters in surface corrosion inhibition reactions has been quantum chemistry computing (Obi-Egbedi et al., 2012; Jamaizadeh et al., 2008). The precise identification of the complex composition of biomass extracts in corrosion inhibition efficiency has been based on computer simulations through DFT used in molecular structure analysis (Demian et al., 2019).
Based on the present information, the elimination of arsenic from natural gas condensate by extraction via a pulsed sieve column is investigated. Little research has been carried out in this field previously. The concept of DFT is also applied to explain the results of single solvent extraction as well as synergistic extraction. Additional experiments have been carried out to determine the optimal operating conditions of PSPC, including extract pulse intensity and the flow rate of organic feed and solvent streams.
2 Theoretical background
2.1 Method of quantum chemical calculations
Theoretical investigation into the extraction of triphenylarsine in condensate solution was implemented via DFT. Applying the Gabedit program package, three dimensional initial structures were constructed (Frisch et al., 2009). Becke's 3-paramter Lee Yang Parr (B3LYP) functional with the cc-pVTZ triple zeta basis set was performed for geometry optimization to find the equilibrium structures of each species in each extraction process. Verification of the optimized structures located on the potential energy surface (PES) was confirmed by Hessian calculations. The solvation effect of water solvent was considered using the conductor-like polarizable continuum model (CPCM) during both geometry optimizations and Hessian calculations. Thermodynamic properties of the chemical reactions were undertaken in standard state, including standard enthalpy change (ΔH°) and standard Gibbs free energy change (ΔG°). All DFT calculations were carried out using the Gaussian09 program package (Greiner et al., 1995).
2.2 Thermodynamic parameters on extraction equilibrium
Extraction reaction can show the relationship between Gibbs free-energy change and the equilibrium extraction constant (Kex), according to the Van't Hoff Model (Angulo-Brown, 1996; Kraikaew et al., 2005):
The Gibbs-Helmholtz equation shows the relationship between the Gibbs free-energy change (
), the standard enthalpy (
), and the extraction entropy changes (
), as in Eq. (3):
Accordingly, substituting Eq. (2) into Eq. (1) and rearranging it becomes:
2.3 Percentage of extraction
Determination of the extraction efficiency of arsenic ions via the pulse sieve-plate column system is highly representative of extraction percentage. According to equation (5), the percentage of extraction can be calculated where Cf,o is the initial feed concentration and Cf,t is the feed concentration at time t for the i component (mmol/L):
2.4 Synergistic coefficient
The extraction of arsenic ions using a combination of two extractants shows a highly effective index of the synergistic coefficient (S.C.). These variables are related to the distribution ratio (Guezzen et al., 2012).
Thus:
If the interaction of the two extractants is ineffective, the synergistic coefficient is negative or equal to zero (S.C. ≤ 0), and if the interaction of the two extractants produces a synergistic extraction result, the coefficient is positive (S.C. > 0) (Usman et al., 2006).
2.5 Number of transfer units (NTU) and height of the transfer unit (HTU)
The ideal measured NTU values can be obtained using a method like the McCabe Thiele method (Ijaz et al., 2010). The ideal NTU with plug flow characteristics can be obtained, as follows:
3 Experimental
3.1 Reagents and chemical compounds
Natural gas condensate, obtained from a diesel oil production company in Thailand, was used in this study. The condensate had the following composition: arsenic (As) 0.204 ppm, nickel (Ni) 0.317 ppm, mercury (Hg) 0.356 ppm and zinc (Zn) 53.875 ppm. Analytical grade solvents, including hydrochloric acid (HCl), nitric acid (HNO3), ammonium sulphate ((NH4)2SO4), sodium hydroxide (NaOH), sulfuric acid (H2SO4), methanol (CH3OH), ethanol (CH3CH2OH) and sodium chloride (NaCl), were used for the extraction of arsenic. The solvents were diluted to the desired concentration using distilled water.
3.2 Apparatus
In Table 2, detailed specifications of the extract column are depicted. In Fig. 1 a schema of the equipment used is shown. The sieve-plate column has 38 fixed perforated plates; two fluids counter currently flow through the column. The pulsator pump is a reciprocating pulse liquid agitator whereby the piston moves back and forth as both fluids pass through the column. The separating chamber at the top of the column serves to separate the aqueous phase from the organic phase. The separating chamber at the bottom of the column serves to separate the organic phase from the aqueous phase. The extractant pump serves to suck up the aqueous phase. The feed pump serves to suck up the organic phase. The feed reservoir is used to contain the natural gas condensate (organic phase). When extracted, the product is packaged in a collecting tank (raffinate solution). The solvent reservoir is used to contain the extractant (aqueous phase). When extracted, both the extractant and the extracted arsenic are contained in the collecting tank (extract solvent).
Part
Description
Quantity
Units
Sieve plate column
column diameter
50
mm
column height
2000
mm
hole diameter
2
mm
plate spacing
50
mm
plate diameter
50
mm
free area
25
%
number of plates
38
plates
number of holes per plate
140
holes
Separating chambers
chamber diameter
100
mm
chamber height
695
mm
volume
5.5
L
Pulsator pump
stroke
0–20
mm
speed
17–150
stroke/min
flowrate
max 300
L/hr
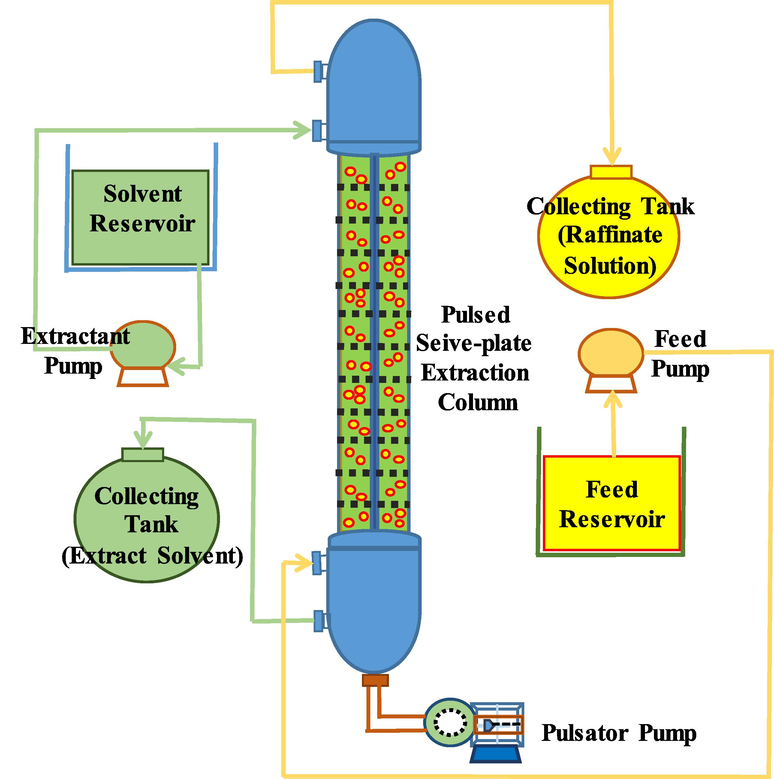
Schematic diagram of the pilot scale pulsed sieve-plate column.
3.3 Experimental procedures
Arsenic compounds contained in natural gas condensate are mainly in the form of As(III), triphenylarsine (C6H5)3As, usually found in the range of 0.04–514 mg/l (Bal et al., 1989; Krupp et al., 2007). The extraction of triphenylarsine (C6H5)3As was studied using the following methods.
3.3.1 Arsenic extraction applying a single solvent
Liquid-liquid extraction (LLE) was carried out to identify a suitable solvent for the removal of arsenic. A mixture of natural gas condensate (100 ml) and a solution of extract: HCl (100 ml) was loaded into a beaker (500 ml). Subsequently, the mixture was stirred at 500 rpm for about 30 min to ensure that the reaction attained equilibrium (Krupp et al., 2007). Next, the mixture was poured into a separation funnel and then left for about 6 h. Finally, the aqueous solution was filtered. Samples were measured for the content of arsenic via inductive couple plasma atomic emission spectrometer (ICP-AES). Various types of extractants, including HCl, HNO3, (NH4)2SO4, NaOH, H2SO4, CH3OH, CH3CH2OH and NaCl were used for arsenic extraction and prepared at a concentration of 0.5 M.
3.3.2 Synergistic arsenic extraction using HCl and methanol
To enhance the performance of the synergistic extraction system, the concentration of the extractants was adjusted in the range of 0.2–1.0 M (HCl) and 0.62–7.41 M (Methanol). Then, the concentration of arsenic was analyzed at intervals by ICP-AES. Trialkylated arsenic compounds in the natural gas condensate analysis yielded reliable preliminary results, using ICP-AES. This method also served as the basis for reliable and cost-effective on-site testing in the future (Mir et al., 2007).
3.3.3 Optimization of pulsed sieved-plate column (PSPC)
In this study, PSPC was used for the extraction of arsenic (Fig. 1). Both the natural gas condensate (organic phase) and the solvent extractant (aqueous phase) were injected into the bottom and top of the column, respectively, at the same volumetric flow of 55 ml/min. The extraction time was maintained for about 240 min to ensure that the reaction attained equilibrium (the arsenic extraction experiment began to stabilize at approximately 180 min). Firstly, the natural gas condensate (20 L) was packed into the condensate reservoir and the extract solution (20 L) was loaded into the extract reservoir. Subsequently, the condensate was injected through the top of the pulsed sieve-plate column and then extracted into the bottom of the pulsed sieve-plate column in a continuous and counter current flow direction.
The experiment was divided into two parts: effect of pulse velocity and effect of the feed line flow ratio on the extractant. The first experiment looked at the effect of pulse velocity in the range: 4–20 mm/s (Pulsator Pump) using the same flow rate of feed and extraction line at 55 ml/min. Further experiments to study the effect of feed line flow rate ratio on the extractant took place at a constant pulse speed of 20 mm/s by adjusting the flow rate of both feed and extractant in the range: 55–275 ml/min (flow rate ratio of the feed/extraction range: 0.2–5). After that, the concentration of arsenic was analyzed at intervals by ICP-AES.
4 Results and discussion
4.1 Influence of type of extractant on arsenic extraction by liquid–liquid extraction
In Fig. 2, the types of extractant influencing arsenic extraction are shown. Selection of suitable extractants should consider the following properties: less solubility with natural gas condensate, low viscosity, low ignition value, cheap and readily available in the market. Acid-based extractants: namely, HCl, HNO3, H2SO4, (NH4)2SO4 and NaOH were selected in the experiment. The acidic extractants i.e. HCl, HNO3, H2SO4 showed better arsenic extraction results than the base (NaOH) and medium types ((NH4)2SO4 and NaCl). Allouche (2011) acknowledged that acid breaks the organometallic compound bond of the arsenic in the condensate, so arsenic is well soluble. It was found that HCl 0.5 M can extract arsenic better than other acidic extracts. Dennis et al. (1988) reported that HCl acid was able to extract arsenic from shell oil as well.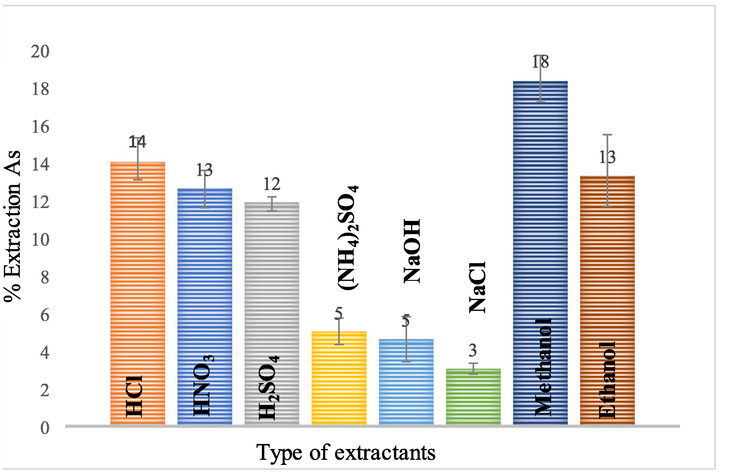
Influence of type of extractant on percentage of arsenic extraction: volume of both feed and extractant is 100 ml, the concentration of extractant is 0.5 M, the solution is stirred at 500 rpm, and extraction time: 60 min.
Extraction using alcohol extractants yield higher extraction results than acidic extractants. Both methanol and ethanol are seen to dissolve arsenic and bind to organic matter (condensate) easily. Methanol has a smaller molecular size than ethanol, and therefore more arsenic is dissolved than ethanol (Allouche, 2011). Extraction results showed that methanol at a concentration of 0.5 M was able to extract arsenic (18.18%) better than ethanol (13.11%). The extraction characteristics of arsenic are described and calculated using the DFT method, as shown in part of the methanol extraction.
4.2 Influence of the synergistic extractant on arsenic extraction via the solvent extraction method
In Fig. 3, the influence of the synergistic extractants of arsenic is shown. The synergistic extraction of arsenic is carried out via binary extractant systems at different molar ratios of hydrochloric acid and methanol. Hydrochloric acid concentration was in the range: 0.2–1.2 M, and methanol concentration was in the range: 0.6–7.4 M. As a result, when concentration of both extractants increased, HCl increased from 0.2 to 1.0 M and methanol increased from 0.6 to 5.0 M. Due to the addition of reactants causing the reaction to move forward, the tendency for extraction of arsenic increased, in accordance with Le Chaterlier' s law. The mixture of both compounds yielded up to 35.06% arsenic extraction at concentrations of 1.0 M hydrochloric acid and 5.0 M methanol. However, when extractant concentration increased further than (HCL > 1.0 M) and (Methanol > 5.0 M), the reaction reached equilibrium.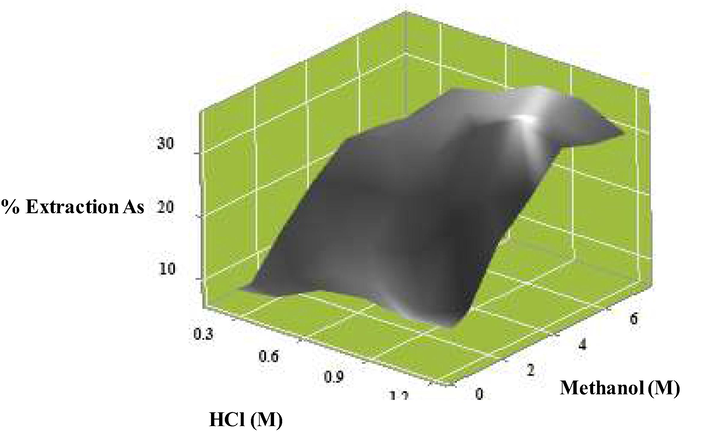
Influence of synergistic extractants on the percentage of arsenic extraction: concentration of methanol (0.6–7.4 M), concentration of hydrochloric acid (0.2–1.2 M), volume of feed and extract (100 ml), extraction time (60 min), and mixing velocity (500 rpm).
In Fig. 4, results of the molar ratio of HCl/Methanol on the distribution coefficients of arsenic and synergistic coefficients are shown. At molar ratio of HCl/methanol (0.2), the distribution coefficients are maximum. Both mixed extractants: HCl and Methanol, for all concentration ranges, showed positive values of synergistic coefficients (0.04–0.24).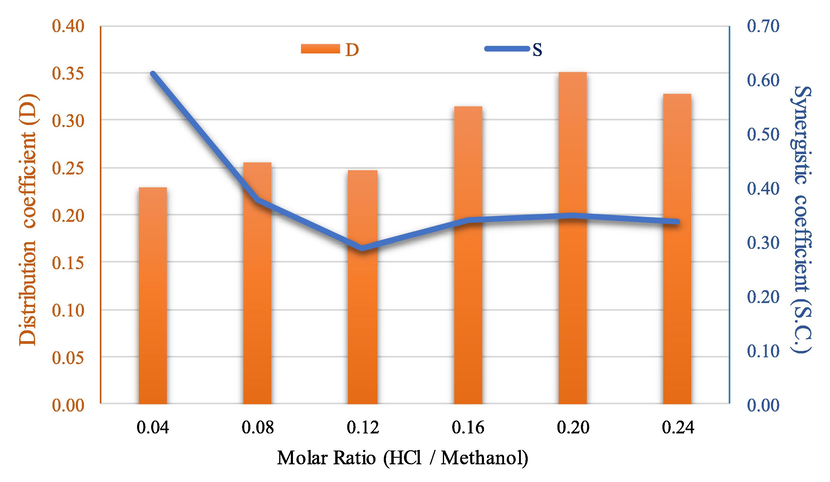
Influence of molar ratio (HCl/Methanol) on the distribution coefficients of arsenic and synergistic coefficients.
4.3 Mass transfer mechanism: Extraction of arsenic ions via the PSPC system
Perforated plates arranged in cylindrical columns are the basic elements of the PSPC system. The heavy-phase liquid or the aqueous-phase extractant is fed into the top of the column and then flows out through the bottom of the column. In contrast, the light liquid phase or natural gas condensate in the oil phase is fed in through the bottom of the column and flows out at the top. It is seen that the light phase fluids and heavy phase fluids flow continuously in opposite directions.
Between the perforated plates: “before upstroke”, “end of upstroke” and “end of downstroke”, a layer of the light liquid phase is settled on top while a layer of the heavy liquid phase is settled below. In the Upstroke, the light liquid phase is displaced and forced through a jet stream hole to the heavy liquid phase layer above the next layer plate. In the downstroke, the heavy liquid phase is displaced and forced through the jet stream hole to the light liquid phase layer below the next layer plate. This process is a reversal from the ascent stroke. In Fig. 5, flow patterns are shown of the heavy and light phase as well as the mass transfer of arsenic(III). Having a high pulse velocity, drop breakage is increased because the droplet has more inertia and shear forces. Fine droplets at the perforated plate are blown along with the light liquid phase through the rudder during reverse stroke; this pattern is called emulsion regime (Yadav and Patwardhan, 2007).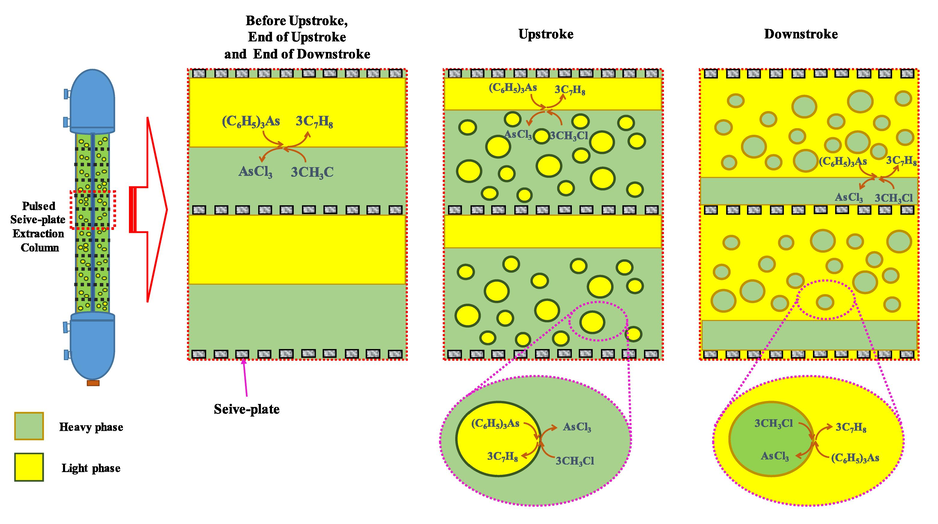
Schematic flow patterns of the heavy and light phase (Yadav et al., 2008) and mass transfer of Arsenic(III) in a pulsed sieve-plate column.
In the light phase, the heavy phase arsenic ions ((C6H5)3As) react with the extractant (CH3Cl), and are converted into AsCl3 (Eq. (15), which is dissolved in the light phase. From light phase to heavy phase, the process of mass transmission of arsenic ions takes place. Transfer of arsenic ions can occur in both Upstroke and Downstroke.
4.4 The order of reaction on extraction
Both reaction rate constant and the order of reaction for the synergistic extraction (C6H5)3As are obtained by applying the graph technique. The plotting of graphs between the CA, ln (CA0/CA) and 1/CA values versus time are represented in order of the reactions: 0, 1 and 2, respectively (as shown in Fig. S1, S2 and S3). In Table 3, results indicate that the best straight line is: of first-order reaction, given the reaction rate constant (ke) of 0.002 min−1 for the extraction of (C6H5)3As.
Reaction order (n)
Plot
R-squared
Acceptability
0
CA vs t
0.9590
No
1
ln (CA0/CA) vs t
0.9867
Yes
2
1/CA vs t
0.9726
No
4.5 Effect of pulsation intensity on Sauter mean diameter
The Sauter mean diameter (d32) defined as the diameter of a sphere, having a ratio of volume and surface area, approximates the mean size of a given particle distribution (Filippa et al., 2012). The prediction of this value in the system of pulsed sieve-plate columns can be calculated, using Eq. (9) (Sreenivasulu et al., 1997) and Eq. (10) (Kagan et al., 1965; Sarkara et al., 2019):
In Fig. S4, the effect of pulsation intensity changes on the Sauter mean diameter is shown. The Sauter mean diameter is directly related to the specific interfacial area: calculated using Eq. (9) (Sreenivasulu et al., 1997) and Eq. (10) (Sarkara et al., 2019). The results of the two equations tend to correlate in the same direction. The larger drop size is small due to the degree of turbulence at lower pulsing velocities. The drop in size is influenced by the diameter of the sieve-plate hole more than the effect of the degree of turbulence (Sarkar et al., 2017). As pulsating velocity increases, the Sauter mean diameter, calculated via both equations, tends to decrease, resulting in smaller droplet size (Mirmohammadi et al., 2019).
In Fig. 6, when pulsation intensity attains Af = 0.02 m/s, the Sauter mean diameter is small: s32 = 1.6 mm; possibly due to the high droplet population density (465,097 drops/volume 1 L). It is noted that the reduction of the Sauter mean diameter leads to an increase in the interfacial area (max data 3.75 m2/ volume 1 L) in the column.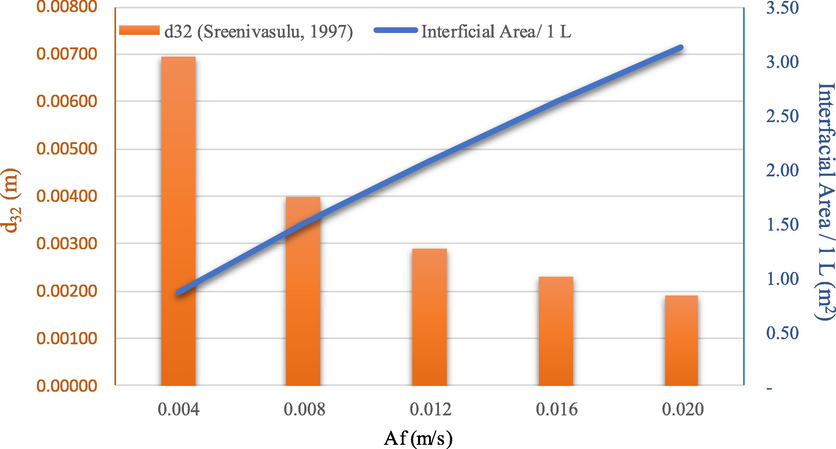
Influence of pulsation intensity (Af) on the Sauter mean diameter (d32) and interfacial area: concentration of methanol (5 M), concentration of hydrochloric acid (1 M), feed and extract flowrate (55 ml/min), pulse velocity (4, 8, 12, 16 and 20 mm/sec), extraction time (240 min). The flow is continuous and counter current to each other.
4.6 Effect of pulsation intensity on axial dispersion coefficient
The empirical correlations of the axial dispersion coefficients: continuous phase or heavy phase (Ec) were calculated, using Eq. (11) (Ingham et al., 1995):
At zero flow, the axial dispersion coefficients of the continuous phase are denoted by the symbol (E0) where a1, a2 and CD are constants: 0.0290, 0.0088 and 0.6, respectively. Miyauchi et al. (1965) presented the relationship of the axial coefficient for the dispersed phase or organic phase (Ed), according to Eq. (12):
In Fig. 7, the effect of the axial dispersion coefficient on the change in pulsation intensity is studied. Both Kolhea et al. (2011) and Matsumoto et al. (1989) found that when pulsation intensity increased, the axial dispersion coefficient also increased. At low pulse velocity, Reynold's number is small, indicating a slight increase in the axial dispersion coefficient. At high pulse velocity, Reynold's number is large, indicating turbulence such that the increase in axial dispersion coefficient was high. Inside the column at high pulsation intensity, the increase in the axial dispersion coefficient of both phases can be attributed to the turbulence and the raising of vortex in the continuous phase (Amani et al., 2017a; Vassallo et al., 1983).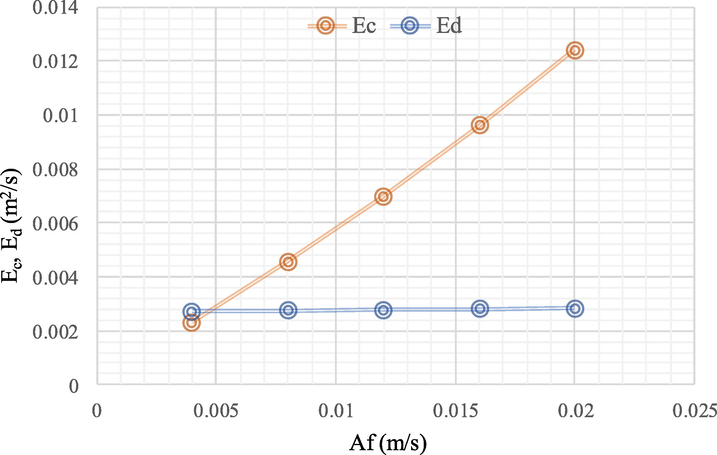
Influence of pulsation intensity (Af) on the continuous phase mixing coefficient (Ec) and the disperse phase mixing coefficient (Ed): concentration of methanol (5 M), concentration of hydrochloric acid (1 M), feed and extractant flowrate (55 ml/min), pulse intensity (4, 8, 12, 16 and 20 mm/sec), extraction time (240 min). The flow is continuous and counter current to each other.
Another study reported similar results using the radiotracer technique. Din et al. (2009) demonstrated that when pulsation intensity increased from 4 to 20 mm/s, the axial dispersion coefficient increased in the continuous phase by 1.01x10⁻² m2/s, and in the disperse phase by 1.02x10⁻⁴ m2/s. The change in axial distribution of the diffuse phase below the continuous phase may be caused by the discontinuity of the droplets, resulting in a greatly reduced diffusion of molecules in the disperse phase (Saremi et al., 2022).
4.7 Effect of the Sauter mean diameter on dispersion coefficient
Axial distribution is due to the internal circulation of droplets and the collision of droplets, resulting in droplet size and consistency (Srinikethan et al., 1987). In Fig. 8, the Sauter mean diameter (d32) affects the size per continuous (Ec) and the dispersed (Ed) phase axial dispersion coefficients. For instance, at feed and extract flowrate (55 ml/min), when pulsation intensity increased from 0.004 to 0.020 m/s, the Sauter mean diameter decreased from 0.0069 to 0.0019 m, leading to reduction of the interfacial area (Rafiei et al., 2017). Besides, when the axial dispersion coefficient in the continuous phase was in the same direction as the disperse phase, the difference in the continuous phase was more pronounced than the disperse phase. Qualitative results, as observed by several authors, show that the axial mixing of the disperse phases was significantly lower than the axial mixing of the continuous phases (Amani et al., 2017b; Panahinia et al., 2017; Tang et al., 2004). Moreover, the smaller particle size: Sauter mean diameter (d32) provided a better surface area per volume and greater dispersion coefficient as well. Where the larger particle size yielded less surface area per volume, the dispersion coefficient was also lower, as shown in Table S1.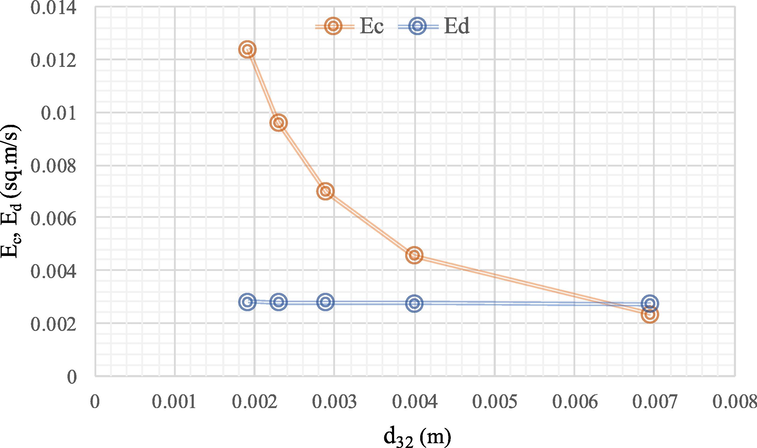
Influence of Sauter mean diameter (d32) on the continuous phase mixing coefficient (Ec) and the disperse phase mixing coefficient (Ed): concentration of methanol (5 M), the concentration of hydrochloric acid (1 M), feed and extractant flowrate (55 ml/min), pulse intensity (4, 8, 12, 16 and 20 mm/sec), extraction time (240 min). The flow is continuous and counter current to each other.
4.8 Influence of flowrate ratio on arsenic extraction
In Fig. 9, the effect of the aqueous phase and organic phase flow ratio on extraction capacity is shown. The organic or feed phase flow rate was maintained at 55 ml/min by adjusting the flow rate of the aqueous phase or extractant in the range of 55–275 ml/min; feed/extraction flow rate ratio was: 1 to 0.2. In Table S2, the extraction effect is the reciprocal of the flowrate ratio of feed/extractant from 1 to 0.2, as shown. Thus, as extractant flow rate increased, the percentage of extraction of arsenic decreased, Gameiro et al. (2010) reported similar results.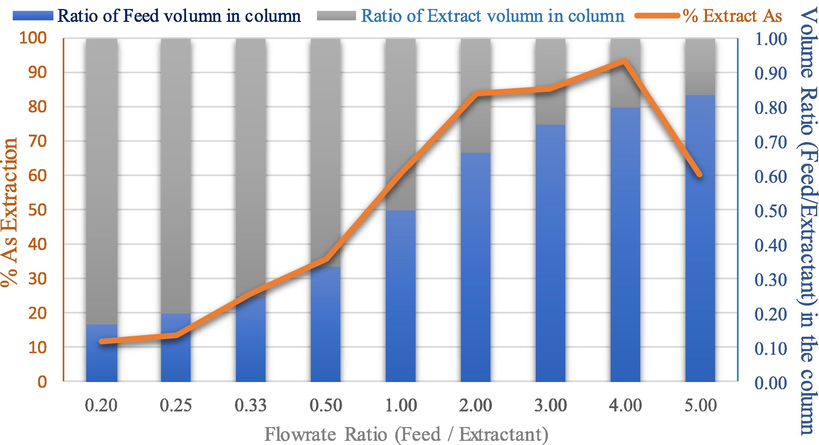
The effect of flowrate ratio between feed and extractant on the percentage of arsenic extraction and volume ratio (feed/extractant) in the column: concentration of methanol (5 M), the concentration of hydrochloric acid (1 M), volume of feed and extractant (20 L), feed and extractant flowrate (55, 110, 165, 220 and 275 ml/min), pulse velocity (20 mm/sec), extraction time (240 min). The flow is continuous and counter current to each other.
In addition, the extractant phase flow rate was maintained at 55 ml/min by adjusting the feed flow rate in the range of 55–275 ml/min; but the feed/extraction flow rate ratio was: 1 to 5. Results showed that the percentage of arsenic extraction was directly proportional to the feed phase flow rate and increased the volume ratio of feed in the column from 0.50 to 0.83. Research by Torab-Mostaedi et al. (2010) and Safari et al. (2012) found that when the flowrate of feed phase increased, the ratio of feed volume in the column increased. Subsequently, when the feed/extraction flow rate ratio increased by>5, values of extraction were found to be lower.
4.9 Influence of flowrate ratio on NTU and HTU
In Fig. 10, the experimental results for the extraction of arsenic via HCl and Methanol synergistic extracts produced equilibrium lines with a slope of 0.875. Thus, when the extractant flowrate increased from 55, 110, 165, 220 to 275 ml/min (with a constant feed flow rate of 55 ml/min flow rate ratio of the feed/extractant range, 1–0.2), HTU increased from 1.4, 3.69, 5.86, 12.75 up to 14.88. When the flowrate of the extractant increased further, column efficiency decreased; (the aqueous phase flow rate constant at 55 ml/min by adjusting the organic phase (Feed) flow rate in the range of 55–220 ml/min (flowrate ratio of feed/extractant range, 1–5). When the organic phase flow rates increased from 55, 110, 165 up to 220 ml/min, HTU decreased from 1.4, 0.48, 0.45 to 0.23. As extractant flow rate increased, column efficiency increased. Accordingly, it is seen that keeping the aqueous phase flow rate constant whilst increasing the organic phase flow rate, the number of transfer units increased. The tendency of these two values is normally related i.e. the effect of HTU values can change inversely with the NTU values.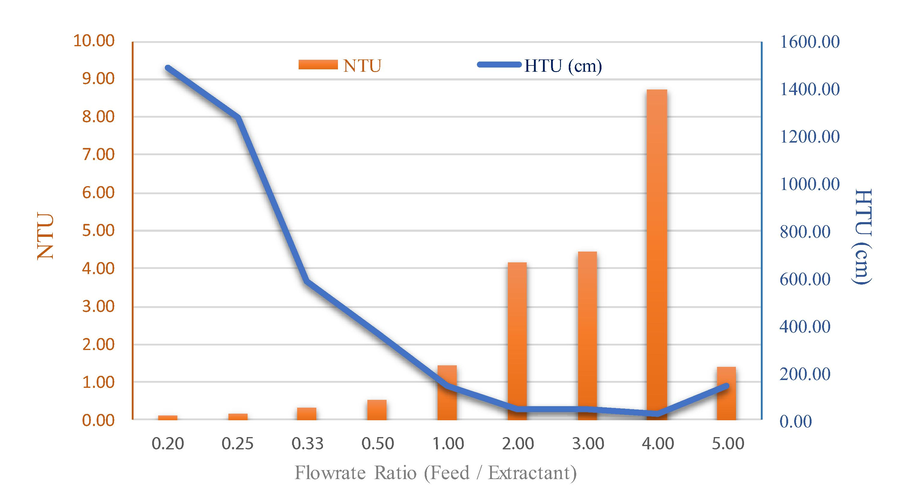
Influence of flowrate ratio between feed and extractant on the number of transfer units (NTU) and the height of transfer units (HTU): concentration of methanol (5 M), concentration of hydrochloric acid (1 M), feed and extractant flowrate (55, 110, 165, 220 and 275 ml/min), pulse velocity (20 mm/sec), extraction time (240 min). The flow is continuous and counter current to each other.
4.10 Effect of pulsating intensity and flowrate ratio (Feed / Extractant) on overall mass transfer coefficient
In a PSPC system, pulse intensity, continuous phase superficial velocity and disperse phase superficial velocity vary. As presented by Smoot et al. (1962), the relationship of these three variables with the overall mass transfer coefficient (Koca) is shown:
In Fig. 11, the effect of pulsating intensity on the overall mass transfer coefficient is shown. At a disperse phase flow constant of 220 ml/min and a continuous phase of 55 ml/min, the overall mass transfer coefficient is seen to increase. Due to the increase in pulsation intensity, mass transfer created greater turbulence, thereby increasing the mass transfer efficiency of the system. Both Park et al. (2013) and Ebrahimi et al. (2009) discussed the effect of the increase in power, resulting in an increase in the overall mass transfer coefficient. It is noted that a decrease in the droplet diameter of the dispersed phase increased the specific surface area according to the pulse effect, thus increasing the overall mass transfer coefficient.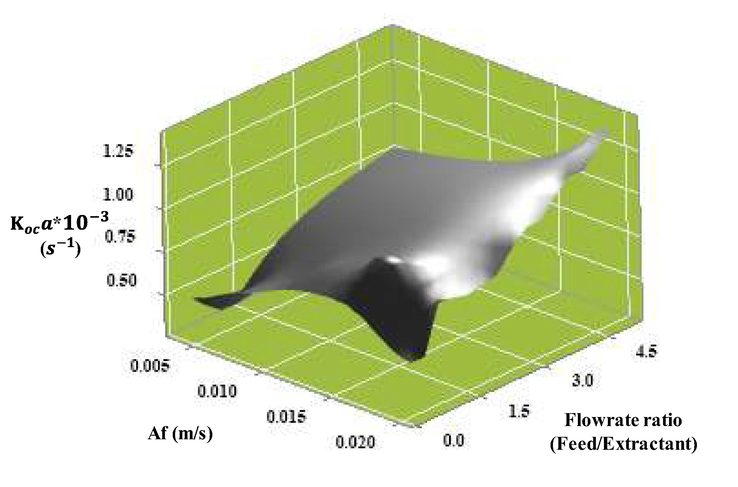
The effect of pulse intensity and flowrate ratio (feed/extractant) on the overall mass transfer coefficient (Koca): concentration of methanol (5 M); concentration of hydrochloric acid (1 M), feed and extractant flowrate (55, 110, 165, 220 and 275 ml/min), pulse velocity (20 mm/sec), extraction time (240 min). The flow is continuous and counter current to each other.
In their research, Kumar et al. (1999) also found that when the continuous phase flow rate increased, Koca slightly increased (approximately 1x10⁻⁵ s−1). However, when the disperse phase flow rate increased, the increase in Koca was greater (approximately 8.2x10⁻⁴ s−1). Thus, the change in the dispersed phase flow rate had a greater effect on Koca than the continuous phase.
4.11 Analysis on extraction mechanism via DFT
Extraction of triphenylarsine (C6H5)3As, dissolved in the condensate aqueous solution, was investigated by two different types of extractant, as follows.
4.11.1 Influence of HCl on triphenylarsine extraction
In Fig. 12, the bond length of the triphenylarsine (C6H5)3As molecule between the arsenic atom (As) and the phenyl ring (C6H5) was found to be approximately 1.98 Å and likewise, the bond angle C-As-C between the phenyl rings was 100.5°, respectively. HCl was added to the aqueous solution to extract the triphenylarsine (C6H5)3As. Subsequently, protons were protonated to the phenyl rings, and chloride anions formed new covalent bonds with arsenic(III), yielding the product of this process viz. trichloro arsenic (AsCl3) and benzene. The optimized geometry of the trichloro arsenic molecule (AsCl3) shows that the bond length between arsenic and chlorine atoms was 2.21 Å and the bond angle between Cl-As-CL was 98.8° respectively. The thermodynamics properties of this reaction show that this reaction is exothermic, having the standard enthalpy change of −204.87 kJ/mol and the standard Gibbs free energy change of −225.41 kJ/mol, respectively.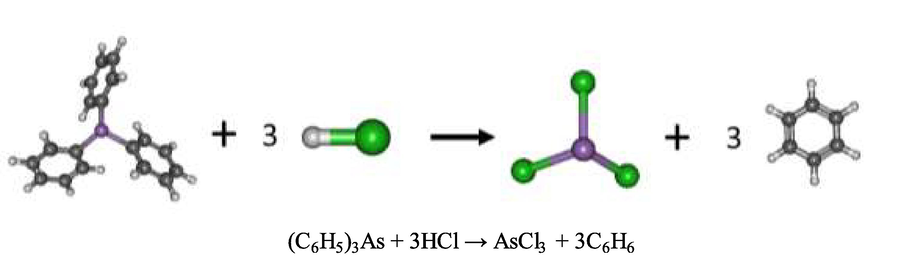
Schema of the reaction mechanism of triphenylarsine extraction by hydrochloric acid at B3LYP/cc-pVTZ level of theory.
In Fig. 13, the experimental IR spectra show three main peaks at 402, 1635 and 3307 cm−1 respectively. The first experimental peak at 402 cm−1 was the result of the combination of the vibration in As(C6H5)3, and consisted of As-C stretching modes around 300 cm−1. The out of plane C–H bending in the phenyl rings revealed two peaks around 485–486 and 716–718 cm−1. The vibration of AsCl3 highlighted the As-Cl stretching mode at 300–400 cm−1 while the vibration of C6H6 showed out of the plane C–H bending mode at 691 cm−1. The second peak at 1635 cm−1 resulted from the combination of the C–H bending mode of As(C6H5)3 around 1500 cm−1 and the in-plane C–H bending mode of C6H6 at 1515 cm−1. The last peak at 3307 cm−1 is seen to be the result of the combination of the C–H stretching mode of As(C6H5)3 at 3191 cm-1 and the C–H stretching mode of C6H6 at 3183 cm−1, respectively.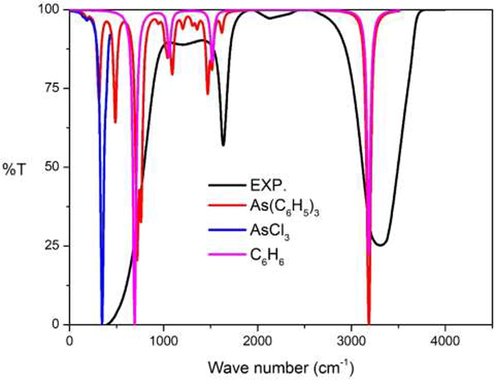
Experimental IR spectra: Part I chemical reaction compared to the calculational IR spectra at B3LYP/cc-pVTZ level of theory.
4.11.2 Influence of methanol on triphenylarsine extraction
The reaction mechanism of triphenylarsine extraction via methanol can be expressed, as in Eq. (14) (Reid et al., 2020):
In Fig. 14, methanol was used to extract triphenylarsine in the condensate aqueous solution. The addition of methanol to the triphenylarsine solution resulted in the bond breaking between arsenic and the phenyl rings, yielding arsenic(III) and three phenyl rings (C6H5)3. Arsenic(III) was attracted by the oxygen atom in the hydroxyl group of methanol (CH3OH) giving rise to As(OH)3; methanol reacted with the phenyl, yielding the formation of toluene (C7H8) (Park et al., 2013). The optimized geometry of As(OH)3 showed that the bond lengths between arsenic and the oxygen atom in the hydroxyl groups were 1.78, 1.79 and 1.80 Å, and the bond angles of O-As-O were 101.7,98.5 and 93.0°, respectively. Thermodynamic properties of this reaction demonstrated that this reaction was exothermic: the standard enthalpy change was −324.09 kJ/mol and the standard Gibb free energy change was –333.23 kJ/mol, respectively.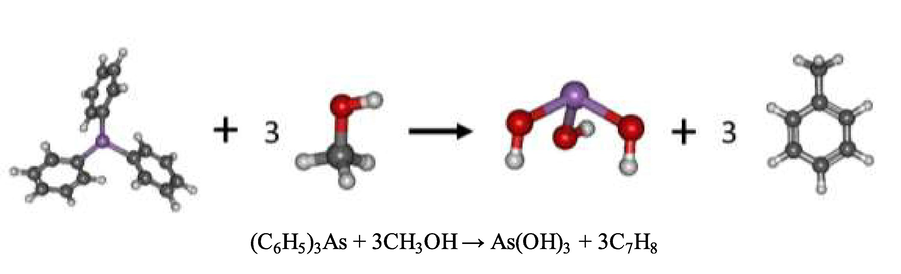
Schema of the reaction mechanism of triphenylarsine extraction by methanol at B3LYP/cc-pVTZ level of theory.
In Fig. 15, the experimental IR spectra show four main peaks at 412, 1015, 1640 and 3282 cm−1 respectively. The first experimental peak at 412 cm−1 resulted from the combination of the vibration in As(C6H5)3, denoting As-C stretching modes around 300 cm−1 and the out of plane C–H bending in phenyl rings, revealing two peaks around 485–486 and 716–718 cm−1. The vibration at As(OH)3 highlighted As-O stretching mode at 600–700 cm−1. The O–H bending modes gave rise to the peaks in two regions, which are 100–400 and 900–1000 cm−1, respectively. The vibration at C7H8 revealed out of plane C–H bending mode at 749 cm−1 respectively.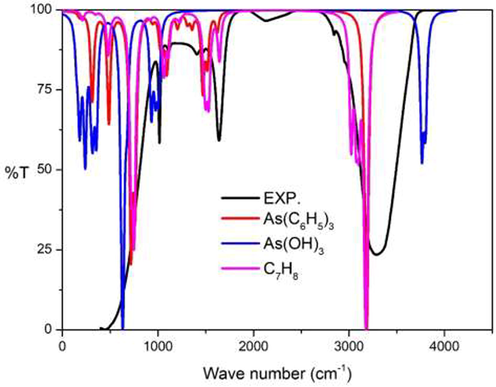
Experimental IR spectra: Part II chemical reaction compared to the calculational IR spectra at B3LYP/cc-pVTZ level of theory.
The second peak at 1015 cm−1 was due to the combination of the vibration: As(C6H5)3 at in-plane C–H bending mode at 1090 cm−1, As(OH)3O–H wagging mode at 1006 cm−1 and the C7H8 C–H wagging mode at 1065 cm−1. The third peak at 1640 cm−1 was due to the combination of the C–H bending mode of As(C6H5)3 around 1500 cm−1 and the in-plane C–H bending mode of C7H8 at 1531 cm−1. The last peak at 3282 cm−1 was a combination of the C–H stretching mode: As(C6H5)3 at 3191 cm−1, and the C–H stretching mode of C7H8 at 3178 cm−1, respectively.
4.11.3 Influence of HCl and methanol on triphenylarsine extraction
The synergistic extraction of (C6H5)3As was carried out by adding hydrochloric acid and methanol to the aqueous solution. The reaction mechanism of the synergistic extraction can be expressed, as follows:
In Fig. 16, the reaction between hydrochloric acid and methanol resulted in the product: methylene chloride (CH3Cl) and water. The bond breaking in the methanol and water formation occurred due to the attraction of protons from the hydrochloric acid along with the oxygen atom in methanol. Chloride anions were attracted to the methyl, yielding methylene chloride. Subsequently, methylene chloride was reduced by the triphenylarsine. In this step, the covalent bond between arsenic and triphenyl was broken. Arsenic(III) is seen to form a covalent bond with chloride anions while the phenyls formed a covalent bond with methyl, resulting in the product: trichloro arsenic (AsCl3) and toluene (C7H8). This reaction proved to be exothermic: the standard enthalpy change being −377.66 kJ/mol and the standard Gibbs free energy change being −392.63 kJ/mol, respectively. The standard Gibbs free energy change in the synergistic extraction using the mixture of hydrochloric acid and methanol was found to be more negative than normal. Extraction by pure hydrochloric acid or pure methanol results in an equilibrium constant of synergistic extraction greater than normal. It is implied that the amount of the product in the synergistic extraction is more than the product of the normal extraction.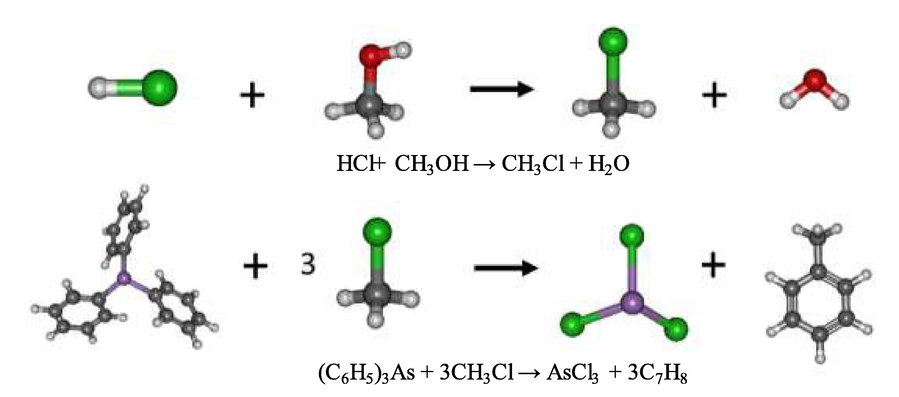
Schema of the reaction mechanism of triphenylarsine extraction by chloromethane at B3LYP/cc-pVTZ level of theory.
In Fig. 17, the experimental IR spectra show four main peaks at 409, 1015, 1637 and 3307 cm−1, respectively. The first experimental peak at 409 cm−1 was due to the combination of the vibration in As(C6H5)3. Herein, As-C stretching modes at 300 cm−1 and the out of plane C–H bending in phenyl rings demonstrated two peaks: namely, 485–486 and 716–718 cm−1: the vibration AsCl3 corresponded to As-Cl stretching mode at 300–400 cm−1 and the vibration C7H8 corresponded to in-plane C–H bending mode at 749 cm−1, respectively. The second peak at 1015 cm−1 was due to the combination of the vibration: As(C6H5)3 along with in-plane C–H bending mode at 1090 cm−1 and the C7H8 C–H wagging mode at 1065 cm−1. The third peak at 1637 cm−1 arose from the combination of the C–H bending mode of As(C6H5)3 around 1500 cm−1 and the in-plane C–H bending mode of C7H8 at 1531 cm−1. The last peak at 3307 cm−1 occurred from the combination of the C–H stretching mode of As(C6H5)3 at 3191 cm−1, and the C–H stretching mode of C7H8 at 3178 cm−1, respectively.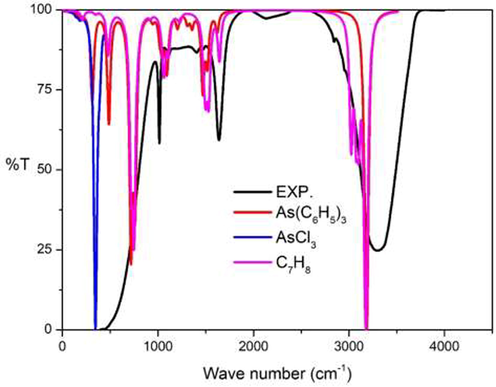
Experimental IR spectra: Part III synergistic chemical reaction compared to the calculational IR spectra at B3LYP/cc-pVTZ level of theory.
4.11.4 Thermodynamic parameters of extraction
In Table 4, the thermodynamic parameter of triphenylarsine extraction is shown. The equilibrium extraction constant for the calculated hydrochloric acid/methanol extract proved to be higher than that for the hydrochloric acid or methanol extractant. Therefore, the calculated results were found to be consistent with the results obtained from the experiment.
Variable list
HCl Extractant
CH3OH Extractant
HCl + CH3OH Extractant
ΔHcal (kJ/mol)
−204.87
−324.09
−377.66
ΔGcal (kJ/mol)
−225.41
–333.23
−392.63
ΔScal (kJ/mol)
0.0689
0.0306
0.0502
T (K)
298
298
298
Kex(cal)
1.0951
1.1439
1.1717
5 Conclusion
In this paper, results demonstrated that synergistic extraction, pulse velocity and the organic aqueous phase ratio had significant roles to play on the separation of arsenic ions from natural gas condensate via the pulse sieve-plate column. Pulse velocity per extraction was shown to correlate with the Sauter mean diameter and the axial dispersion coefficient. Pulse velocity of 2 cm/s demonstrated a smaller Sauter mean diameter (1.917 mm), a more specific interfacial area, and therefore better arsenic ions separation. The combination of HCl with MeOH increased the extraction of arsenic ions. The most influential extraction parameters were found to be pulse velocity, disperse phase and continuous phase flow ratio. The influence of the organic and aqueous phase ratio on the extraction of arsenic ions was shown to correlate well with percentage extraction, for all mass transfer coefficients: NTU and HTU.
Acknowledgements
The authors gratefully acknowledge financial support given by the Second Century Fund (C2F) Chulalongkorn University, Thailand Science Research and Innovation Fund Chulalongkorn University (IND66210015). Thanks are extended to Assoc. Prof. Kasidit Nootong and the Separation Laboratory, Department of Chemical Engineering, Faculty of Engineering, Chulalongkorn University, Bangkok, Thailand. Sincere thanks also go to the National e-Science Infrastructure Consortium (NECTEC) for providing computing resources that have contributed to the research results reported within this paper. The appreciation is also go to the Department of Chemical Engineering, Pathumwan Institue of Technology, Bankok, Thailand for supporting the Pulsed-Sieve Plate Column.
Declaration of Competing Interest
The authors declare that they have no known competing financial interests or personal relationships that could have appeared to influence the work reported in this paper.
References
- Gabedit - A graphical user interface for computational chemistry soft wares. J. Comput. Chem.. 2011;32:174-182.
- [CrossRef] [Google Scholar]
- Mass transfer studies in a horizontal pulsed sieve-plate column for uranium extraction by tri-n-octylamine using axial dispersion model. Prog. Nucl. Energy. 2017;98:71-84.
- [CrossRef] [Google Scholar]
- Hydrodynamic performance of a pulsed extraction column containing ZnO nanoparticles: drop size and size distribution. Chem. Eng. Res. Des.. 2017;121:275-286.
- [CrossRef] [Google Scholar]
- Van’t Hoff's Equation for endo reversible chemical reactions. J. Phys. Chem.. 1996;100:9193-9195.
- [CrossRef] [Google Scholar]
- Determination of arsenic in crude petroleum and liquid hydrocarbons. Environ. Geochem. Health. 1989;11:95-99.
- [CrossRef] [Google Scholar]
- Inhibition of copper corrosion in chloride solutions by amino-mercapto-thiadiazol and methyl-mercapto-thiadiazol: an impedance spectroscopy and a quantum-chemical investigation. Electrochim. Acta. 2004;49:2761-2770.
- [CrossRef] [Google Scholar]
- Bouhoun Ali, M., Badjah Hadj Ahmed, A.Y., Attou, M., Elias, A., Amine Didi, M., 2012. Liquid-Liquid Extraction of Uranium(VI) from Aqueous Solution using 1-Hydroxyalkylidene-1,1-diphosphonic Acids. Solvent Extr. Ion Exch. 30(5) 469-479. https://doi.org/10.1080/07366299.2012.670598.
- Simultaneous separation of mercury and lignosulfonate from aqueous solution using supported liquid membrane. J. Membr. Sci.. 2010;346:37-44.
- [CrossRef] [Google Scholar]
- Arsenic removal from As-hyperaccumulator Pteris vittata biomass: coupling extraction with precipitation. Chemosphere. 2018;193:288-294.
- [CrossRef] [Google Scholar]
- Delaney, D.D., 1988. Arsenic removal from shale oil by addition of basic materials. US Patent 4773988.
- Nicotiana tabacum leaf extract protects aluminium alloy AA3003 from acid attack. Arab. J. Chem.. 2019;12:4466-4478.
- [CrossRef] [Google Scholar]
- Study of axial mixing, holdup and slip velocity of dispersed phase in a pulsed sieve plate extraction column using radiotracer technique. Appl. Radiat. Isot.. 2009;67:1248-1253.
- [CrossRef] [Google Scholar]
- A new enhancement factor for mass transfer coefficients and designing pulsed sieved-plate columns. J. Chem. Eng. Jpn.. 2009;42:10-20.
- [CrossRef] [Google Scholar]
- Extraction of copper from acidic leach solution with Acorga M5640 using a pulsed sieve plate column. Hydrometall.. 2010;104(1):66-75.
- [CrossRef] [Google Scholar]
- Sauter mean diameter determination for the fine fraction of suspended sediments using a LISST-25X diffractometer. Measurement. 2012;45:364-368.
- [CrossRef] [Google Scholar]
- Frisch, M. J., Trucks, G. W., Schlegel, H. B., Scuseria, G. E., Robb, M. A., Cheeseman, J. R., Scalmani, G., Barone, V., Mennucci,B., Petersson, G. A., Nakatsuji, H., Caricato, M., Li, X., Hratchian, H. P., Izmaylov, A. F., Bloino, J., Zheng, G., Sonnenberg, J. L., Hada, M., Ehara, M., Toyota, K., Fukuda, R., Hasegawa, J., Ishida, M., Nakajima, T., Honda, Y., Kitao, O., Nakai, H., Vreven, T., Montgomery, J. A., Jr., Peralta, J. E., Ogliaro, F., Bearpark, M., Heyd, J. J., Brothers, E., Kudin, K. N., Staroverov, V. N., Kobayashi, R., Normand, J., Raghavachari, K., Rendell, A., Burant, J. C., Iyengar, S. S., Tomasi, J., Cossi, M., Rega, N., Millam, J. M., Klene, M., Knox, J. E., Cross, J. B., Bakken, V., Adamo, C., Jaramillo, J., Gomperts, R., Stratmann, R. E., Yazyev, O., Austin, A. J., Cammi, R., Pomelli, C., Ochterski, J. W., Martin, R. L., Morokuma, K., Zakrzewski, V. G., Voth, G. A., Salvador, P., Dannenberg, J. J., Dapprich, S., Daniels, A. D., Farkas, Ö., Foresman, J. B., Ortiz, J. V., Cioslowski, J., and Fox, D. J., Gaussian, Inc., Wallingford CT. 2009. Gaussian 09, Revision D.01.
- Copper extraction from ammoniacal medium in a pulsed sieve-plate column with LIX 84-I. J. Hazard. Mater.. 2010;183:165-175.
- [CrossRef] [Google Scholar]
- Copper extraction from ammoniacal medium in a pulsed sieve-plate column with LIX 84-I. Int. J. Hazard. Mater.. 2010;183(1–3):165-175.
- [CrossRef] [Google Scholar]
- Thermodynamics and Statistical Mechanics. Berlin and Heidelberg: Springer-Verlag; 1995. p. :101.
- Modelling of liquid–liquid extraction and liquid membrane separation of arsenic species in environmental matrices. Sep. Purif. Technol.. 2010;72:319-325.
- [CrossRef] [Google Scholar]
- Removal of Zn (II) from aqueous acetate solution using di (2-ethylhexyl) phosphoric acid and tributylphosphate. Inter. J. Chem.. 2012;4:32-41.
- [CrossRef] [Google Scholar]
- Enhanced removal of arsenic from aqueous medium by modifed silica nanospheres: kinetic and thermodynamic studies. Arab. J. Sci. Eng.. 2022;47:281-293.
- [CrossRef] [Google Scholar]
- Coagulation of methylated arsenic from drinking water: infuence of methyl substitution. J. Hazard. Mater.. 2015;293:97-104.
- [CrossRef] [Google Scholar]
- Extraction of arsenic(III) and arsenic(V) with Cyanex 925, Cyanex 301 and their mixtures. Hydrometall.. 2002;63(1):23-30.
- [CrossRef] [Google Scholar]
- Optimized values for a sieve plate pulsed column for acetic acid, water and kerosene system. Int. J. Technol. Manag. Sustain. Dev.. 2010;6:119-133.
- [Google Scholar]
- Single phase axial mixing studies in pulsed sieve plate liquid–liquid extraction columns. Chem. Eng. Res. Des.. 1995;73(A5):492-496.
- [Google Scholar]
- Semi-empirical and ab initio quantum chemical characterisation of pyridine derivatives as HCl inhibitors of aluminium surface. J. Mol. Struc. Theochem.. 2008;870:23-30.
- [CrossRef] [Google Scholar]
- Some hydrodynamic and masstransfer problems in pulsed sieve-plate extractors. Int. Chem. Eng.. 1965;5:656-661.
- [Google Scholar]
- How Do Oil and Natural Gas Prices affect U.S. industrial production? utilizing wavelet nonlinear denoised based quantile analysis. Energy Strategy Rev.. 2020;32:100550
- [CrossRef] [Google Scholar]
- CFD and experimental studies of single phase axial dispersion coefficient in pulsed sieve plate column. Chem. Eng. Res. Des.. 2011;89:1909-1918.
- [CrossRef] [Google Scholar]
- Separation and preconcentration of Arsenic(III) ions from aqueous media by adsorption on MWCNTs. Arab. J. Chem.. 2017;10:3682-3686.
- [CrossRef] [Google Scholar]
- Solvent extraction study of rare earths from nitrate medium by the mixtures of TBP and D2EHPA in kerosene. J. Met. Mat. Min.. 2005;15:89-95.
- [Google Scholar]
- Investigation into the determination of trimethylarsine in natural gas and its partitioning into gas and condensate phases using (cryotrapping)/gas chromatography coupled to inductively coupled plasma mass spectrometry and liquid/solid sorption techniques. Spectrochim. Acta B. 2007;62:970-977.
- [CrossRef] [Google Scholar]
- Correlations for prediction of mass transfer coefficients in single drop systems and liquid-liquid extraction columns. Chem. Eng. Res. Des.. 1999;77:372-384.
- [CrossRef] [Google Scholar]
- Predicting the adsorption capacity of iron nanoparticles with metallic impurities (Cu, Ni and Pd) for arsenic removal: a DFT study. Adsorption. 2020;26:127-139.
- [CrossRef] [Google Scholar]
- Simultaneous removal of arsenic and mercury from natural-gas-co-produced water from the Gulf of Thailand using synergistic extractant via HFSLM. J. Membr. Sci.. 2011;369:350-358.
- [CrossRef] [Google Scholar]
- Efficient simultaneous removal of cadmium and arsenic in aqueous solution by titanium-modified ultrasonic biochar. Bioresour. Technol.. 2019;284:333-339.
- [CrossRef] [Google Scholar]
- Axial dispersion coefficient and mass transfer rate in pulsed column. J. Nucl. Sci. Technol.. 1989;26:473-474.
- [CrossRef] [Google Scholar]
- Extraction and speciation of arsenic in plants grown on arsenic contaminated soils. Talanta. 2007;72:1507-1518.
- [CrossRef] [Google Scholar]
- Prediction of the mean drop diameter, dispersed phase hold-up and slip velocity in a horizontal pulsed sieve plate column for uranium stripping from Loaded Alamine 336 by ammonium carbonate. Prog. Nucl. Energy. 2019;117:103082
- [CrossRef] [Google Scholar]
- Longitudinal dispersion in pulsed perforated-plate columns. Ache J.. 1965;11(3):395-402.
- [CrossRef] [Google Scholar]
- Comparative study on electrochemical treatment of arsenite: efects of process parameters, sludge characterization and kinetics. Arab. J. Sci. Eng.. 2020;45:3799-3815.
- [CrossRef] [Google Scholar]
- Synergistic effect of Thiourea and HCl on Palladium (II) recovery: an investigation on Chemical structures and thermodynamic stability via DFT. Arab. J. Chem.. 2021;14(7):103196
- [CrossRef] [Google Scholar]
- Synergistic interplay between Aliquat 336 and organophosphorus extractants towards non-dispersive extraction of arsenic from petroleum produced water via hollow fiber membrane contactor. Sep. Purif. Technol.. 2022;286:120431
- [CrossRef] [Google Scholar]
- Reprocessing of spent nuclear fuel in India: present challenges and future programme. Prog. Nucl. Energy. 2017;101(A):118-132.
- [CrossRef] [Google Scholar]
- Spondias mombin L., as a green corrosion inhibitor for aluminium in sulphuric acid: Correlation between inhibitive effect and electronic properties of extracts major constituents using density functional theory. Arab. J. Chem.. 2012;5:361-373.
- [CrossRef] [Google Scholar]
- Modeling and simulation of a horizontal pulsed sieve-plate extraction column using axial dispersion model. Sep. Sci. Technol.. 2017;52:1537-1552.
- [CrossRef] [Google Scholar]
- Treatment of arsenic ions from produced water through hollow fiber supported liquid membrane. J. Alloys Compd.. 2009;482(1–2):328-334.
- [CrossRef] [Google Scholar]
- Kinetics for the reactions of phenyl with methanol and ethanol: comparison of theory and experiment. Proc. Combust. Inst.. 2013;34:473-482.
- [CrossRef] [Google Scholar]
- Study of As(V) transfer through a supported liquid membrane impregnated with trioctylphosphine oxide (Cyanex 921) J. Membr. Sci.. 2007;302:119-126.
- [CrossRef] [Google Scholar]
- Arsenic speciation in environmental and biological samples: extraction and stability studies. Anal. Chim. Acta. 2003;495:85-98.
- [CrossRef] [Google Scholar]
- Investigation of mass transfer performance in an L-shaped pulsed sieve plate extraction column using axial dispersion model. Chem. Eng. Res. Des.. 2017;128:130-145.
- [CrossRef] [Google Scholar]
- Hydrophobic natural deep eutectic solvent THY-DA as sole extracting agent for arsenic (III) removal from aqueous solutions. Environ. Technol. Innov.. 2021;24:2352-11864.
- [CrossRef] [Google Scholar]
- Leaf-extract mediated zero-valent iron for oxidation of Arsenic (III): preparation, characterization and kinetics. Chem. Eng. J.. 2018;347:91-100.
- [CrossRef] [Google Scholar]
- Arsenic speciation analysis: a review with an emphasis on chromatographic separations. Trends Anal. Chem. TrAC. 2020;123:115770
- [CrossRef] [Google Scholar]
- Catalysts surface poisoning by arsenic; mechanism of triphenylarsine interaction with alumina supported nickel. Stud. Surf. Sci. Catal.. 2001;139:479-486.
- [CrossRef] [Google Scholar]
- Axial mixing and mass transfer investigation in a pulsed packed liquid–liquid extraction column using plug flow and axial dispersion models. Chem. Eng. Res. Des.. 2012;90:193-200.
- [CrossRef] [Google Scholar]
- Phytofltration of arsenic by aquatic moss (Warnstorfa fuitans) Environ. Pollut.. 2018;237:1098-1105.
- [CrossRef] [Google Scholar]
- Sangtumrong, S., Ramakul, P., Satayaprasert, C., Pancharoen, U., Lothongkum, A.W., 2007. Purely Separation of Mixture of Mercury and Arsenic via Hollow Fiber Supported Liquid Membrane. J Ind Eng Chem. 13(5), 751-756. UCI: G704-000711.2007.13.5.003.
- Determination of mass transfer coefficient in an L-shaped pulsed column with sieve-plate structure: application of best-fit technique, drop size distribution, and forward mixing model. Chem. Eng. Process.. 2022;170:108706
- [CrossRef] [Google Scholar]
- Liquid-liquid dispersion in pulsed disc and doughnut column and pulsed sieve plate column: a comparative study. Prog. Nucl. Energy. 2019;116:76-86.
- [CrossRef] [Google Scholar]
- Sertçelik, M., Özbek, F.E., Taslimi, P., Durman, M., Özdemir, M., Yalçın, B., Necefoğlu, H., Hökelek, T., Synthesis, 2020. spectroscopic characterization, crystal structure, density functional theory studies and biological properties of coordination complex Ni(II) 2-fluorobenzoate with 3-hydroxypyridine. Appl. Organomet. Chem. 34(9). https://doi.org/10.1002/aoc.5802
- Rice is a potential dietary source of not only arsenic but also other toxic elements like lead and chromium. Arab. J. Chem.. 2017;10:3434-3443.
- [CrossRef] [Google Scholar]
- Mass transfer studies in a pulsed extraction column: longitudinal concentration profiles. Ind. Eng. Chem.. 1962;193–103
- [CrossRef] [Google Scholar]
- Sreenivasulu, K., Venkatanarasaiah, D., Varma, 1997. Y.B., Drop size distributions in liquid pulsed columns. Bioprocess Eng. 17 189–195
- Axial dispersion in plate-pulsed columns. Bioprocess. Eng.. 1987;2:161-168.
- [CrossRef] [Google Scholar]
- Selective removal of arsenate from drinking water using a polymeric ligand exchanger. Water Res.. 2005;39:4993-5004.
- [CrossRef] [Google Scholar]
- The elimination of trace arsenic via hollow fiber supported liquid membrane: experiment and mathematical model. Sci. Rep.. 2021;11:11790.
- [CrossRef] [Google Scholar]
- A dynamic forward mixing model for evaluating the mass transfer performances of an extraction column. Chem. Eng. Sci.. 2004;59:4457-4466.
- [CrossRef] [Google Scholar]
- Implications of hydrodynamics on the design of pulsed sieve-plate extraction columns: a one-fluid multiphase CFD model using the volume of fluid method. Chem. Eng. Sci.. 2020;221:115640
- [CrossRef] [Google Scholar]
- Mass transfer performance in a pulsed sieve-plate extraction column. Proc. Pakistan Acad. Sci.. 2006;43:173-179.
- [CrossRef] [Google Scholar]
- The hydrodynamic behavior of a pulsed perforated plate column. Proc. Int. Solv. Extr. Conf.. 1983;1:168-169.
- [Google Scholar]
- Phase behavior of condensate gas and CO2 / CH4 re-injection performance on its retrograde condensation. Arab. J. Chem.. 2022;15:104065
- [CrossRef] [Google Scholar]
- Back-end of Indian nuclear fuel cycle-a road to sustainability. Prog. Nucl. Energy. 2017;101(A):133-145.
- [CrossRef] [Google Scholar]
- Extraction of arsenic from sulphuric acid solutions by Cyanex 923. Hydrometall.. 1997;46:235-241.
- [CrossRef] [Google Scholar]
- Evaluation of the extraction methods for arsenic speciation in rice straw, Oryza sativa L., and analysis by HPLC-HG-AFS. J. Anal. At. Spectrom.. 2005;20:103-110.
- [CrossRef] [Google Scholar]
Appendix A
Supplementary material
Supplementary data to this article can be found online at https://doi.org/10.1016/j.arabjc.2023.104756.
Appendix A
Supplementary material
The following are the Supplementary data to this article:Supplementary data 1
Supplementary data 1


