

Translate this page into:
Anti-tumor potential and mode of action of karanjin against breast cancer; an in-silico approach
⁎Corresponding authors. Prarambh1997@gmail.com (Prarambh S.R. Dwivedi), drcshastry@gmail.com (C.S. Shastry) principal.ngsmips@nitte.edu.in (C.S. Shastry)
-
Received: ,
Accepted: ,
This article was originally published by Elsevier and was migrated to Scientific Scholar after the change of Publisher.
Abstract
Abstract
Karanjin modulates 144 targets against breast cancer. Cytotoxicity studies displayed the highest cytotoxicity on SKBR3 cell lines. Karanjin majorly modulates the PI3K-Akt signaling pathway. Karanjin possesses anti-cancer potential against breast cancer by modulating CYP1A1 and PI3KCA.
Abstract
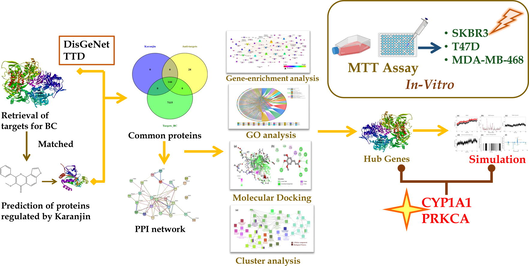
Karanjin is a furanoflavanoid first isolated from Pongamia pinnata and has been reported to possess a cytotoxic effect on various lung, breast, leukemia, and hepatoma cancers. However, the mechanism by which karanjin persists cytotoxic effect has yet not been unleashed for breast cancer. Hence, the present study aimed to predict a possible molecular mechanism of karanjin against breast cancer and its assessment on various breast cancer cell lines. We utilized multiple system biology tools like gene set enrichment analysis, gene ontology analysis, cluster analysis, molecular docking, molecular dynamic simulations, and MMPBSA analysis to predict the lead targets. Targets for breast cancer were retrieved from DisGeNet and Therapeutic Target Prediction and matched with targets of karanjin; further, they were subjected to gene enrichment and gene ontology analysis. Molecular docking was performed on all the matched targets; the top three complexes displaying the best binding affinity and the top three hub genes predicted via gene enrichment were selected for MD simulation. Cytotoxicity assay was performed on three different cell lines T47D, MDA-MB-468, and SKBR3, at different time exposures of 24, 48, and 96 hrs. Gene enrichment analysis predicted PI3KCA, PI3KCB, and EGFR as the top 3 hub genes and the PI3K-Akt signaling pathway as the majorly modulated pathway. Molecular docking revealed CYP1A1 to possess the least binding energy (-11.7 Kcal/mol) followed by AKR1C3 (-10.2 Kcal/mol), and CYP3A4 (-10 Kcal/mol). Further, molecular dynamic simulation and MMPBSA analysis displayed the complex of karanjin with CYP1A1 and PI3KCA to be the most stable. The cytotoxicity assay revealed karanjin to possess a more significant cytotoxic effect on SKBR3 cell lines with a dose-dependent increase in efficiency and also displayed an additive/synergistic effect on the three cell lines when used in combination with a tamoxifen/gefitinib. The predictions revealed that karanjin may possess anti-breast cancer potential by the modulation of proteins CYP1A1 and PIK3CA via the PI3K-Akt signaling pathway. However, the mechanism has been proposed via in-silico tools, which need further validation using wet lab protocols; this is the future scope of the study.
Keywords
Breast cancer
CYP1A1
Cytotoxicity
Karanjin
Molecular docking
PI3KCA

- 2D
-
2 Dimensional
- 3D
-
3 Dimensional
- AhR
-
Aryl hydrocarbon Receptor
- BC
-
Breast Cancer
- BP
-
Biological Process
- CC
-
Cellular Component
- CGenFF
-
CHARMM General Force Field
- DMSO
-
Dimethyl sulfoxide
- EGFR
-
Epidermal growth factor receptor
- ELISA
-
enzyme-linked immunosorbent assay
- FBS
-
Fetal bovine serum
- FDR
-
False Discovery Rate
- GC
-
Gene Count
- GO
-
Gene Ontology
- HRT
-
Hormone Replacement Therapy
- IBC
-
Inflammatory breast cancer
- IC50
-
Inhibitory Concentration 50
- KEGG
-
Kyoto Encyclopedia of Genes and Genomes
- MD
-
Molecular Dynamics
- MF
-
Molecular Function
- MMFF94
-
Merck Molecular Force Field 94
- MMPBSA
-
Molecular Mechanics Poisson-Boltzmann Surface Area
- MTT
-
(3-(4, 5-dimethylthiazolyl-2)-2, 5-diphenyltetrazolium bromide)
- NCCS
-
National Centre for Cell Science
- NPT
-
Constant temperature, constant pressure
- NVT
-
Constant temperature, constant volume
- PBS
-
Phosphate Buffer Saline
- PDB
-
Protein Data Bank
- PME
-
Particle Mesh Ewald
- RCSB
-
Research Collaboratory for Structural Bioinformatics
- RMSD
-
Root Mean Square Deviation
- RMSF
-
Roost Mean Square Fluctuation
- RoG
-
Radius of Gyration
- RPMI
-
Roswell Park Memorial Institute
- SASA
-
Solvent Accessible Surface Area
- SMILES
-
Simplified Molecular Input Line Entry System
- TNBC
-
Triple Negative Breast Cancer
- TTD
-
Therapeutic Target Database
Abbreviations
1 Introduction
Cancer is an eminent disease worldwide, with a vast number of deaths every year (Vanitha et al., 2023; Parkin et al., 2005; Parkin et al., 2001). Breast cancer (BC) is known to be one of the most dreaded diseases among women, with one in every eight women being diagnosed with BC throughout their lifetime (Lee et al., 2018; Al Diab et al., 2013). Worldwide BC is reported to be diagnosed in 43 women from one-tenth of a million; Australia & New Zealand top the list, with 94.2 women in one lakh being diagnosed with BC each year (Seneviratne et al., 2015; de Ruijter et al., 2011; Barr et al., 2008). BC can be deduced by identifying a lump in the breast, blood discharge from nipples, and change in shape or texture of the breast; diagnosed by mammography (Taylor et al., 2011; Kurono et al., 2016). The primary cause of BC includes age (>55), gender, family history, smoking, alcohol, obesity, and hormone replacement therapy (Momenimovahed & Salehiniya, 2019). The current treatment involves surgery, radiation therapy, immunotherapy, hormone therapy, and chemotherapy (Baskar et al., 2012; Miller et al., 2016; Akram et al., 2017).
BC can be majorly sub-classified as luminal A, luminal B, HER2+, and triple-negative breast cancer (TNBC); among these luminal A is the most predominant with 70% of the cases (Maruthanila et al., 2017; Gupta et al., 2018; Carey et al., 2017). The current chemotherapy for BC implies the use of drugs depending upon the genetic expression profile i.e., for luminal A, the treatment involves the use of aromatase inhibitors (letrozole, anastrozole, exemestane; which prevent the production of estrogen) and selective estrogen receptor modulators (tamoxifen and raloxifene; which prevent the action of estrogen on the estrogen receptor) (Lakshmithendral et al., 2019; Hernando et al., 2021). Similarly, for HER2 + drugs like pertuzumab, trastuzumab, and gefitinib are used (Cesca et al., 2020) and for TNBC drugs like anthracyclines, taxanes, capecitabine, gemcitabine, and eribulin are used (Won & Spruck, 2020). However, these drugs have several side effects like chills, hyperthermia, swelling of the face and lips, headache, hot flushes, feeling sick, wheezing, and breathlessness (Maruthanila et al., 2019; Partridge et al., 2001). In addition, drug resistance has become a frequent issue that needs to be improved. In this context, the role of natural bio-actives has been efficiently recognized in terms of chemo-preventive and therapeutic roles (Chen & Zhang, 2018).
In a probe to disseminate novel anti-cancer drugs, polyphenolic bio-actives own great importance. Karanjin (3-methoxy-2-phenylfuro-(2, 3-h-chrome-4-ol), C18H12O4) a bioactive furanoflavonoid and a potent bio-molecule, was first isolated from Pongamia pinnata (L.) (Bose et al., 2014). The flavonoid polyphenol backbone present in furanoflavonoids increases sensitivity to ambient changes, altering biological activity through modifications in solubility, hydrophobicity, and spectroscopic properties (Singh et al., 2021). Karanjin possesses multiple health benefits and applications, with evident anti-diabetic (Badole et al., 2013), anti-cancer (George et al., 2010), anti-inflammatory (Prabha et al., 2009), anti-hyperglycaemic, anti-oxidant (Anuradha and Krishnamoorthy, 2011), anti-colitis, anti-ulcer, and anti-alzheimer properties (Al Muqarrabun et al., 2013; Varshney et al., 2019). Karanjin has been reported to target various reactive oxygen species, damage DNA, and activate nuclear factor kappa-light-chain-enhancer of β cell signaling, leading to G2/M arrest and apoptosis in cervical cancer cells. (Batovska & Todorova, 2010, Roy et al., 2019).
In the current scenario of drug discovery, system biology tools concede illustrious prestige at the early stage of drug discovery (Dwivedi et al., 2021a; Dwivedi et al., 2021b; Dwivedi et al., 2021c). However, breast cancer has a diverse pathophysiology, with one drug being effective against a subtype and ineffective against another (Goldhirsch et al., 2011). In this context, it kindled us to assess the effect of karanjin on various breast cancer cell lines (T47D, MDA-MB-468, and SKBR3) belonging to different subtypes luminal A, basal, and HER2+. Moreover, there is no evidence for depicting the molecular mechanism of karanjin against breast cancer; this kindled us to identify potential targets via utilizing various in-silico tools like gene set enrichment, gene ontology (GO) analysis, and molecular docking which is further validated by molecular dynamic simulations, and Molecular Mechanics Poisson-Boltzmann Surface Area (MMPBSA) analysis.
2 Material and methods
2.1 Network pharmacology
2.1.1 Identification of targets
The targets involved in the pathogenesis of breast cancer were retrieved from two databases i.e., the DisGeNet database (https://www.disgenet.org; using the keywords “Breast Carcinoma” and “Malignant neoplasm of breast” with disease id “C0678222” & “C0006142” respectively) and Therapeutic Target Database (TTD; https://db.idrblab.net/ttd/) using the keyword “Breast cancer”. The targets of karanjin were retrieved from three databases i.e., SwissTargetPrediction (https://www.swisstargetprediction.ch/), DIGEP-Pred (https://www.way2drug.com/ge; Lagunin et al., 2013), and Binding DB (https://www.bindingdb.org/bind/).
2.1.2 Network and gene ontology analysis
The targets involved in breast cancer were matched with the proteins known to be regulated by karanjin. Additionally, the targets in common were subjected to STRING (Szklarczyk et al., 2017) ver. 11.5 (https://string-db.org/) to retrieve protein–protein interaction, KEGG Pathway, and GO analysis. Moreover, KEGG pathway analysis was utilized to identify pathways regulated by karanjin which were further integrated into Cytoscape ver. 3.9.0 (Shannon et al., 2003) to acquire pathway-protein interaction. The network analysis was performed on the basis of “Edge count”, “Node degree distribution”, and “Betweenness by degree” where parameters like eccentricity, neighbourhood connectivity, in-degree distribution, and out-degree distribution were analyzed. The GO of karanjin modulated proteins was retrieved from STRING comprising cellular component (CC), molecular function (MF), and biological process (BP). A chord diagram was constructed for the top 5 CC, MF, and BP via OriginLab Origin 2022b.
2.1.3 Cluster analysis
The ClueGO (Bindea et al., 2009) add-on module of Cytoscape ver. 3.9.0 was utilized to perform cluster analysis; CC, MF, and BP enriched genes were analyzed by implementing two-sided hyper-geometric functional analysis with a p-value cutoff less than 0.05 and kappa score threshold of 0.4 using Bonferroni step-down correction method. In addition, the ‘GO tree interval’ was kept in the range of ‘3–8 pathways’, and ‘GO term selection of cluster’ was set to three genes minimum with a percentage of 4.
2.2 Molecular docking
In the present study, 144 proteins were docked with karanjin and the top 20 proteins with which karanjin possessed high binding affinity were docked with standard drugs tamoxifen and gefitinib on AutoDock vina as control.
2.2.1 Preparation of proteins
The structures of targets were initially queried in UniProt (https://www.uniprot.org/) database to identify available targets in Protein Data Bank (RCSB; https://www.rcsb.org/). The targets not available were further modeled using the known FASTA sequence deposited in the UniProt database by SWISS-MODEL (Guex & Peitsch, 1997; https://swissmodel.expasy.org) (Table S1). All the hetero-atoms present in the protein were removed and saved in .pdb utilizing Discovery studio visualizer (BOVIA Discovery Studio Visualizer; https://discover.3ds.com/discovery-studio-visualizer-download). Further, energy was minimized for all the proteins using the MMFF94 forcefield (Halgren, 1996).
2.2.2 Preparation of ligand
The 3D conformation of karanjin, tamoxifen, and gefitinib was retrieved from the PubChem database in .sdf. The 3D conformer was converted into .pdb using Discovery studio visualizer 2019. The energy of the ligand was minimized and converted into .pdbqt format before subjecting it to docking.
2.2.3 Grid box generation
The grid box was generated on the active site of the protein which was identified via the CASTp (https://sts.bioe.uic.edu/castp/; Tian et al., 2018) online active site identifier. The cavity possessing the largest solvent-accessible surface area was chosen for grid box generation (Table S1).
2.2.4 Protein-Ligand docking
The ligand karanjin was subjected to docking via AutoDock vina to assess the binding affinity of karanjin with proteins involved in the pathogenesis of breast cancer. The parameters like binding energy, number of hydrogen bonds, number of hydrogen bond residues, number of π-π interactions along with their residues, and vander waal forces were utilized for assessing the binding affinity of karanjin. In addition, docking was performed with standards tamoxifen and gefitinib on the top 20 targets possessing the highest binding affinity with karanjin. The top three proteins with which karanjin possessed the highest binding affinity were further subjected to MD simulation studies for validation.
2.3 Molecular dynamic simulation
MD simulation was performed using gromacs (https://www.gromacs.org/) ver. 2021.6. Initially, the complex was prepared by removing any hetero atoms present. The protein topology was generated by applying CHARMM36 all-atom force field (Vanommeslaeghe et al., 2010) ver. Feb2021 using the pdb2gmx module of gromacs. The ligand topology was prepared via CHARMM General Force Field (CGenFF) server (https://cgenff.umaryland.edu/) and hydrogens were added wherever required by utilizing the Avogadro program. The intermediate complex was built using the editconf module of gromacs. Further, the complex was solvated using a three-point water model in a dodecahedron box possessing 1 nm dimensions on all sides. The system was neutralized by adding positive (Na+) and negative (Cl-) counter ions as per need. The system was further subjected to energy minimization using the steepest descent integrator with a verlet cutoff-scheme for a maximum of 50,000 steps followed by adding restrains. The system was equilibrated using canonical (NVT) and isobaric (NPT) equilibrators for 1 ns for two coupling groups i.e., protein–ligand and water-ions. A modified Berendsen thermostat (V-rescale) was applied to maintain constant volume and temperature at 300 K. Similarly, a C-rescale pressure coupling algorithm was applied to maintain constant pressure at 1 bar. Particle Mesh Ewald (PME) was applied for computing long-range electrostatics, coulomb, and vander waals with a cut-off of 1.2 nm. The LINCS algorithm was used to constrain bond length. Each complex was subjected to MD run for 200 ns; the coordinates and energies were saved at every 20 picoseconds to acquire 10,000 frames. The trajectories generated were analyzed using in-built gromacs utilities. The parameters Root Mean Square Deviation (RMSD), Root Mean Square Fluctuation (RMSF), Radius of Gyration (RoG), Solvent Assessable Surface Area (SASA), and number of hydrogen bonds were retrieved for a time span of 200 ns; visualized on QtGrace.
2.4 Molecular mechanics Poisson-Boltzmann Surface Area (MMPBSA) analysis
The gmx_MMPBSA (Valdés-Tresanco et al., 2021) module was used to analyze the energy contribution parameters like vander waal and electrostatic molecular mechanics, polar contribution to the solvation, non-polar contribution of solute–solvent interactions to the solvation, non-polar contribution of attractive solute–solvent interactions to the solvation, total gas phase molecular mechanics, total solvation, total relative binding, and total energy contribution per residue.
The MMPBSA run was performed for 100 frames from a total of 10,000 frames with an interval of 100. The Poisson Boltzmann calculations were performed using an internal PBSA solver in a sander. The MMPBSA_ana module was used to visualize the results obtained from the gmx_MMPBSA run (Kumari & Kumar, 2014).
2.5 In-vitro cytotoxicity assay
2.5.1 Procurement of chemicals and cell lines
The test agent karanjin was procured from Biosyn research chemicals (P) Ltd. with batch number BRCKRNG-1–1120-01. The culture media was prepared using cell culture grade RPMI-1640 (CAS No: 162A), fetal bovine serum (FBS; CAS No.: RM10432), trypsin (CAS No.: TCL-011), MTT powder (CAS No.: TC191), and gefitinib (CAS No.: TC414) procured from HiMedia Laboratories, LLC. The antibiotic–antimycotic (Cat. No. 15240062) solution was procured from GibcoTM. Tamoxifen (CAS No. 10540–29-1) was procured from Carbanio (https://in.carbanio.com/search?q). Three cell lines depicting different types of breast cancer gene expression profiles i.e., T47D (luminal A), MDA-MB-468 (basal), SKBR-3 (HER2+) were procured from National Centre for Cell Sciences (NCCS), Pune. The cells were cultured in RPMI-1640 media supplemented with 10% FBS and 1% antibiotic–antimycotic solution (containing 100 U of penicillin, 10 mg streptomycin, and 25 μg amphotericin B per ml in 0.9% normal saline). The cells were subcultured and maintained in T25 and T75 flasks at 37℃ with 5% CO2 in a humidified incubator.
2.5.2 Preparation of test samples
A stock solution of 1 M was prepared for tamoxifen, gefitinib, and karanjin dissolved in less than 5% DMSO followed by serial dilution of 7 concentrations with media up to 10 nM for MTT assay. All the experiments were performed in triplicates.
The percent cytotoxicity of karanjin was determined using MTT assay on three cell lines for different time periods of 24, 48, and 96 hrs alone, and in combination with the standards. Firstly, MTT was performed on tamoxifen, gefitinib, and karanjin to assess the IC50 & IC25 for the three different cell lines and later the IC25 of tamoxifen and gefitinib was used to assess the effect of karanjin in combination.
2.5.3 Seeding of cells
Cells were plated onto 96-well flat bottom plates with a cell density of 10,000 cells/well, and the cells were allowed to grow for 24 hr with the required media supplements. Later, media was removed and different concentrations of test agents pre-dissolved in 5% DMSO and FBS-supplemented RPMI were added to the wells and kept for incubation for 24, 48, and 96 hrs at 37℃ with 5% CO2.
2.5.4 MTT assay of karanjin
On completion of incubation test agents were removed and the cells were washed with PBS and 20 μL of MTT reagent (5 mg/mL) was added followed by 4 hrs of incubation. After completion, MTT was removed and the cells were washed thrice with PBS and 100 μL of DMSO (99.5%) was added to each well to dissolve the formazan crystals. The absorbance was noted at 570 nm with gentle shaking on thermo scientific multiskan ELISA plate reader. The % cytotoxicity was assessed with respect to cell viability (Aslantürk, 2018).
3 Results
3.1 Network pharmacology
3.1.1 Identification of targets
A total of 7258 proteins were identified to be involved in the pathogenesis of BC. 6775 targets were retrieved from DisGeNet database using the keyword “Breast Carcinoma” and 6940 targets were identified using the keyword “Malignant neoplasm of breast” from which 89.8% of the proteins were in common. Similarly, 154 targets were retrieved from TTD of which 57.14% of proteins were common with DisGeNet retrieved proteins (Fig. 1a). A total of 172 proteins were predicted to be modulated by karanjin out of which 83.72% of proteins were in common with targets of BC (Fig. 1b). Categorical classification of matched proteins between karanjin and breast cancer revealed top three categories to be affiliated as enzymes (27.1%), kinases (25.7%), and G-protein coupled receptors (5.6%) (Fig. S1).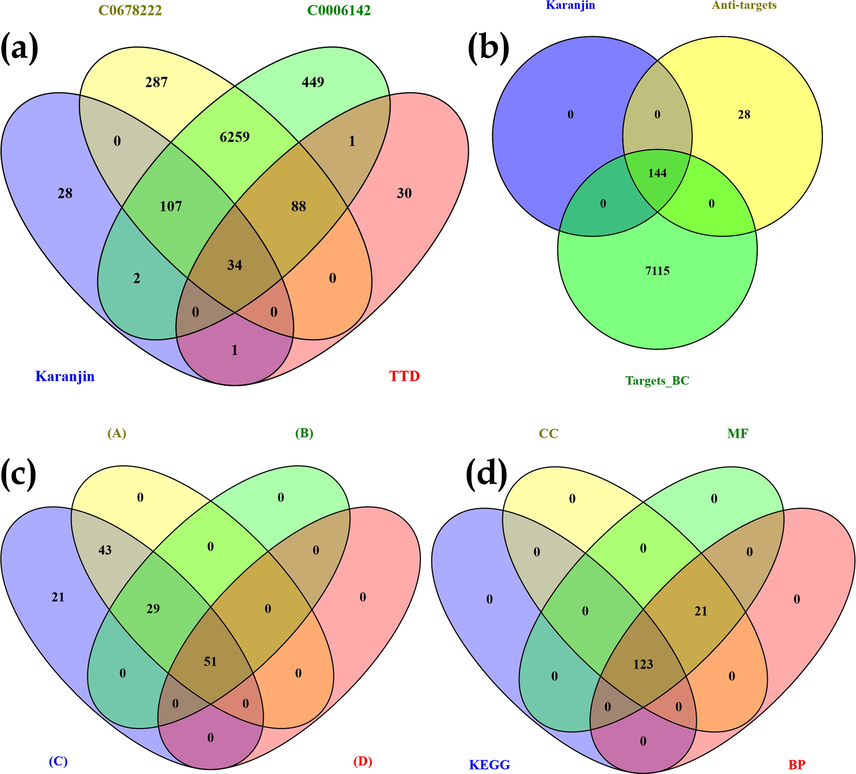
Venn diagram representation of (a) Targets involved in “Breast carcinoma” (C0678222) vs Targets involved in “malignant neoplasm of breast” (C0006142) vs targets retrieved for breast cancer via Therapeutic Target Database (TTD); (b) targets of karanjin vs targets involved in Breast cancer (C0678222 & C0006142) vs anti-targets; (c) With respect to targets modulated via karanjin after KEGG enrichment analysis (A) String recognized genes; (B) Genes identified to be involved in cancer pathways(via KEGG); (C) genes modulated by karanjin predicted to be involved in breast cancer(before KEGG enrichment); (D) Genes modulated by karanjin involved in the pathogenesis of breast cancer (after KEGG enrichment); (d) GO terms Cellular component (CC), molecular function(MF), and biological process(BP) vs KEGG mediated genes.
3.1.2 Gene set enrichment and network analysis
STRING was used to assess protein–protein interaction by subjecting the matched targets; 123 targets were recognized by STRING with 159 KEGG integrated pathways (Fig. 2). The recognized pathways were assessed for their involvement in breast cancer which revealed 21 pathways to be involved in the pathogenesis of BC (Table 1). Enrichment analysis was performed for the genes regulated via KEGG-identified BC pathways which revealed 35.42% of the proteins to be in common (Fig. 1c). A protein-pathway interaction was constructed via Cytoscape on the basis of edge count which revealed EGFR (16), PI3KCA (16), PI3KCB (16), PI3KCD (16), and CDK4 (13) to be the top 5 proteins regulated by the greatest number of KEGG enriched pathways (Fig. 3). Similarly, JAK2, MCL1, and PI3KCG possessed the highest neighbourhood connectivity of 18. In addition, PI3K-Akt signaling pathway (KEGG ID: hsa04151) was predicted to possess the highest edge count of 18 with neighborhood connectivity of 7.78 (Table S2). Where, OGC: Observed Gene Count; BGC: Background Gene Count; FDR: False Discovery Rate.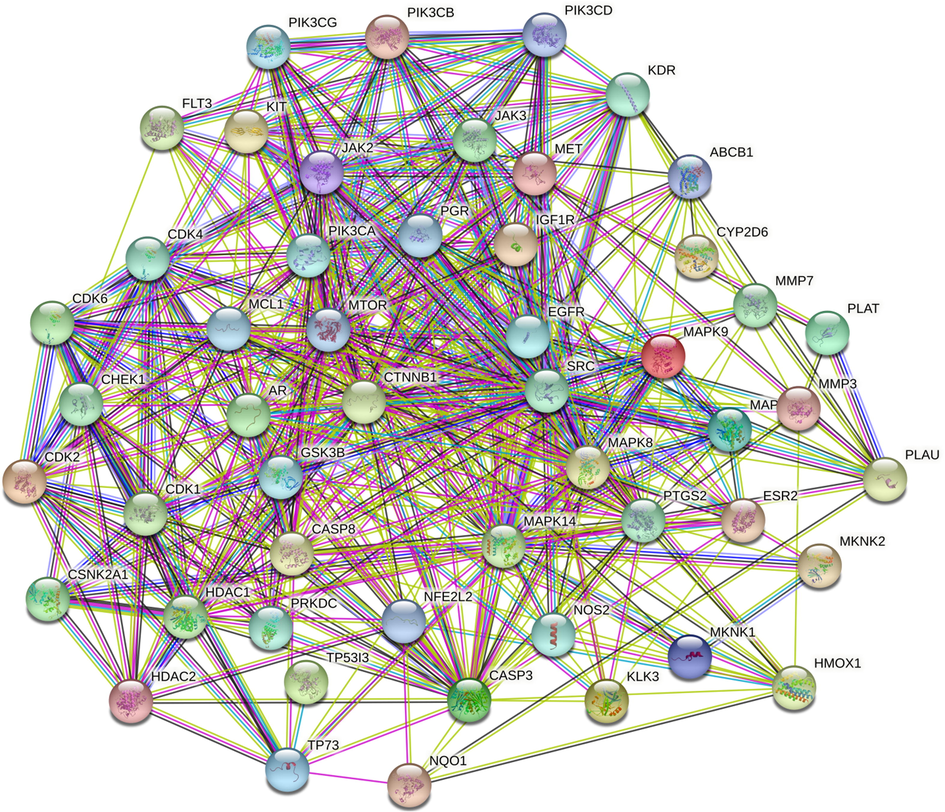
Figure 2: Protein-Protein interaction of targets modulated by Karanjin. Where, Node color;
 colored nodes: query proteins and first shell of interactors,
 white nodes: second shell of interactors, Node content;
 Empty nodes: Proteins of unknown 3D structure,
 Filled nodes: some 3D structure is known or predicted. Edges: known interactions;
 from curated databases,
 experimentally determined, Predicted interactions;
 gene neighbourhood,
 gene fusions,
 gene co-occurance & others;
 textmining,
 co-expression,
 protein homology.
Pathway(KEGG ID)
OGC
BGC
Strength
FDR
Gene
Endocrine resistance (hsa01522)
14
95
1.3
3.42E-12
MAPK14, CDK4, PIK3CA, IGF1R, EGFR, PIK3CB, ESR2, MAPK10, CYP2D6, MTOR, SRC, PIK3CD, MAPK8, MAPK9
Prostate cancer (hsa05215)
14
96
1.3
3.42E-12
PLAT, PIK3CA, CDK2, IGF1R, EGFR, PIK3CB, MMP3, KLK3, GSK3B, CTNNB1, MTOR, PLAU, AR, PIK3CD
Hepatocellular carcinoma (hsa05225)
14
160
1.08
7.87E-10
HMOX1, CDK4, PIK3CA, CDK6, IGF1R, EGFR, PIK3CB, MET, NQO1, GSK3B, CTNNB1, MTOR, PIK3CD, NFE2L2
Colorectal cancer (hsa05210)
11
82
1.26
1.55E-09
PIK3CA, EGFR, PIK3CB, CASP3, GSK3B, CTNNB1, MAPK10, MTOR, PIK3CD, MAPK8, MAPK9
Breast cancer (hsa05224)
13
145
1.09
2.73E-09
CDK4, PIK3CA, CDK6, IGF1R, EGFR, KIT, PIK3CB, GSK3B, PGR, ESR2, CTNNB1, MTOR, PIK3CD
PI3K-Akt signaling pathway (hsa04151)
18
350
0.84
3.63E-09
FLT3, CDK4, KDR, PIK3CA, CDK6, CDK2, IGF1R, EGFR, KIT, PIK3CB, MET, GSK3B, PIK3CG, MTOR, MCL1, PIK3CD, JAK2, JAK3
Pancreatic cancer (hsa05212)
10
73
1.27
6.56E-09
CDK4, PIK3CA, CDK6, EGFR, PIK3CB, MAPK10, MTOR, PIK3CD, MAPK8, MAPK9
ErbB signaling pathway (hsa04012)
10
83
1.21
1.97E-08
PIK3CA, EGFR, PIK3CB, GSK3B, MAPK10, MTOR, SRC, PIK3CD, MAPK8, MAPK9
p53 signaling pathway (hsa04115)
9
72
1.23
7.84E-08
TP53I3, CDK4, CDK6, CDK2, CASP3, CASP8, TP73, CDK1, CHEK1
Small cell lung cancer (hsa05222)
9
92
1.12
4.07E-07
CDK4, PIK3CA, CDK6, CDK2, PIK3CB, CASP3, NOS2, PTGS2, PIK3CD
Non-small cell lung cancer (hsa05223)
8
68
1.2
5.35E-07
CDK4, PIK3CA, CDK6, EGFR, PIK3CB, MET, PIK3CD, JAK3
Glioma (hsa05214)
8
72
1.18
7.07E-07
CDK4, PIK3CA, CDK6, IGF1R, EGFR, PIK3CB, MTOR, PIK3CD
Melanoma (hsa05218)
8
72
1.18
7.07E-07
CDK4, PIK3CA, CDK6, IGF1R, EGFR, PIK3CB, MET, PIK3CD
Gastric cancer (hsa05226)
10
144
0.97
1.06E-06
PIK3CA, CDK2, EGFR, PIK3CB, MET, GSK3B, CTNNB1, MTOR, PIK3CD, ABCB1
MAPK signaling pathway (hsa04010)
13
288
0.79
1.70E-06
MAPK14, FLT3, MKNK2, KDR, IGF1R, EGFR, KIT, CASP3, MET, MAPK10, MKNK1, MAPK8, MAPK9
Cell cycle (hsa04110)
9
120
1.01
2.22E-06
CDK4, CDK6, CDK2, PRKDC, GSK3B, HDAC1, CDK1, CHEK1, HDAC2
Chronic myeloid leukemia (hsa05220)
7
75
1.1
9.13E-06
CDK4, PIK3CA, CDK6, PIK3CB, HDAC1, PIK3CD, HDAC2
Endometrial cancer (hsa05213)
6
57
1.16
2.39E-05
PIK3CA, EGFR, PIK3CB, GSK3B, CTNNB1, PIK3CD
Estrogen signaling pathway (hsa04915)
7
133
0.85
0.00023
PIK3CA, EGFR, PIK3CB, PGR, ESR2, SRC, PIK3CD
Wnt signaling pathway (hsa04310)
7
154
0.79
0.00052
CSNK2A1, MMP7, GSK3B, CTNNB1, MAPK10, MAPK8, MAPK9
Bladder cancer (hsa05219)
3
41
1
0.0095
CDK4, EGFR, SRC
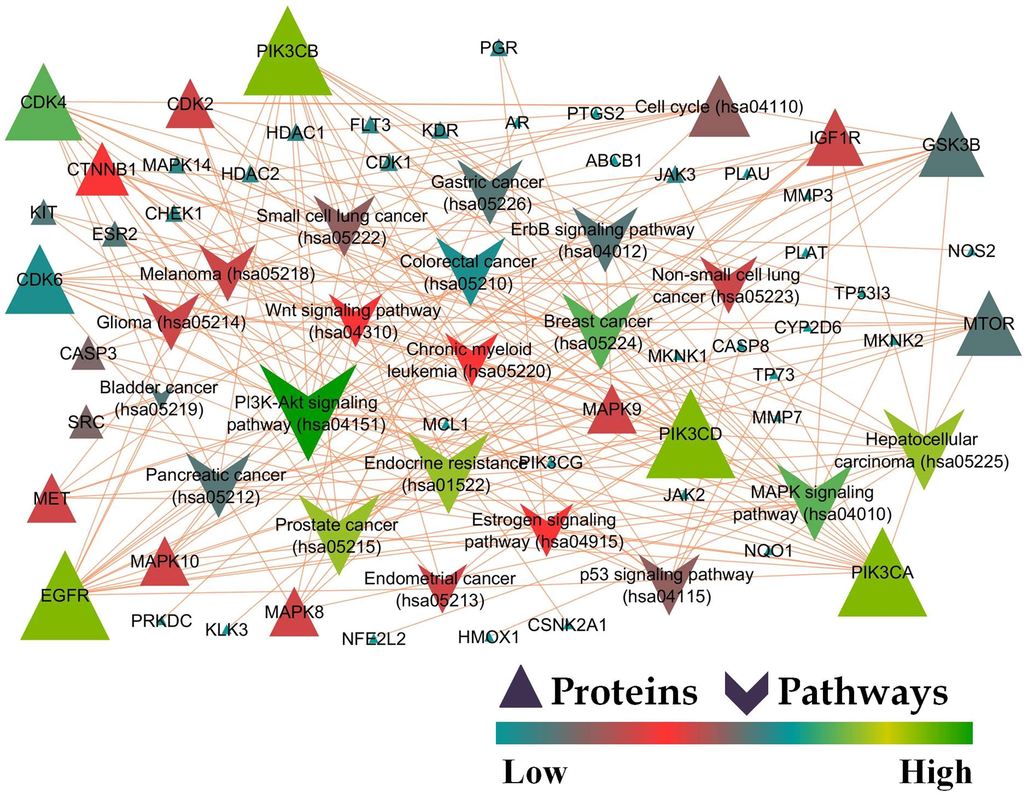
Protein-Pathway interaction of karanjin mediated KEGG pathway analysis against breast cancer.
3.1.3 Gene ontology analysis
The data for GO terms i.e., CC, MF, and BP were retrieved from the STRING database. GO analysis identified 45 CC in which “Cytosol” (GO:0005829) scored the lowest false discovery rate of 7.62E-07 via the modulation of 35 observed genes i.e., HMOX1, CSNK2A1, MAPK14, TP53I3, FLT3, CDK4, PIK3CA, CDK6, CDK2, PIK3CB, CASP3, PRKDC, NQO1, GSK3B, PGR, NOS2, CTNNB1, CASP8, PIK3CG, MAPK10, MTOR, MCL1, MKNK1, HDAC1, SRC, AR, PIK3CD, TP73, JAK2, CDK1, MAPK8, NFE2L2, CHEK1, JAK3, and MAPK9 against 5193 background genes at a strength of 0.41. Similarly, 58 MF were identified in which “Phosphotransferase activity, alcohol group as acceptor” (GO:0016773) scored the lowest false discovery rate of 4.71E-24 via the modulation of 28 observed genes i.e., CSNK2A1, MAPK14, FLT3, MKNK2, CDK4, KDR, PIK3CA, CDK6, CDK2, IGF1R, EGFR, KIT, PIK3CB, PRKDC, MET, GSK3B, PIK3CG, MAPK10, MTOR, MKNK1, SRC, PIK3CD, JAK2, CDK1, MAPK8, CHEK1, JAK3, and MAPK9 against 670 background genes at a strength of 1.21. Moreover, 721 BP were identified where, “Regulation of cell death” (GO:0010941) scored the lowest false discovery rate of 2.06E-21 via the modulation of 35 observed genes i.e., HMOX1, CSNK2A1, TP53I3, FLT3, CDK4, KDR, PIK3CA, IGF1R, EGFR, KIT, PIK3CB, MMP3, CASP3, PRKDC, MET, NQO1, GSK3B, CTNNB1, CASP8, PIK3CG, MTOR, PTGS2, MCL1, HDAC1, SRC, AR, PIK3CD, TP73, JAK2, CDK1, MAPK8, NFE2L2, JAK3, MAPK9, and HDAC2 against 1696 background gene count with a strength of 0.9 (Table S3). The GO of the top 5 CC, MF, and BP has been represented in the form of a chord diagram (Fig. 4). The integration of GO with KEGG-modulated proteins predicted 84.02% of the genes to be in common (Fig. 1d).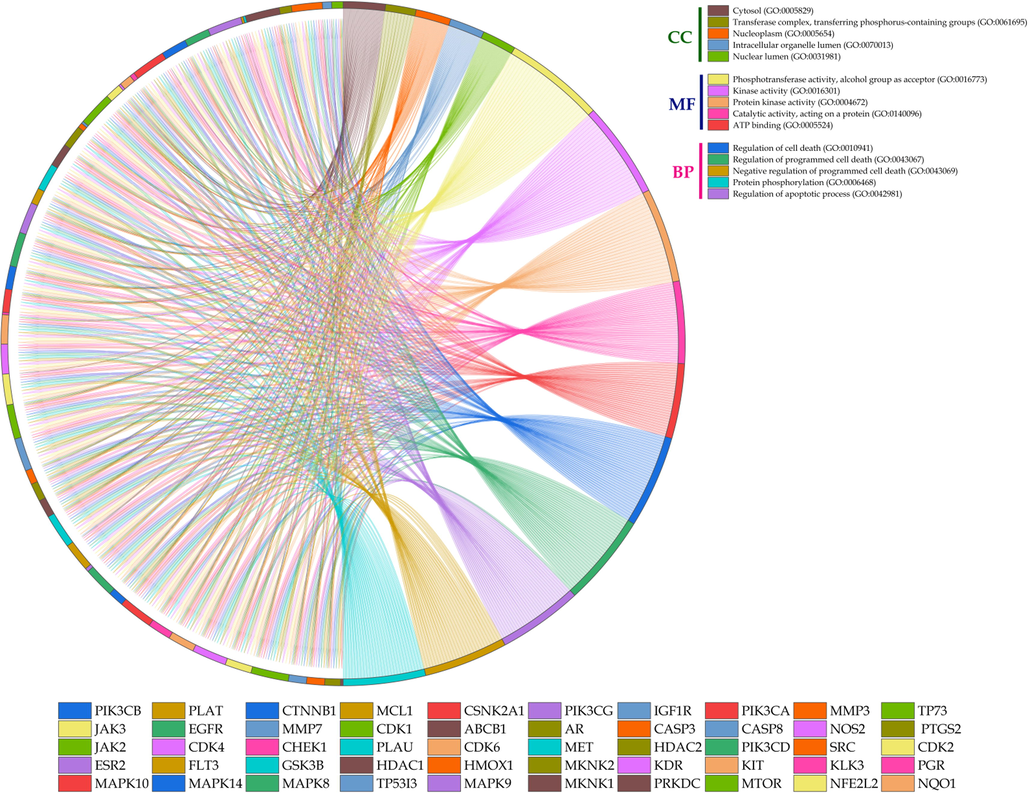
Chord diagram representation of top 5 GO terms belonging to cellular components (CC), molecular function (MF), and biological process (BP).
3.1.4 Cluster analysis
The cluster analysis revealed 14 clusters with 39 (76.47 %) identified genes to be involved after applying p-value significance criteria. Moreover, regulation of “phosphatidylinositol-3-kinase signaling” possessed the highest number of groups i.e., 15 (26.32%) followed by “positive regulation of epithelial cell migration” with 10 (17.54%) groups. Similarly, “tongue development” was identified to possess the highest association with genes i.e., 25% belonging to group 10 and 11 (Fig. S2).
3.2 Molecular docking
Molecular docking revealed CYP1A1 to possess the least binding energy (-11.7 Kcal/mol) followed by AKR1C3 (-10.2 Kcal/mol), and CYP3A4 (-10 Kcal/mol) with karanjin. CYP1A1 possessed 1 carbon-hydrogen bond with ASP320 and the methyl group at position 1. Further, CYP1A1 possessed 9 π-π bonds (ALA317, PHE123, GLY316, LEU312, ILE115, and PHE224) and 11 vander waal interactions (PHE319, THR497, THR321, LEU496, ILE386, SER122, ASP313, SER116, ASN255, PHE258, and LEU254). Moreover, AKR1C3 possessed 4 hydrogen bonds; HIS117 formed a hydrogen bond with oxygen at positions 2 and 9 along with tyrosine with the later, GLU222 formed a bond with oxygen at position 16. AKR1C3 possessed 2 π-π interactions (TRP227 and PHE306) and 6 vander waal interactions (PHE311, ASP224, TRP86, LEU54, ASN164, and TYR24). Additionally, CYP3A4 possessed 6 π-π interactions (PHE215, ARG106, and PHE57) and 7 vander waal forces (PHE108, THR224, ASP76, LEU216, LEU221, ILE50, and TYR53) (Table 2; Fig. 5; Table S4). The standard tamoxifen displayed the least binding energy with the target AKR1B1 with a binding energy of −9.4 Kcal/mol. Tamoxifen displayed 10 π-π interactions and 9 vander waal interactions with the target (Table S5; Fig. S3). Similarly, gefitinib displayed the least binding energy of −10.7 Kcal/mol with the target CYP1A1. Gefitinib possessed 2 hydrogen bonds with residues ASP230, and ARG135; 6 π-π, and 18 vander waal interactions (Table S6; Fig. S3). Where, BE: Binding energy (Kcal/mol), NHB: Number of Hydrogen Bonds, NPB: Number of π bonds, NVW: Number of Vander waal forces.
Protein
BE
NHB
Residues
NPB
Residues
NVW
Residues
CYP1A1
−11.7
1
ASP320
9
ALA317, PHE123, GLY316, LEU312, ILE115, PHE224
11
PHE319, THR497, THR321, LEU496, ILE386, SER122, ASP313, SER116, ASN255, PHE258, LEU254
AKR1C3
−10.2
4
HIS117, TYR55, GLN222
2
TRP227, PHE306
6
PHE311, ASP224, TRP86, LEU54, ASN167, TYR24
CYP3A4
−10
0
0
6
PHE215, ARG106, PHE57
7
PHE108, THR224, ASP76, LEU216, LEU221, ILE50, TYR53
CDK5
−9.6
1
CYS83
10
ILE10, VAL18, LEU133, ALA143, LYS33, VAL64
10
ALA31, PHE80, GLU51, ASP144, TYR15, GLY11, GLN130, ASP86, CYS83, ASP84, GLN85
XDH
−9.6
2
LEU404, GLY350
10
ILE264, ILE353, LEU257, ILE403, ALA301
8
LEU287, VAL258, VAL259, ASN261, THR262, GLU263, THR354, LYS256
SIGMAR1
−9.5
0
0
10
VAL84, ALA185, TYR103, MET93, LEU95
11
TRP89, ALA86, GLU172, TYR120, THR181, ILE178, LEU182, TYR206, SER205, THR202, PHE107
PGR
−9.3
1
GLN725
7
ARG766, VAL729, LYS822, TRP732, PRO696
5
LEU758, GLU695, VAL698, ILE699, MET759
AKR1B1
−9.2
2
TRP111, HIS110
8
LEU300, VAL47, TRP20, TRP79
6
ALA299, PHE122, LYS21, TRP219, CYS298, TYR48
CHEK1
−9.1
3
GLY16, GLU17, GLU85
7
LYS38, LEU84, ASP148, VAL23, ALA36, LEU15
7
PHE70, PHE149, SER147, VAL68, TYR86, LEU137, GLY18
PTGS2
−9.1
2
ARG44, HIS39
7
CYS36, CYS47, PRO153, LEU152
10
MET48, TYR136, VAL46, GLY135, TYR130, GLY45, ARG469, GLN461, PRO40, PRO156
CYP2D6
−9
3
HIS478, TYR56, LYS404, PHE366
3
HIS478, TYR56, PRO55
7
PHE481, GLY479, VAL485, ASP368, GLY367, TRP316, PHE413
FLT3
−9
2
PHE245, ARG243
5
TYR379, PRO267, LEU262, LEU260, TYR376
9
ARG170, PHE261, LEU244, TRP269, LEU268, PHE173, TYR172, GLU266, THR242
HTR2A
−9
2
LEU229, ASN343
8
VAL366, LEU228, PHE339, VAL156, LEU229
7
TRP151, CYS229, LEU362, VAL235, PHE249, SER159, TRP336
ALOX12
−8.8
2
TYR139, GLY381
7
PRO95, ARG98, ARG135, MET164, PHE376, PHE386
8
CYS96, TYR97, ASN163, GLU131, PRO109, LYS387, TYR614, ILE390
HDAC1
−8.8
2
ARG36, ASN40
8
VAL198, HIS39, TYR15, PHE252, ILE249, ARG36
6
TYR48, ILE53, ARG55, ASP16, GLY17, ASP256
MAPK9
−8.8
4
ARG72, ASP169, LYS55
5
LEU77, LEU76, ASP169
9
ARG69, GLN37, GLU73, ILE147, ILE86, VAL80, LEU142, ILE85, LEU168
NOX4
−8.8
1
LEU98
10
ARG102, ALA81, PHE413, ARG77, PRO353
7
SER101, THR340, ARG304, TYR338, ARG84, LEU80, ASP99
PIK3CG
−8.8
3
ASP788, ARG690, ARG849
8
TRP201, HIS658, ARG849, LEU657, PHE694
3
ARG277, GLN846, PHE698
SLC6A3
−8.8
2
PHE76, ASP476
6
ALA480, PHE320, TYR156, PHE326, VAL152
8
GLY481, ALA479, GLY426, ALA423, SER422, PHE76, ASP79, ALA77, ALA81
SLC6A4
−8.8
1
SER438
5
TYR176, PHE341, ILE172, GLU493, ARG104
9
GLY442, TYR95, VAL501, PHE335, TYR175, GLY100, ASP98, LEU99, TRP103
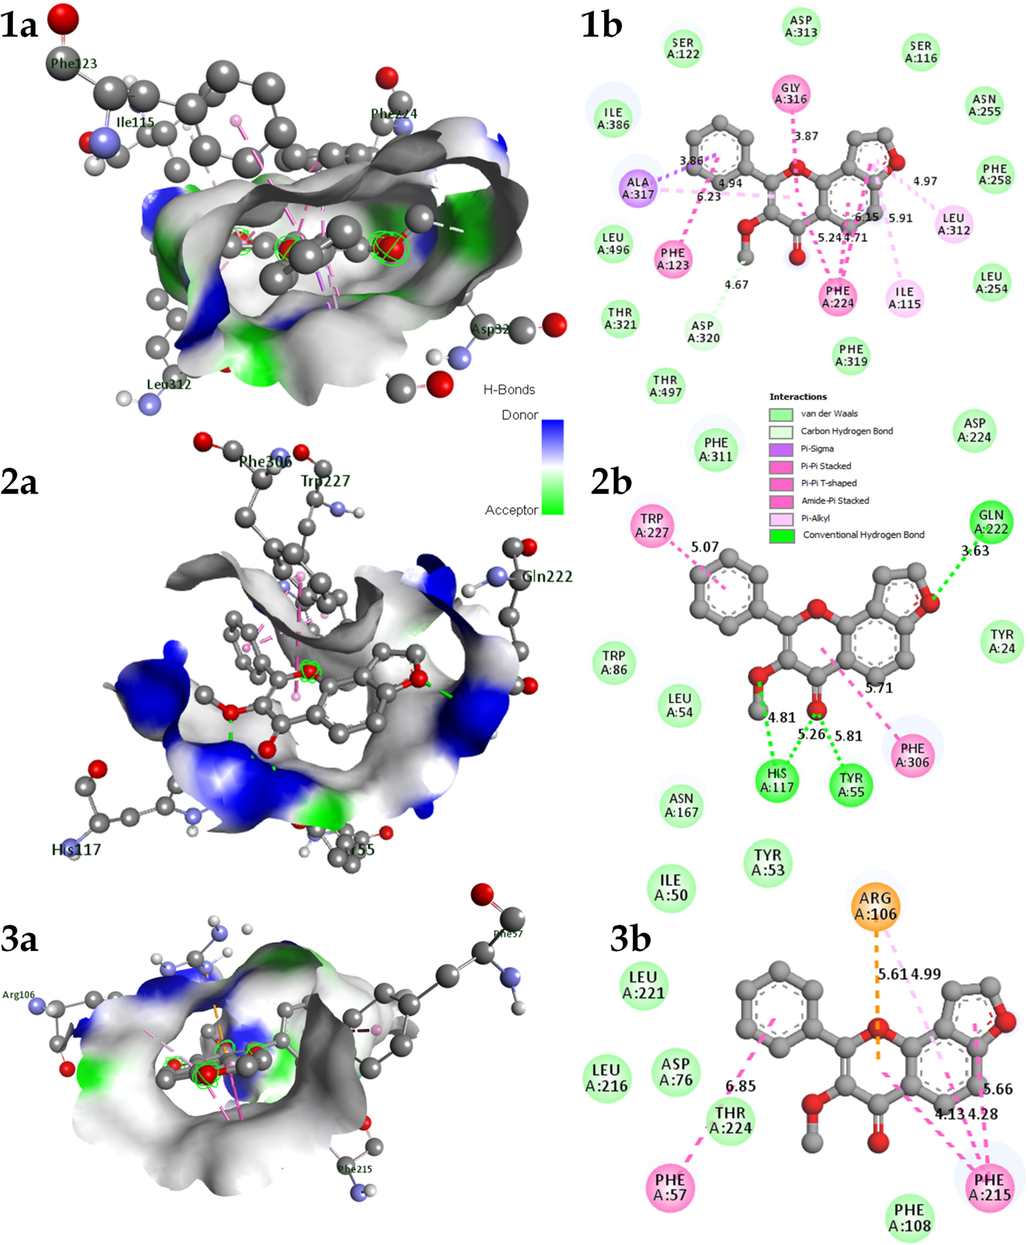
A) 3D and b) 2D interaction of Karanjin docked with protein 1. CYP1A1; 2. AKR1C3; & 3. CYP3A4.
3.3 Stability of docked complex via MD simulation
The complexes to be subjected for MD simulation were chosen based on the hub genes (edge count) identified via gene enrichment (top 3 genes; EGFR, PI3KCA, and PI3KCB) and the top 3 complexes possessing least binding energy (CYP1A1, AKR1C3, and CYP3A4).
3.3.1 karanjin-Aldo-keto reductase 1C3 (AKR1C3) complex
The complex karanjin with AKR1C3 displayed RMSD with fluctuation of less than ∼0.5 Å for the initial ∼90 ns of simulation there after the RMSD of backbone was stable however, complex RMSD displayed fluctuation of about ∼3 Å. Initially, for MD run of ∼90 ns the difference in the RMSD between backbone and complex was less than ∼1 Å which later became ∼3 Å. The RMSF of the complex displayed fluctuation in the range of ∼1 Å to ∼4 Å; residue LEU299 displayed the highest RMSF of ∼4 Å after the ligand with RMSF of ∼20 Å. The RoG displayed slight fluctuations of less than ∼1 Å throughout the run; the gyration value had high peaks at ∼100 ns and ∼135 ns of MD run. The SASA value displayed fluctuation between ∼135 to ∼165 nm2. A maximum of 3 hydrogen bonds were visible; initially, 1–2 hydrogen bonds were visible till 60 ns, and thereafter 1 hydrogen bond was visible which was unstable throughout. Total energy contribution assessment by MMPBSA displayed PHE311 to possess an energy contribution of −5.7 Kcal/mol followed by LEU54 and PHE306 with energy contributions of −0.47 and −0.46 Kcal/mol. However, residues PHE313, PHE320, and GLY316 possessed energy contribution against the interaction. In addition, the ligand displayed total energy contribution of −7.06 Kcal/mol (Fig. S4 & Movie M1).
3.3.2 Karanjin-Cytochrome P450 1A1 (CYP1A1) complex
Karanjin-CYP1A1 complex displayed RMSD in the range of ∼1.5 Å to ∼3.5 Å throughout the MD run with a difference of less than 0.5 Å between the complex and backbone. The RMSD was fluctuating till ∼125 ns after which it became stable with slight fluctuations. The RMS fluctuation was in the range of ∼1 to ∼7 Å; the residue PRO151 displayed a maximum fluctuation of ∼7 Å however, PRO151 was not involved in the interaction with the ligand. The RoG displayed a maximum fluctuation of ∼0.4 Å and was stable throughout the MD run. Additionally, SASA displayed fluctuation in the range of ∼210 to ∼235 nm2 which may be due to the number of hydrogen bonds being formed and broken throughout the run. The number of hydrogen bond analysis displayed the formation of 1 hydrogen bond which was unstable throughout the simulation; this may be due to more π-π and vander waal interactions visible at initial protein–ligand docking. Total energy contribution per residue displayed PHE224, ALA317, and PHE123 to possess energy contribution of −2.40, −1.08, −0.98 Kcal/mol respectively. However, SER87, SER118, and SER310 possessed energy contributions against the interaction. The ligand displayed total energy contribution of −9.57 Kcal/mol (Fig. 6 & Movie M2).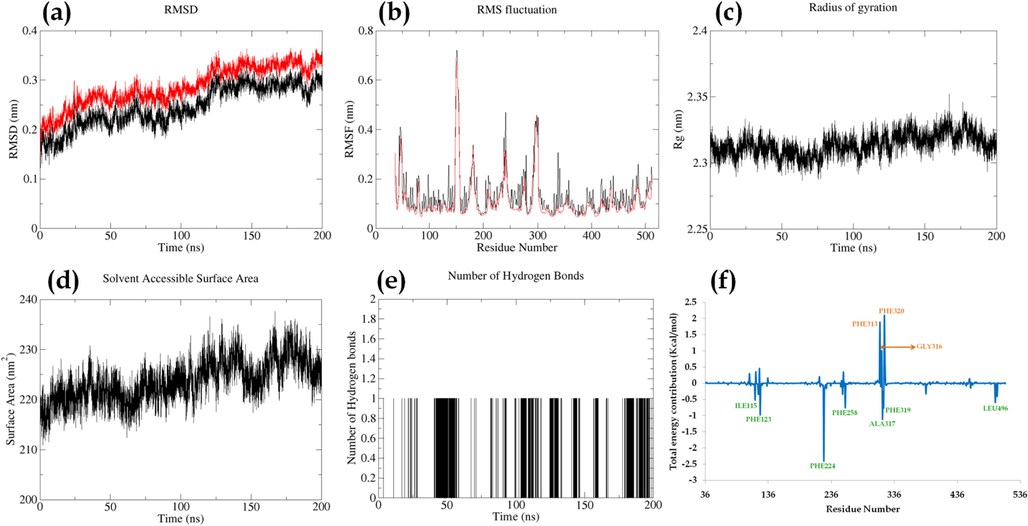
Parameters describing stability of karanjin-CYP1A1 complex. Where, (a) RMSD of backbone (black) and complex (red); (b) RMSF of complex (black) and RMSF of c-alpha atoms (red); (c); Radius of gyration; (d) Solvent Assessable Surface Area (SASA); (e) Number of hydrogen bonds between protein and ligand; (f) Total energy contribution per residue.
3.3.3 Karanjin-Cytochrome P450 3A4 (CYP3A4) complex
The RMSD of karanjin-CYP3A4 complex displayed RMSD fluctuations of less than 0.4 Å for both the complex and backbone. However, the difference in the RMSD was visible to be ∼5 Å throughout the MD run. The RMSF displayed fluctuation in the range of ∼1 Å to ∼5 Å and the residue GLU283 possessed the highest RMSF value of 5.6 Å followed by GLU265 and LYS282 with RMSF of 5.3 Å and 4.6 Å respectively. Moreover, the RMSF for c-alpha atoms displayed relatively less RMSF fluctuation with respect to the complex. The RoG for the complex displayed fluctuation of ∼7 Å throughout the simulation. The Solvent Assessable surface Area displayed fluctuation in the range of ∼215 to ∼235 nm2 depending on the hydrogen bonds being formed and deformed throughout the run. A maximum of 1 hydrogen bond was visible and was inconsistent throughout the MD run. The total energy contribution displayed residues ARG106, PHE215, and PHE57 to contribute in the favour of the interaction with energy contributions of −4.44, −1.34, and −0.83 Kcal/mol respectively. However, ASP76 and GLU374 displayed energy contribution against the interaction with energy contribution of 8.85 and 3.86 Kcal/mol. The ligand displayed a total energy contribution of −8.38 Kcal/mol in the simulation (Fig. S5 & Movie M3).
3.3.4 Karanjin-Epidermal growth factor receptor (EGFR) complex
The RMSD fluctuation ranged between ∼4 Å to ∼9 Å, where fluctuations were displayed to be reduced at ∼125 ns with a deviation of less than 2.5 Å. The difference in the RMSD of backbone and complex was displayed to be less than 0.3 Å. The RMSF fluctuation displayed fluctuation in the range of ∼2 Å to ∼8.7 Å with residue ASN803 displaying the highest fluctuation of 8.68 Å for the complex; the RMSF for c-alpha displayed similar fluctuations as the complex. The RoG displayed a maximum fluctuation of ∼5 Å which decreased after 100 ns of MD run indicating an increase in compactness for the complex. Further, the SASA ranged from ∼325 nm2 to ∼360 nm2; an increase in SASA was displayed at ∼135 ns of MD run which thereafter decreased to ∼330 nm2 at ∼175 ns. A maximum of 2 hydrogen bonds were formed throughout the MD run where 1 hydrogen bond was consistent till ∼110 ns and thereafter fluctuation in hydrogen bonds was visible. The total energy contribution of residues displayed ARG429 to possess an energy contribution of −2.40 Kcal/mol. In addition, VAL316 and VAL336 were in the favour of the interaction whereas, GLU317 was against the interaction. The ligand displayed a total energy contribution of −8.40 Kcal/mol in 200 ns of MD run (Fig. S6).
3.3.5 Karanjin-Phosphatidylinositol-4,5-bisphosphate-3-kinase catalytic subunit α (PI3KCA) complex
The RMSD displayed fluctuation between ∼3 Å to ∼5 Å till ∼145 ns and thereafter displayed stability till 200 ns of simulation; the difference between the RMSD of the backbone and complex was visibly less than 0.3 Å throughout the MD simulation. The RMSF fluctuation displayed fluctuation in the range of ∼1 Å to ∼8 Å, with residue TYR317 displaying the highest fluctuation of 7.6 Å for complex; the RMSF of c-alpha displayed similar fluctuation as the complex. The RoG fluctuation displayed a maximum fluctuation of ∼0.5 Å throughout the simulation; the RoG displayed stable fluctuation after ∼170 ns of MD run. The Solvent Assessable Surface Area displayed fluctuation between 490 nm2 to 520 nm2 with a decrease in SASA after ∼150 ns of MD run. A maximum of two hydrogen bonds were visualized with 1 being unstable. However, the consistency of the hydrogen bond increased after 150 ns of MD run manifested by a decrease in SASA. The total energy decomposition displayed VAL131 to possess an energy contribution of −1.22 Kcal/mol in the favour of the interaction along with GLU682, PRO466, VAL136, LEU686, and PHE128. However, ASP133, GLU127, LYS468, and ARG683 were against the interaction. The ligand displayed a total energy contribution of −6.81 Kcal/mol in 200 ns of MD run (Fig. 7 & Movie M4).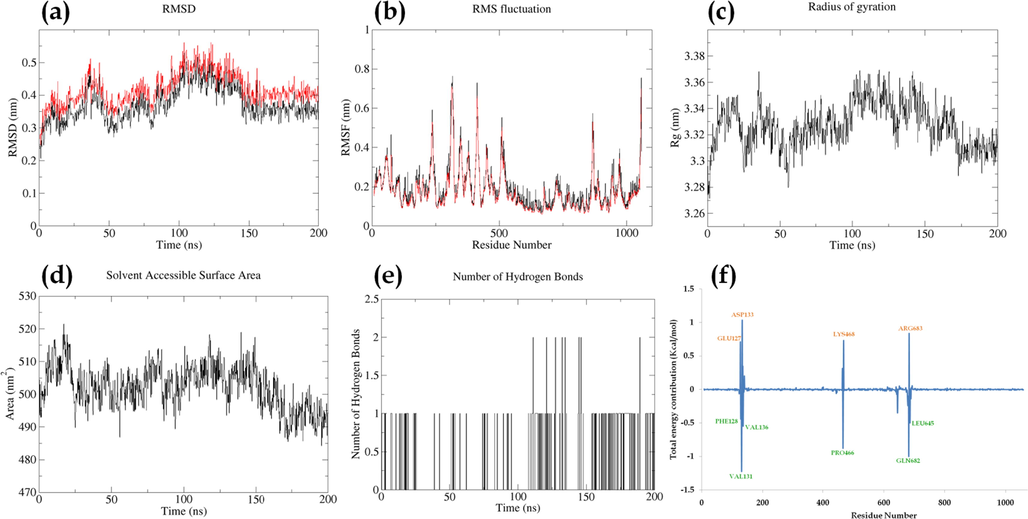
Parameters describing stability of karanjin-PI3KCA complex. Where, (a) RMSD of backbone (black) and complex (red); (b) RMSF of complex (black) and RMSF of c-alpha atoms (red); (c); Radius of gyration; (d) Solvent Assessable Surface Area (SASA); (e) Number of hydrogen bonds between protein and ligand; (f) Total energy contribution per residue.
3.3.6 Karanjin-Phosphatidylinositol-4,5-Bisphosphate 3-Kinase catalytic subunit β (PI3KCB) complex
The RMSD of the karinjin-PI3KCB complex displayed fluctuation of ∼3 Å for both the complex and backbone; the difference between the RMSD of the complex and backbone was displayed ∼0.5 Å throughout the MD run and was stable. The RMSF fluctuation displayed maximum fluctuation by an intermediate residue VAL870 with a fluctuation of 8.3 Å followed by HIS238 and ALA872 with fluctuation of 7.0 Å and 6.9 Å respectively. The RoG of the complex was displayed to be stable after ∼100 ns of MD run with fluctuations less than 0.5 Å. The SASA was displayed to be on average between ∼510 nm2 to ∼540 nm2 which decreased initially from ∼560 nm2 to ∼530 nm2 and was in the range thereafter. Initially, the hydrogen bonds were consistent for 30 ns however, thereafter inconsistent hydrogen bonds were displayed. The total energy contribution displayed PHE673 to possess an energy contribution of −1.84 Kcal/mol followed by LEU842 and ASP632 with energy contributions of −0.67 Kcal/mol and −0.61 Kcal/mol respectively. The ligand displayed a total energy contribution of −9.43 Kcal/mol (Fig. S7 & Movie M5).
3.4 Molecular mechanics Poisson-Boltzmann Surface Area (MMPBSA) analysis
MMPBSA analysis was performed for 100 frames for all the complexes and the complex of karanjin with CYP1A1 possessed the least vander waals mechanic energy (-39.53 ± 0.21 Kcal/mol), non-polar contribution of solute–solvent interactions to the solvation energy (-27.41 ± 0.07 Kcal/mol), and total gas phase molecular mechanics energy (8.02 ± 0.44 Kcal/mol). Similarly, the complex with AKR1C3 possessed the least polar contribution to solvation energy (18.83 ± 0.89 Kcal/mol), non-polar contribution of attractive solute–solvent interactions to the solvation energy (30.69 ± 1.23 Kcal/mol), and total gas phase solvation energy (32.14 ± 1.34 Kcal/mol). The complexes with EGFR and PI3KCA possessed the least electrostatic molecular mechanics energy (-10.90 ± 0.39 Kcal/mol). Further, the complexes with AKR1C3, CYP1A1, and PI3KCA possessed the least total relative binding energy with 2.01 ± 0.28, 8.02 ± 0.44, and 6.31 ± 0.41 Kcal/mol respectively (Table 3). All the data are presented in mean ± SEM (n = 100) and unit for each parameter is Kcal/mol. Where,
VDWAALS: Vander Waals molecular mechanics energy;
EEL: Electrostatic molecular mechanics energy;
EPB: Polar contribution to the solvation energy;
ENPOLAR: Non-polar contribution of solute–solvent interactions to the solvation energy;
EDISPER: Non-polar contribution of attractive solute–solvent interactions to the solvation energy;
GGAS: Total gas phase molecular mechanics energy;
GSOLV: Total solvation energy;
GTotal: Total relative binding energy.
Protein
VDWAALS
EEL
EPB
ENPOLAR
EDISPER
GGAS
GSOLV
GTotal
AKR1C3
–23.37 ± 0.92
−6.77 ± 0.63
18.83 ± 0.89
−17.38 ± 0.72
30.69 ± 1.23
−30.13 ± 1.30
32.14 ± 1.34
2.01 ± 0.28
CYP1A1
−39.53 ± 0.21
−5.36 ± 0.31
31.91 ± 0.37
−27.41 ± 0.07
48.40 ± 0.09
−44.89 ± 0.37
52.91 ± 0.40
8.02 ± 0.44
CYP3A4
−35.26 ± 0.41
−3.35 ± 0.45
33.23 ± 0.80
−24.47 ± 0.21
44.78 ± 0.26
−38.61 ± 0.52
53.54 ± 0.87
14.93 ± 0.65
EGFR
−30.39 ± 0.21
−10.90 ± 0.39
39.11 ± 0.51
–22.92 ± 0.10
40.52 ± 0.11
−41.28 ± 0.44
56.71 ± 0.53
15.43 ± 0.40
PI3KCA
−25.73 ± 0.30
−6.01 ± 0.73
21.93 ± 0.74
−18.89 ± 0.19
35.00 ± 0.29
−31.73 ± 0.77
38.04 ± 0.78
6.31 ± 0.41
PI3KCB
33.91 ± 0.30
−5.98 ± 0.54
31.94 ± 0.83
–23.13 ± 0.18
42.90 ± 0.22
−39.89 ± 0.71
51.71 ± 0.88
11.83 ± 0.43
3.5 Cytotoxicity assay
3.5.1 T47D cell lines
Karanjin displayed an IC50 value of 24.65 ± 0.66 μM for 24 hrs of drug exposure which displayed a marked reduction at 48 hrs of exposure to 10.24 ± 0.34 μM and 8.35 ± 0.29 μM at 96 hrs of exposure. Similarly, tamoxifen displayed an IC50 value of 7.26 ± 0.09 μM for 24 hrs of exposure with a decrease in the IC50 to 3.62 ± 0.21 μM and 3.54 ± 0.78 μM for 48 and 96 hrs of exposure. The combination of tamoxifen and karanjin displayed an IC50 value of 0.16 ± 0.02 μM for 24 hrs of drug exposure which displayed marked reduction at 48 hrs of exposure to 0.05 ± 0.01 μM and 0.04 ± 0.002 μM at 96 hrs of exposure (Fig. 8 & Fig. S8).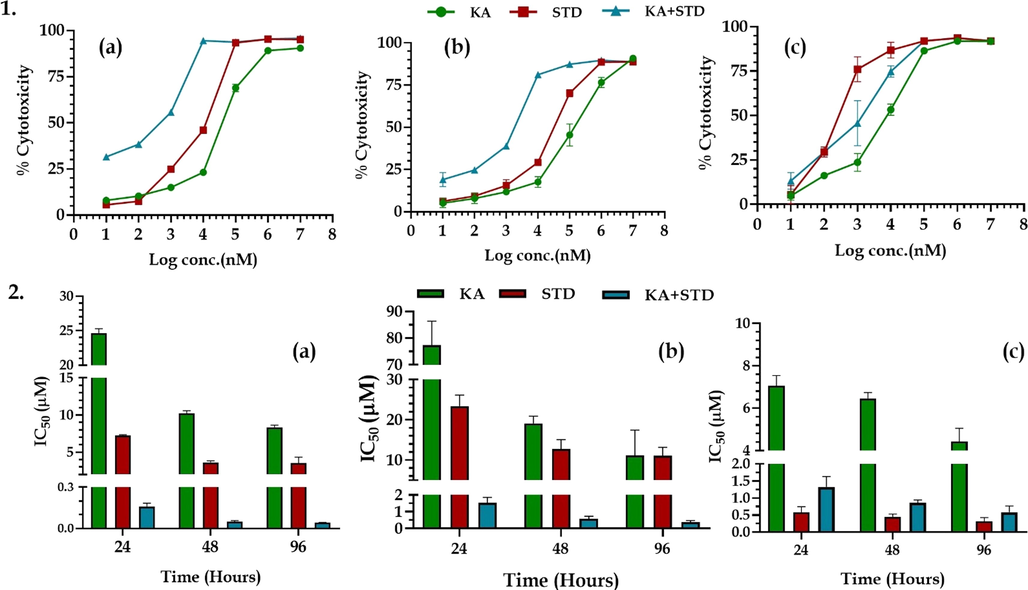
1. The % cytotoxicity of karanjin and tamoxifen using MTT on cell lines (a) T47D; (b) MDA-MB-468; (c) SKBR3 cell lines. 2. The IC50 of karanjin and tamoxifen on (a) T47D; (b) MDA-MB-468; and (c) SKBR3 cell lines. All the data are represented in mean ± SD (n = 3).
3.5.2 MDA-MD-486 cell lines
Karanjin displayed an IC50 value of 77.35 ± 9.06 μM for 24 hrs of drug exposure which displayed a marked reduction at 48 hrs of exposure to 19.13 ± 1.78 μM and 11.13 ± 6.29 μM at 96 hrs of exposure. Similarly, tamoxifen displayed an IC50 value of 23.35 ± 2.78 μM for 24 hrs of exposure with a decrease in the IC50 to 12.72 ± 2.33 μM and 11.09 ± 2.07 μM for 48 and 96 hrs of exposure. The combination of tamoxifen and karanjin displayed an IC50 value of 1.53 ± 0.32 μM for 24 hrs of drug exposure which displayed marked reduction at 48 hrs of exposure to 0.58 ± 0.14 μM and 0.38 ± 0.10 μM at 96 hrs of exposure (Fig. 8 & Fig. S8).
3.5.3 SKBR3 cell lines
Karanjin displayed an IC50 value of 7.05 ± 0.49 μM for 24 hrs of drug exposure which displayed a marked reduction at 48 hrs of exposure to 6.46 ± 0.29 μM and 4.42 ± 0.63 μM at 96 hrs of exposure. Similarly, gefitinib displayed an IC50 value of 0.58 ± 0.14 μM for 24 hrs of exposure wia th decrease in the IC50 to 0.45 ± 0.07 μM and 0.32 ± 0.09 μM for 48 and 96 hrs of exposure. The combination of tamoxifen and karanjin displayed an IC50 value of 1.32 ± 0.25 μM for 24 hrs of drug exposure which displayed marked reduction at 48 hrs of exposure to 0.86 ± 0.0.07 μM and 0.59 ± 0.15 μM at 96 hrs of exposure (Fig. 8 & Fig. S8).
4 Discussion
Breast cancer has been known to be a fatal disease throughout the world and in spite of substantial advances there is a need to identify a novel drug for its cure (Akram et al, 2017). In the present study, we aimed to propose the molecular mechanism of karanjin via system biology tools like gene set enrichment, gene ontology analysis, and molecular docking followed by its validation using simulation studies. In addition, we also performed a cytotoxicity assay on three different cell lines (T47D, MDA-MB-468, and SKBR3) to assess the category of BC, karanjin ameliorates the most. Karanjin has been reported to possess an anti-cancer effect on various types of cancers including cervical cancer, colon cancer, and breast cancer (Roy et al., 2021). Studies also suggest the role of karanjin as cytotoxic on various cancer cell lines like lung adenocarcinoma (A549), hepatocellular carcinoma (HepG2), human leukemia (HL-60), and ER-positive breast cancer (MCF 7) cell lines (Othman et al., 2020; Varshney et al., 2019). Moreover, various reports suggest that karanjin may possess anti-cancer activity via modulation of p53/Bcl2/BAX pathway for apoptosis (Patel & Patel, 2022; El-Desouky et al., 2020). However, the mechanism by which karanjin possesses an anti-breast cancer effect is yet to be unleashed.
System biology tools gain esteemed utility in predicting a possible molecular mechanism for naturally identified bio-actives (Dwivedi et al., 2021a; Dwivedi et al., 2021b). Hence, in the present study, we have utilized various in-silico tools to propose a possible molecular mechanism for karanjin against BC. Initially, we fetched targets involved in BC pathogenesis, where we identified 7259 targets from two sources DisGeNet and TTD which were later matched with targets modulated by karanjin. The protein–protein interaction network was constructed by utilizing the STRING database which was further integrated with KEGG pathway analysis to identify the hub genes and major pathways involved in the anti-cancer mechanism of karanjin. Molecular docking was performed on all the common targets using AutoDock vina. Further, hub genes were identified as the top 3 complexes possessing the best binding affinity and the top 3 genes predicted via gene enrichment analysis, which were subjected to a MD simulation of 200 ns each along with MMPBSA, and total energy decomposition analysis. In addition, we also performed a cluster analysis to identify various clusters of proteins and their significance in the biological system.
Moreover, we also assessed the effect of karanjin on various breast cancer cell lines i.e., T47D, MDA-MB-468, and SKBR3 based on the molecular classification. We assessed the cytotoxicity of karanjin in different time intervals of 24 hr, 48 hr, and 96 hr, alone and in combination with tamoxifen/gefitinib (Prakash et al., 2022). Results have displayed karanjin to possess cytotoxic potential in all three cell lines but to a greater extent on SKBR3 cells. However, karanjin when used in combination with tamoxifen/gefitinib (at a dose of IC25) displayed a significant increase in the cytotoxicity with the effect being increased by five to ten folds. Similarly, karanjin also displayed time-dependent action where the treatment group for 96 hrs of drug exposure displayed the least cell viability.
In the present study, we predicted 52.8% of the common targets belonging to the category of enzymes and kinases which are known to be involved in the transduction of extracellular signals to pathways relating to cell growth, transformation, proliferation, development, differentiation, migration, and death. GO analysis revealed “Cytosol (GO:0005829)”, “Phosphotransferase activity, alcohol group as acceptor (GO:0016773)”, and “Regulation of cell death (GO:0010941)” to possess the lowest false discovery rate with respect to CC, MF, and BP. The “protein kinase activity” was predicted to possess the highest strength with the third lowest false discovery rate; known to act as a catalyst to phosphorylate amino acid residues of a protein (https://www.informatics.jax.org/vocab/gene_ontology/GO:0004672).
Molecular docking was performed on 144 targets with karanjin. The complexes of karanjin with CYP1A1, CYP3A4, and AKR1C3 possessed the highest binding affinity. The stability of complexes via simulation revealed cytochrome enzyme 1A1 to be the most stable complex with a total energy contribution of −9.57 Kcal/mol. The RMSD plot for the CYP1A1-karanjin complex displayed fluctuations of ∼2 Å and became stable after ∼125 ns of MD run. The residue PRO151 was identified to possess the highest RMS fluctuation; however, was not involved in the interaction. The number of hydrogen bonds was perceived to be one; as the interaction between CYP1A1 and karanjin was majorly via vander waal forces and other hydrophobic interactions (Table 3 & Fig. 9).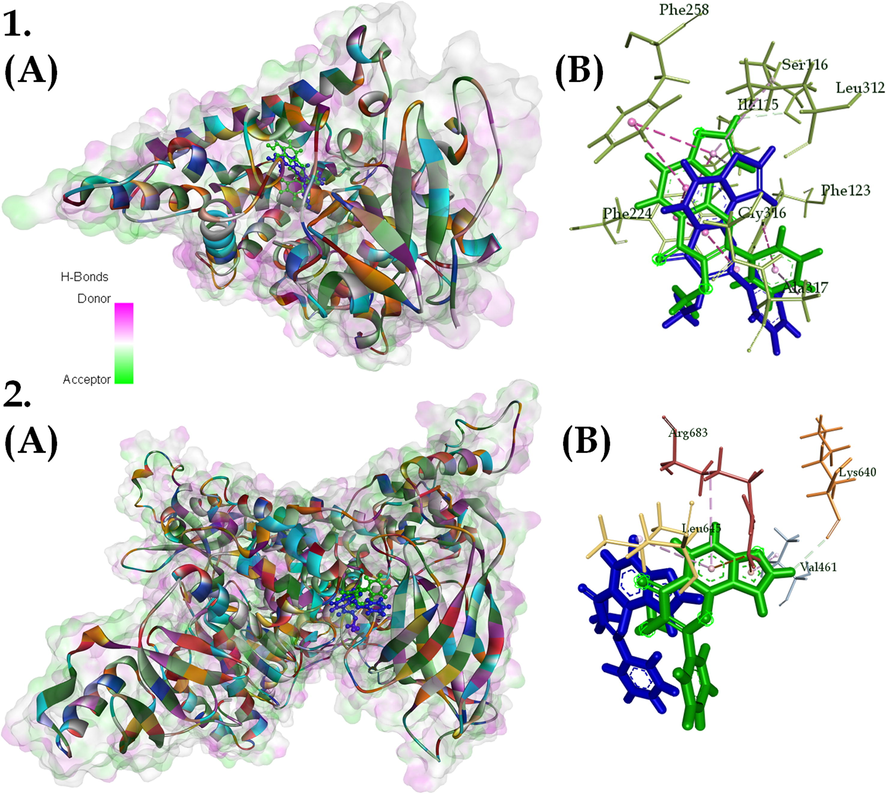
(A) 3D and (B) 2D interaction of (1) CYP1A1-karanjin complex and (2) PI3KCA-karanjin complex; with karanjin depicted as green (start of simulation) and blue (end of simulation) and surface on the 3D interaction with respect to hydrogen bond donors and acceptors. Where, different colors on protein represent different residues.
Cytochrome P450 1A1 is an extrahepatic phase I metabolizing enzyme whose expression is repressed under physiological conditions but can be induced by substrates via aryl hydrocarbon receptor (AhR; Androutsopoulos et al., 2009, Rodriguez & Potter, 2013). Pro-carcinogen like 7,12-Dimethylbenz[a]anthracene (DMBA) is initially activated via metabolic transformation by the CYP1A1 enzyme (Androutsopoulos et al., 2009). This indicates that the regulation of CYP1A1 by karanjin may prevent the activation of pro-carcinogen to an active carcinogen. Moreover, studies have displayed that the majority of breast tumors constitutively express CYP1A1 (Yang et al., 2008). CYP1A1 is one of the key enzymes in xenobiotic metabolism and also plays a critical role in the hydroxylation of estrogen (Lu et al., 2020). Studies indicate that CYP1A1 can act as a carcinogenic detoxifying enzyme, while the paradoxical activation of natural foods with chemopreventive effects provides further insight into the anti-cancer role of this enzyme (Raunio et al., 1995). A study conducted by Murray et al., assessed twenty-one cytochrome P450 expression levels in 170 breast cancers from patients who had not previously had adjuvant therapy. According to the results of this profile, CYP1A1 was expressed in around 90% of breast cancers. However, CYP1A1 expression levels differed amongst tumors and were unrelated to estrogen receptor alpha levels, tumor grade, or clinical prognosis (Murray et al., 2010). A study conducted by Rodriguez and Potter assessed the role of CYP1A1 in the progression and survival of breast cancer cells and revealed that reduction of basal CYP1A1 expression is critical for the inhibition of proliferation. They reported that CYP1A1 may promote breast cancer proliferation and survival partially through AMPK signaling and concluded that the reduction of CYP1A1 levels is a potential strategy for breast cancer therapeutics (Rodriguez & Potter, 2013). In the present study, CYP1A1 is one of the lead targets modulated by karanjin, and reduction in the CYP1A1 levels results in decreased AMPK signaling leading to decreased proliferation and survival of cancer cells; this also correlates with the mechanism of how karanjin possess cytotoxic potential on the three cell lines.
Further, gene enrichment and network pharmacology predicted PIK3CA, EGFR, and PIK3CB to possess the highest edge count and were considered as hub genes subjected to molecular dynamic simulation. The molecular dynamic simulation revealed the complex of karanjin with PI3KCA to be the most stable. Similarly, the EGFR complex with karanjin was observed to be stable with a total energy contribution of −8.39 Kcal/mol by karanjin; results also revealed the interaction to be stable due to vander waal forces with energy contribution of −15.19 Kcal/mol. In addition, homogenous results were attained via cluster analysis where “regulation Phosphoinositide 3-kinase signaling” and “positive regulation of epithelial cell migration” were identified to be the major group comprising 43.86% of the total clusters.
PI3K is classified into classes I, II, and III based on the variations in its structural makeup and particular substrates. Class I PI3Ks were divided into classes IA and IB PI3Ks. The kind of PI3K most obviously associated with human cancer is class IA PI3K, a heterodimer comprising p58 regulatory subunit and p110 catalytic subunit (Yang et al., 2019). Catalytic subunits for class IA PI3K are produced by three separate genes (PIK3CA, PIK3CB, and PIK3CD, respectively), whereas class IB PI3K only has one catalytic component produced by PIK3CG (Mazloumi et al., 2018). In the present study, the proteins involved in PI3K signaling i.e., PIK3CA, PIK3CB, PIK3CD, and PIK3CG were modulated by karanjin. This indicates that karanjin may inhibit PI3K genes and lead to the down-regulation of PI3K-Akt signaling pathway further leading to decreased proliferation and angiogenesis (Fig. 10). Dysregulation of PI3K signaling is closely associated with tumorigenesis, disease progression, and the development of resistance to current standards of care in breast cancer patients (Denduluri et al., 2015). Studies have reported that mutation and overexpression of PIK3CA leads to uncontrolled division and replication of cells (Kalsi et al., 2016). In the current scenario for the treatment of PI3K mutated breast cancers, several PI3K inhibitors have been tested, and besides alpelisib, the majority displayed disappointing efficacy and intolerable toxicity in breast cancer patients stipulating karanjin as a potential lead hit (Rugo et al., 2020). To activate PI3K, the catalytic subunit must bind with the phosphotyrosine residues of active growth factor receptors or adaptor proteins (such as RAS proteins). As a result, phosphatidylinositol-3,4,5-trisphosphate (PIP3) is created from the membrane lipid phosphatidylinositol-4,5-bisphosphate (PIP2). PIP3 directly activates Akt and other proteins that include pleckstrin-homology (PH) domains, which bind to PIP3. Following full activation, Akt activates a number of nuclear and cytosolic effectors. Many phosphatases (PTEN, TSC1, TSC2, and LKB1) that dephosphorylate mTORC1 and PIP3 turn off this process, which is thought to be the “core” of cell survival and cell cycle advancement (Castellano & Downward, 2011). HER2+ breast tumors frequently exhibit a variety of PI3K signaling pathway abnormalities, including PI3K mutation/amplification, loss/mutation of the phosphatase and tensin homolog, overexpression/overactivation of Akt, and regulation of the tumor suppressors TSP-1 and TSP-2 (Fig. 10; Fusco et al., 2021). Similarly, our study identified PI3KCA as the lead target for karanjin which may reverse the PI3K abnormalities leading to reduced cell proliferation and cell death in SKBR3 cell lines.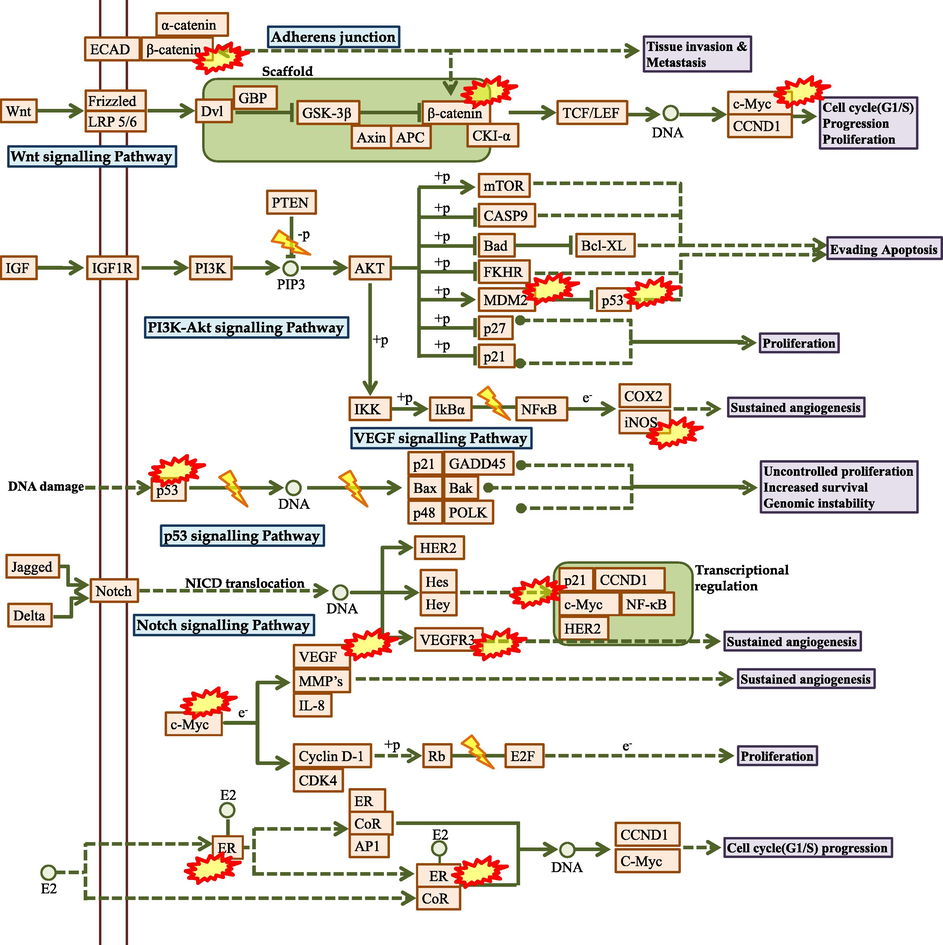
The predicted molecular mechanism of Karanjin against breast cancer. Where, represents the hub genes modulated by Karanjin.
Epidermal Growth Factor Receptor (EGFR) belongs to the erbB family which also includes HER2, HER3, and HER4 receptors (Wieduwilt & Moasser, 2008). We identified that karanjin modulates EGFR and is known that overexpression of HER2 in breast cancer is frequently associated with the expression of EGFR (Fig. 10). EGFR is reported to be expressed in 14–91% of breast cancer patients, and it has also been associated with poor prognosis. A similar study was conducted by Weinberg et al., where they reported that the cell line SKBR3 having overexpressed levels of HER2+ and only low to moderate levels of EGFR, were able to reduce the expression levels of both the receptors as compared to MDA-MB-231 (Weinberg et al., 2020). EGFR is one of the important targets for the treatment of breast cancer as half of the TNBC and Inflammatory breast cancer (IBC) possess, overexpressed EGFR levels (Feng et al., 2018). Studies have displayed EGFR-targeted therapy to be used in enhancing the initial sensitivity of TNBC cells to chemotherapy which may act as a targeted therapy possessing greater cytotoxicity (Kalimutho et al., 2015). Similarly, karanjin has displayed a cytotoxic effect on MDA-MB-468 which may be due to the down-regulation of EGFR. However, the interaction was found to be stable, but hydrophobic bonds do not provide a sustained impact on the target. Hence, this may be a reason for karanjin to be less cytotoxic on MDA-MB-486 in comparison to SKBR3 cell lines.
In conclusion, the in-silico study predicted a probable molecular mechanism that revealed CYP1A1 and PI3KCA to be the major targets involved in the anti-breast cancer mechanism via the modulation of the PI3K-Akt signaling pathway. Further, more studies are suggested to be performed to assess the effect of karanjin on various cell lines and in-vivo models.
5 Conclusion
The present study aimed to propose the possible molecular mechanism of karanjin by utilizing various system biology tools. Further, we also assessed the effect of karanjin on various breast cancer cell lines with respect to drug exposure for different time intervals. The predictions revealed that karanjin may possess anti-breast cancer potential via the modulation of proteins CYP1A1, and PIK3CA identified by network pharmacology and validated using molecular docking and dynamic simulation studies. Further, the PI3K-Akt signaling pathway was predicted to be majorly modulated and was also identified as the lead pathway in cluster analysis. This indicates that karanjin down-regulates the PI3K-Akt signaling pathway and inhibits uncontrolled proliferation. In addition, the cytotoxicity assay revealed karanjin to possess dose-dependent cytotoxicity on all three cell lines with the highest cytotoxicity on SKBR3 cell line. Karanjin also displayed additive/synergistic effects on the three cell lines when used in combination with standards tamoxifen/gefitinib. However, these are in-silico predictions that need to be validated by further quantifying proteins expressed, on treatment with karanjin. This also opens up an aim to study the effect of karanjin on various animal models to validate the results; this is the drawback as well as the future scope of the study.
Ethical approval
This work does not include any animal or human work.
Funding
This research did not receive any specific grant from funding agencies in the public, commercial, or not-for-profit sectors.
Author contribution statement
P.S.R. set the hypothesis, performed the work, gathered & analyzed data, and prepared the manuscript. C.S. helped with hypothesis setup, supervised the work, and helped in drafting & reviewing the manuscript.
Acknowledgement
Authors are heartily thankful to Dr. Pukar Khanal, Department of Pharmacology, NGSM Institute of Pharmaceutical Sciences (NGSMIPS), Nitte (Deemed to be University), for his constant support and guidance throughout the project. The authors also thank Ms. Prachi Dwivedi for her constant support and help in the smooth conduct of this experiment.
Declaration of Competing Interest
The authors declare that they have no known competing financial interests or personal relationships that could have appeared to influence the work reported in this paper.
References
- Awareness and current knowledge of breast cancer. Biol. Res.. 2017;50:1-23.
- [CrossRef] [Google Scholar]
- Review on breast cancer in the Kingdom of Saudi Arabia, Middle-East. J. Sci. Res.. 2013;14:532-543.
- [CrossRef] [Google Scholar]
- Medicinal uses, phytochemistry and pharmacology of Pongamia pinnata (L.) Pierre: A review. J. Ethnopharmacol.. 2013;150:395-420.
- [CrossRef] [Google Scholar]
- Cytochrome P450 CYP1A1: wider roles in cancer progression and prevention. BMC Cancer. 2009;9:1-7.
- [CrossRef] [Google Scholar]
- Antioxidant activity of methanolic extract of Pongamia pinnata on lead acetate induced hepatic damage in rats. Afr. J. Biochem. Res.. 2011;5:348-351.
- [Google Scholar]
- In vitro cytotoxicity and cell viability assays: principles, advantages, and disadvantages. Genotoxicity-A predictable risk to our actual world.. 2018;2:64-80.
- [CrossRef] [Google Scholar]
- Cycloart-23-ene-3b,25-diol stimulates GLP-1(7–36) amide secretion in streptozotocin–nicotinamide induced diabetic Sprague Dawley rats: A mechanistic approach. Eur. J. Pharmacol.. 2013;698:470-479.
- [CrossRef] [Google Scholar]
- The distinctive biology of cancer in adolescents and young adults. Nat. Rev. Cancer. 2008;8:288.
- [CrossRef] [Google Scholar]
- Cancer and radiation therapy: current advances and future directions. Int. J. Med. Sci.. 2012;9:193.
- [CrossRef] [Google Scholar]
- Trends in utilization of the pharmacological potential of chalcones. Curr. Clin. Pharmacol.. 2010;5:1-29.
- [CrossRef] [Google Scholar]
- ClueGO: a Cytoscape plug-in to decipher functionally grouped gene ontology and pathway annotation networks. Bioinformatics. 2009;25:1091-1093.
- [CrossRef] [Google Scholar]
- Prevention of arthritis markers in experimental animal and inflammation signalling in macrophage by karanjin isolated from Pongamia pinnata seed extract. Phytother. Res.. 2014;28:1188-1195.
- [CrossRef] [Google Scholar]
- The triple negative paradox: primary tumor chemosensitivity of breast cancer subtypes. Clin. Cancer Res.. 2017;13:2329-2334.
- [CrossRef] [Google Scholar]
- RAS Interaction with PI3K: More Than Just Another Effector Pathway. Genes Cancer. 2011;2:261-274.
- [CrossRef] [Google Scholar]
- HER2-positive advanced breast cancer treatment in 2020. Cancer Treat. Rev.. 2020;88:102033
- [CrossRef] [Google Scholar]
- Application of the CRISPR/Cas9 system to drug resistance in breast cancer. Adv. Sci.. 2018;5:1700964.
- [CrossRef] [Google Scholar]
- Characteristics of triple-negative breast cancer. J. Cancer Res. Clin. Oncol.. 2011;137:183-192.
- [CrossRef] [Google Scholar]
- Insulin-like growth factor (IGF) signaling in tumorigenesis and the development of cancer drug resistance. Genes Dis.. 2015;2:13-25.
- [CrossRef] [Google Scholar]
- Identification of PTP1B regulators from Cymbopogon citratus and its enrichment analysis for diabetes mellitus. In Silico Pharmacol.. 2021;9:30.
- [CrossRef] [Google Scholar]
- Exploring the therapeutic mechanisms of Cassia glauca in diabetes mellitus through network pharmacology, molecular docking and molecular dynamics. RSC Adv.. 2021;11:39362-39375.
- [CrossRef] [Google Scholar]
- Gene set enrichment analysis of PPAR-γ regulators from Murraya odorata Blanco. J. Diabetes Metab. Disord.. 2021;20:369-375.
- [CrossRef] [Google Scholar]
- Anticancer effect of amygdalin (vitamin b-17) on hepatocellular carcinoma cell line (hepg2) in the presence and absence of zinc, Anticancer Agents Med. Chem. 2020;20:486-494.
- [CrossRef] [Google Scholar]
- Breast cancer development and progression: Risk factors, cancer stem cells, signaling pathways, genomics, and molecular pathogenesis. Genes Dis.. 2018;5:77-106.
- [CrossRef] [Google Scholar]
- PIK3CA Mutations as a Molecular Target for Hormone Receptor-Positive, HER2-Negative Metastatic Breast Cancer. Front. Oncol.. 2021;11:644737
- [CrossRef] [Google Scholar]
- Cytotoxicity screening of Bangladeshi medicinal plant extracts on pancreatic cancer cells. BMC Complement. Altern. Med.. 2010;10:52-62.
- [CrossRef] [Google Scholar]
- Strategies for subtypes–dealing with the diversity of breast cancer: highlights of the St. Gallen International Expert Consensus on the Primary Therapy of Early Breast Cancer 2011. Ann. Oncol.. 2011;22:1736-1747.
- [CrossRef] [Google Scholar]
- SWISS-MODEL and the Swiss-Pdb Viewer: an environment for comparative protein modelling, electrophoresis. J. Comput. Chem.. 1997;18:2714-2723.
- [CrossRef] [Google Scholar]
- Racial disparity in breast cancer: can it be mattered for prognosis and therapy. J. Cell Commun. Signal.. 2018;12:119-132.
- [CrossRef] [Google Scholar]
- Merck molecular force field. I. Basis, form, scope, parameterization, and performance of MMFF94. J. Comput. Chem.. 1996;17:490-519.
- [CrossRef] [Google Scholar]
- Oral Selective Estrogen Receptor Degraders (SERDs) as a Novel Breast Cancer Therapy: Present and Future from a Clinical Perspective. Int. J. Mol. Sci.. 2021;22:7812.
- [CrossRef] [Google Scholar]
- Targeted therapies for triple-negative breast cancer: combating a stubborn disease, Trends Pharmacol. Sci.. 2015;36:822-846.
- [CrossRef] [Google Scholar]
- Biophysical aspect of phosphatidylinositol 3-kinase and role of oncogenic mutants (E542K & E545K) J. Biomol. Struct. Dyn.. 2016;34:2711-2721.
- [CrossRef] [Google Scholar]
- Open Source Drug Discovery Consortium, A. Lynn, g_mmpbsa–a GROMACS tool for high-throughput MM-PBSA calculations. J. Chem. Inf. Model.. 2014;54:1951-1962.
- [CrossRef] [Google Scholar]
- Identification of potential breast cancer markers in nipple discharge by protein profile analysis using two-dimensional nano-liquid chromatography/nanoelectrospray ionization-mass spectrometry. Proteom. - Clin. Appl.. 2016;10:605-613.
- [CrossRef] [Google Scholar]
- DIGEP-Pred: web service for in silico prediction of drug-induced gene expression profiles based on structural formula. Bioinformatics. 2013;29:2062-2063.
- [CrossRef] [Google Scholar]
- Design, synthesis and biological evaluation of 2-(phenoxymethyl)-5-phenyl-1,3,4-oxadiazole derivatives as anti-breast cancer agents. Eur. J. Med. Chem.. 2019;168:1-10.
- [CrossRef] [Google Scholar]
- Quality of life and care needs in women with estrogen positive metastatic breast cancer: a qualitative study. Acta Oncol.. 2018;1:146-151.
- [CrossRef] [Google Scholar]
- New insights of CYP1A in endogenous metabolism: a focus on single nucleotide polymorphisms and diseases. Acta Pharm. Sin. B. 2020;10:91-104.
- [CrossRef] [Google Scholar]
- Recent development of targeted approaches for the treatment of breast cancer. Breast Cancer. 2017;24:191-219.
- [CrossRef] [Google Scholar]
- In silico Molecular Modelling of Selected Natural Ligands and their Binding Features with Estrogen Receptor Alpha. Curr. Comput. Aided Drug Des.. 2019;15:89-96.
- [CrossRef] [Google Scholar]
- Class I Phosphoinositide 3-Kinase PIK3CA/p110α and PIK3CB/p110β Isoforms in Endometrial Cancer. Int. J. Mol. Sci.. 2018;19:3931.
- [CrossRef] [Google Scholar]
- Cancer treatment and survivorship statistics, 2016, CA: Cancer. J. Clin.. 2016;66:271-289.
- [CrossRef] [Google Scholar]
- Epidemiological characteristics of and risk factors for breast cancer in the world. Breast Cancer: Targets Ther.. 2019;11:151.
- [CrossRef] [Google Scholar]
- Profiling the expression of cytochrome P450 in breast cancer. Histopathology. 2010;57:202-211.
- [CrossRef] [Google Scholar]
- Molecules of interest–embelin–a review. Res. J. Pharm. Technol.. 2020;13:3485-3493.
- [CrossRef] [Google Scholar]
- Cancer burden in the year 2000. The global picture. Eur. J. Cancer. 2001;37:4-66.
- [CrossRef] [Google Scholar]
- Side effects of chemotherapy and combined chemohormonal therapy in women with early-stage breast cancer. JNCI Monographs. 2001;30:135-142.
- [CrossRef] [Google Scholar]
- Therapeutic Importance and Pharmacological Activities of Karanjin in the Medicine for the Treatment of Human Disorders: A Review through Scientific Data Analysis. Curr. Drug ther.. 2022;17:71-78.
- [CrossRef] [Google Scholar]
- Effect of methanolic extract of Pongamia pinnata Linn seed on gastroduodenal ulceration and mucosal offensive and defensive factors in rats. Indian J. Exp. Biol.. 2009;47:649-659.
- [Google Scholar]
- Anticancer Potential of Naringenin, Biosynthesis, Molecular Target, and Structural Perspectives. Mini-Rev. Med. Chem.. 2022;22:758-769.
- [CrossRef] [Google Scholar]
- Diagnosis of polymorphisms in carcinogen-activating and inactivating enzymes and cancer susceptibility-a review. Gene. 1995;159:113-121.
- [CrossRef] [Google Scholar]
- CYP1A1 Regulates Breast Cancer Proliferation and Survival CYP1A1 Regulates Breast Cancer Cell Proliferation. Mol. Cancer Res.. 2013;11:780-792.
- [CrossRef] [Google Scholar]
- Pongapin and Karanjin, furanoflavanoids of Pongamia pinnata, induce G2/M arrest and apoptosis in cervical cancer cells by differential reactive oxygen species modulation, DNA damage, and nuclear factor kappa-light-chain-enhancer of activated B cell signaling. Phytother. Res.. 2019;33:1084-1094.
- [CrossRef] [Google Scholar]
- Downregulation of Hyaluronic acid-CD44 signaling pathway in cervical cancer cell by natural polyphenols Plumbagin, Pongapin and Karanjin. Mol. Cell. Biochem.. 2021;476:3701-3709.
- [CrossRef] [Google Scholar]
- Time course and management of key adverse events during the randomized phase III SOLAR-1 study of PI3K inhibitor alpelisib plus fulvestrant in patients with HR-positive advanced breast cancer. Ann. Oncol.. 2020;31:1001-1010.
- [CrossRef] [Google Scholar]
- Risk factors associated with mortality from breast cancer in Waikato. New Zealand: a case-control study, Public Health.. 2015;5:549-554.
- [CrossRef] [Google Scholar]
- Cytoscape: a software environment for integrated models of biomolecular interaction networks. Genome Res.. 2003;13:2498-2504.
- [CrossRef] [Google Scholar]
- The STRING database in 2017: quality-controlled protein-protein association networks, made broadly accessible. Nucleic Acids Res.. 2017;45:D362-D368.
- [CrossRef] [Google Scholar]
- Reducing delay in the diagnosis of pregnancy-associated breast cancer: How imaging can help us. J. Med. Imaging Radiat. Oncol.. 2011;55:33-42.
- [CrossRef] [Google Scholar]
- CASTp 3.0: computed atlas of surface topography of proteins. Nucleic Acids Res.. 2018;46:W363-W367.
- [CrossRef] [Google Scholar]
- gmx_MMPBSA: A New Tool to Perform End-State Free Energy Calculations with GROMACS. J. Chem. Theory Comput.. 2021;17:6281-6291.
- [CrossRef] [Google Scholar]
- Screening of 1, 3, 4-Thiadiazole Derivatives by in silico Molecular Docking to Target Estrogen Receptor for Breast Cancer. Biointerface Res. Appl. Chem. 2023;13:160.
- [Google Scholar]
- CHARMM general force field: A force field for drug-like molecules compatible with the CHARMM all-atom additive biological force fields. J. Comput. Chem.. 2010;31:671-690.
- [CrossRef] [Google Scholar]
- Structure-Function Elucidation of Flavonoids by Modern Technologies: Role in Management of Diabetes and Cancer. Nat. Med. 2019:25-63.
- [Google Scholar]
- EGFR Expression in HER2-Driven Breast Cancer Cells. Int. J. Mol. Sci.. 2020;21:9008.
- [CrossRef] [Google Scholar]
- The epidermal growth factor receptor family: biology driving targeted therapeutics. Cell. Mol. Life Sci.. 2008;65:1566-1584.
- [CrossRef] [Google Scholar]
- Triple–negative breast cancer therapy: Current and future perspectives (Review) Int. J. Oncol.. 2020;57:1245-1261.
- [CrossRef] [Google Scholar]
- Targeting PI3K in cancer: mechanisms and advances in clinical trials. Mol. Cancer. 2019;18:26.
- [CrossRef] [Google Scholar]
- Constitutive regulation of CYP1B1 by the aryl hydrocarbon receptor (AhR) in pre-malignant and malignant mammary tissue. J. Cell. Biochem.. 2008;104:402-417.
- [CrossRef] [Google Scholar]
Appendix A
Supplementary data
Supplementary data to this article can be found online at https://doi.org/10.1016/j.arabjc.2023.104778.
Appendix A
Supplementary data
The following are the Supplementary data to this article:
Supplementary video 8
Supplementary video 8
Supplementary video 9
Supplementary video 9
Supplementary video 10
Supplementary video 10
Supplementary video 11
Supplementary video 11
Supplementary video 12
Supplementary video 12
Supplementary data 1
Supplementary data 1
Supplementary data 2
Supplementary data 2
Supplementary data 3
Supplementary data 3
Supplementary data 4
Supplementary data 4
Supplementary data 5
Supplementary data 5
Supplementary data 6
Supplementary data 6
Supplementary data 7
Supplementary data 7


