

Translate this page into:
Ultrasound assisted based solid phase extraction for the preconcentration and spectrophotometric determination of malachite green and methylene blue in water samples
⁎Corresponding authors. shojaeisiroos@gmail.com (Siroos Shojaei), Rahmani341@hamoon.usb.ac.ir (Mashaallah Rahmani)
-
Received: ,
Accepted: ,
This article was originally published by Elsevier and was migrated to Scientific Scholar after the change of Publisher.
Peer review under responsibility of King Saud University.
Abstract
In this study, magnetic ferrite nanoparticles CoFe2O4 were synthesized by combustion method. Magnetic solid phase extraction was carried out by ultrasonic assisted (UAMSPE) followed by UV/Vis spectrophotometer (UAMSPE-UV/Vis) to extract malachite green (MG) and methylene blue (MB) from water samples. To investigate the effects of adsorbent dosage, solution pH, ultrasonication time and volume of eluent solvent parameters on the extraction of MG and MB by CoFe2O4, the extraction experiments through the response surface methodology (RSM) were mathematically modeled and described as parameter performance. The results of extraction tests under optimal conditions showed that CoFe2O4 had a high extraction percentage. In optimal conditions, linear range of 70–550 ng mL−1 (R2 = 0.9977) and 40–450 ng mL−1 (R2 = 0.9983) were observed for MG and MB, respectively. Limit of detection (LOD) for MG and MB were 16.5 ng mL−1 and 11 ng mL−1, respectively. Relative standard deviation (RSD) was obtained in good and low values of 2.9% and 2.3% was achieved for MG and MB, respectively. The results of investigating the reusability of CoFe2O4 adsorbent showed that the adsorbent can be used for up to 5 absorption and desorption cycles. Also, the developed method was finally used successfully in determining MG and MB in fish, fish farming water, tap water and wastewater samples with recoveries ranged in 96.46–99.82%.
Keywords
Ultrasonic-assisted magnetic solid phase extraction
Malachite green
Methylene blue
Response surface methodology
Spectrophotometric method

1 Introduction
Wastewater containing dyes is one of the most important environmental problems. Textile, dying and paper industries are the main producers of wastewater containing dyes. The presence of dye in water causes problems such as lack of light penetration into the water, interference in the photosynthesis of aquatic plants and causing allergies for humans and animals (Azari et al., 2022; Babakir et al., 2022; Khajeh et al., 2020; Sarani et al., 2020; Zazouli et al., 2016).
There are several techniques to determine the dye, some of these techniques are: gas chromatography-mass spectrometry (GC–MS), high-performance liquid chromatography with ultraviolet (HPLC-UV) and ultraviolet–visible spectrophotometry (UV/Vis). Ultraviolet–Visible spectrophotometry technique compared to other methods has advantages of ease, simplicity, usability for a wide range of extractable species, and cheapness of the device for extraction. Due to the low amount of analyte and the complexity of the sample matrix, the enrichment and separation processes are of great importance before the analysis (Ghosh et al., 2021; Shojaei et al., 2021; Chandel et al., 2020; Zarei Mahmoudabadi et al., 2019).
Liquid-liquid extraction (LLE) and solid-phase extraction (SPE) are some widely accepted pre-concentration techniques. LLE is time-consuming and tedious and requires huge amounts of expensive and mostly toxic organic solvents. On the other hand, SPE employs significantly smaller volumes of solvent than LLE (Oliveira et al., 2022; Sun et al., 2020; Román et al., 2011). In recent decades, improvements and developments have occurred on standard and old methods. For instance, the magnetic solid-phase extraction (MSPE) technique has received great attention. This technique is extensively used for separating and pre-concentrating various compounds, such as pharmaceutical and food samples, polycyclic aromatic hydrocarbons, insecticides, and trace amounts of toxic metal ions (Yeganeh et al., 2023; Azari et al., 2022; Ghiasi & Malekpour 2020; Mehrabi et al., 2017; Reyes-Gallardo et al., 2013). In addition, the MSPE method is a promising alternative to the LLE method because of its simplicity and safety. High recovery of the analyte, purification of extracted species, easy automation, and reduced consumption of organic solvents are the main advantages of MSPE. The simple collection of nanoparticles from the solution via an external magnetic field is another advantage of MSPE. This magnetic property is suitable for extracting species from large-volume samples, as there is no need to centrifuge or filter the sample after extraction (Baghaei et al., 2023; Ghiasi et al., 2020; Li et al., 2015).
Nanomaterials have become one of the most remarkable items among the various adsorbents used in solid phase microextraction. The unique properties of nanomaterials give an excellent perspective to devise new methods and instruments for chemical analysis. Homogeneous distribution of dispersed nanoparticles in solution transfers the ideal mass to surfaces and can capture magnetic discharged materials. In addition, dispersed adsorbents prevent problems such as interruptions in filtration and deposition in packed columns and membranes (Abdel-Lateef et al., 2022; Reghioua et al., 2021; Khan et al., 2020; Kraus et al., 2009). Magnetic nanoparticles are widely used because of their wide range of applications in wastewater treatment, biological cell labeling, high density data storage, biochemical sorting and separation, magnetic resonance imaging (MRI), and drug delivery. The most important advantage of using magnetic nanoparticles as solid phase extraction is to collect particles through a magnetic field in a batch system. This feature makes magnetic nanoparticles excellent candidates to combine adsorption properties and phase separation (Shahryari et al., 2022; Nouri et al., 2020; Rabiee et al., 2020; Noormohamadi et al., 2018; Galaburda et al., 2017).
The design of experiments (DOE) is a technique applied to reduce process time and costs. DOE is a very practical method for attaining correct information about the studied factors and variables. Identifying a suitable model’s experimental data requires statistical design principles, modeling techniques, and optimization methods (Esfe et al., 2022; Azari et al., 2021). These requirements are collectively met in the response surface methodology (RSM), which is among the most common methods in optimization and simulation. The RSM is method to design experiments that are useful to reduce the number of experiments and the interaction between factors, and it has been reported by many researchers (Arabkhani & Asfaram.2022; Srimoke et al., 2022; Rahmani et al., 2017). RSM is a laboratory optimization tool that involves complex mathematical calculations. The first goal for RSM is to find the optimum response. It helps the researcher determine the best laboratory design by the relationship between the variables. With the help of this tool, the optimization process with all variables examined in a short time in the laboratory stage becomes more valid (Jafari et al., 2022; Srimoke et al., 2022; Hashemi et al., 2021). Thus, the RSM method can be used to improve and optimize the process.
In this study, magnetic nanoparticles CoFe2O4 were synthesized and used as adsorbent to determine a small amount of MG and MB followed by UV/Vis analysis. RSM method was also used to investigate the effect of important operational parameters such as pH, adsorbent amount, solvent volume and ultrasonication time on adsorption capacity. Finally, the application of the method for MG and MB analysis in fish and environmental water samples was investigated.
2 Materials and methods
2.1 Reagents and instrumentation
All chemicals such as malachite green (MG), methylene blue (MB), sodium hydroxide, hydrochloric acid, ethanol, acetonitrile, methanol, glycine, iron nitrate, potassium chloride, cobalt nitrate, and acetone were used without further refining and were purchased from Merck KGaA (Darmstadt Germany). The standard stock solutions of MG and MB (100 mg L-1) was prepared and then, the working solutions were prepared daily by diluting the standard stock solutions with double distilled water. Nanoparticles were characterized by X-ray diffraction (XRD) model Advance D8, Bruker, and scanning electron microscopy (SEM) model KYKY-EM3900M. UV/Vis spectrophotometer was used to determine the concentration of dyes equipped with a microcell. An ultrasonic device (Lk-D31-KDC 200B, Zhengzhou) equipped with digital timer was used for the ultrasound-assisted procedure. The pH was adjusted by sodium hydroxide (0.1 M) and hydrochloric acid (0.1 M) and measured using a pH meter. In this study, Design-Expert 10 software was applied for experimental design and data analysis. In all experiments, double distilled water was used.
2.2 Synthesis of CoFe2O4
In the present study, cobalt ferrite nanostructures were synthesized by the combustion method. The synthesis of cobalt ferrite powders was carried out considering the ratio of fuel (glycine) to total oxidants (iron and cobalt nitrates) equal to one and also the molar ratio of iron nitrate to cobalt nitrate equal to 2. Salt (potassium chloride) was used in the amount of two-thirds of the total amount of metal nitrates used. A solution with a certain pH (value 4) was prepared for the synthesis. To prepare an acidic solution, nitric acid was added to double distilled water to reach the desired pH. In each experiment, 10 mmol of cobalt nitrate, 20 mmol of iron nitrate, 44.4 mmol of glycine and 20 mmol of potassium chloride were dissolved in 60 mL of a solution with a certain pH. The dissolution process was carried out on a heater with a temperature of 80 °C. After the complete dissolution of all raw materials in the solvent, the temperature of the heater was set to the maximum possible. In this way, while the solution was being stirred, the gradual evaporation of the solvent started and with its continuation, it reached a stage where the solution changed color. At this stage, the stirring of the solution was stopped, and with the continued heating, a combustion reaction occurred, leading to the production of a powder product. The resulting powder was a mixture of cobalt ferrite particles and residual combustion products. Due to the insolubility of cobalt ferrite particles in water, the soluble impurity of the synthetic powder was separated by washing the resulting powder in hot water. The resulting powders were dried in an oven and studied by SEM and XRD.
2.3 Extraction experiments
In this study, experiments were done individually for each analyte. Ultrasonic preconcentration experiments were undertaken to increase the diffusion coefficient of dyes and mass transfer in batch mode. In this system, the experiments were done in test tube containing 15 mL of dyes at the optimum level of each parameter. In each experiment, a particular concentration of dye was transferred into the test tube. The initial pH of the samples was adjusted using HCl and NaOH 0.1 M. Then, after weighing, the required amount of CoFe2O4 was added to the samples. After that, the mixture was dispersed in an ultrasonic bath at room temperature. Finally, sampling was performed at a specific time and nanoparticles containing dyes were collected using an external magnetic field and the liquid phase was discarded. The analytes (dyes) were eluted from the adsorbent by adding of methanol to the adsorbent. Then, the test tube was placed in an ultrasonic bath for 5 min so that the solvent detaches the analyte-adsorbent bond and elutes the analyte from the surface of the adsorbent. The system was then exposed to a strong magnet and the solution was separated from the adsorbent. Finally, spectrophotometric measurements were done on a UV/Visible spectrophotometer at a maximum wavelength of MG (620 nm) and MB (665 nm). Extraction recovery was used to evaluate the extraction efficiency under different conditions. Enrichment factor (EF) was calculated through the following equation (1).
2.4 Determination MG and MB in real samples
In order to study the efficacy of the UAMSPE method in the analysis of real samples, different samples (fish, fish farming water, tap water and wastewater) were used. Since the samples examined in this research were taken from natural and environmental water samples, only a preliminary preparation was done on the samples, which included filtering the samples and passing them through a 0.45 µm cellulose filter to separate the suspended solid particles that cause errors and light scattering in the measurement from the sample. The desired dyes were extracted from water samples without adding dye and by adding dye according to the proposed method.
In order to check the fish sample, some carp fish were prepared from Zabol city (Iran). The amount of 20 g of fish tissue was separated and weighed and mixed in 200 mL of 10% ethanol. Then it was mixed in an ultrasonic bath for 30 min. Then 100 mL of the obtained product was separated and 5 mL of sodium hydroxide (1 M) was added to the solution to precipitate the fatty acids in the fish tissue. After 20 min, the mixture was centrifuged at 3500 rpm for 10 min. Then the supernatant solution was poured into 15 mL test tubes and kept until the next step. After that, the experiments were carried out according to the proposed method. According to the results, the desired dyes were not found in the sample. In order to check the effect of the sample texture, the test was repeated in the presence of the added amount of the desired dyes to the test tubes, and by calculating the amount of dye obtained, the ER% was obtained.
2.5 Response surface methodology
As an important topic in the statistical design of experiments, the Response Surface Methodology (RSM) method is a set of useful mathematical and statistical techniques for process modeling and analysis in which the reciprocal response is influenced by several variables that aim to optimize the response. RSM has played an important role in the design, development and analysis of new scientific studies and products. Experimental statistical process design can reduce process changes, test time, and overall cost by improving the process. In general, the process analysis has 4 stages: I) Determining the factors and conditions of the test II) Building experimental methods III) Analyzing, and IV) Validating the experiments. RSM design requires a minimum number of tests to be done. The total number of experiments conducted in this type of design is generally obtained from the equation 2n + 2n + nc. In this equation, 2n is the factorial experiment, 2n is the axial experiment, and nc is the central experiment. n is the number of independent process variables. Optimization involves evaluating the coefficients in a mathematical model and predicting the response and evaluating the adequacy of the model. The response model may be expressed as (3):
In this equation, Y is the predicted response, b0 is the constant coefficient, bi is the linear coefficient, bii is the quadratic coefficient, bij is the interaction coefficient, Xi and Xj are the encoded values of the process variables (Azari et al., 2022; Oyekanmi et al., 2019). After defining the range of each process variable, they were set to ± 1 for factorial points, 0 for central points, and ± α for axial points. Numerical values of variables are considered valid values as (4);
The design matrix consists of four variables at five levels (-α, −1, 0, +1, α + ). The experimental amplitude and levels of the variables studied in this study are presented in Table 1. The coded variables are obtained according to the following equation (5):
Variables
Unit
Levels
Low (-1)
Central (0)
High (+1)
α-
+α
Adsorbent amount
g
0.02
0.03
0.04
0.01
0.05
pH of the solution
---
6
7
8
5
9
Eluent volume
µL
150
200
250
100
300
Ultrasonication time
min
4
6
8
2
10
Where × is the variable under consideration, X is the coded variable, and xmax and xmin are the maximum and minimum values (Manousi et al., 2020).
Different parameters of UAMSPE such as adsorbent amount, pH, eluent volume and ultrasonication time potentially affect the extraction. Each factor was coded at five levels according to Equation (3), the values of which are shown in Table 1.
3 Results and discussion
3.1 Characterization of sorbents
Phase analysis of CoFe2O4 nanoparticles was done by XRD in the room using Cu K radiation. XRD of the calcined CoFe2O4 powder (Fig. 1a), shows all the CoFe2O4 peaks identified by their indices with standard JCPDS card no. 0426–077 (Wu and Ishihara 2019). No other peaks or impurities were detected. This observation and broadening of the diffraction peaks showed that CoFe2O4 nanoparticles were formed in the size of nanoparticles. Therefore, XRD investigated the formation of pure phase CoFe2O4. The morphology and particle size of the adsorbents were examined by SEM and shown in Fig. 1b. The normal surface morphology and topography of the nanostructured powders showed a cluster of small particles and the least amount of clumping and agglomeration was observed. Porosity in these nanomaterials can be the cause of gas products such as water vapor, carbon dioxide and nitrogen. The things that can be seen are that the prepared nanoparticles have a high surface area and a high capacity for the fast analyte.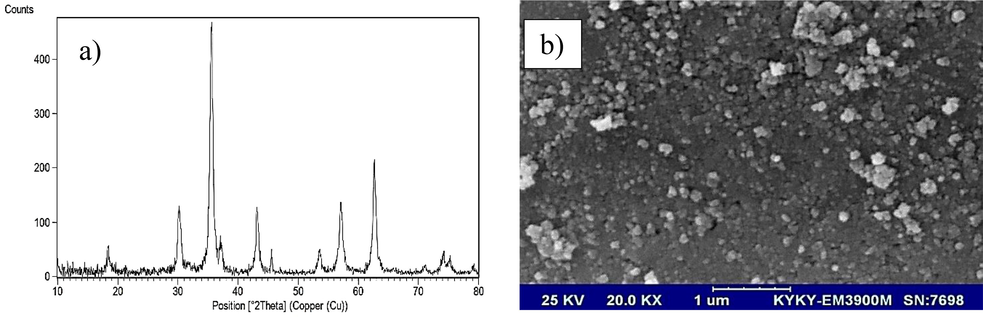
(a) XRD pattern and (b) SEM image of CoFe2O4 nanoparticles.
3.2 Desorption conditions
A suitable solvent should remove the analyte from the adsorbent in small volumes. The leaching rate of the adsorbed analytes using a suitable solvent can be effectively measured on the rate at which the analytes leave the adsorbent and enter the solution. Therefore, the effects of different eluents such as methanol, ethanol, acetone and acetonitrile in extraction recovery from MG and MB was examined (Fig. 2). The results showed that methanol is the most suitable solvent for this purpose due to better reproduction and highest determinant yield.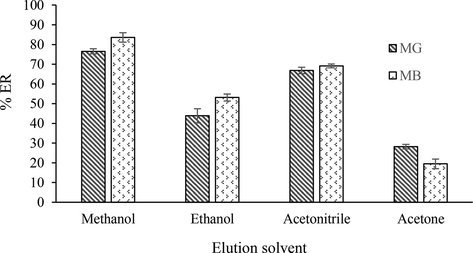
The effect of type of eluent on the recovery of dyes.
Sample volume is one of the important parameters affecting the pre-absorption factor and the amount of extraction in the analysis of real samples. Extraction was evaluated by adding a certain volume of 5 to 20 mL dyes solutions to CoFe2O4, while the total amount of adsorbent was kept constant during the experiments. The extraction efficiency reduction in volumes higher than 15 mL can be due to the dilution of the solution and the reduction of the contact area of the adsorbent particles with the analyte species. Therefore, the volume of 15 mL was selected for the following experiments so that the experiment could be performed easily and quickly.
3.3 Analysis of CCD
CCD was carried out to investigate the main and reciprocal role of variables in recovery from MG and MB. The effect of four independent variables (adsorbent amount, pH of solution, Eluent volume and ultrasonication time) was investigated. Table S1 and S2 shows the recovery rate for the studied dyes. The adequacy of the developed models and the statistical significance of regression coefficients were tested using analysis of variance (ANOVA) and the results related to ANOVA were shown in Tables S3 and S4. The results showed that these models were very significant for the extraction of MG and MB on CoFe2O4. The fit between the experimental model and the experimental data was analyzed through coefficient of determination, F-value and p-value. The quality of the selected model is expressed by a coefficient of determination (R2) of 0.95, which is confirmed by a high and reasonable value of the coefficient of determination (R2adj > 0.99 for both dyes). In fact, it shows that the results are not random and the terms in the models have a significant effect on the reaction. F-value less than 0.5 for non-compliance indicates that a pure trial error is acceptable and confirms the validity of the model. Using the experimental data, the final model for the extraction of MG and MB on CoFe2O4 was described using Equations (6) and (7), respectively.
A reasonable agreement and high coefficient of determination of the graph of experimental values of recovery to the predicted value indicate the high efficiency of the equation mentioned for evaluating and explaining the experimental data (Fig. 3). Actual values, response data are based on measurements performed and predicted values are obtained from the model. According to Fig. 3a and 3b, the correlation between experimental data and predicted values shows the appropriateness of the model. Data were analyzed to check for normal residues (Fig. 3c and 3d). Residual analysis is the main diagnostic tool to check the adequacy of the proposed model so that for normal distribution of errors, the residues are either in a straight line or very close to the line. From Fig. 3c and 3d, it is obvious that the points are close to the straight line, indicating that the errors are normally and independently distributed and that the assumptions are not violated. Fig. 3e and 3f shows the run scheme to the residuals. According to the figure, the remaining stochastic pattern shows the adequacy of the model, and for integrated analysis, experimental data are required, assuming that the data have a normal distribution.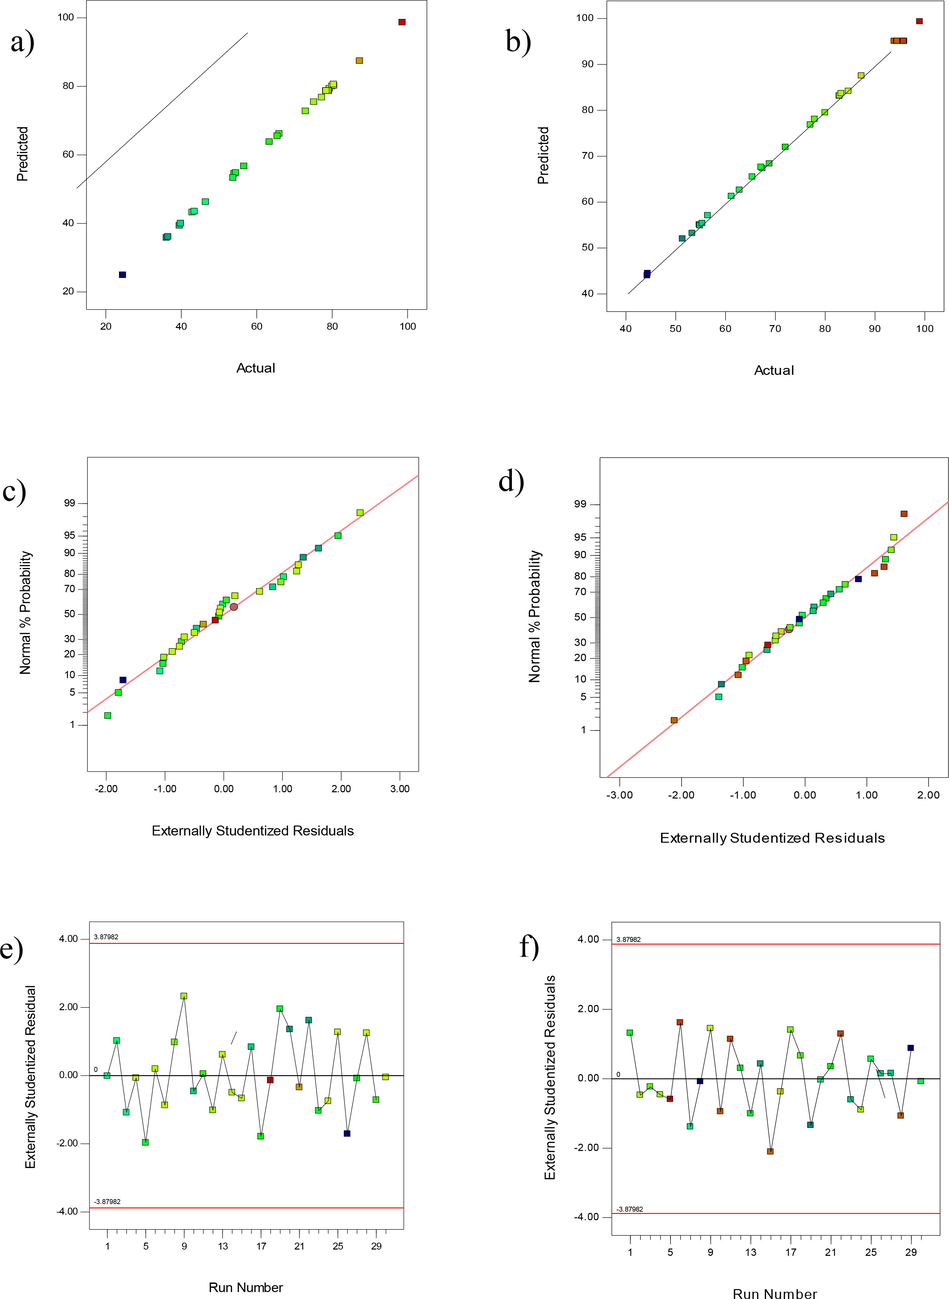
Experimental versus predicted values for the %ER (a) MG (b) MB onto CoFe2O4; normal probability plots of residuals for the %ER (c) MG (d) MB by CoFe2O4; Plot of residuals versus run number (e) MG and (f) MB obtained using CCD.
3.4 Effects of process variables
The interaction between different variables and their corresponding effect on the response was investigated by scattering analysis by three-dimensional (3D) plots. It is useful to visualize the relationship between response and experimental levels of each factor. For graphical interpretation of interactions, the use of 3D model functions is highly recommended. In these functions, the response is placed against two experimental factors, while other factors remain constant at the central level. Fig. 4a and 4c show the effect of CoFe2O4 adsorbent amount on MG and MB extraction. As it is clear from the figures, the amount of adsorbent has affected the extraction and increasing the amount of adsorbent has been beneficial for the extraction of MG and MB. As can be seen, for both dyes, recoveries have increased with the increasing amount of absorbent. Because by increasing the amount of adsorbent, the number of places available for the interaction of adsorbent and dye molecules increases, hence the amount of dye extraction from the solution increases (Liu et al., 2022; Aigbe et al., 2021).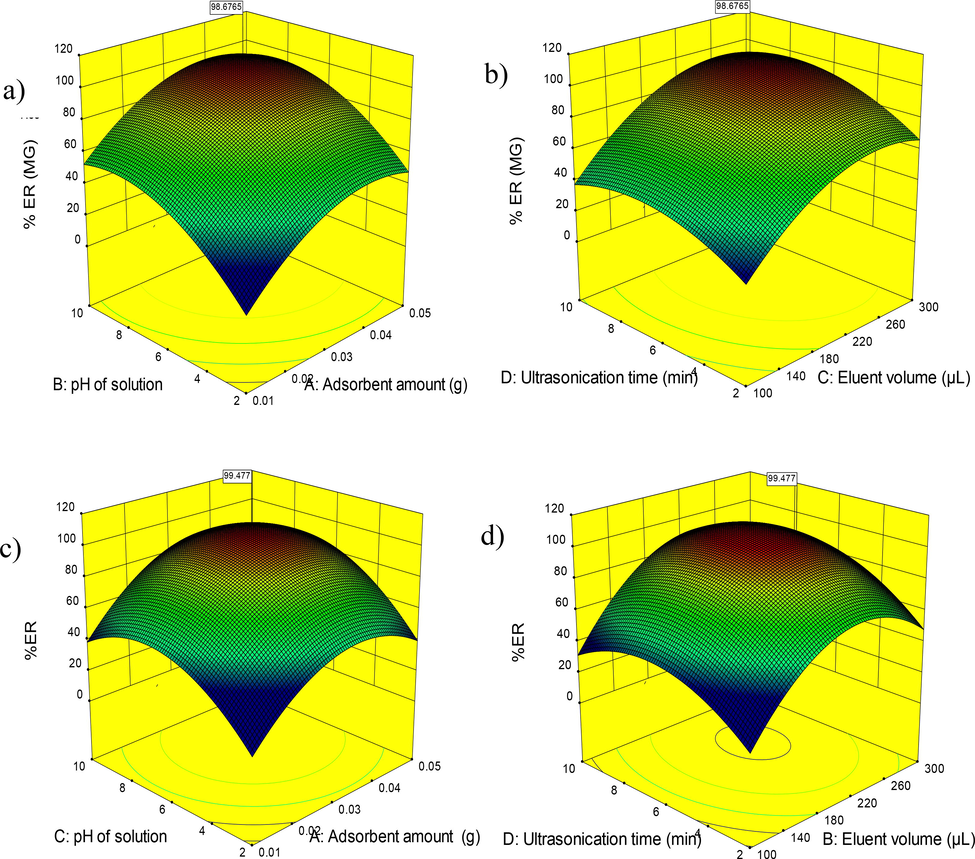
3D surface plots indicating interaction effects of independent variables on variation of ER% a), b) MG and c), d) MB using CoFe2O4.
Also, Fig. 4a and 4c graphically show the effect of pH on the amount of MG and MB extraction. The pH of the solution is very effective on the speed of the process as well as the amount of extraction. For each system, the best conditions in terms of pH must be determined by conducting experiments. At low pH values, due to the presence of electrostatic repulsions between the positive charge of the adsorbent and the analyte, the opportunity and conditions for dye extraction are not provided. But in the alkaline pH range, the electrostatic interactions between the adsorbent with a negative charge and the dye with a positive charge are increased for optimal extraction and recovery (Samadi et al., 2021; Asfaram et al., 2016).
Fig. 4b and 4d show the effect of solvent volume on the extraction rate of MG and MB. Experiments were performed using different volumes of methanol in the range of 100–300 µL. The results showed that with the increase in the volume of the solvent, the amount of recovery of MG and MB from the surfaces of nanoparticles increased, which could be due to the greater interaction of the solvent with the dye molecules Aramesh et al., 2021). As can be seen, the value of 251 µL for MG and 248 µL for MB was chosen as the optimal volume.
The effect of ultrasonication time on MG and MB extraction are shown in Fig. 4b and 4d. Ultrasonication time, compared to other selection indicators, plays a minor role in the extraction value and indicates that the performance can be obtained in a short time. According to the studies, the absorption operation is carried out in two stages. The first stage is the fast absorption stage of the absorbent surface and the second stage is the slow stage of internal mass transfer. In the first case, it causes that the absorbent sites are empty, absorption is carried out on the absorbent, and with the passage of time and the speed of the sites becoming faster, the penetration of dye molecules into the empty absorbent sites causes the transformation of the absorption process (Sharifpour et al., 2022; Sheibani et al., 2022).
3.5 Optimization of variables on the extraction of MG and MB dyes
In order to increase the extraction efficiency of MG and MB dyes by CoFe2O4, it is necessary to optimize the variables affecting the process. Effective factors included amount of adsorbent, ultrasonication time, pH, and eluent volume. For this purpose, the possibility of predicting the response level method was used and experiments were conducted under optimal conditions. The results showed recovery in the range of 96.94–99.79% for MG and MB dyes (Table 2).
Optimal conditions
Recovery (%)
Dyes
Adsorbent amount (g)
pH of the solution
Eluent volume (µL)
Ultrasonication time (min)
Experimental
Predicted
MG
0.038
8
251
7.8
99.67
98.68
0.038
8
251
7.8
96.94
98.68
0.038
8
251
7.8
98.05
98.68
MB
0.034
7
248
5.7
98.12
99.47
0.034
7
248
5.7
99.79
99.47
0.034
7
248
5.7
97.84
99.47
3.6 Analytical figures of merit
Considering the importance of analyte determination in low concentration in samples, preconcentration and separation before analysis are of great importance. The calibration curve was obtained from the analysis of MG and MB using a UV/Vis spectrophotometer by plotting the signal intensity against the dye concentration. Absorption increased linearly with the concentration of MG and MB, and linear calibration equations were obtained in the range of 70–550 ng mL−1 and 40–450 ng mL−1 for MG and MB, respectively. A major challenge in mining exploitation is choosing test conditions that provide reliable response and an acceptable limit of detection. Experiments were performed under optimal extraction conditions to check the coefficient of determination (R2) and limit of detection (LOD of the proposed method for CoFe2O4 adsorbent, and the results are given in Table 3. Also, in order to show the reusability of CoFe2O4 for the extraction of MG and MB, the adsorption-washing cycle was repeated 10 times. According to Fig. 5, no noticeable change was observed in the extraction rate of MG and MB up to five times, and then a further decrease in the extraction percentage of dyes was observed. Therefore, CoFe2O4 sorbent can be used five times to extract MG and MB.
Analytes
MG
MB
Regression equation
A = 0.0027C−0.0124
A = 0.0032C + 0.0388
Coefficient of determination
0.9977
0.9983
Linear range (ng mL−1)
70−550
40−450
LOD (ng mL−1)
16.5
11
RSD (%) (n = 5)
2.9
2.3
Recovery (%)
98.69
99.24
Enrichment factor
30
40
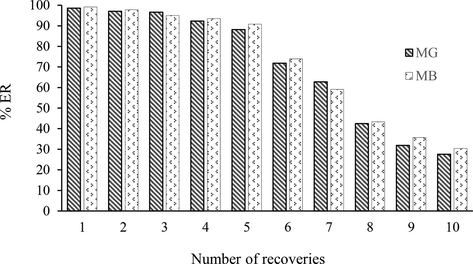
Effect of number of recoveries on CoFe2O4.
3.7 Analysis of real samples
In order to check the feasibility and reliability of the developed and optimized method, fish, tap water, wastewater, and fish farming water samples containing MG and MB were used for testing (Table 4). The samples were examined by UAMSPE-UV/Vis method under optimal conditions. The validity of the model was checked by predicting the concentration of MG and MB in real samples to obtain extraction with recovery and RSD. The results showed that the proposed method has excellent values and its efficiency does not change with the presence of the matrix, and there is also a good agreement between the determined and specified. The recovery showed that the UAMSPE-UV/Vis method is an efficient method for the detection of complex samples containing MG and MB.
Sample
Spiked concentration (ng mL−1)
Found (ng mL−1)
Recovery (%)
RSD (%) (n = 5)
MG
MB
MG
MB
MG
MB
MG
MB
Tap water
200
150
197.6
147.9
98.80
98.60
3.8
2.2
400
300
395.9
298.1
98.97
99.36
3.0
3.2
Wastewater
200
150
195.9
148.7
97.95
99.13
2.7
3.9
400
300
399.3
291.5
99.82
97.16
3.1
3.5
Fish
200
150
190.6
147.3
95.30
98.20
3.3
4.2
400
300
388.8
289.4
97.20
96.46
5.3
3.6
Fish farming water
200
150
199.4
148.4
99.70
98.93
3.7
3.3
400
300
396.4
297.3
99.00
99.10
4.2
4.1
3.8 Comparison of the proposed UAMSPE-UV/Vis with other methods
Table 5 shows a comparison between the results obtained by some measurement methods to determine MG and MB with the present method. As it is clear from Table 5, the proposed method is comparable to or has superior behavior compared to the mentioned methods. Because no cleaning step was necessary for biological matrices. Also, in the present research, the amount of organic solvent used was very low. It should be noted that the most important advantage of UAMSPE-UV/Vis is the easy separation and reversibility of the process. Because the adsorbent can be easily separated from the liquid environment by a magnet and can be used again for the next tests. High sensitivity and selective analysis devices such as HPLC or MS have been used in most aforementioned methods. It is costly to use these devices, and their widespread use for dyes determining is not possible in developing countries. Therefore, the present method combined with spectrophotometry, which has high sensitivity, simplicity, speed, and reproducibility, is suitable for pre-concentrating and extracting small amounts of dyes from aqueous samples. Abbreviations: CPE: Cloud point extraction, MIP-SPE: Molecularly imprinted polymer- solid phase extraction, RDSE: Rotating disk sorbent extraction, SPE: Solid phase extraction, UPLC/EITMS: Ultra-Performance Liquid Chromatography with Electrospray Ionization Tandem Mass Spectrometry, UAMSPE: Ultrasonic-assisted magnetic solid phase extraction, LC-MS/MS: Liquid chromatography-tandem mass spectrometry, SALLME-BE: Shaker-assisted liquid–liquid microextraction combined with back-extraction, *Not report.
Analyte
Extraction method
Detection method
Linear range (ng mL−1)
LOD (ng mL−1)
Enrichment factor
References
MG
CPE
Spectrophotometry
9.9–800
2.9
20
An et al., 2010
MIP- SPE
HPLC
10–600
1.23
*
Hu et al., 2015
RDSE
Spectrophotometry
10–1000
1.4
*
Richter et al., 2011
SPE
Spectrophotometry
320–5000
67
90
Al-Degs & Sweileh 2012
SPE
UPLC/EITMS
2.5–100
1
*
Xu et al., 2012
UAMSPE
Spectrophotometry
70–550
16.5
30
This work
MB
SPE
LC-MS/MS
10–5000
0.1
*
Khan et al., 2014
SPE
Liquid chromatography
1000–5000
300
*
Memon et al., 2014
SPE
Spectrophotometry
8–2212
2.5
135
Ramandi & Shemirani 2015
SALLME-BE
Spectrophotometry
2–170
0.5
173
Ahmadi et al., 2019
UAMSPE
Spectrophotometry
40–450
11
40
This work
4 Conclusion
In this study, CoFe2O4 nanoparticles were synthesized and used as absorbers in UAMSPE-UV/Vis method to extract MG and MB. RSM was used to optimize the extraction parameters. This model achieved higher accuracy through the analysis of fewer samples and focused more on the ability to predict capacity and mining conditions, and was an excellent complement to real samples. Under optimal conditions, the ER percentage of MG and MB was obtained in the range of 96.94–99.79%. According to the results, the proposed method is applicable for determining MG in the concentration range of 70–550 ng mL−1 and for MB in the range of 40–450 ng mL−1. The LOD for MG was 16.5 ng mL−1 and for MB was 11 ng mL−1. Also, the RSD value for the measurement of MG and MB was less than 4%. Also, methanol was considered an optimal eluent solvent. In the end, successful experiments were conducted to extract MG and MB from fish, tap water, wastewater, and fish farming water samples, which showed the effectiveness of the proposed method in extracting MG and MB from real complex samples with a very small amount in a short period of time. The real samples analysis results showed that the recovery efficiency of MG and MB dyes were in the range of 95.30–99.82%. The results of investigating the reusability of CoFe2O4 in MG and MB measurements showed that the CoFe2O4 adsorbent can be used for up to 5 absorption and desorption cycles, and no significant decrease in the extraction speed of MG and MB dyes was observed. One of the most important advantages of this method is its simplicity, low cost, and high preconcentration factor. On the other hand, its low LOD is a significant advantage compared to the low cost of the measurement equipment. All these results prove the suitability of the developed method in terms of simplicity, sensitivity and easy efficiency for the determination of MG and MB in real samples.
Acknowledgment
This research was supported by University of Sistan and Baluchestan.
Author contributions
M.R. conceived and planned the experiments. S.Sh., and A.A. carried out the experiments, experimental design, and contributed to the interpretation of the results. S.Sh., and M.Kh. had a significant contribution for technical checking, validation and programming language checking of the manuscript in terms of grammar checking and writing. All authors discussed the results and contributed to the final manuscript.
References
- A specific turn-on fluorescence probe for determination of nitazoxanide based on feasible oxidation reaction with hypochlorite: applying cobalt ferrite nanoparticles for pre-concentration and extraction of its metabolite from real urine samples. J. Pharm. Biomed. Anal.. 2022;219:114941
- [Google Scholar]
- Shaker-assisted liquid-liquid microextraction of methylene blue using deep eutectic solvent followed by back-extraction and spectrophotometric determination. Microchem. J.. 2019;145:501-507.
- [Google Scholar]
- Fly ash-based adsorbent for adsorption of heavy metals and dyes from aqueous solution: a review. J. Mater. Res. Technol.. 2021;14:2751-2774.
- [Google Scholar]
- Simultaneous determination of five commercial cationic dyes in stream waters using diatomite solid-phase extractant and multivariate calibration. Arab. J. Chem.. 2012;5(2):219-224.
- [Google Scholar]
- Simultaneous spectrophotometric determination of trace amount of malachite green and crystal violet in water after cloud point extraction using partial least squares regression. J. Hazard. Mater.. 2010;175(1–3):883-888.
- [Google Scholar]
- The potential application of bio-based ceramic/organic xerogel derived from the plant sources: A new green adsorbent for removal of antibiotics from pharmaceutical wastewater. J. Hazard. Mater.. 2022;429:128289
- [Google Scholar]
- Chitosan-based hybrid materials for adsorptive removal of dyes and underlying interaction mechanisms. Int. J. Biol. Macromol.. 2021;183:399-422.
- [Google Scholar]
- Optimization of ultrasound-assisted dispersive solid-phase microextraction based on nanoparticles followed by spectrophotometry for the simultaneous determination of dyes using experimental design. Ultrason. Sonochem.. 2016;32:407-417.
- [Google Scholar]
- Integrated ultrasound-assisted magnetic solid-phase extraction for efficient determination and pre-concentration of polycyclic aromatic hydrocarbons from high-consumption soft drinks and non-alcoholic beers in Iran. J. Sep. Sci.. 2022;45(16):3139-3149.
- [Google Scholar]
- Magnetic NH2-MIL-101 (Al)/Chitosan nanocomposite as a novel adsorbent for the removal of azithromycin: modeling and process optimization. Sci. Rep.. 2022;12(1):18990.
- [Google Scholar]
- Magnetic multi-walled carbon nanotubes-loaded alginate for treatment of industrial dye manufacturing effluent: adsorption modelling and process optimisation by central composite face-central design. Int. J. Environ. Anal. Chem. 2021:1-21.
- [Google Scholar]
- Integrated Fuzzy AHP-TOPSIS for selecting the best color removal process using carbon-based adsorbent materials: multi-criteria decision making vs. systematic review approaches and modeling of textile wastewater treatment in real conditions. Int. J. Environ. Anal. Chem.. 2022;102(18):7329-7344.
- [Google Scholar]
- Rapid removal of anionic organic dye from contaminated water using a poly (3-aminobenzoic acid/graphene oxide/cobalt ferrite) nanocomposite low-cost adsorbent via adsorption techniques. Arab. J. Chem.. 2022;15(12):104318
- [Google Scholar]
- Application of deep eutectic solvent functionalized cobalt ferrite nanoparticles in dispersive micro solid phase extraction of some heavy metals from aqueous samples prior to ICP-OES. J. Food Compos. Anal.. 2023;117:105125
- [Google Scholar]
- Dispersive liquid–liquid microextraction using extraction solvents lighter than water combined with high performance liquid chromatography for determination of synthetic antioxidants in fruit juice samples. J. Food Compos. Anal.. 2012;27(1):87-94.
- [Google Scholar]
- Magnetically separable ZnO/ZnFe2O4 and ZnO/CoFe2O4 photocatalysts supported onto nitrogen doped graphene for photocatalytic degradation of toxic dyes. Arab. J. Chem.. 2020;13(2):4324-4340.
- [Google Scholar]
- Influence of different parameters on the rheological behavior MWCNT (30%)-TiO2 (70%)/SAE50 hybrid nano-lubricant using of response surface methodology and artificial neural network methods. Arab. J. Chem.. 2022;15(12):104285
- [Google Scholar]
- Galaburda, M. V., Bogatyrov, V. M., Tomaszewski, W., Oranska, O. I., Borysenko, M. V., Skubiszewska-Zięba, J., & Gun’ko, V. M. (2017). Adsorption/desorption of explosives on Ni-, Co-, and NiCo-carbon composites: Application in solid phase extraction. Colloids and Surfaces A: Physicochemical and Engineering Aspects, 529, 950-958
- Octyl coated cobalt-ferrite/silica core-shell nanoparticles for ultrasonic assisted-magnetic solid-phase extraction and speciation of trace amount of chromium in water samples. Microchem. J.. 2020;154:104530
- [Google Scholar]
- Metal-organic framework MIL101 (Cr)-NH2 functionalized magnetic graphene oxide for ultrasonic-assisted magnetic solid phase extraction of neonicotinoid insecticides from fruit and water samples. Talanta. 2020;121120
- [Google Scholar]
- Adsorptive removal of Safranin-O dye from aqueous medium using coconut coir and its acid-treated forms: adsorption study, scale-up design, MPR and GA-ANN modeling. Sustain. Chem. Pharm.. 2021;19:100374
- [Google Scholar]
- Application of response surface methodology (RSM) in optimisation of fluoride removal by magnetic chitosan/graphene oxide composite: Kinetics and isotherm study. Int. J. Environ. Anal. Chem. 2021:1-19.
- [Google Scholar]
- Fabrication of the monolithic fiber for the solid phase micro-extraction of Malachite Green. J. Chin. Chem. Soc.. 2015;62(4):305-310.
- [Google Scholar]
- Experimental design for the optimization of paraquat removal from aqueous media using a fixed-bed column packed with Pinus Eldarica stalks activated carbon. Chemosphere. 2022;291:132670
- [Google Scholar]
- Co-Fe-layered double hydroxide decorated amino-functionalized zirconium terephthalate metal-organic framework for removal of organic dyes from water samples. Spectrochim. Acta Part A: Mol. Biomol. Spectrosc.. 2020;234:118270
- [Google Scholar]
- Magnetic nanoadsorbents’ potential route for heavy metals removal—a review. Environ. Sci. Pollut. Res. 2020:1-15.
- [Google Scholar]
- Quantitative determination of methylene blue in environmental samples by solid-phase extraction and ultra-performance liquid chromatography-tandem mass spectrometry: a green approach. RSC Adv.. 2014;4(64):34037-34044.
- [Google Scholar]
- Synthesis of MPTS-modified cobalt ferrite nanoparticles and their adsorption properties in relation to Au (III) J. Colloid Interface Sci.. 2009;338(2):359-365.
- [Google Scholar]
- Fabrication of CoFe2O4–graphene nanocomposite and its application in the magnetic solid phase extraction of sulfonamides from milk samples. Talanta. 2015;144:1279-1286.
- [Google Scholar]
- Enhanced adsorption/extraction of bisphenols by pyrrolic N-based 3D magnetic carbon nanocomposites for effervescence-assisted solid-phase microextraction of bisphenols from juices and the underlying interaction mechanisms. Chem. Eng. J.. 2022;448:137690
- [Google Scholar]
- Determination of rare earth elements by inductively coupled plasma-mass spectrometry after dispersive solid phase extraction with novel oxidized graphene oxide and optimization with response surface methodology and central composite design. Microchem. J.. 2020;152:104428
- [Google Scholar]
- Ultrasound assisted extraction of Maxilon Red GRL dye from water samples using cobalt ferrite nanoparticles loaded on activated carbon as sorbent: optimization and modeling. Ultrason. Sonochem.. 2017;38:672-680.
- [Google Scholar]
- Simultaneous determination of some basic dyes using p-tetranitrocalix [4] arene-appended silica-based HPLC column. Anal. Methods. 2014;6(18):7318-7323.
- [Google Scholar]
- Fabrication of polyethyleneimine modified cobalt ferrite as a new magnetic sorbent for the micro-solid phase extraction of tartrazine from food and water samples. J. Colloid Interface Sci.. 2018;531:343-351.
- [Google Scholar]
- Overview of nanosorbents used in solid phase extraction techniques for the monitoring of emerging organic contaminants in water and wastewater samples. Trends Environ. Anal. Chem. 2020e00081
- [Google Scholar]
- Magnetic solid-phase extraction of bisphenol A from water samples using nanostructured material based on graphene with few layers and cobalt ferrite. Microchem. J.. 2022;181:107741
- [Google Scholar]
- Adsorption of Rhodamine B dye from aqueous solution onto acid treated banana peel: response surface methodology, kinetics and isotherm studies. PLoS One. 2019;14(5):e0216878.
- [Google Scholar]
- Recent advances in porphyrin-based nanocomposites for effective targeted imaging and therapy. Biomaterials. 2020;232:119707
- [Google Scholar]
- Application of response surface methodology for air assisted-dispersive liquid-liquid microextraction of deoxynivalenol in rice samples prior to HPLC-DAD analysis and comparison with solid phase extraction cleanup. Talanta. 2017;165:27-32.
- [Google Scholar]
- Surfacted ferrofluid based dispersive solid phase extraction; a novel approach to preconcentration of cationic dye in shrimp and water samples. Food Chem.. 2015;185:398-404.
- [Google Scholar]
- Synthesis of Schiff's base magnetic crosslinked chitosan-glyoxal/ZnO/Fe3O4 nanoparticles for enhanced adsorption of organic dye: modeling and mechanism study. Sustain. Chem. Pharm.. 2021;20:100379
- [Google Scholar]
- Hybridization of commercial polymeric microparticles and magnetic nanoparticles for the dispersive micro-solid phase extraction of nitroaromatic hydrocarbons from water. J. Chromatogr. A. 2013;1271(1):50-55.
- [Google Scholar]
- Rotating disk sorbent extraction for pre-concentration of chromogenic organic compounds and direct determination by solid phase spectrophotometry. Anal. Chim. Acta. 2011;695(1–2):73-76.
- [Google Scholar]
- Dispersive solid-phase extraction based on oleic acid-coated magnetic nanoparticles followed by gas chromatography–mass spectrometry for UV-filter determination in water samples. J. Chromatogr. A. 2011;1218(18):2467-2475.
- [Google Scholar]
- Polyaniline-based adsorbents for aqueous pollutants removal: a review. Chem. Eng. J.. 2021;418:129425
- [Google Scholar]
- Preparation and application of meso-adsorbent NiFe2O4 for the ultrasound-enhanced removal of dye pollutant in water and wastewater: a multivariate study. J. Part. Sci. Technol.. 2020;6(2):103-111.
- [Google Scholar]
- Adsorption properties of Danthron-impregnated carbon nanotubes and their usage for solid phase extraction of heavy metal ions. Colloids Surf. A Physicochem. Eng. Asp.. 2022;641:128528
- [Google Scholar]
- In-situ hydrothermal synthesis of CNT decorated by nano ZnS/CuO for simultaneous removal of acid food dyes from binary water samples. Sci. Rep.. 2022;12(1):1-20.
- [Google Scholar]
- Ultrasound assisted solid phase extraction of methylene blue dye by MgSiO3 nanoparticles through central composite design. Int. J. Environ. Anal. Chem. 2022:1-21.
- [Google Scholar]
- Magnetic-nanoparticle-based dispersive micro-solid phase extraction for the determination of crystal violet in environmental water samples. ChemistrySelect. 2021;6(19):4782-4790.
- [Google Scholar]
- Optimising zero-valent iron from industrial waste using a modified air-Fenton system to treat cutting oil wastewater using response surface methodology. Arab. J. Chem.. 2022;15(11):104213
- [Google Scholar]
- Solid-phase microextraction based on nickel-foam@ polydopamine followed by ion mobility spectrometry for on-site detection of Sudan dyes in tomato sauce and hot-pot sample. Talanta. 2020;207:120244
- [Google Scholar]
- Spinel-based oxide cathode used for high temperature CO2/H2O co-electrolysis. Solid State Ion.. 2019;329:46-51.
- [Google Scholar]
- Simultaneous determination of malachite green, crystal violet, methylene blue and the metabolite residues in aquatic products by ultra-performance liquid chromatography with electrospray ionization tandem mass spectrometry. J. Chromatogr. Sci.. 2012;50(7):591-597.
- [Google Scholar]
- A comprehensive systematic review and meta-analysis on the extraction of pesticide by various solid phase-based separation methods: a case study of malathion. Int. J. Environ. Anal. Chem.. 2023;103(5):1068-1085.
- [Google Scholar]
- Effectiveness of Plantago major extract as a natural coagulant in removal of Reactive Blue 19 dye from wastewater. Int. J. Environ. Sci. Technol.. 2019;16(12):7893-7900.
- [Google Scholar]
- Adsorption of methylene blue from aqueous solution onto activated carbons developed from eucalyptus bark and Crataegus oxyacantha core. Water Sci. Technol.. 2016;74(9):2021-2035.
- [Google Scholar]
Appendix A
Supplementary material
Supplementary data to this article can be found online at https://doi.org/10.1016/j.arabjc.2023.104868.
Appendix A
Supplementary material
The following are the Supplementary data to this article:Supplementary data 1
Supplementary data 1


