

Translate this page into:
Dynamic variations in the chemical constituents of Tiebangchui stir-fried with Zanba by integrating UPLC-Q-TOF-MS based metabolomics and DESI-MSI
⁎Corresponding authors at: State Key Laboratory of Southwestern Chinese Medicine Resources, School of Ethnic Medicine, Chengdu University of Traditional Chinese Medicine, No.1166 Liutai Avenue, Chengdu 611137, China. liuyue2@cdutcm.edu.cn (Yue Liu), zhangyi@cdutcm.edu.cn (Yi Zhang)
-
Received: ,
Accepted: ,
This article was originally published by Elsevier and was migrated to Scientific Scholar after the change of Publisher.
Peer review under responsibility of King Saud University.
Abstract
Abstract
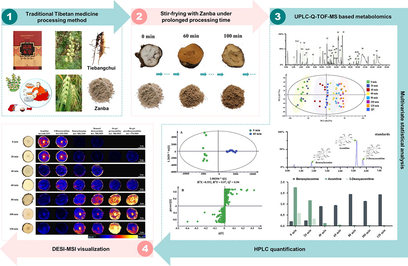
Tiebangchui, which mainly originates from the dried root of Aconitum pendulum Busch, is an important traditional Tibetan medicine and has long been used for the treatment of various types of cold and pain. However, the excellent pharmacological activities of Tiebangchui are accompanied by high toxicity caused by Aconitum alkaloids. To ensure clinical medication safety, Tiebangchui is only used after processing. Stir-frying with Zanba is an effective and unique processing method in traditional Tibetan medicine, but chemical variations in raw and processed Tiebangchui are rarely reported. In this study, an integrated method combining ultra-high-performance liquid chromatography-quadrupole time-of-flight mass spectrometry (UPLC-Q-TOF-MS) and desorption electrospray ionization mass spectrometry imaging (DESI-MSI) was applied to explore chemical constituent variations, transformation mechanisms, and in situ spatial distributions of metabolites in raw Tiebangchui and its series of processed products. Three important diterpenoid alkaloids were quantified by HPLC. Results revealed visible differences between raw Tiebangchui and its Zanba stir-fried products, and 60 min was demonstrated to be the proper processing time. A total of 64 components were detected, and 32 of them were considered as metabolic markers to distinguish raw Tiebangchui and its processed products stir-fried for different time. Chemical changes were also visualized by DESI-MSI: the contents of aconitine and 3-deoxyaconitine significantly decreased, and those of benzoylaconine, benzoyldeoxyaconine, 16-epi-pyrodeoxyaconitine, and 16-epi-pyroaconitine markedly increased. Transformations from diester-diterpenoid alkaloids to monoester-diterpenoid alkaloids through hydrolysis and pyrolysis were found to be the major detoxication processes during Zanba stir-frying. In summary, UPLC-Q-TOF-MS based metabolomics, DESI-MSI, and quantitative combined approach could be an efficient method to characterize chemical variations in Tiebangchui and its Zanba processed products with different stir-frying time. The wide application of this method would contribute to the process monitoring and safe control of Tiebangchui and other toxic Aconitum medicine.
Keywords
Tiebangchui
Aconitum alkaloids
Stir-frying
UPLC-Q-TOF-MS
DESI-MSI

1 Introduction
Tiebangchui (TBC), which mainly consists of the dried roots of Aconitum pendulum Busch (Fam. Ranunculaceae), is a famous Tibetan medicine (TM) over thousands of years. TBC was initially documented in the classic TM literatures “Four Medical Tantra” (Yutuo 2005). “Jing Zhu Materia Medica” and “Lan Liu Li” also detailed its botanical origins, main efficacies and functions, usage, and dosage (Disi 2012; Dimaer 1982). TBC has long been used to treat fever, arthritis, and traumatic injury in the form of various prescriptions, such as Wuwei shexiang pill, Jiuwei hezi pulvis, and Bawei chenxiang pulvis, owing to its outstanding pharmacological activities in expelling cold, relieving pain, dispelling wind, and calming shock (Li et al., 2022; Feng et al., 2023). However, “Jing Zhu Materia Medica” and recent studies indicate that raw TBC has high toxicities, including cardiotoxicity, neurotoxicity, and gastrointestinal toxicity (Dimaer 1982; Zhang 1981; Zhao et al., 2018). Therefore, TBC is only used internally after processing to ensure the clinical safety.
About hundreds of chemical constituents were isolated and identified from TBC, and the primary components are Aconitum alkaloids (Li et al., 2022). C19-diterpenoid alkaloids are the most abundant and are categorized as follows based on the substituting groups of the diterpenoid alkaloid framework (Fig. 1): high-toxic diester-diterpenoid alkaloids (DDAs), moderate-toxic monoester-diterpenoid alkaloids (MDAs) and lipo-diterpenoid alkaloids (LDAs), and non-toxic non-esterified diterpene alkaloids (NDAs) (Wang et al., 2010).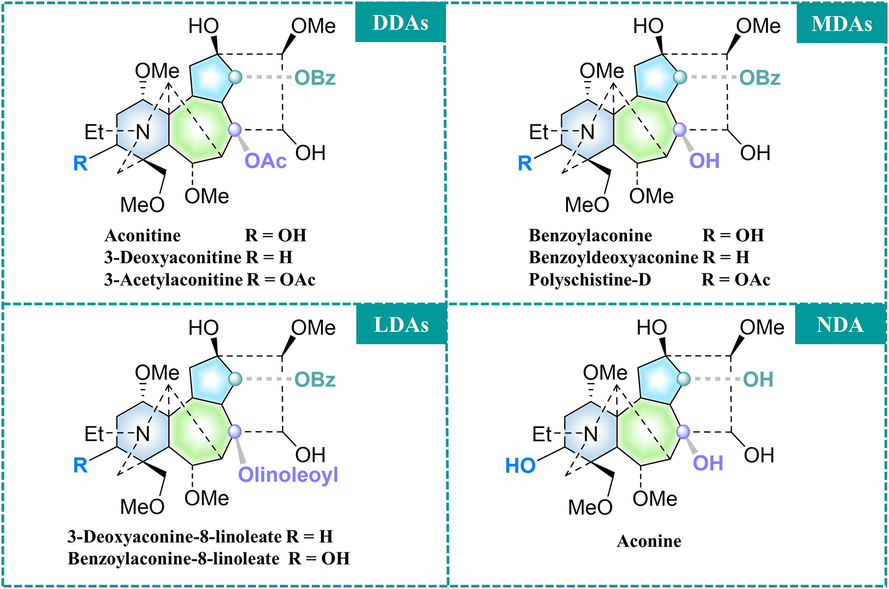
Main C19-diterpenoid alkaloids of TBC.
Paozhi is an essential processing method used to attenuate toxicity and retain efficacy for the safe use of toxic medicines (Xue et al., 2022). According to ancient literatures and modern studies, heating is one of the effective processing methods for TBC, and highly toxic DDAs can be hydrolyzed, pyrolyzed, esterificated and transesterificated into MDAs with low toxicities and then into non-toxic NDAs by extending the heating time (Wang et al., 2010; Liu et al., 2022; He et al., 2022; Qiu et al., 2021). Esterification is reversible during continuous heating, and the contents of DDAs and MDAs are in a dynamic conversion process (Liu et al., 2022; Zhou et al., 2015). As Aconitum alkaloids are toxic and therapeutic components of TBC, efficacy preservation should be ensured during toxicity attenuation; as such, time monitoring and processing control are crucial.
Zanba, powder of highland barley (Hordeum vulgare L. var. nudum Hook. f), is an important grain for people in the Qinghai-Tibet Plateau and a processing excipient to attenuate toxicity and preserve efficacy of TBC. According to “Processing Specification of Tibetan Medicine of Qinghai Province (2010)” (Qinghai Medical Products Administration, 2010), processing is described as follows: raw TBC stir-fries with Zanba until Zanba turns to yellow, removal of Zanba, and air drying of TBC. However, the specific processing parameters are not yet clear. Our research group have previously optimized the processing parameters, including the optimal slice thickness of TBC, the amount of Zanba, the processing temperatures, and the processing time based on CRITIC combined with Box-Behnken response surface method. Finally, the optimal processing parameters were set as follows: the slice thickness of TBC is 2 cm, the amount of Zanba is three times to raw TBC, the processing temperature is 125 °C, and the processing time is 60 min. However, the mechanism for the toxicity attenuation and efficacy reservation of Zanba processed TBC, especially chemical variations with the expending processing time, still remains unknown. Therefore, an unambiguous strategy should be developed to reveal changes in the chemical compositions of TBC during stir-fried with Zanba.
Ultra-performance liquid chromatography-quadrupole-time-of-flight-mass spectrometry (UPLC-Q-TOF-MS) is a metabolomics platform that has high sensitivity, selectivity, and excellent separation performance that can be applied to rapid and simultaneous qualitative analysis of multiple compounds. UPLC-Q-TOF-MS based metabolomics has been increasingly applied to the chemical constituent investigations, quality control, and of chemical transformations during processing of herbal medicines (Xie et al., 2022; Fan et al., 2022). Mass spectrometry imaging (MSI) is a powerful technology used to visualize the spatial and temporal distribution of chemical constituents in tissue sections without performing any tagging or labeling chemistry (Huang et al., 2022). Ionization methods including desorption electrospray ionization (DESI), secondary ion mass spectrometer (SIMS), and matrix-assisted laser desorption/ionization (MALDI) are commonly applied for MSI (Beng et al., 2021; Li et al. 2023). DESI-MSI allows 2D chemical imaging in the atmosphere with minimal or no pre-treatment steps and is becoming a well-accepted method for the phytochemical analysis and characterization (Tong et al., 2022).
In this study, UPLC-Q-TOF-MS based metabolomics and DESI-MSI together with HPLC quantification were integrally used to investigate dynamic chemical variations in TBC stir-fried with Zanba under prolonged processing time. Stir-frying times from 0 min to 120 min with every 20 min intervals were set as the only variable, and other processing parameters are consistent with the optimal processing technology according to the previous results by our research group. The results are expected to reveal the chemical mechanism of toxicity attenuation and efficacy preservation of TBC stir-fried with Zanba.
2 Materials and methods
2.1 Chemical reagents and materials
LC-MS-grade acetonitrile and methanol were purchased from Fisher Chemicals (Pittsburg, USA). Formic acid was obtained from Chengdu Kelong Chemical Co., Ltd. (Chengdu, China). Acetic acid and triethylamine of HPLC-grade were acquired from Chengdu Chron Chemical Co., Ltd. (Chengdu, China). Deionized water used throughout the experiment was purchased from Watsons (Watsons Water, Beijing, China). Other reagents were of analytical grade. Reference standards reference standards (HPLC greater than 98%) of aconitine, 3-acetylaconitine, 3-deoxyaconitine, benzoylaconine, benzoylhypacoitine, benzoylmesaconine, aconine, 12-epi-napelline, and neoline were purchased from PUSH Biotechnology Co., Ltd. (Chengdu, China); hypaconitine and mesaconitine were purchased from Sichuan Victory Biological Technology Co., Ltd. (Chengdu, China); fuziline was purchased from Lookchem Pharmaceutical Technology Co., Ltd. (Chengdu, China); and yunaconitine (DSTDB005502) was purchased from Desite Biotechnology Co., Ltd. (Chengdu, China).
2.2 Preparation of Zanba stir-fried TBC
TBC was collected in October 2021 from Huzhu Tu Autonomous County, Haidong City, Qinghai Province and authenticated by Prof. Yi Zhang of School of Ethnic Medicine, Chengdu University of Traditional Chinese Medicine (Chengdu, China). Dried TBC (200 g) samples were cut into homogeneous pieces (2 cm) and randomly divided into seven groups, and one of which was selected as raw TBC (without stir-frying with Zanba, 0 min). The rest of the samples (180 g) were placed into a frying pan and stir-fried with 540 g of Zanba at 125 °C (1:3 of raw TBC to Zanba according to the previous results of our research group). About 30 g of TBC was collected at 20, 40, 60, 80, 100, and 120 min. The procedure was repeated by a total of nine times. All the samples were smashed using a pulverizing machine, and the powder was filtered with No. 4 sieve of Chinese Pharmacopoeia for the flowing analysis.
2.3 UPLC-Q-TOF-MS analysis
2.3.1 Sample preparation
Raw TBC powder (0.25 g) was ultrasonically extracted with 25 mL of methanol at 25 °C for 30 min (300 w, 40 kHz). The sample was added with methanol to compensate for weight lost during extraction. After centrifugation (13000 rpm) for 5 min, the supernatant was collected and filtered through a 0.22 μm membrane filter. The processed TBC sample preparation was the same for the raw TBC sample.
2.3.2 Standard solution preparation
Each reference standard was dissolved in methanol at a concentration of 1 mg/mL as a stock solution. The solution was mixed and diluted with methanol to prepare a mixed reference solution (10 µg/mL for each compound). The mixed reference solution was centrifuged at 13,000 rpm for 10 min, and the supernatant was stored at 4 °C before analysis.
2.3.3 Liquid chromatographic conditions
UPLC-Q-TOF-MS data were obtained using the Waters ACQUITY UPLC® and SYNAPTTM HDMSTM systems (Waters Corporation, Milford, USA) equipped with an electrospray ion source and hybrid quadrupole-time-of-flight (Q-TOF) mass spectrometer with the MSE model. The chromatographic column was ACQUITY UPLC BEH C18 Column (2.1 mm × 50 mm, 1.7 μm). The mobile phase of the eluent consisted of 0.1% formic acid in water (A) and acetonitrile (B), and the flow rate was 0.3 mL/min. The column temperature was 35 °C. The gradient elution program was set as follows: 0–1 min, 2%–7% B; 1–3 min, 7%–11% B; 3–8 min, 11%–15% B; 8–13 min, 15%–30% B; 13–16 min, 30%–36% B; 16–20 min, 36%–70% B; 20–26 min, 70%–85% B; 26–27 min, 85%–85% B. Two microliters of the sample solution and the standard solution were injected into the UPLC-Q-TOF-MS system for analysis.
2.3.4 MS spectrometry conditions
Full-scan data were acquired in positive ion mode from 100 Da to 1200 Da with a 0.3 s scan time by using a capillary voltage of 2000 V, desolvation temperature of 450 °C, sample cone voltage of 40 V, extraction cone voltage of 4 V, source temperature of 150 °C, cone gas flow of 50 L/h, and desolvation gas flow of 800 L/h. The mass spectrometer was calibrated across the mass range of 100–1200 Da by using sodium formate solution. Data were centroided, and mass was corrected during acquisition using an external reference (Lock-SprayTM) consisting of 0.2 ng/mL leucine enkephalin infused at a flow rate of 10 μL/min via a lockspray interface, generating a reference ion at 556.2766 Da ([M + H]+). The lockspray scan time was set at 0.3 s with the interval of 30 s, and data were averaged over three scans.
2.3.5 Data analysis
MS raw data files were imported into Progenesis QI (Waters, Milford, USA) to conduct peak recognition, peak alignment, baseline correction, deconvolution, and normalization. A compounds database containing relative molecular mass, molecular formula, CAS number, and the mol. file of the compounds, which have been reported in the Aconitum genus, was established by searching the relative literature and websites (CNKI, ChemSpider, Web of Science, PubMed, SciFinder, etc.). Besides, a database of 13 reference substances including aconitine, 3-deoxyaconitine, benzoylmesaconine, 12-epi-napelline, neoline, benzoylaconine, 3-acetylaconitine, fuziline, aconine, hypaconitine, mesaconitine, benzoylhypacoitine, and yunaconitine, has also been established. Then, the databases were imported into the UNIFI platform attached to Waters ACQUITY UPLC® and SYNAPTTM HDMSTM systems for matching of target compounds. The compounds were firstly identified through reference substances database, while compounds without controls were referred to the aforementioned compounds database and published literatures with the following parameters: mass error was within 5 ppm, retention time, accurate m/z, and MS/MS data. A three-dimensional data matrix containing retention time, exact mass (m/z), and intensity of peak was obtained. The resultant data matrices were fed into SIMCA-P 14.1 (Umetrics, Umea, Sweden) for principal component analysis (PCA), partial least-squares-discriminant analysis (PLS-DA), and orthogonal projection to latent structures discriminant analysis (OPLS-DA).
2.4 DESI-MSI analysis
Raw and processed TBC samples stir-fried with Zanba for different time were sliced into 5 mm cross-sectional thickness. All the samples were fixed on glass slides for DESI-MSI analysis. A Waters Synapt XS HDMS Q-TOF mass spectrometer equipped with a DESI source (Waters Corporation, Milford, USA) was used for imaging. The DESI parameters were as follows: positive ionization mode; spray solvent consisting of 90% MeOH, 10% H2O, 0.1% formic acid, and 0.1% leucine enkephalin (LE) delivered at 2 μL/min; capillary voltage of 3.0 kV; and mass range of 100–1500. High-definition image (HDI) v1.5 software (Waters Corporation, Milford, MA, United States) was used to visualize images with LE as the lock mass (m/z 556.2766) for MS resolution.
2.5 HPLC analysis
2.5.1 Sample preparation
About 2.0 g of raw TBC powder was ultrasonically extracted with 3 mL of ammonia test solution and 50 mL of ethyl acetate-isopropanol (1:1, v/v) for 30 min. The extraction solvent was used to compensate for the weight lost during extraction. The filtrate (25 mL) was accurately measured and evaporated under reduced pressure to dryness at 40 °C. The residue was dissolved in 3 mL of 0.05 M hydrochloric acid–methanol solution. The solution was centrifuged at 12000 rpm for 10 min at 4 °C, and the supernatant was used as the sample solution. In brief, 2 µL of the solution was injected into UPLC-PDA system for analysis. Aconitine, 3-deoxyaconitine, and benzoylaconine reference standards were dissolved in 0.05 M hydrochloric acid–methanol solution to prepare a stock solution with a concentration of 1 mg/mL. The stock solution was mixed and diluted with 0.05 M hydrochloric acid–methanol solution to obtain the mixed reference solution containing aconitine, 3-deoxyaconitine, and benzoylaconine with concentrations of 0.56, 0.18, and 0.06 mg/mL, respectively. The mixed reference solution was stored at 4 °C. Two microliters of the mixed reference solution were injected into the UPLC-PDA system for detection.
2.5.2 Liquid chromatographic conditions
HPLC analysis was conducted on Waters ACQUITY UPLC® and systems (Waters Corporation, Milford, USA) equipped with Binary Solvent Manager, Sample Manager FTN-1, and PDA eλ Detector. The column was ACQUITY UPLC BEH C18 Column (2.1 mm × 50 mm, 1.7 μm). The mobile phase consisted of 0.2% glacial acetic acid aqueous solution (solvent A, pH adjusted to 6.5 by adding triethylamine) and acetonitrile (solvent B) using the following gradient: 21%–29% B for 0–3 min and 29%–35% B for 3–7 min. The flow rate was kept at 0.4 mL/min, and the injection volume was 2 μL. The column temperature was set at 30 °C, and the UV detection wavelength was set at 235 nm.
2.5.3 Method validation
Linearity, precision, repeatability, stability, and recovery were studied to validate the quantitative method. Calibration curves were established by plotting the peak area (y) of aconitine, 3-deoxyaconitine, and benzoylaconine to their six corresponding different concentrations (x). Six replicates of the TBC sample solution were prepared to evaluate repeatability. The mixed reference solution was run six times to investigate precision. The sample solution placed at 25 °C was analyzed at 0, 4, 8, 12, 24, and 48 h for stability testing. Recovery was determined by investigating spiked samples. A known amount of the standards was added to the sample solution in triplicate, followed by extraction and analysis based on the established procedures. Relative standard deviation (RSD) was used to evaluate method repeatability, precision, stability, and recovery.
3 Results
3.1 Identification of metabolites accumulated in raw TBC and processed products
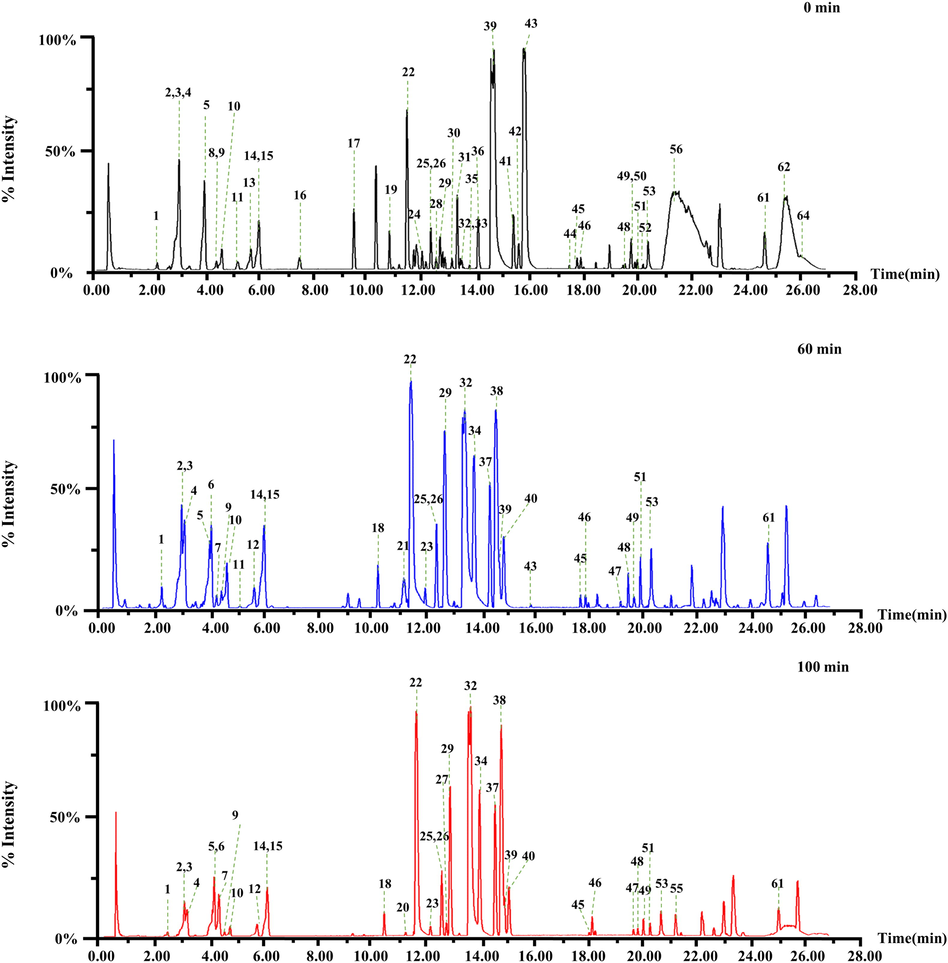
With increasing stir-frying time, the color of TBC and Zanba gradually darkened (Fig. 2). Toxic and active components of raw and Zanba stir-fried TBC were observed. A total of 64 compounds were detected in raw TBC and stir-fried samples for different time points (Table 1, Fig. 3 and Supplementary Fig. S1), of which 40 compounds, including 36 C19-diterpenoid alkaloids (14 DDAs, 18 MDAs and 4 NDAs), three C20-diterpenoid alkaloids, and one other alkaloid were identified from the raw mass spectrometry data of TBC. Seven chemical compounds were definitively identified by the corresponding reference substances. Other compounds were putatively identified using Aconitum compounds database, published literatures, online databases such as SciFinder (https://scifinder.cas.org/) and by comparing accurate mass weight, characteristic fragment, cleavage pathway, and retention time. *: The components confirmed by comparison with the reference standards; #: Metabolic markers between raw TBC and stir-fried for 60 min. △: Metabolic markers between stir-fried for 60 min and 100 min;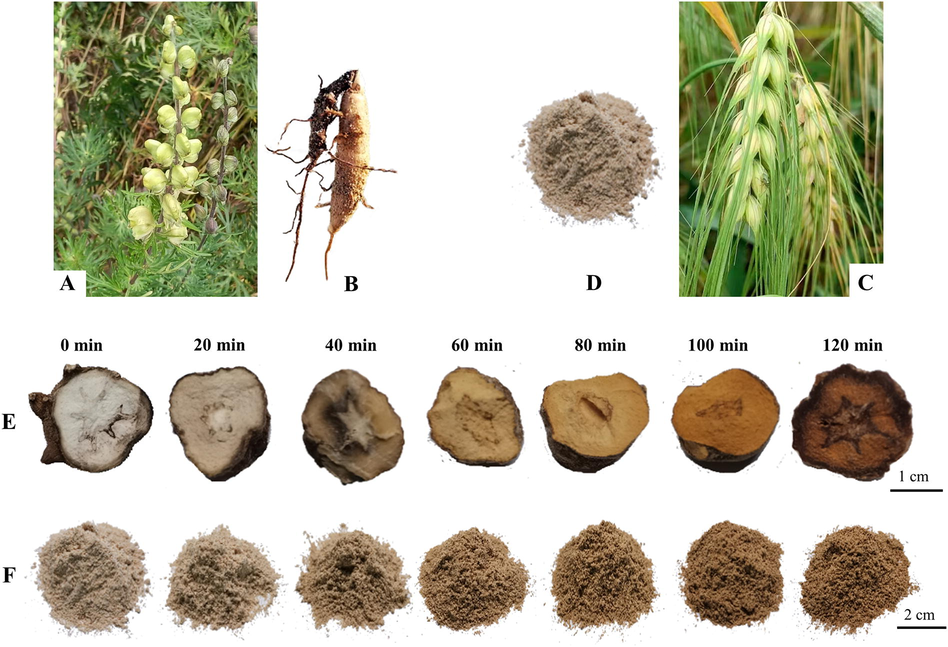
The original plants of (A) A. pendulum in their natural habitats and (B) the fresh roots; (C) the original plants of Hordeum vulgare L. var. nudum Hook. f and (D) powder of the seeds (Zanba); (E) TBC stir-fried with Zanba for different time points and (F) the corresponding Zanba.
No.
tR (min)
Molecular formula
[M + H]+
MSE fragmentation
Identification
Mass error (ppm)
Ref.
Measured (m/z)
1#,△
2.24
C23H37NO6
424.2699
406.2587, 388.2479, 378.2629, 370.2390, 356.2219
Senbusine A
−0.9
(Yan et al., 2010; Ye et al., 2021)
2#,△,*
2.95
C25H41NO9
500.2860
482.2755, 468.2591, 450.2491, 432.2395, 418.2228
Aconine
1.0
(Yang et al., 2014; Qin et al., 2016)
3△
2.96
C22H31NO3
358.2382
340.2271, 322.2185, 312.1966, 310.1813
Songorine
1.1
(Yan et al., 2010; Yang et al., 2014; Zhang et al., 2012; Sun et al., 2012)
4#,△,*
3.05
C22H33NO3
360.2539
342.2429, 324.2325
12-epi-napelline
1.9
(Zhang et al., 2006; Dai et al., 2023)
5#,△,*
3.99
C24H39NO6
438.2856
420.2744, 406.2585, 402.2644, 388.2472, 384.2530
Neoline
2.7
(Yan et al., 2010)
6#,△
4.04
C25H39NO8
482.2754
450.2484, 432.2381, 420.2743, 388.2479, 374.2311
18-Demethylpubescenine
−0.8
(Lei et al., 2021)
7#,△
4.21
C20H24NO4
342.1693
324.1978
Fuzitine
0.6
(Lei et al., 2021; Zhang et al., 2016; Zhang et al., 2012)
8△
4.40
C25H41NO8
484.2910
452.2642, 434.2535, 420.2347, 402.2274, 384.2151
Pseudoaconine
1.7
(Xu et al., 2015)
9#,△
4.44
C26H41NO8
496.2910
478.2769, 464.2644, 460.2692, 432.2383, 428.2431
8-Acetyl-15-hydroxy-neoline
1.8
(Lei et al., 2021; Sun et al., 2012)
10
4.63
C26H37NO7
476.2648
444.2375, 426.2284, 412.2123
Unknown
1.0
–
11
5.22
C24H44N4O4
453.3441
435.3332
Unknown
1.1
–
12△
5.58
C25H39NO7
466.2805
434.2529, 418.2600, 406.2576, 342.1700, 327.1465
14-O-Acetylsenbusine A
−0.1
(Lei et al., 2021)
13#
5.71
C26H41NO8
496.2910
478.2799, 436.2696+, 418.2588, 404.2441, 386.2335
14-O-Acetyldelectinine
0.0
(Lei et al., 2021)
14#,△
5.91
C24H35NO4
402.2644
384.2531, 324.2321, 306.2234
Lucidusculine
1.0
(Wada et al., 1994)
15#,△
6.01
C26H41NO7
480.2961
462.2856, 448.2698, 430.2592, 416,2439, 398.2326
14-Acetylneoline
0.6
(Yang et al., 2014; Yan et al., 2010)
16
7.52
C29H59NO9
566.4268
548.4148, 534.5408
Unknown
3.5
–
17
9.52
C18H33N3O3
340.2600
661.5002, 435.3332
Unknown
0.0
–
18
10.27
C13H34N5O5
340.2560
661.4911
Unknown
−0.5
–
19
10.83
C24H44N4O4
453.3441
887.6743
Unknown
0.9
–
20△
11.07
C31H41NO8
556.2910
538.2777, 524.2642, 506.2533, 492.2381, 474.2263
Pyrohypaconitine
0.0
(Xu et al., 2015; Dai et al., 2023; Ren et al., 2023)
21△
11.22
C32H43NO10
602.2965
570.2701, 552.2606
N-demethylhypaconitine
−0.3
(Lei et al., 2021)
22#,△,*
11.49
C32H45NO10
604.3122
586.3013, 572.2854, 568.2904, 554.2749, 482.2792
Benzoylaconine
1.7
(Yan et al., 2010; Yang et al., 2014)
23
12.01
C32H45NO9
588.3173
570.2870, 556.2939, 538.2796
Unknown
−1.2
–
24
12.05
C31H42NO11
604.2758
586.2667, 544.2542, 526.2438, 508.2430
Unknown
0.8
–
25
12.37
C32H43NO9
586.3016
568.2906, 554.2750
14-Benzoyl-16-ketoneoline
−0.5
(Xu et al., 2015)
26#,△
12.38
C34H47NO11
646.3227
614.2935, 596.2902, 586.3001, 568.2902, 536.2634
Karaconitine
−0.5
(Lei et al., 2021)
27△
12.55
C31H41NO9
572.2860
554.2795, 540.2648, 522.2487
Pyromesaconitine
−0.7
(Yan et al., 2010)
28
12.57
C36H51NO12
690.3490
658.3184, 640.3088
Pseudaconitine
−0.3
(Rahman et al., 2000)
29#,△
12.71
C32H45NO9
588.3173
556.2904, 492.2383, 434.2561, 416.2469, 402.2273
Benzoyldeoxyaconine
2.9
(Yang et al., 2014; Huang et al., 2015)
30#
13.15
C32H43NO11
618.2914
600.3190, 586.3007, 558.2704, 554.2795
N-demethylmesacontine
0.0
(Lei et al., 2021; Zhi et al., 2020)
31
13.35
C31H41NO10
588.2809
570.2701, 528.2632, 510.2514
Palyschistine C
0.5
(Wang et al., 1985)
32#,△
13.47
C32H43NO9
586.3016
568.2901, 554.2747, 536.2642, 522.2485, 504.2380
16-epi-pyroaconitine
4.6
(Wang et al., 2010)
33△
13.52
C34H47NO12
662.3177
630.2941, 602.2958, 420.2375
Aconifine
0.3
(Yang et al., 2014; Wang et al., 2017)
34#,△
13.73
C32H43NO9
586.3016
568.2893, 554.2713, 536.2656
Dehydrated benzoylaconine
−1.5
(Lei et al., 2021)
35
13.80
C32H43NO8
570.3067
552.2606, 538.2796, 506.2543
Dehydrated benzoyldeoxyaconine
0.4
(Lei et al., 2021)
36#,△
14.13
C32H43NO10
602.2965
542.2746, 526.2780, 510.2481, 482.2726, 478.2224
N-deethyldeoxyaconitine
0.7
(Yang et al., 2014; Tian et al., 2022)
37△
14.28
C34H45NO10
628.3122
596.2834, 568.2893, 536.2656, 504.2379
Anhydroaconitine
−1.6
(Xu et al., 2015)
38#,△
14.49
C32H43NO8
570.3067
538.2800, 506.2539, 474.2277, 416.2448, 384.2177
16-epi-pyrodeoxyaconitine
3.7
(Wang et al., 2010)
39#,△,*
14.71
C34H47NO11
646.3227
614.2958, 596.2852, 586.3011, 554.2749, 536.2643
Aconitine
0.3
(Yang et al., 2014; Sun et al., 2016)
40#,△
14.77
C32H43NO8
570.3067
538.2801, 506.2537, 416.2457
6-O-benzoyleldelidine
−2.3
(Lei et al., 2021)
41#,△,*
15.42
C36H49NO12
688.3333
656.3081, 628.3124, 624.2843, 610.3017, 596.2861
3-Acetylaconitine
0.6
(Lei et al., 2021; Ren et al., 2023)
42
15.63
C34H47NO9
614.3329
582.3051, 550.2762, 522.2840, 490.2582, 458.2314
Chasmaconitine
0.0
(Lei et al., 2021)
43#,△,*
15.83
C34H47NO10
630.3278
598.3009, 580.2900, 566.2742, 552.2939, 538.2800
3-Deoxyaconitine
−0.6
(Xu et al., 2015; Ye et al., 2021)
44
17.50
C36H51NO11
674.3540
642.3289, 624.3152
Szechenyine
0.3
(Sun et al., 1989)
45
17.78
C39H49NO11
708.3384
586.3007
Unknown
−0.6
–
46
17.92
C16H35NO2
274.2746
256.2633, 224.1303
Unknown
−1.8
–
47
19.40
C18H39NO2
302.3059
284.2978
Unknown
0.0
–
48
19.56
C33H45NO4
520.3427
502.3281, 488.2751
Unknown
−4.2
–
49
19.78
C43H16N2O
577.1341
559.0853, 545.3298
Unknown
2.1
–
50
19.78
C50H75NO13
898.5317
866.5458
Unknown
0.7
–
51
20.01
C31H45NO4
496.3427
478.3297, 464.2777
Unknown
−4.2
–
52#
20.23
C50H75NO12
882.5368
864.5238
10-OH-14-benzoylaconine-linoleate
0.6
(Lu et al., 2010)
53
20.41
C14H16N6O2
301.1413
149.0236, 184.0731
Unknown
1.7
–
54
20.55
C14H16N6O2
866.5418
628.3145, 586.3007
Unknown
−0.1
–
55
20.95
C20H43NO2
330.3372
312.3245
Unknown
−1.5
–
56
21.55
C50H75NO11
866.5418
848.5304, 834.5149, 816.5050, 684.5182, 522.2492
14-Benzoylaconine-8-linoleate
0.1
(Zhang et al., 2006)
57
21.67
C50H75NO12
882.5368
866.5458, 586.3007
Unknown
−0.1
–
58
22.20
C50H73NO12
880.5211
866.5458, 586.3007
Unknown
0.9
–
59
24.05
C48H75NO11
842.5418
810.5260, 586.3007, 554.2795
Unknown
0.9
–
60
24.21
C50H75NO10
850.5469
826.5487, 570.3038
Unknown
0.4
–
61
24.72
C18H38NO
284.2953
266.2533, 224.1303
Unknown
−0.7
–
62
25.55
C50H75NO10
850.5469
818.5196, 570.3063, 538.2798, 506.2539, 474.2310
3-Deoxyaconine-8-linoleate
−0.2
(Zhang et al., 2006)
63
25.63
C50H73NO11
864.5262
846.5110, 832.5063
Unknown
0.2
–
64△
26.05
C48H75NO10
826.5469
794.5195, 570.3062, 538.2799, 474.2279, 458.2525
14-Benzoyldeoxyaconine-8-palmitate
−0.1
(Lu et al., 2010)
C19-diterpenoid alkaloids are the major type components of TBC, and the fragmentation pathway was investigated previously (Lei et al., 2021). The neutral losses of H2O (18.0105 Da), MeOH (32.0263 Da), and AcOH (60.0211 Da) were characteristic and diagnostic fragments in positive mode. Compound 39 showed a [M + H]+ ion at m/z 646.3227 in the full-mass spectrum scans (Fig. 4A). A series of characteristic fragments were identified at m/z 614.2958, 596.2852, 586.3011, 554.2749, and 536.2643, corresponding to [M + H–MeOH]+, [M + H–MeOH–H2O]+, [M + H–AcOH]+, [M + H–AcOH–MeOH]+ and [M + H–AcOH–MeOH–H2O]+, respectively, which are assigned to aconitine by comparing with the reference standard. Compound 32 (Fig. 4B) was identified as 16-epi-pyroaconitine with a precursor ion [M + H]+ at m/z 586.3016 and fragment ions at 568.2901 [M + H–H2O]+, 554.2747 [M + H–MeOH]+, 536.2642 [M + H–MeOH–H2O]+, 522.2485 [M + H–2MeOH]+, and 504.2380 [M + H–2MeOH–H2O]+. Finally, a total of 36 C19-diterpenoid alkaloids were tentatively identified based on comparison with the Aconitum compounds database, published literatures, online databases and reference substances.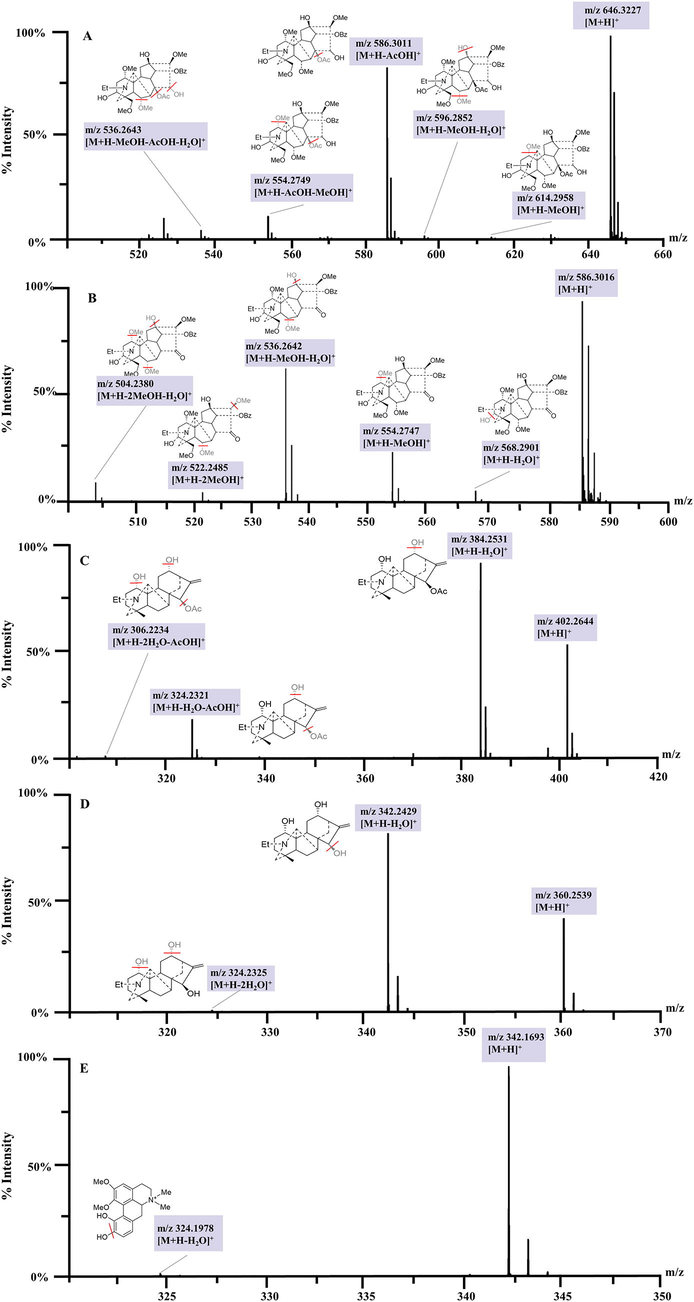
MS/MS spectra of five representative identified compounds (A, compound 39 aconitine; B, compound 32 16-epi-pyroaconitine; C, compound 14 lucidusculine; D, compound 4 12-epi-napelling, E, compound 7 fuzitine).
C20-diterpenoid alkaloids, another major type of constituents of TBC, exhibit satisfactory mass spectrum responses in positive ion mode. Neutral losses of H2O (18.0105 Da) were found in the MS spectra. Compound 14 (Fig. 4C) displayed a [M + H]+ ion at m/z 402.2644. Other fragment ions at m/z 384.2531, 324.2321, and 306.2234 were generated from [M + H–H2O]+, [M + H–H2O–AcOH]+, and [M + H–2H2O–AcOH]+, respectively. Finally, compound 14 was tentatively inferred as lucidusculine by comparing it with a literature report (Wada et al., 1994). Compound 4 (Fig. 4D) was regarded as 12-epi-napelline, which comprised a quasi-molecular ion [M + H]+ at m/z 360.2539 and fragment ions at m/z 342.2429 and 324.2325 for the losses of H2O (Zhang et al., 2016). At last, three C20-diterpenoid alkaloids (compounds 3, 4, 14) were tentatively identified based on comparison with the literature and reference substances.
Compound 7 (Fig. 4E) exhibited a [M + H]+ ion at m/z 342.1693, while the characteristic ion fragment of m/z 324.1978 [M + H–H2O]+. By comparing the accurate mass weight, characteristic fragment, and retention time with the Aconitum compounds database, published literatures, and online databases (Zhang et al., 2016; Zhang et al., 2012), compound 7 was finally identified as fuzitine, known mostly in the form of its salts.
3.2 PCA and PLS-DA of raw and processed TBC with different stir-frying time
PCA and PLS-DA were used to discover chemical variations in raw and Zanba stir-fried TBC at different processing time. Based on the PCA score plots (R2X = 0.604 and Q2 = 0.426) (Fig. 5A), all the samples were separated into four major groups. Raw TBC and Zanba stir-fried TBC for 20 min were highly different from those stir-fried for more than 40 min. Obvious chemical changes were detected between raw and 20 min stir-fried TBC group and those processed more than 40 min. No remarkable variations were found in TBC stir-fried for 60 and 80 min as well as in groups stir-fried for more than 100 min. Hence, component transformations tended to be stable after processing for 60 min. In addition, the PLS-DA result (R2X = 0.346, R2Y = 0.378, and Q2 = 0.32) (Fig. 5B) showed superior separation among raw TBC and those stir-fried for different time points. All the samples were separated into four major clusters, and the samples stir-fried for a longer time were located closer, indicating good agreement with the PCA model. PCA and PLS-DA results preliminarily concluded that the components of TBC changed significantly during the first 40 min of stir-frying, but the variations in TBC components gradually stabilized after 60 min of stir-frying. The 3D score plots of PCA and PLS-DA for raw and Zanba stir-fried TBC with different processing times were shown in Supplementary Fig. S2.
(A) PCA and (B) PLS-DA score plots of raw and Zanba stir-fried TBC for different time points.
3.3 Quantification of main alkaloids in raw and Zanba stir-fried TBC
A rapid HPLC quantification was further developed to investigate changes in the content of major alkaloids (benzoylaconine, aconitine, and 3-deoxyaconitine) of raw and Zanba stir-fried TBC for different times. Linearity, precision, repeatability, stability and recovery tests were studied to validate the HPLC quantification. Supplementary Table S1 presented regression equation, correlation coefficients (r2), linear ranges as well as limits of detection (LOD) and limits of quantification (LOQ) of three alkaloids. All alkaloids showed good linearities (r2 = 1.000) within suitable concentration ranges. The LODs were in the range of 0.02–0.15 µg/mL, while the LOQs were in the range of 0.05–0.38 µg/mL. The RSDs of precision, repeatability, and stability were in the range of 0.02–0.72%, 0.44–1.74%, and 1.37–1.57%, respectively., and the recoveries of three alkaloids ranged from 98.68% to 100.94% (Supplementary Table S2). All these results indicated that the established HPLC method is stable, accurate and feasible.
Table 2 and Supplementary Figs. S3 and S4 showed that the contents of two DDAs continuously decreased with the extended processing time and decreased below 0.02% after 40 min of stir-frying. By contrast, benzoylaconine (MDA), which is considered as one of the active ingredients of TBC, increased and remained over 0.09% after stir-frying for 60 min. Given the lack of limitations of the contents of DDAs and MDAs in the current standard of TBC, the present study referenced the content limitations of Fuzi, another famous and commonly used Chinese medicine from the same genus (A. carmichaelii Debeaux). According to the Chinese Pharmacopeia (CP) (2020 Edition), the MDA contents should not be less than 0.01% and the DDA contents should not be more than 0.02%. Herein, the content of MDAs and DDAs of TBC met the requirements of Fuzi in CP after stir-frying for 40 min and became stable after 60 min. Based on the PCA, PLS-DA, and HPLC results, 60 min was found to be the appropriate Zanba stir-frying time for toxicity attenuation and efficacy reservation of TBC.
Samples
Content of DDAs (mg/g)
Content of MDAs(mg/g)
Proportion of MDAs (%)
Proportion of DDAs (%)
Aconitine
3-Deoxyaconitine
Benzoylaconine
0 min
1.7423
0.5729
0.1979
0.0198
0.2315
ZB 20 min
1.1510
0.3144
0.2347
0.0235
0.1465
ZB 40 min
0.1104
0.0465
0.8829
0.0883
0.0157
ZB 60 min
0.0377
0.0206
0.9258
0.0926
0.0058
ZB 80 min
0.0244
0.0161
1.4342
0.1434
0.0041
ZB 100 min
0.0136
–
1.1180
0.1180
0.0014
ZB 120 min
0.0160
–
1.4208
0.1421
0.0016
3.4 Discovery of stir-frying-associated metabolic markers for the discrimination of raw and processed TBC
To discover the crucial variable constituents of raw TBC and the processed products, OPLS-DA was employed to investigate the metabolic changes between raw TBC and TBC stir-fried with Zanba for 60 min. Moreover, 100 min was selected as another key time point because no obvious changes has been observed for longer processing time. As shown in Fig. 6A and C, raw TBC and TBC stir-fried with Zanba for 60 and 100 min were distinctively separated from each other. The corresponding scatter plot (S-plot) derived from the loading of the OPLS-DA score plot highlighted the variables most responsible for differences among the groups (Fig. 6B and D). The good values of R2X, R2Y, and Q2 evidently supported that the OPLS-DA model obtained satisfactory predictive performance and matrix variance explanation ability. Combining S-plot and the VIP value (VIP greater than 1), a total of 23 potential metabolic markers, including aconine, benzoylaconine, 16-epi-pyrodeoxyaconitine, 3-deoxyaconitine, and aconitine were detected to discriminate raw TBC and those stir-fried for 60 min. Meanwhile, 29 metabolites including 16-epi-pyroaconitine, benzoyldeoxyaconine, and aconifine were used to differentiate TBC stir-fried for 60 and 100 min. A total of 32 metabolic markers to distinguish raw Tiebangchui and its processed products stir-fried for different times were detailed in Table 1 and Fig. 7.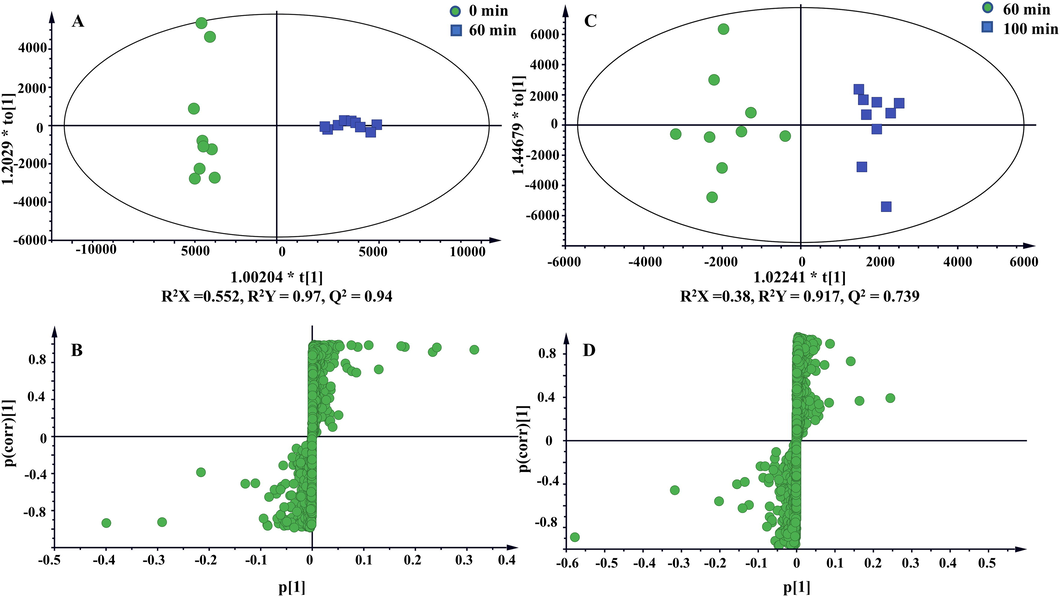
OPLS-DA score plots and S-plots based on raw and processed TBC stir-fried with Zanba for 60 min (A and B), TBC stir-fried with Zanba for 60 min and 100 min (C and D).
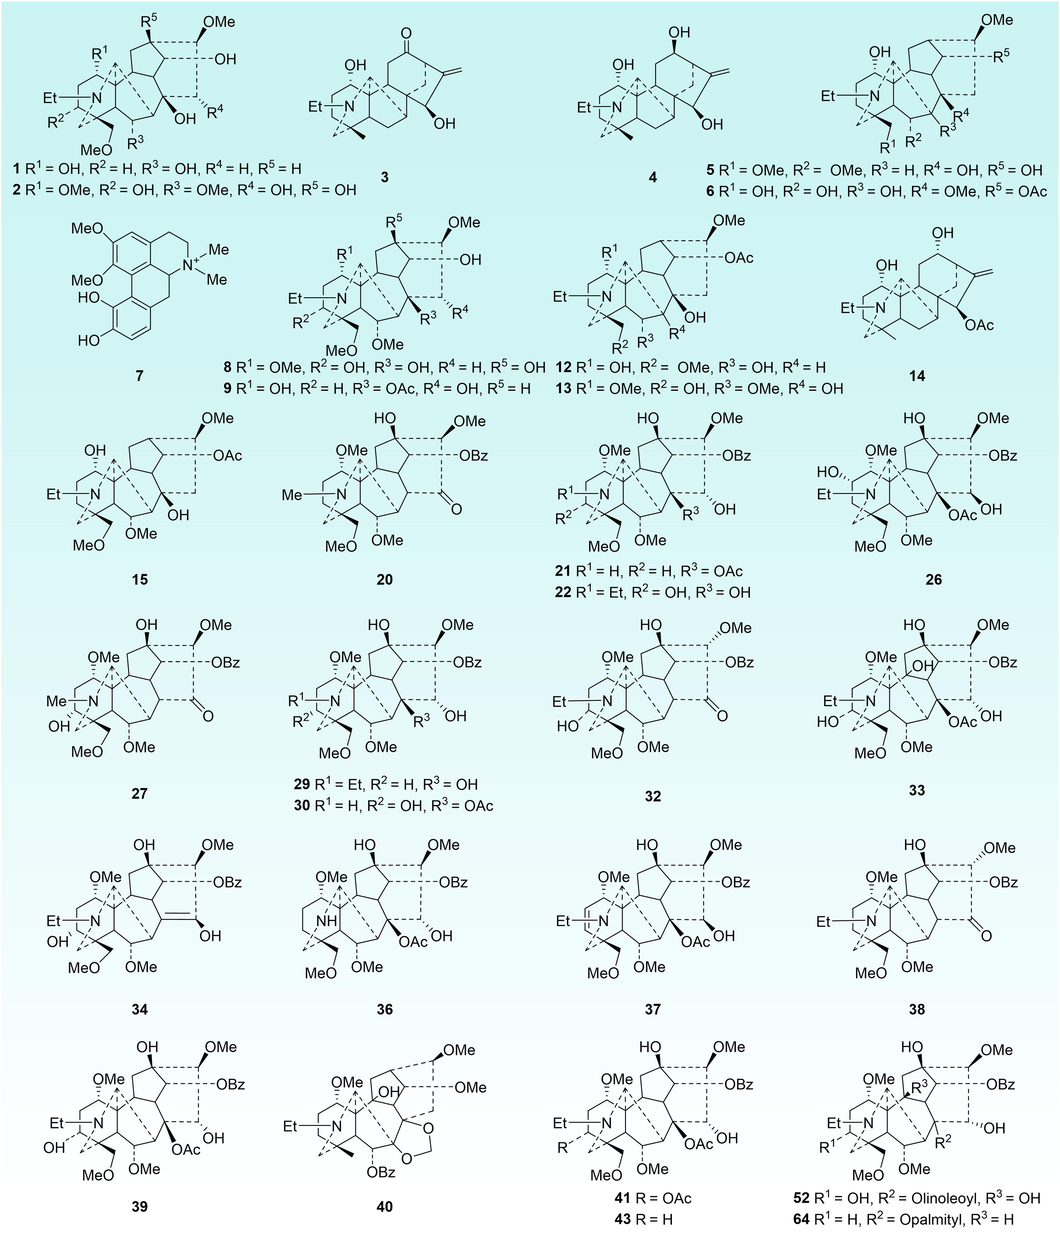
Chemical structures of metabolic markers of raw and Zanba stir-fried TBC processed for different times.
3.5 In situ metabolite profiling of TBC and its processed products by DESI-MSI
A comprehensive spatial distribution of metabolic markers of TBC and its processed products under different stir-frying time with Zanba was analyzed by DESI-MSI under previously established conditions (Liu et al., 2022). Visualized by DESI-MSI, most of the metabolic markers were presented, including aconitine (39, m/z 646.3231), 3-deoxyaconitine (43, m/z 630.3284), benzoylaconine (22, m/z 604.3109), benzoyldeoxyaconine (29, m/z 588.3051), 16-epi-pyrodeoxyaconitine (38, m/z 570.3069), and 16-epi-pyroaconitine (32, m/z 586.3015) in the tissues of the tested samples in positive mode. The representative DESI-MS images are displayed in Fig. 8, and additional DESI-MS images of other metabolic markers are showed in Supplementary Figs. S5 and S6. Among which, 14-O-acetyldelectinine (13, m/z 496.2910), lucidusculine (14, m/z 402.2644), and 6-O-benzoyleldelidine (40, m/z 570.3067) were not detected owing to the low sensitivity. As shown in the MS images (Fig. 8), the concentrations of DDAs (aconitine and 3-deoxyaconitine) gradually decreased with the prolonged processing time; a dramatic decrease was observed from 20 min to 40 min, and a lower intensity was detected after 80 min of stir-frying. By contrast, the levels of MDAs such as benzoylaconine and benzoyldeoxyaconine were hardly detected in raw TBC (0 min) and the initial stage of Zanba stir-frying (20 min). With prolonged stir-frying time, the intensities of these MDAs increased gradually from 40 to 60 min, and showed obvious increases after 80 min. DDAs of TBC hydrolyzed into MDAs is one of the important reasons for the current results. In addition, two MDAs, namely, 16-epi-pyrodeoxyaconitine and 16-epi-pyroaconitine, were only detected in the Zanba stir-fried samples, and the intensity increased markedly after 80 min of stir-frying, indicating that the in situ transformation of alkaloids occurred during stir-frying. The results showed good agreement with the UPLC-Q-TOF-MS and HPLC data.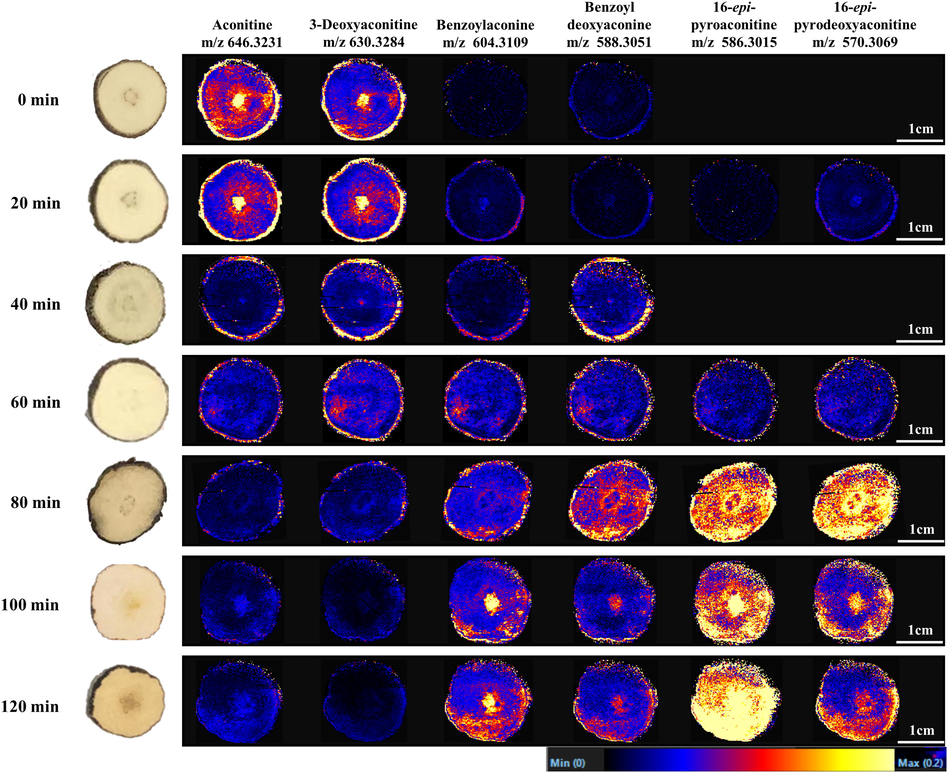
DESI-MS images of six major metabolic markers in raw and processed TBC stir-fried for different times.
4 Discussion
Like Fuzi (A. carmichaelii Debx.) and Caowu (A. kusnezoffii Reichb.) from the same genus of Aconitum, TBC is commonly used in treatment of fever, arthritis, rheumatic arthralgia and traumatic injury. Toxicity and efficacy are interdependent in TBC due to its large amounts of high toxic DDAs, such as aconitine, and 3-deoxyaconitine, as well as moderate toxic MDAs, including benzoylaconine, benzoyldeoxyaconine, and 16-epi-pyroaconitine. Therefore, the appropriate processing methods for attenuating toxicity and reserving efficacy is an essential prerequisite for the safe use of TBC. Our research group systemically discussed the changeable rules of the key ester-diterpenoid alkaloids of steaming, water decocting, and sand-frying of TBC. The results showed that the DDAs can be hydrolyzed into MDAs and further hydrolyzed into non-toxic NDAs during prolonged steaming, water-decocting, or sand-frying (Wang et al., 2010). It has been considered as the major chemical transformations for toxicity attenuation and efficacy reservation of TBC. However, composition changes in the characteristic processing method of Tibetan medicine, namely, stir-frying with Zanba, have been rarely reported.
In this study, UPLC-Q-TOF-MS based metabolomics and DESI-MSI visualization together with HPLC quantitative method were performed to investigate dynamic changes in the chemical constituents of TBC during stir-frying with Zanba. Firstly, UPLC-Q-TOF-MS was applied for identifying the toxic and active components in raw TBC and Zanba stir-fried products with different processing time. As a result, a total of 64 metabolites have been detected, and 40 of them have been identified. Among these metabolites, 39 diterpene alkaloids including aconitine, benzoylaconine, and 16-epi-pyroaconitine etc., were identified in raw and processed TBC. It has been reported that both of Fuzi and Caowu are abundant with aconitine, mesaconitine, hypaconitine in raw medicinal materials, and benzoylaconine, benzoylmesaconine, and benzoylhypacoitine etc., in their corresponding heated processing products. Unlike Fuzi and Caowu, the present results indicated that aconitine, 3-deoxyaconitine, benzoylaconine, 16-epi-pyroaconitine and other hydrolyzed products are the major alkaloids of raw and Zanba stir-fried TBC, while mesaconitine, hypaconitine are hardly to be detected although all three medicines are originated from the same genus Aconitum. Therefore, aconitine, 3-deoxyaconitine, and benzoylaconine of TBC were selected as the indicators to evaluate the toxicity attenuation and efficacy reservation effect of Zanba stir-frying.
PCA and PLS-DA comprehensively unveiled the differences in raw and Zanba stir-fried TBC with different processing times, and the samples were separated into four major groups. Combining the HPLC quantitative results, 60 min was selected as the suitable stir-frying time for toxicity attenuation and efficacy reservation of TBC, and three processing stages were defined: (1) stir-frying with Zanba for 20–40 min belonged to inadequate processing stage and the high toxic DDAs were still on relatively high-level; (2) stir-frying with Zanba for 60 min belonged to moderate processing stage, and the contents of DDAs and MDAs met the content limitations referenced of Fuzi in CP (2020 Edition); (3) stir-frying with Zanba for 80–100 min belonged to over processing stage, and the contents of both DDAs and MDAs were insufficient. This result was in good accordance with the optimized processing technology by our research group, and gave further proof that 60 min is the appropriate processing time.
Additionally, DESI-MSI was successfully utilized to visualize the variation characteristics of metabolic markers between raw and Zanba stir-fired TBC with different processing time. DESI-MSI results clearly presented the crucial variable constituents and their variation characteristics in a visual way, which are also consist with HPLC and UPLC-Q-TOF-MS results. Therefore, this integrated strategy not only reveal the possible chemical transition characteristics of TBC processed with Zanba with prolonged time, but also provide an efficient quality evaluation and control method for the safe use of TBC.
The chemical mechanism for the transformation of toxic and effective components was proposed in the present study. Previous studies demonstrated that transformations from high-toxic DDAs into moderate-toxic MDAs and then into non-toxic NDAs by hydrolysis, pyrolysis, esterification, and transesterification were effective chemical transformations in attenuating toxicity of Aconitum medicines (Wang et al., 2010; Liu et al., 2022; He et al., 2022; Qiu et al., 2021). The transformation from DDAs to MDAs was also the predominant pathway illustrated in this study. The ester bond at C8 position of aconitine was firstly cleaved and transformed into benzoylaconine through hydrolysis reaction, then dehydrated into the enol form IM I. The keto-enol tautomerism could easily happen at this stage, hence the hydroxy group at C15 position of IM I was tautomerized into carbonyl group and deliver pyroaconitine through pyrolysis, further into 16-epi-pyroaconitine (Fig. 9 Path A). 3-Deoxyaconitine showed the same hydrolysis and pyrolysis processes (Fig. 9 Path B). After these two major stages, the effects of toxicity attenuation and efficacy reservation were achieved (Wang, et al., 2021). The alkaloid transformations were in accordance with the previous reports (Qiu et al., 2021; He et al., 2022).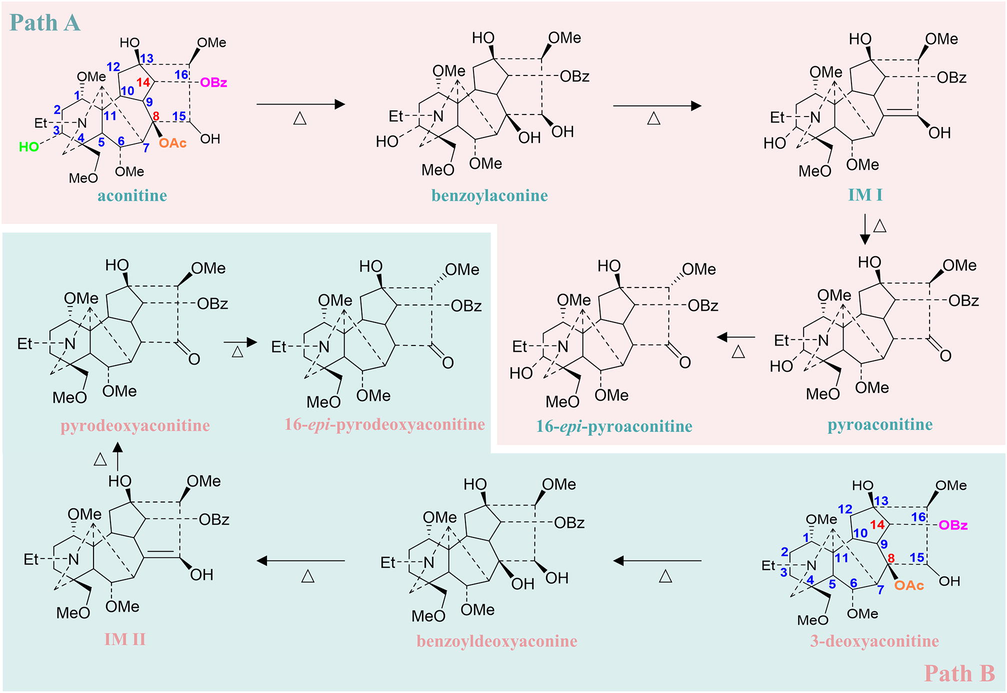
Proposed mechanism for the transformation of ester type alkaloids in TBC during stir-fried with Zanba.
5 Conclusions
In this study, UPLC-Q-TOF-MS based metabolomics and DESI-MSI visualization coupled with HPLC quantitative analysis were developed for characterizing chemical variations in raw TBC and its Zanba stir-fried products with different processing time. Dynamic changes in alkaloids were clearly observed, and 60 min of stir-frying was considered as appropriate time point for toxicity attenuation and efficacy reservation of TBC based on the results of multivariate statistical analysis, HPLC quantification, and DESI-MSI. A total of 32 metabolic markers were detected to discriminate raw TBC and those stir-fried for different time. The results revealed two major chemical transformations, including hydrolysis and pyrolysis of DDAs into MDAs in TBC are the key detoxication pathways during Zanba stir-frying. The comprehensive analysis developed in this study is an efficient strategy for the processing procedure monitoring and safe control of TBC. The wide application of the proposed method could help unveil the processing mechanism of Aconitum medicines and other toxic traditional Chinese medicines.
Author contributions
Cong-Ying Li, Meng-Xiang Sha, and Zhen Zhou performed the experiment; Cong-Ying Li and Zhao-Qing Pei analyzed the data; Cong-Ying Li and Yue Liu drafted the manuscript; Yue Liu and Yi Zhang designed, supervised, reviewed the study, and provided financial assistance.
Acknowledgements
This work was financially supported by the National Natural Science Foundation of China (No. 82130113), the China Postdoctoral Science Foundation (No. 2021MD703800), the Science Foundation for Youths of Science & Technology Department of Sichuan Province (No. 2022NSFSC1449), and the “Xinglin Scholars” Research Promotion Program of Chengdu University of Traditional Chinese Medicine (No. BSH2021009).
Declaration of Competing Interest
The authors declare that they have no known competing financial interests or personal relationships that could have appeared to influence the work reported in this paper.
References
- Quantitative DESI mass spectrometry imaging of lung distribution of inhaled drug. J. Drug Delivery Sci. Technol.. 2021;66:102794
- [CrossRef] [Google Scholar]
- Comparison of alkaloids in Aconiti Kusnezoffii Radix, Aconiti Radix, and Aconiti Lateralis Radix Praeparata based on UHPLC-Q-Exactive Orbitrap MS/MS. China J. Chin. Mater. Med.. 2023;48(01):126-139.
- [CrossRef] [Google Scholar]
- Jing Zhu Materia Medica. Shanghai: Shanghai Science and Technology Press; 1982. p. :105-106.
- Blue Beryl. Shanghai: Shanghai Science and Technology Press; 2012. p. :1.
- Mass spectrometry-based profiling and imaging strategy, a fit-for-purpose tool for unveiling the transformations of ginsenosides in Panax notoginseng during processing. Phytomedicine. 2022;103:154223
- [CrossRef] [Google Scholar]
- Processing methods and the underlying detoxification mechanisms for toxic medicinal materials used by ethnic minorities in China: a review. J. Ethnopharmacol.. 2023;305:116126
- [CrossRef] [Google Scholar]
- New understanding of aconitine hydrolysis pathway: isolation, identification and toxicity evaluation based on intermediate products. Arabian J. Chem.. 2022;15(11):104255
- [CrossRef] [Google Scholar]
- Recent application of mass spectrometry imaging in traditional Chinese medicine. Chin. J. Pharm. Anal.. 2022;42(10):1675-1689.
- [CrossRef] [Google Scholar]
- Chemical constituents of Aconite Lateralis Radix and changing regularities during decoction process by HPLC-Q-TOF-MS. Chin. J. Exp. Tradit. Med. Formulae. 2015;21(1):57-63.
- [CrossRef] [Google Scholar]
- A comprehensive quality evaluation of Fuzi and its processed product through integration of UPLC-QTOF/MS combined MS/MS-based mass spectral molecular networking with multivariate statistical analysis and HPLC-MS/MS. J. Ethnopharmacol.. 2021;266:113455
- [CrossRef] [Google Scholar]
- In situ analysis of volatile oil in Angelica sinensis roots by fluorescence imaging combined with mass spectrometry imaging. Talanta. 2023;255:124253
- [CrossRef] [Google Scholar]
- Aconitum pendulum and Aconitum flavum: a narrative review on traditional uses, phytochemistry, bioactivities and processing methods. J. Ethnopharmacol.. 2022;292:115216
- [CrossRef] [Google Scholar]
- Unveiling dynamic changes of chemical constituents in raw and processed Fuzi with different steaming time points using desorption electrospray ionization mass spectrometry imaging combined with metabolomics. Front. Pharmacol.. 2022;13:842890
- [CrossRef] [Google Scholar]
- Lu, L., Yue, H., Song, F., TSAO, R., Liu, Z., Liu, S., 2010. Rapid profiling of alkaloids in several medicinal herbs by matrix-assisted laser desorption/ionization mass spectrometry. Chem. Res. Chin. Univ. 26 (1), 11–16
- Components in Radix Aconiti before and after processing by using HPLC-MS. J. Beijing Univ. Tradit. Chin. Med.. 2016;39(4):298-303.
- [CrossRef] [Google Scholar]
- Qinghai Medical Products Administration, 2010. Processing Specification of Tibetan Medicine of Qinghai Province. Qinghai Nationalities Publishing House, Qinghai, pp. 96–97
- Online discovery of the molecular mechanism for directionally detoxification of Fuzi using real-time extractive electrospray ionization mass spectrometry. J. Ethnopharmacol.. 2021;277:114216
- [CrossRef] [Google Scholar]
- New norditerpenoid alkaloids from Aconitum falconeri. J. Nat. Prod.. 2000;63:1393-1395.
- [CrossRef] [Google Scholar]
- Spatial distribution and comparative analysis of Aconitum alkaloids in Fuzi using DESI-MSI and UHPLC-QTOF-MS. Analyst. 2023;148:1603-1610.
- [CrossRef] [Google Scholar]
- Metabolomics study on Fuzi and its processed products using ultra-performance liquid-chromatography/electrospray-ionization synapt high-definition mass spectrometry coupled with pattern recognition analysis. Analyst. 2012;137:170-185.
- [CrossRef] [Google Scholar]
- Study on the chemical constituents of Aconitum szechenyianum Gay. Acta Pharm. Sin.. 1989;1:71-74.
- [CrossRef] [Google Scholar]
- Fragmentation pathways of six aconitine alkaloids using HPLC-Q-TOF-MS technology. Chin. Tradit. Herb. Drugs. 2016;47(16):2827-2831.
- [CrossRef] [Google Scholar]
- Chemical constituents of Zhenwu decoction based on UPLC-Q-Orbitrap HRMS. J. Chin. Med. Mater.. 2022;45(5):1148-1157.
- [CrossRef] [Google Scholar]
- Biosynthesis-based spatial metabolome of Salvia miltiorrhiza Bunge by combining metabolomics approaches with mass spectrometry-imaging. Talanta. 2022;238:123045
- [CrossRef] [Google Scholar]
- Determination and quantitative analysis of alkaloids in Aconitum japonicum by liquid chromatography atmospheric pressure chemical ionization mass spectrometry. Biol. Mass Spectrom.. 1994;23:97-102.
- [CrossRef] [Google Scholar]
- Wang, H., Lao, A., Fujimoto, Y., Tastuno, T., 1985. The structure of polyschistine A, B and C: three new diterpenoid alkaloids from Aconitum polyschistum Hand. -Mazz. Heterocycles 23 (4), 803-807. https://10.3987/R-1985-04-0803
- Study on processing principle of Aconitum pendulum. China J. Chin. Mater. Med.. 2010;35(5):588-592.
- [CrossRef] [Google Scholar]
- Attenuated structural transformation of aconitine during sand frying process and antiarrhythmic effect of its converted products. Evid. Based Complement. Alternat. Med.. 2021;2021:7243052.
- [CrossRef] [Google Scholar]
- Comparative study on unprocessed Aconiti Radix and unprocessed Aconiti Lateralis Radix by UPLC-MSn. Chin. J. Pharm. Anal.. 2017;37(9):1640-1647.
- [CrossRef] [Google Scholar]
- Untargeted metabolomics analysis to unveil the chemical markers for the differentiation among three Gleditsia sinensis-derived herbal medicines by ultra-high performance liquid chromatography/ quadrupole time-of-flight mass spectrometry. Arabian J. Chem.. 2022;15(5):103762
- [CrossRef] [Google Scholar]
- Identification analysis of the chemical constituents in Heishunpian by UHPLC-Q-TOF/MS. Jiangxi J. Tradit. Chin. Med.. 2015;46(2):48-52.
- [Google Scholar]
- Research progress and discussion on processing of toxic traditional Chinese medicine decoction pieces. World Chin. Med.. 2022;17(9):1193-1201.
- [CrossRef] [Google Scholar]
- Rapid and global detection and characterization of aconitum alkaloids in Yin Chen Si Ni Tang, a traditional Chinese medical formula, by ultra performance liquid chromatography-high resolution mass spectrometry and automated data analysis. J. Pharm. Biomed. Anal.. 2010;53:421-431.
- [CrossRef] [Google Scholar]
- Identification and comparative analysis of the major chemical constituents in the extracts of single Fuzi herb and Fuzi-Gancao herb-pair by UFLC-IT-TOF/MS. Chin. J. Nat. Med.. 2014;12(7):542-553.
- [CrossRef] [Google Scholar]
- Analysis of chemical constituents of Aconiti Radix and its different processed products based on UPLC/Q-TOF-MS/MS. China J. Tradit. Chin. Med. Pharm.. 2021;36(10):5837-5842.
- [Google Scholar]
- Four Medical Tantra (Zhatang Edition). Beijing: Nationalities Publishing House; 2005. p. :435.
- Clinical analysis of 7 cases of Aconitum flavum Hand.-Mazz. poisoning. People Mil. Surg.. 1981;10:34-35.
- [Google Scholar]
- Analysis on characteristic constituents of crude Aconitum carmichaelii in different regions based on UPLC-Q-TOF-MS. China J. Chin. Mater. Med.. 2016;41(3):463-469.
- [CrossRef] [Google Scholar]
- Chemical ingredient analysis of sediments from both single Radix Aconiti Lateralis decoction and Radix Aconiti Lateralis-Radix Glycyrrhizae decoction by HPLC-MS. Acta Pharm. Sin.. 2012;47(11):1527-1533.
- [CrossRef] [Google Scholar]
- Tandem mass spectrometry analysis of total alkaloids from the roots of Aconitum flavum. J. Chin. Mass Spectrom. Soc.. 2006;27(2):71-73.
- [Google Scholar]
- A case of ventricular arrhythmia caused by Aconitum pendulum. People Mil. Surg.. 2018;61(4):346-348.
- [Google Scholar]
- Chemical variation in Aconti Kusnezoffii Radix before and after processing based on UPLC-Orbitrap-MS. China J. Chin. Mater. Med.. 2020;45(4):1082-1089.
- [CrossRef] [Google Scholar]
- In situ analysis for herbal pieces of Aconitum plants by using direct analysis in real time mass spectrometry. Chin. J. Chem.. 2015;33:241-246.
- [CrossRef] [Google Scholar]
Appendix A
Supplementary material
Supplementary data to this article can be found online at https://doi.org/10.1016/j.arabjc.2023.104957.
Appendix A
Supplementary material
The following are the Supplementary data to this article:Supplementary data 1
Supplementary data 1
Supplementary data 2
Supplementary data 2


