

Translate this page into:
Direct sunlight photodegradation of congo red in aqueous solution by TiO2/rGO binary system: Experimental and DFT study
⁎Corresponding author. zaidhameed_91@yahoo.com (Zaid H. Mahmoud)
-
Received: ,
Accepted: ,
This article was originally published by Elsevier and was migrated to Scientific Scholar after the change of Publisher.
Peer review under responsibility of King Saud University.
Abstract
Photolysis was employed to produce titanium dioxide (TiO2) with exposed (0 0 1) facets, which were then modified by incorporating reduce graphene oxide (rGO) sheets at (1, 3 and 5) wt.%.The chemical composition, optical properties, morphology, and electrochemical behavior of both the pure and composite nanomaterials were analyzed. The X-ray diffraction (XRD) and Raman spectroscopy techniques confirmed the formation of the anatase phase of TiO2 in the samples. The Debye Scherrer method was utilized to estimate the size of the particles. It was observed that the particle size decreased as the concentration of rGO increased; at 5 wt% rGO, the size was 11 nm. The morphology of the rGO/TiO2 nanocomposite was analyzed with transmission electron microscopy (TEM) which showed that TiO2 nanoparticles were dispersed on the surface of the rGO sheets. The analysis of the X-ray photoelectron spectrum (XPS) revealed that bonding of TiO2 with rGO occurred through the formation of Ti-C and Ti-O-C bonds. The results obtained from the diffuse reflectance spectroscopy (DRS) showed a decrease in band gap upon an increase in rGO concentration. Moreover, confirmation was obtained regarding the reduction of recombination carriers through the photoluminescence (PL) spectrum. The results indicated that the prepared nanocomposite had a high number of oxygen vacancies. The photodegradation mechanism of congo red dye under sunlight was studied by Liquid chromatography–mass spectrometry (LC-Mass) and scavenger effect. The photodegradation of congo red dye (CR) utilizing TiO2, both pure and incorporated with rGO, was observed under normal conditions in the presence of sunlight. The study revealed that the optimal condition for achieving maximum photodegradation of CR dye was pH = 7, 100 min, 50 ppm initial CR dye concentration and 10 mg of catalyst dosage. The photodegradation data illustrated that 5 wt% rGO doped TiO2 exhibits higher efficiency than other 3; 1 wt% rGO and pure TiO2. Finally, the improving breakdown of CR dye using direct sunlight showed high efficiency without leaving behind any secondary intermediates.
Keywords
Mass
DFT
Theoretical
XPS

Data availability
All data generated or analyzed during this study are included in this published article.
1 Introduction
In recent years, there has been a significant focus on advocating for clean energy sources due to the increasing challenges related to energy and the environment (Mahmoud et al., 2018; Farhan et al., 2018). Solar energy has the potential to foster environmentally conscious communities. In this regard, significant research efforts are dedicated towards converting solar energy into usable energy (Mahmoud et al., 2022). This energy is presently utilized in applications such as photochemical cells, solar cells, and photocatalysis (Mahmoud et al., 2022). The photocatalytic degradation of organic dye pollutants has generated substantial interest due to its practical applications and economic benefits. Various types of nanoparticles have been developed and synthesized with the objective of enhancing the natural environment. The semiconductor materials have garnered attention from various other materials because of non-toxicity, no secondary pollution, stable chemical and low cost (Moushumy et al., 2022; Kundu and Mondal, 2019; Saher et al., 2021). Amongst different semiconductor materials, the anatase phase of TiO2 is considered to have the greatest potential for practical applications (Aoudjit et al., 2021). Moreover, the TiO2 nanoparticles possess a significantly large surface area, rendering them highly effective in enhancing sunlight adsorption as compared to bulk particles (Reza et al., 2017). There exist two big significant challenges for this material. Firstly, its band gap has a relatively large value of (3–3.2) eV, limiting its response to UV light only. Secondly, the material experiences a high rate of recombination for electron-hole pairs (Saeed et al., 2017). Various techniques have been employed to restore the photocatalytic activity of photocatalysts in order to overcome these issues, however, satisfactory outcomes have not been achieved thus far. Graphene, a novel type of carbon material featuring a two-dimensional sp2 network, has generated considerable interest due to its unique structure, remarkable thermal and chemical stability, and exceptional conductivity (Fathy et al., 2016). Graphene is considered to be an optimal support for photocatalysts due to its ability to enhance the activity of photocatalysis by facilitating the transfer of electrons from the conduction band (CB) of anatase, thereby prolonging the lifespan of h-e pairs (Du et al., 2022). Numerous studies have demonstrated that the incorporation of graphene oxide (GO) into TiO2/rGO nanocomposites can enhance electron transfer and reduce the rate of e-h recombination (Ma et al., 2021). Long et al., (Long and Qin, 2013) reported the activity of 0.8 wt% rGO doped TiO2 in photodegradation of dye under sunlight, allocating the activity to the p-n junction heterostructure formed between TiO2 and rGO. Andreozzi et al., (Andreozzi et al., 2018) reported that the purification of water contains high ratio of saline and different organic dye and organic compounds using 10 wt% rGO-TiO2. The increase in photocatalytic performance can be attributed to the favorable charge transfer characteristics of rGO. It also exhibits high load mobility and rapid transfer of charges during its structure, which can be advantageous in redox reactions (Fang et al., 2015; Mahmoud et al., 2023). The properties of a composite material are not merely a combination of the properties of its individual components. Rather, the surface reactions and interactions between semiconductors contribute significantly to its unique properties (Al-Obaidi et al., 2023). The production of rGO-TiO2 heterostructures enables the absorption of a wide range of wavelengths and subsequent separation of electron-hole pairs, resulting in an increase in photocatalytic activity (Mahmoud et al., 2021). The objective of this investigation is to identify the specific reactive oxygen species (ROS) responsible for the photodegradation process of %wt. rGO doped TiO2 nanostructure, in order to gain a better understanding of the photodegradation mechanism for congo red organic dye and the factors that influence the activity of these heterostructures. A method for rapid synthesis of TiO2-incorporated rGO using photolysis-assisted hydrothermal treatment, resulting in improved photocatalytic activity, was proposed. The anatase TiO2 phase was characterized via XRD and TEM, and rGO was confirmed via Raman spectrum. TEM confirms the interaction between TiO2 agglomeration nanoparticles and rGO nano sheets. The samples of %wt. rGO-TiO2 exhibit a distinct spectral behavior as observed through DRS. PL results were studied to investigate the separation and transportation of photo-carriers. Finally, the photocatalytic mechanism modulation of %wt. rGO-TiO2 compared with TiO2 in congo red dye photodegradation was proved during scavenger solutions. The introduction of rGO altered the intermediate reactive oxygen, leading to an increase in activity under sunlight illumination. This confirms that the use of rGO leads to changes that enhance the photocatalytic activity of TiO2.
2 Experimental
2.1 Materials
All chemicals materials (graphite powder (99.9%), sodium nitrate (98%), hydrogen peroxide (30%), potassium permanganate (98%), sodium hydroxide (97%), hydrochloric acid (36%), ethanol (70%), titanium isopropoxide (99%) and congo red dye (C32H24N6O6S2.2Na, λmax = 497 nm)) were supplied from sigma Aldrich company and used without any future purification. All solution prepared by using distilled water.
2.2 Preparation of titanium oxide (TiO2)
The synthesis of TiO2 was reported by Zaid et al., 2020 (Mahmoud et al., 2022). 10 ml of isopropoxide stock solution was diluted by 40 ml distilled water and irradiated using manual irradiation 15 W power system in ice bath (Fig. S1, supplementary information). The irradiation process was carried out until a white precipitate was obtained, which was subsequently separated from the solution through decantation and washed by acetone, ethanol and distilled water. Finally, it dried at 80 °C for 5 h and calcined at 500 °C for 2 h.
2.3 Preparation of graphene oxide (GO)
The preparation of GO was carried out by using Hemmer modified method (Khatmi Maab et al., 2016). Firstly, in 300 ml beaker, (1gm, 2gm and 36 ml) of graphite powder, sodium nitrate and 1 M H2SO4 were mixed together in ice bath for 4 h. then, 5gm of potassium permanganate was added to mixture slowly under strong stirring. Next, 200 ml of warm water was added to the mixture. While continuously stirring, 35 ml of 30% hydrogen peroxide was gradually added until the color changed to yellow. Finally, the suspension solution of graphene isolated by decantation and washed several times by distilled water and 10% HCl before dried at 60 °C for 3 h.
2.4 Preparation of graphene oxide/Titanium oxide (rGO/TiO2)nanocomposite
The preparation of rGO/TiO2 nanocomposite was carried out using hydrothermal method. Firstly, various weight ratios of rGO (1%, 3%, and 5%) were mixed with an equivalent amount of TiO2 solution and sonicated for 45 min until a brown solution was obtained. Next, the rGO/TiO2 suspension was transferred to stainless steel auto-cleave and heated to 200 °C for 6 h and allowed to cool down naturally at room temperature. Finally, the gray precipitate of rGO/TiO2 was transferred and isolated by centrifuging process before washing it several times by ethanol and distilled water (Shen et al., 2011; Yue et al., 2019; Liu et al., 2016).
2.5 Study of photocatalytic activity
The photocatalytic activity of (1, 3 and 5%) of rGO/TiO2 were investigated for degradation of CR dye solution. The solution reaction was prepared by adding 0.01gm of each prepared materials in 100 ml of 10 ppm dye solution. Firstly, the resulting suspension was then stirred in a dark environment for 30 min to achieve adsorption–desorption equilibrium. The subsequent step involved exposing the sample to direct sunlight for varying durations using a manual irradiation system with an intensity of 1200 W.cm−2 (Fig. S2, supplementary information). To maintain a constant temperature during the reaction, the water was circulated around the reactor. At predetermined intervals, a 5 ml sample of the solution was collected and subjected to centrifugation to remove the catalyst. The remaining concentration was then analyzed using UV–Vis spectrum and LC-MS techniques.
3 Results and discussion
3.1 Structural characterization
The XRD of TiO2 and (1, 3 and 5) wt.% rGO/TiO2 are shown in Fig. 1a-d. The observed patterns exhibit peaks that can be attributed to the formation of TiO2 with lattice parameter of a = b = 3.78 and c = 9.50 and the results are in agreement with JCPDS (04–0477). The diffraction pattern of pure TiO2 (Fig. 3a) displayed peaks at angles of 25.35°, 37.78°, 48.07°, 53.93°, 55.11° and 62.72° corresponding to (1 0 1), (0 0 4), (2 0 0), (1 0 5), (2 1 1) and (2 0 4) respectively, indicating the presence of a tetragonal anatase phase. In Fig. 1b-d, it can be observed that the anatase phase remains unchanged for all diffraction peaks, irrespective of the rGO mass ratio dopant. This observation indicates that the prepared TiO2 is stabilized. The XRD patterns illustrated in Fig. 1b and 1c for TiO2 doped with 1% and 3% GO respectively do not exhibit any peaks that can be attributed to rGO. This may be due to the high degree of isolation of rGO sheets by TiO2 nanoparticles (Moustafa et al., 2022). However, the diffraction peak centered at 10.99°, which corresponds to (0 0 1), is observed and can be attributed to rGO. rGO/TiO2 was estimated by using Scherrer equation (Holzwarth and Gibson, 2011):
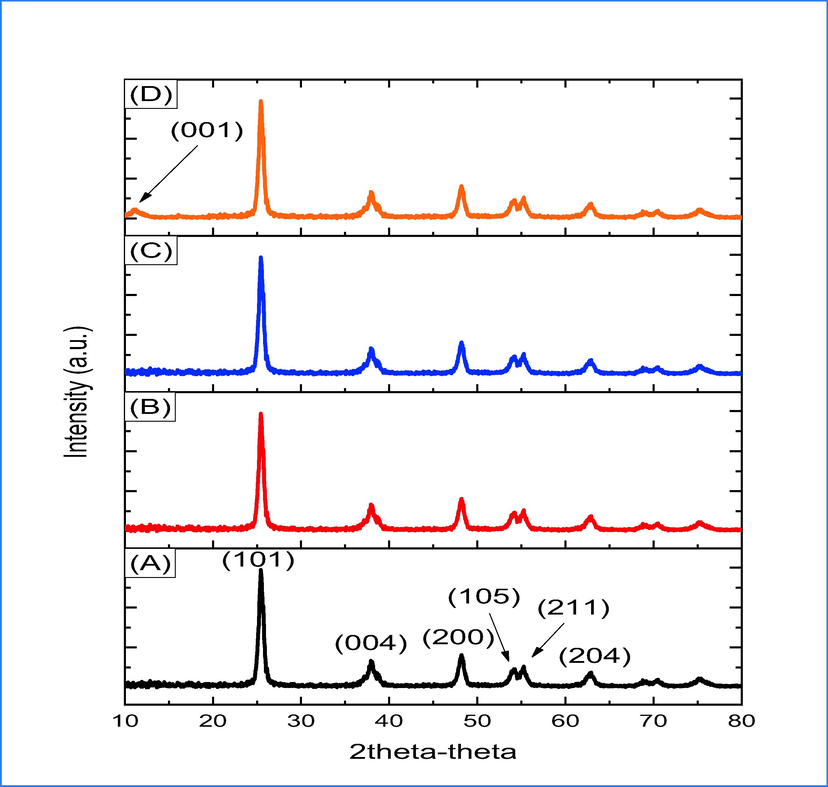
XRD of pure and 1,3 and 5 wt% rGO doping TiO2.
Where 0.9: is shape factor, λ: X-ray source wavelength,
full width at half maximum of peak. Table 1 presents the findings that reveal a decrease in crystallite size as the dopant weight ratio increases. This is indicative of rGO segregation at the TiO2 boundaries, thereby inhibiting crystal growth. On the other side, slight elongation of c axis is shown (Table. 1), while a and b axis remain constant, that the carbon of GO fcc and bcc is positioned at the center or occupied in the structure of TiO2 (Ma et al., 2021).
photocatalyst
2θ of (1 0 1) crystal plane
Lattice parameter (Ao)
FWHM
D (nm)
a = b
c
TiO2
25.46
3.78
9.532
0.67036
13
1 wt% rGO
25.30
3.78
9.541
0.72453
12
3 wt% rGO
25.18
3.78
9.552
0.78493
11
5 wt% rGO
25.12
3.78
9.5605
0.80546
10
Raman spectrum technique was used to investigate the chemical composition and the structure of prepared compounds through vibrational properties.The spectrum of GO, rGO and rGO/TiO2 are shown in Fig. 2a-c, respectively. At Fig. 2a, two bands can be observed that are centered at 1350 cm−1(D) and 1595 cm−1 (G) assigned to sp3 defect and sp2 in plane vibration carbon atoms. Additionally, at the Brillouin zone, the E2g doubly degenerated mode can be observed (Krishnamoorthy et al., 2012). The spectrum of rGO (Fig. 2b) illustrates a shift in the G band towards lower wavelengths (1595 to 1584 cm−1) while the D band remains unshifted. This may be attributed to the self-healing properties of rGO, whereby carbon atoms are restored to the hexagonal network (Chen et al., 2021). This downshift in G band indicate the successful reduction to rGO. In Fig. 2c, the two bands of D and G exhibit broadening in the rGO/TiO2 nanocomposite, which can be attributed to the stacking of rGO sheets induced by carbonyl groups attached to rGO. This leads to a hindrance in the accumulation of rGO sheets. The disorder structure of prepared compounds are measured based on the ID/IG ratio. The findings indicate that the ratio experienced an increase from 0.9 to 0.98 as a consequence of the reduction of GO to rGO. This outcome can be attributed to the defects and elimination of functional groups (carboxylic acid) present on the surface of GO (Ansari et al., 2022). On the other hand, slight reduce in the ratio value (0.85) is shown in rGO/TiO2 nanocomposite due to the reduction of sp3 to sp2 carbon atoms as well as, reducing in the domain size of sp2 during hydrothermal process (Karthik et al., 2020). Fig. 4d illustrates the zoomed spectrum of pure and (1, 3 and 5)wt.% rGO/TiO2 nanocomposite with range of 100–200 cm−1. The results showed that the intensity of Eg band mode is increased with increasing the doped ratio. Additionally, this mode is shifted toward a lower wavenumber with broadening, which can be attributed to the impact of phonon confinement and surface pressure. Numerous studies (Singh et al., 2022) have addressed the shift in Raman peak position, which is attributed to two possible factors. The first posits that the intensity of TiO2 peaks is affected by vacancy defects, which are amplified by the disordered structure of graphene. The second possibility is that the shift results from electronic transitions occurring between graphene sheets and TiO2.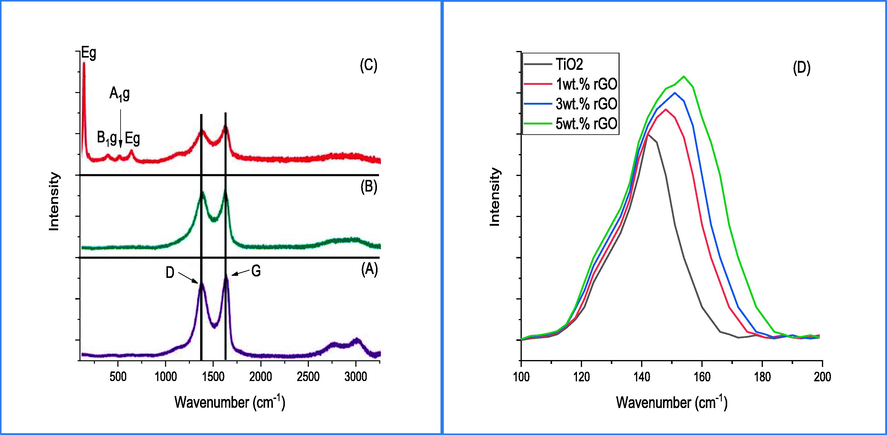
Raman spectrum of (A) GO, (B) rGO, rGO doped TiO2 and (D) Eg intensity peak of TiO2.
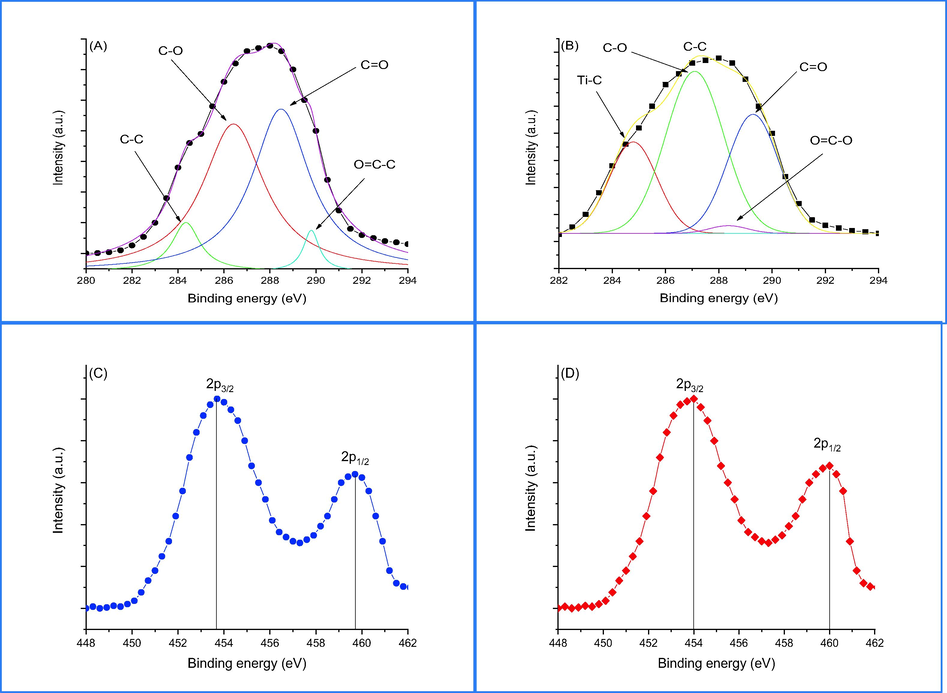
XPS of (A) C 1 s, (C) 2p of rGO before doping and (B) C 1 s, (D) 2p of rGO after doping.
PL of pure and 1,3 and 5 wt% rGO/TiO2.
The chemical analysis of GO and rGO/TiO2 nanocompsoite was investigated by using X-ray Photoelectron Microscopy (XPS). The findings of the analysis are presented in Fig. 3a-d. Fig. 6a and 6b display multiple peaks centered at binding energies of 284.6, 286.3, 287.3, and 288.9 eV, corresponding to the core level spectra of carbon and indicating the presence of carbon–carbon and carbon–oxygen bonds (Wang et al., 2020). The findings demonstrate a reduction in the intensity peaks of carbon–oxygen in rGO/TiO2 nanocomposite, indicating the reduction of GO via hydrothermal processing. Additionally, a peak is observed at 282.4 eV corresponding to the Titanium-carbon bond. The core level of Ti4+ in pure TiO2 and rGO/TiO2 nanocompsoite were shown in Fig. 3c,d. Fig. 3c exhibits the presence of two intensity peaks at 453.8 and 459.1 eV, which are attributed to Ti 2p3/2 and Ti 2p1/2, respectively. The difference in binding energy between these two peaks is measured to be 6.01 eV, aligning with previous findings in literature (Wang et al., 2020). The difference in binding energy of Ti4+ remains present in rGO/TiO2 nanocompsoite as shown in Fig. 3d, but the binding energies of Ti 2p3/2 and Ti 2p1/2 increased because of the interaction between titanium and carbonyl groups of rGO (Dong et al., 2017).
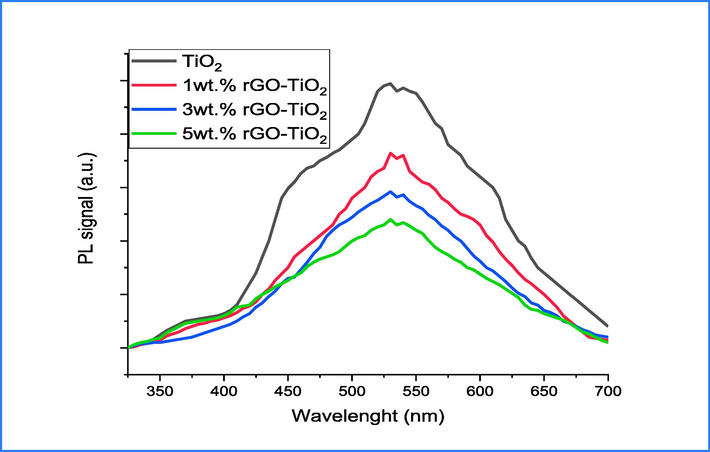
The crystal lattice of TiO2 was analyzed to examine the defect and vacancy of oxygen ions using PL spectrum. The results are depicted in Fig. 4, which displays a wide peak containing four sub-band emissions positioned at 420, 487, 520, and 680 nm correspondingly. The emission band at 420 nm assigned to the interaction of h+ - e- or may be attributed to self-trapped exciton (Dong et al., 2017). A sub-band at 487 nm is observed and attributed to the transfer of electrons from Ti3+ to O2– in octahedral complex (Dong et al., 2017). Additionally, two sub-bands located at 520 and 680 nm are linked to self-trapped oxygen vacancies known as F centers (Nasralla et al., 2020). The PL spectrums of (1, 3 and 5)wt.% rGO incorporated TiO2 are demonstrated at Fig. 4.b-d. The results demonstrate that as the concentration of rGO increases, there is a gradual reduction in the intensity of emission peaks. This phenomenon is attributed to peak quenching via rGO incorporation, and becomes more apparent at 5 wt% rGO sheet doping. The reduction in intensity is contingent upon the interplay of ions. At a 1 wt% incorporation ratio, the interaction between ions is insufficient to significantly impact energy levels. Conversely, with a 5 wt% incorporation ratio, the interaction between ions is considerably stronger due to a decrease in defects and an increase in ion concentration (Chetibi et al., 2017), ultimately resulting in quenching (John et al., 2020). There are two factors that contribute to the quenching of emission peaks. The first factor is non-radiative energy loss, which arises from the transfer of energy from ions to defect sites. The second factor involves the scattering of electrons by oxygen ions at states of trapping, which results in an increase in the duration of h+-e- recombination (Sang et al., 2019).
Fig. 5 shows the band gap of pure TiO2 and (1, 3 and 5)wt.% GO incorporated TiO2 calculated by using Tauc plot (Chen et al., 2017). The findings indicate that there was a slight decrease in energies as the Rgo ratio increased. This could be attributed to the influence of dielectric confinement (Al-Kandari et al., 2021). This confinement is a significant factor in energy alteration and its influence surpasses that of electron-hole space confinement, leading to the observed decrease in energy levels.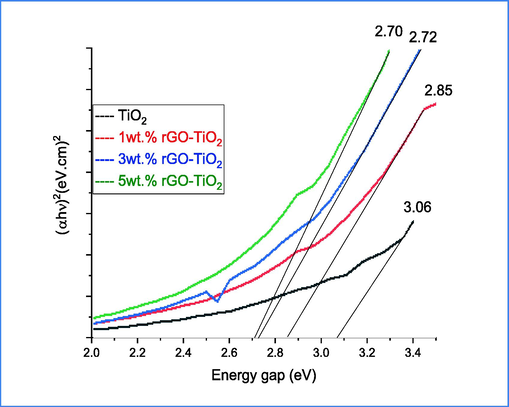
Band gap of pure and 1,3 and 5 wt% rGO/TiO2.
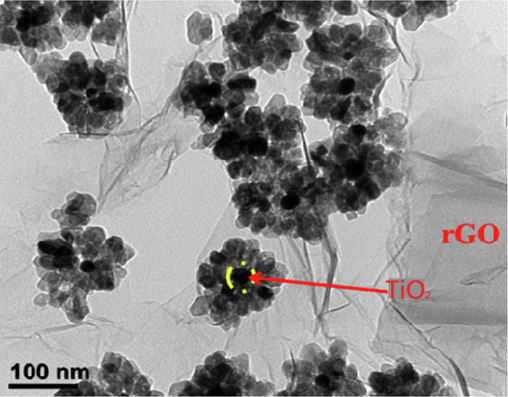
TEM of 5 wt% rGO-TiO2.
TEM images were utilized to investigate the morphology of both prepared TiO2 and rGO/TiO2 nanocomposite. The results, as depicted in Fig. 6, reveal a uniform distribution of TiO2 nanospheres on rGO sheets, with an interlayer distance in the low nanometer range. These findings are consistent with the (1 0 1) crystal plane of anatase, indicating good agreement.
3.2 UV–Vis and TOC
The photodegradation of congo red (CR) dye over pure TiO2 and 5 wt% rGO/TiO2 was studied by analyzing band gap, EIS, UV–Vis spectrum, and total organic carbon (TOC) results. The UV–Vis spectrum of CR photodegraded under sunlight over 5 wt% rGO/TiO2 is depicted in Fig. 7a. The UV–Vis spectrum of CR shows strong adsorption band with range of 330–500 nm, making a part of sunlight photons unattainable to the pure TiO2 and 5 wt% rGO/TiO2 catalysts. In Fig. 7b, the percentage decolorization of CR over pure TiO2 and (1, 3 and 5)wt.% rGO/TiO2 is shown. The findings indicate that the integration of TiO2 is more effective in the degradation of dye when exposed to sunlight. Within the initial 15 min, the decolorization efficiency is 35% for 5 wt% rGO/TiO2 in contrast to only 7% for the pure catalyst. The efficiency of degradation increases in proportion to the duration of sunlight exposure, ultimately reaching 99% after a time span of 100 min. The rate constant for the degradation of CR dye was calculated using Langmuir-Hinshelwood kinetic for pure TiO2 and (1, 3 and 5)wt.% rGO/TiO2 nanocomposites. The values of K are displayed in Fig. 7c. The findings demonstrate that the value of K for 5 wt% rGO/TiO2 is greater than that of pure TiO2. This implies that the inclusion of rGO into the TiO2 matrix results in a heightened efficiency of photo-excited electrons. Additionally, it leads to a reduction in charge carriers during the recombination process for pure TiO2 (Movahedi et al., 2009). As the studies mentioned (Ali et al., 2020); the CR dye undergoes a decolorization process rather than mineralization, as it loses its yellow color and forms intermediate compounds. This process occurs through an initial reaction with oxidizing agents such as hydroxyl free radicals and oxygen super anions, which also cause adsorption edge damage to the conjunction. To recognize between decolorization and mineralization, the Total Organic Carbon (TOC) measurements for 5 wt% rGO/TiO2 and pure TiO2 was carried out and the results are summarized in Fig. 7d. The findings demonstrate that the utilization of 5 wt% rGO/TiO2 leads to a mineralization of the CR dye by a factor of 10. The comparisonn between decolorization and mineralization of CR dye under direct sunlight by using UV–Vis and TOC are shown in Fig. 7e. During the initial 15 min of exposure to sunlight, the decolorization of CR dye was observed to be 45%, while only 17% of organic matter was removed. This suggests that oxidative species are reacting with the dye to form intermediate compounds, resulting in fragmentation and damage to its conjugate structure, ultimately leading to its decolorization. The study showed that decreasing the concentration of CR led to an increase in the removal of organic carbon due to the oxidative species attack. It was noted earlier that TiO2 has a favorable value for reducing oxygen, which is equal to −4.03 V. This indicates that the formation of super oxygen anions is unavoidable (Ali et al., 2020).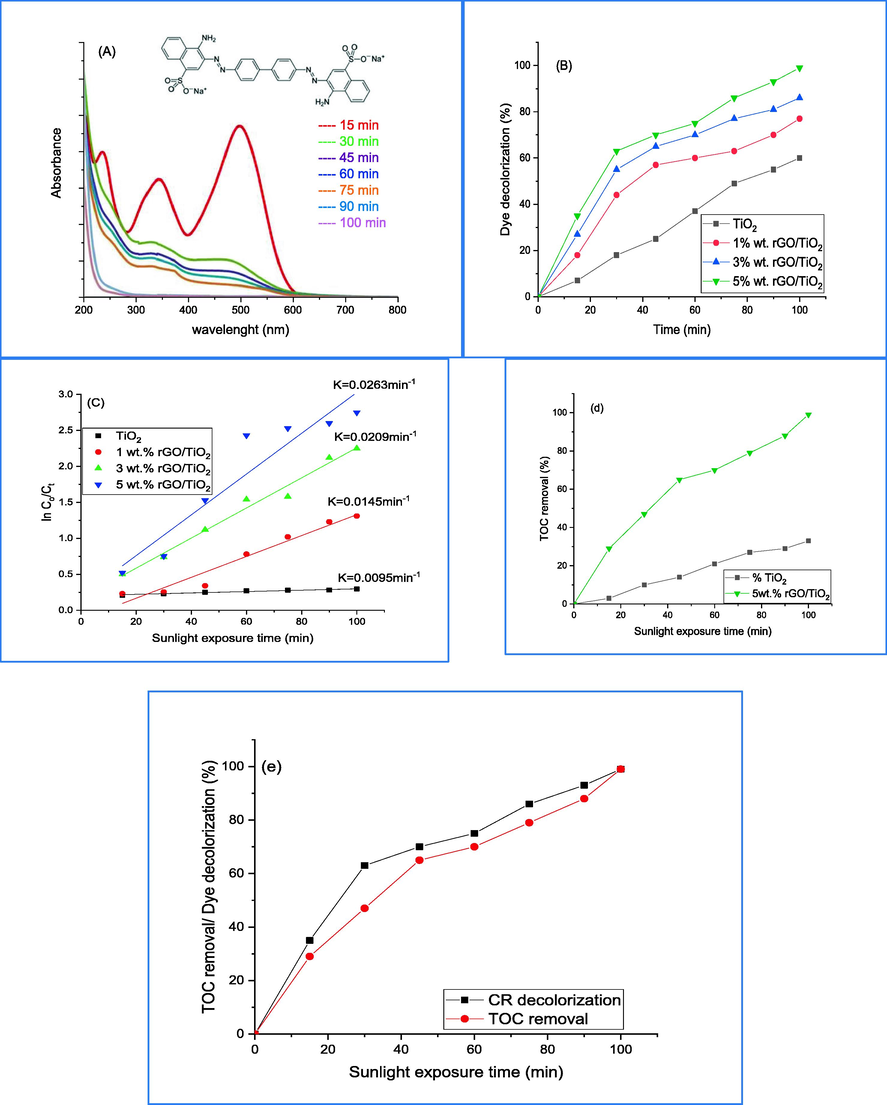
(A) CR decolorization UV–Vis spectrum at different time over 5 wt% rGO-TiO2, (B) comparison CR decolorization over pure and wt.% rGO-TiO2, (C) investigation plot of decolorization rate, (D) TOC removal of CR dye over pure and 5 wt% rGO-TiO2, (E) comparison of decolorization and mineralization of CR dye over 5 wt% rGO-TiO2.
3.3 LC-Ms
The study investigated the liquid chromatography-mass spectroscopy analysis of photodegradation of CR dye under sunlight exposure for two different periods of time, namely 60 and 120 min, using 5%rGO/TiO2 (Fig. 8a,b) depict LC-MS spectra which exhibit distinct peaks at varying (m/z) values that correspond to intermediate compounds, thus providing confirmation of the photodegradation of CR dye. The suggest pathway of CR dye photodegradation by using 5%rGO/TiO2 is shown in Fig. 7. Firstly, the mechanism suggests that the cleaving of amine group and oxygenation of dye leads to the formation of a new compounds with m/z 679 and 680 (Bhat et al., 2020) as shown in Fig. 8a. The results show two intensity peaks with m/z ratio of 244 and 207, which assign to hydroxnapthalane −1-sulfonic acid result from cleavage of C6H6 ring, N⚌N and C-NFurthermore, the sustained activity of the OH free radical leads to the formation of 4-carboxybutanoate and naphthalene with respective molecular weights of 138 and 122 (Bhat et al., 2020). ROS, or reactive oxidative species, can cause the cleavage or reduction of sulfonic, amine nitro, and hydroxyl groups that are bonded with a C6H6 ring. This process results in the production of 3-carboxyprppanoate, malonic acid, and malonate with m/z ratio of 120, 108 and 101 respectively (Shaban et al., 2017). The intermediate compounds of the thesis were effectively mineralized to CO2 and H2O. The LC-MS findings indicated that complete degradation of CR under sunlight was achieved after 120 min using 5%rGO/TiO2. The proposed mechanism for CR decolorization is visually presented in Fig. 9.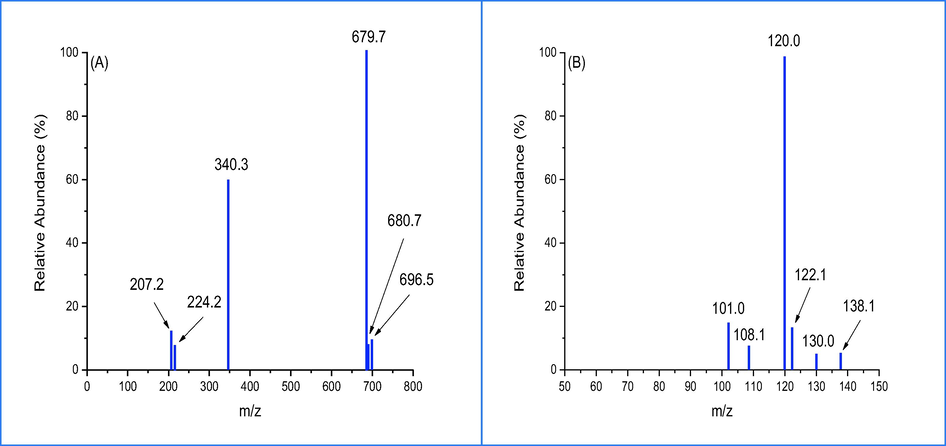
LC-MS of CR dye (A) before and (B) after decolorization.
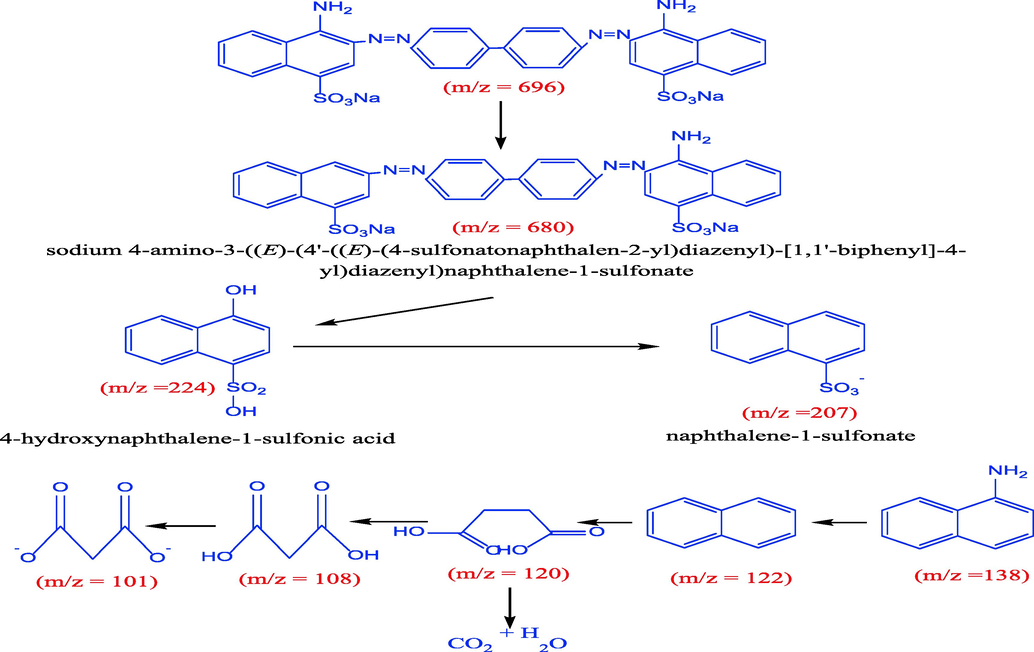
Proposed decolorization path of CR dye.
3.4 The photocatalytic activity
The study examined the photocatalytic capabilities of synthesized compounds in the degradation of CR dye under direct sunlight. The photodegradation outcomes are presented in Fig. 10, which illustrates the decline of CR dye in pure and rGO-integrated TiO2 nanocomposites with varying rGO concentrations (1%, 3%, and 5%). The concentration of CR dye prior to and after degradation under direct sunlight is represented by Co and Ci, respectively. The findings demonstrate that a mere 8% of CR dye underwent self-degradation when exposed to sunlight. However, the other photocatalysts that were prepared exhibited outstanding activity, with a 99% success rate achieved by 5%rGO-TiO2. The results displayed in Fig. 10 demonstrate that samples incorporating rGO exhibit a greater capacity for CR dye compared to pure TiO2. This can be attributed to the increased surface area and π–π system present in the rGO structure, which enhances the rate of reaction (Movahedi et al., 2009). The incorporation of rGO played a significant role in promoting the generation of hydroxyl free radicals, which ultimately results in the enhancement of congo red dye molecule breakdown through direct attack.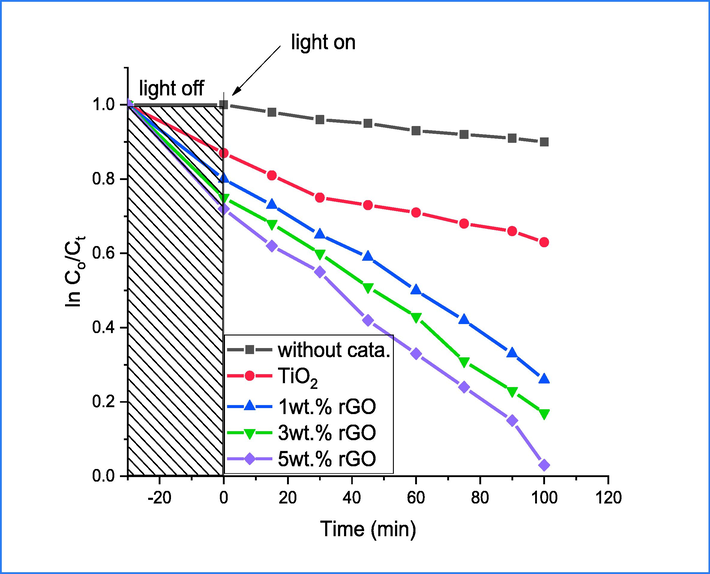
Photodegradation of CR over catalyst.
3.5 Electrochemical impedance (EIS) measurements
In order to predict the behavior of photo-excited carriers in the future, the electrochemical impedance spectrum (EIS) was utilized to study the transport and recombination characteristics of electron-hole carriers. The prepared samples were subjected to an applied bias of 0–0.5 V, and their Nyquist plot is depicted in Fig. 11. The typical plot demonstrating the photodegradation of congo red dye comprises two semicircles, which correspond to high and low frequency and represent charge transport resistance (Rct) and charge recombination process (Rrec), respectively. The presence of two semicircles on the plot indicates that the degradation process involves the transfer or recombination of electrons-holes, which is an important step in determining the rate of degradation. The values of resistances (Rs, Rct and Rrec) of prepared samples are summarized in Table. 2. The Rs values exhibit a decline as the rGO doping level rises. Conversely, the Rrec values experience an increase as the doping ratio increases, signifying the efficient separation of e-h with minimal recombination. The findings suggest that the sample doped with 5 wt% rGO exhibits activity in the photodegradation of CR dye, while also indicating that the easy inclusion of rGO can enhance carrier transportation. It is possible that the recombination process reduction can be attributed to two factors related to rGO. Firstly, the rGO may capture photoinduced excitons, which would lead to an increase in carrier concentration. Secondly, the rGO may serve to increase the surface area of TiO2, thus promoting rapid transfer of photoinduced electrons to adsorbed oxygen on the surface of TiO2 (Raya et al., 2022).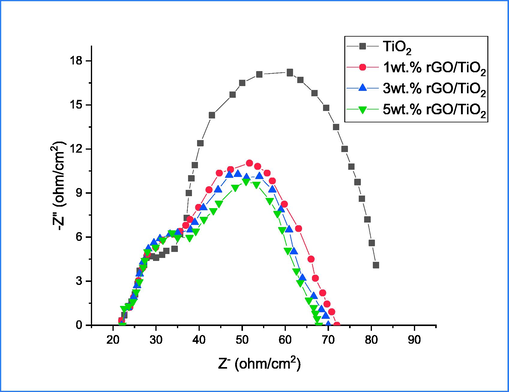
EIS of pure and %rGO-TiO2 under illumination conditions.
Sample
Rs
Rrec
Rct
TiO2
14
22
35
1 wt% rGO
15.10
82.45
21.56
3 wt% rGO
17.02
185.4
20.43
5 wt% rGO
12.56
300.23
18.06
3.6 Charge electronic transference process and band diagram
In order to examine the electronic charge transfer process, we conducted PL spectrum and cyclic voltammetry (CV) analysis on both pure and 5 wt% rGO-TiO2. The PL spectrum of both prepared samples were showed and discussed in Fig. 4. The results demonstrate that both samples exhibit a similar spectrum, indicating comparable defects and electronic structure. The PL data confirms that the inclusion of TiO2 in rGO effectively prevents charge recombination more than pure TiO2. However, the rate constant of standard heterogeneous, which determines the rate of electron transport in each material, was calculated using the Nicholson method (Martín-Yerga et al., 2016) and obtained through CV techniques under both dark and illuminated conditions. Fig. 12 presents the findings of an investigation on CVs utilizing thin-film electrodes composed of pure and 5 wt% rGO-TiO2. It seems that the cyclic voltagram for illumination did not exhibit frequent modulation with the dark voltagram for each of the electrodes that were prepared. The study found that compared to dark conditions, illuminating a pure TiO2 electrode resulted in an increase in ΔE of 0.460 V vs. SCE. In contrast, the 5 wt% rGO-TiO2 electrode showed a decrease in ΔE under illumination (0.468 V vs. SCE) compared to dark conditions (0.487 vs. SCE), as reported in Table 3.Under illumination conditions, the expansion of ΔE values for both electrodes and a decrease in the current of reduction and oxidation density are induced, as shown in Table. 3. For the standard heterogeneous rate constant (ko) calculation, the coefficient of diffusion utilized were DR = Do = 0.726 * 10-5cm2/s and the ko values are displayed in Table. 3 (Soares et al., 2016). The Ko values exhibited a degree of proximity, and the presence of a 5 wt% rGO-TiO2 heterostructure resulted in decreased electron transfer. The process of illumination was observed to decrease electron transport in the electrode, indicating a possible increase in recombination. The 5 wt% rGO-TiO2 heterostructure demonstrates that the absorbed light by doped rGO induces a noteworthy photothermal effect in the photocatalyst, thereby facilitating an increase in charge transfer (Low et al., 2017; Di et al., 2018; Merrad et al., 2023). The findings reveal that TiO2 nanoparticles exhibit slightly higher Ko and recombination rates compared to the 5 wt% rGO-TiO2 heterostructure. This suggests the importance of achieving a balance between recombination process and electron transport in the heterostructure sample, which ultimately enhances the photocatalytic efficiency.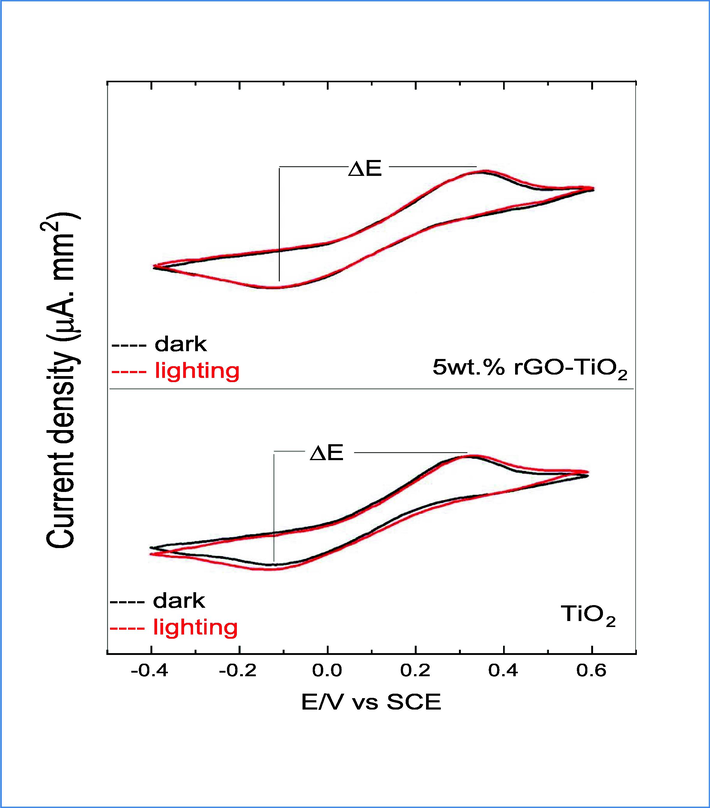
Cyclic Voltammograms of pure and 5 wt% rGO-TiO2 electrodes in dark and lighting conditions.
Electrodes
Δ E
(V vs. SCE)i density oxidation
(μA/mm2)i density reduction
(μA/mm2)Ko
(cm/s)
TiO2 – dark
0.425
2.70
−2.43
TiO2 – lighting
0.460
2.65
−2.55
−0.127
5 wt% rGO-TiO2 – dark
0.468
2.75
−2.67
5 wt% rGO-TiO2 – lighting
0.487
2.60
−2.79
−0.133
3.7 Reusability of studies
To investigate the reusability of 5 wt% rGO-TiO2 binary nanocomposite, a cycling experiment was carried out on CR dye up to four cycles and the results are shown in Fig. 13. After each cycle, 5 wt% rGO-TiO2 was separated and washed to remove the CR dye and then dried at 80 °C for 10 h to utilize it for adsorption and photodegradation. The ratio of nanocomposite sample to dye concentration employed in the first cycle was maintained throughout subsequent cycles. The results indicate that the sample exhibits high capability with increasing cycle number, which suggests a high level of stability and potential suitability for the photodegradation of dyes.
The reusability of 5wt.%rGO-TiO2 for up to four cycles.
3.8 Mechanism of CR photodegradation
Before proposing the mechanism of degradation, it is crucial to consider the scavenger effect in the study. This entails taking into account the presence of ROS, including hydroxyl free radicals, superoxide anions, as well as holes and electrons, which are all highly significant (Baruah et al., 2021). Four compounds of sliver nitrate (e-), mannitol (OH*), benzoquinone (h+) and triethanolamine O2–* were used as a scavenger for examining the effect of radical (Fig. 14) on the photodegradation of CR under sunlight. The findings indicate that scavenger compounds significantly reduce photodegradation efficiency by more than 50%. However, the use of AgNO3 does not appear to have an effect on the photodegradation mechanism. The application of benzoquinone as a scavenger is substantiated by its crucial role in the mechanism pathway (Ali et al., 2022), which signifies its primary involvement in the generation of OH* from water and consequent degradation of CR dye. The addition of benzoquinone to the reaction system resulted in the inhibition of CR degradation.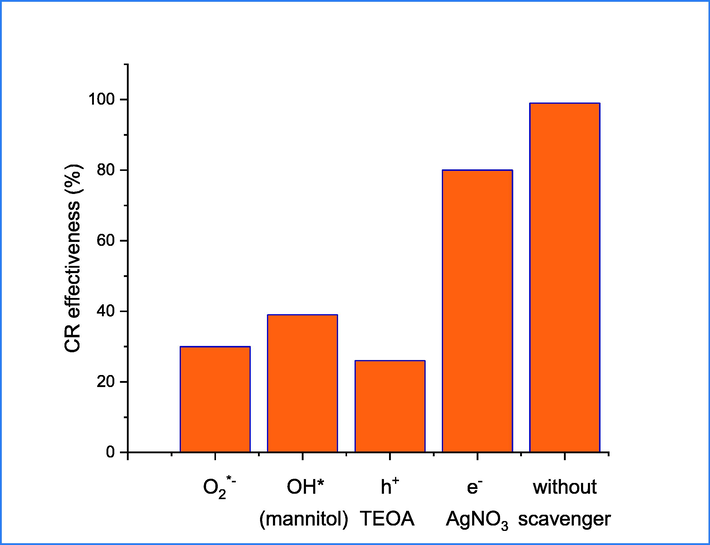
photodegradation of CR under different scavenger.
The integration of rGO with TiO2 is considered a viable option for facilitating the transfer and acceptance of excited electrons from the TiO2 CB. This is primarily due to the planar structure, as depicted in Fig. 15. The rapid separation of carriers, achieved through the incorporation of a substance, has been observed to contribute to the restraint of electron-hole recombination process and achieve high rates. Additionally, this incorporation has been shown to improve the visible light adsorption of TiO2 and expand it in comparison with pure TiO2. The rGO/TiO2 photo catalyst exhibits a high level of efficiency in the adsorption of the CR dye due to its planar structure, which facilitates a platform for the dye to be adsorbed.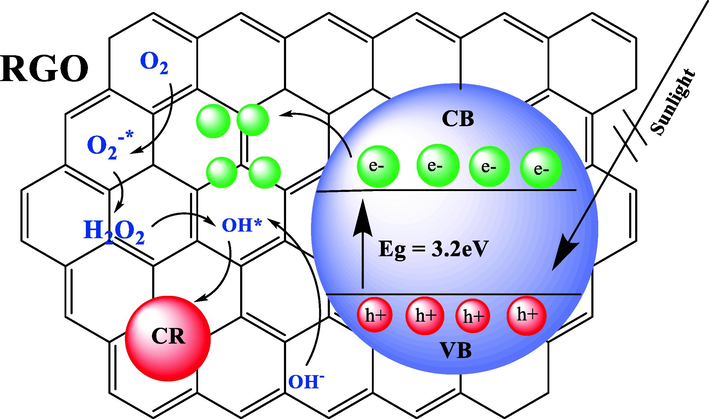
Proposed mechanism CR photodegradation at optimum condition over 5 wt% rGO-TiO2.
3.9 Computational details
Theoretical analysis was conducted on various pH levels using the Gaussian 09 W software. The optimization of geometry and reactivity of congo red dye towards catalyst were investigated and carried out via density function theory (DFT) with Backers parameter of exchange functional (Ali et al., 2022). Additionally, a split-valance double zeta basis set 6.31G(d) and Lee-Yang-Parr (B3LYP) correlation function was employed in the calculation (Becke, 1993). Upon optimization, several theoretical properties were examined, including HOMO, LUMO, ionization energy, electron affinity, softness and hardness. The DFT calculations indicate a relationship and interaction between the 5wt.%rGO-TiO2 catalyst and both anionic and cationic congo red dyes (Koch and Holthausen, 2015). Theoretical reactivity parameters such as E HOMO, E LUMO, softness, hardness, electrophilicity and electronic chemical potential were determined using a reaction catalyst and Congo Red dye species (CR—N⚌NH, CR⚌N—NH and CR—N⚌N). The obtained results are presented in Fig. 16 and Table. 4.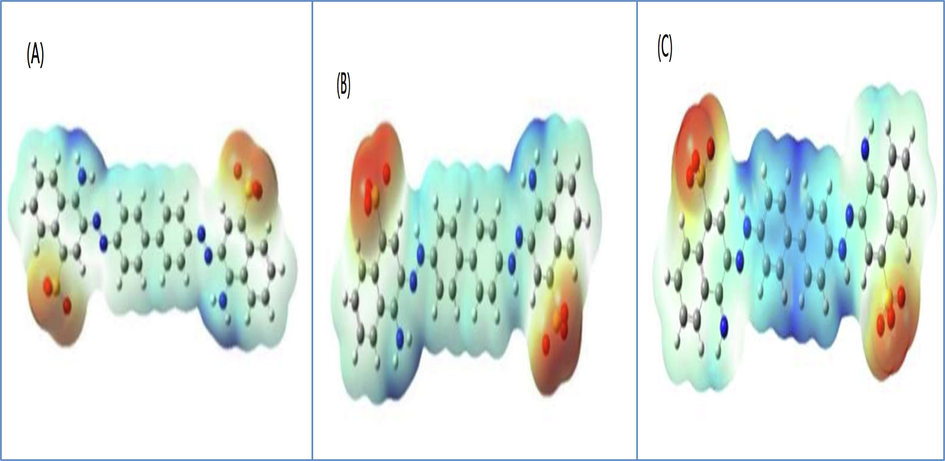
Electron density mapping of (A) CR-N = N, (B) CR-N = NH and (C) CR = N-NH.
Dye species
E(eV)
HOMOE(eV)
LUMOEg
(eV)η
S
softnessμ
CR-N = N
−6.1
−5.7
−0.4
3.25
0.31
−5.9
5.36
CR-N = NH
−5.4
−4.2
−1.2
3.30
0.30
−4.8
3.49
CR = N-NH
−8.9
−5.4
−3.5
6.22
0.16
−7.15
4.11
The chemical hardness, softness and electronic chemical potential calculated from the following equations (Domingo et al., 2016; Parr and Yang, 1984):
Generally, The exchange capacity of electron density among congo red species dye is contingent upon the potential of chemical electronic (μ) (Parr et al., 1999). When the molecules exhibit high values of μ, it indicates the presence of potent electron-acceptor molecules. Conversely, a low value of η signifies increased reactivity (Bredas, 2014). The high value of , has an inverse effect on the ability of dye species to accept electron load. According to the data presented in Table 3, the smallest value of parameter η is associated with CR—N⚌N species, which makes it more likely to interact with 5wt.%rGO-TiO2 compared to other species. Furthermore, this species has the smallest energy gap when compared to other species, which accelerates photodegradation by promoting recombination of hole-electron pairs (Valadi et al., 2020). At low pH, the CR—N⚌NH species exhibits electrophilicity of 3.49, which is lower than that of CR—N⚌N and CR⚌N-NH, which have electrophilicities of 5.36 and 4.11, respectively. This makes it easier for the CRN⚌NH species to be oxidized by OH free radicals and O super anions. Additionally, in an acidic medium, TiO2 forms TiOH2 which can adsorb more anionic species of CR-N⚌NH and CR⚌N-NH, thus improving its degrading capabilities (Thomas et al., 2016; Soares et al., 2021).
4 Conclusion
To summarize, the incorporation of TiO2 in rGO led to an improvement in light absorption within the visible region. Additionally, this process effectively eliminated undesired electron-hole pairs through enhanced transfer of photogenerated electrons to reductants. It was also observed that superoxide anion radicals played a crucial role in the photocatalytic mineralization and decolorization. A series of TiO2 binary nanocomposites with varying weight ratios of rGO were produced using the photolysis-humer modified method. The photocatalytic performance of each composite was assessed for its ability to remove congo red dye (CR) when exposed to direct sunlight. The incorporation of rGO in anatase TiO2 surface was characterized by XPS, Raman and XRD. The UV–Vis spectrum of rGO-TiO2 nanocomposite exhibited a red shift and a reduction in band gap energy compared to pure TiO2.The XRD analysis revealed that the decrease in rGO ratio corresponded with a reduction in crystalline size. The doping process caused a change in lattice parameters, indicating that rGO may have entered the crystal lattice of TiO2.The TEM analysis reveals that the rGO sheets contain TiO2 particles with a size of approximately 10 nm and are evenly dispersed. The nanocomposite with a 5 wt% concentration of rGO-TiO2 exhibited the least intense photoluminescence and the highest level of activity due to a reduction in electron-hole recombination, a decrease in Rct, and an increase in the production of potential oxidizing species. The improved photocatalytic effectiveness of rGO-doped TiO2 with respect to pure TiO2 results from various factors. (i), the morphology exhibits well-dispersed anatase TiO2 nanoparticles throughout rGO sheets. (ii), the reduction characteristics of rGO play a role. (iii), there is a sharp increase in visible light absorption. (iv), there is a decrease in the band gap. (v), faster electron transport and reduced recombination of charge carriers contribute to the enhanced efficiency. Recycling experiments demonstrate high stability and integrity of 5 wt% rGO-TiO2.
5 Author statement
We know of no conflict of interest associated with this publication, and there has been no financial support for this work that could have influenced its outcome as corresponding author, I confirm that the manuscript has been read and approved for submission by all the named authors.
Declaration of Competing Interest
We wish to confirm that there are no known conflicts of interest associated with this publication and there has been no significant financial support for this work that could have influenced its outcome.
References
- A facile method for synthesis rGO/Ag nanocomposite and its uses for enhancing photocatalytic degradation of Congo red dye. SN Appl. Sci.. 2022;4:276.
- [CrossRef] [Google Scholar]
- Photocatalytic degradation of congo red dye from aqueous environment using cobalt ferrite nanostructures: development, characterization, and photocatalytic performance. Water Air Soil Pollut.. 2020;231:50.
- [CrossRef] [Google Scholar]
- Eco-friendly highly efficient BN/rGO/TiO2 nanocomposite visible-light photocatalyst for phenol mineralization. Environ. Sci. Pollut Res.. 2021;28:62771-62781.
- [CrossRef] [Google Scholar]
- Synthesis of Chitosan-TiO2 Nanocomposite for Efficient Cr (VI) Removal from Contaminated Wastewater Sorption Kinetics, Thermodynamics and Mechanism. Journal of Oleo. Science. 2023;72(3)
- [Google Scholar]
- Treatment of saline produced water through photocatalysis using rGO–TiO2 nanocomposites. Catal. Today 2018
- [CrossRef] [Google Scholar]
- Silver nanoparticles decorated on the surface of reduced graphene oxide coated titanium oxide nanocomposite for enhanced electrochemical supercapacitance performance. Ionics. 2022;28:4793-4804.
- [CrossRef] [Google Scholar]
- Photocatalytic degradation of tartrazine dyes using TiO2–Chitosan beads under sun light irradiation. Russ. J. Phys. Chem.. 2021;95:1069-1076.
- [CrossRef] [Google Scholar]
- Synthesis, characterization of novel Fe-doped TiO2 activated carbon nanocomposite towards photocatalytic degradation of Congo red, E. coli, and S. aureus. Korean J. Chem. Eng.. 2021;38:1277-1290.
- [CrossRef] [Google Scholar]
- A new mixing of Hartree-Fock and local density-functional theories. J. Chem. Phys.. 1993;98:1372-1377.
- [Google Scholar]
- Photocatalytic degradation of carcinogenic Congo red dye in aqueous solution, antioxidant activity and bactericidal effect of NiO nanoparticles. J. Iran Chem. Soc.. 2020;17:215-227.
- [CrossRef] [Google Scholar]
- Enhanced photocatalytic activities of low-bandgap TiO2-reduced graphene oxide nanocomposites. J Nanopart Res. 2017;19:200.
- [CrossRef] [Google Scholar]
- Simultaneous realization of direct photodeposition and high H2-production activity of amorphous cobalt sulfide nanodot-modified rGO/TiO2 photocatalyst. Rare Met.. 2021;40:3125-3134.
- [CrossRef] [Google Scholar]
- Photoluminescence properties of TiO2 nanofibers. J Nanopart Res. 2017;19:129.
- [CrossRef] [Google Scholar]
- Facile synthesis and enhanced visible-light photocatalytic activity of novel p-Ag3PO4/n-BiFeO3 heterojunction composites for dye degradation. Nanoscale Res Lett. 2018;13:257.
- [CrossRef] [Google Scholar]
- Applications of the conceptual density functional theory indices to organic chemistry reactivity. Molecules. 2016;21:748.
- [Google Scholar]
- Photocatalytic performance of Cu2O-loaded TiO2/rGO nanoheterojunctions obtained by UV reduction. J Mater Sci. 2017;52:6754-6766.
- [CrossRef] [Google Scholar]
- GO/TiO2-decorated electrospun polyvinylidene fluoride membrane prepared based on metal-polyphenol coordination network for oil–water separation and desalination. J. Mater. Sci.. 2022;57:3452-3467.
- [CrossRef] [Google Scholar]
- Preparation and photocatalytic degradation activity of TiO2/rGO/polymer composites. Colloid Polym. Sci.. 2015;293:1151-1157.
- [CrossRef] [Google Scholar]
- Synthesis and characterization of TiO2/Au nanocomposite using UV-Irradiation method and its photocatalytic activity to degradation of methylene blue. Asian J. Chem. 2018;30
- [Google Scholar]
- Optimizing the preparation parameters of GO and rGO for large-scale production. J. Mater. Sci.. 2016;51:5664-5675.
- [CrossRef] [Google Scholar]
- The Scherrer equation versus the 'Debye-Scherrer equation' Nature Nanotech.. 2011;6:534.
- [CrossRef] [Google Scholar]
- TiO2-reduced graphene oxide nanocomposites for the trace removal of diclofenac. SN Appl. Sci.. 2020;2:840.
- [CrossRef] [Google Scholar]
- Propose of high performance resistive type H2S and CO2 gas sensing response of reduced graphene oxide/titanium oxide (rGO/TiO2) hybrid sensors. J Mater. Sci: Mater. Electron. 2020;31:3695-3705.
- [CrossRef] [Google Scholar]
- The effect of temperature and type of peroxide on graphene synthesized by improved Hummers’ method. Int. Nano Lett.. 2016;6:211-214.
- [CrossRef] [Google Scholar]
- A Chemist’s Guide to Density Functional Theory. Hoboken, NJ, USA: John Wiley & Sons:; 2015.
- Investigation of Raman and photoluminescence studies of reduced graphene oxide sheets. Appl. Phys. A. 2012;106:501-506.
- [CrossRef] [Google Scholar]
- Photodegradation of methylene blue under direct sunbeams by synthesized anatase titania nanoparticles. SN Appl. Sci.. 2019;1:280.
- [CrossRef] [Google Scholar]
- Hydrothermal synthesis of 3D urchin-like Ag/TiO2/reduced graphene oxide composites and its enhanced photocatalytic performance. J Nanopart Res. 2016;18:283.
- [CrossRef] [Google Scholar]
- Origin of visible light photoactivity of reduced graphene oxide/TiO2 by in situ hydrothermal growth of undergrown TiO2 with Graphene Oxide. J. Phys. Chem. C. 2013;117:16734-16741.
- [Google Scholar]
- Preparation of N-TiO2/RGO nanocomposites through sol-gel method. Korean J. Chem. Eng.. 2021;38:1913-1922.
- [CrossRef] [Google Scholar]
- Photosynthesis of AgBr doping TiO2 nanoparticles and degradation of reactive red 120 dye. J. Adv. Pharm. Education Res.. 2018;8
- [Google Scholar]
- Enhanced photovoltaic performance of dye-sanitized solar cell with tin doped titanium dioxide as photoanode materials. Chalcogenide Lett.. 2021;18(12)
- [Google Scholar]
- Synthesis and supercapacitor performance of polyaniline-titanium dioxide-samarium oxide (PANI/TiO2-Sm2O3) nanocomposite. Chem. Pap.. 2022;76:1401-1412.
- [CrossRef] [Google Scholar]
- The efficacy of samarium loaded titanium dioxide (Sm: TiO2) for enhanced photocatalytic removal of rhodamine B dye in natural sunlight exposure. J. Mol. Struct.. 2022;1253
- [Google Scholar]
- Electron transport in dye-sanitized solar cell with tin-doped titanium dioxide as photoanode materials. J. Mater. Sci.: Mater. Electron.. 2022;33
- [Google Scholar]
- Functionalize cobalt ferrite and ferric oxide by nitrogen organic compound with high supercapacitor performance. Results Chem.. 2023;5
- [CrossRef] [Google Scholar]
- Electrochemical characterization of ordered mesoporous carbon screen-printed electrodes. J. Electrochem. Soc.. 2016;163:B176-B179.
- [CrossRef] [Google Scholar]
- Physical properties of the perovskite SrTiO3−δ synthetized by chemical route. J. Mater. Sci.: Mater. Electron. 2023;34:206.
- [CrossRef] [Google Scholar]
- Photocatalytic degradation of chlorazol yellow dye under sunlight irradiation using Ce, Bi, and N co-doped TiO2 photocatalyst in neutral medium. Environ. Sci. Pollut. Res. 2022
- [CrossRef] [Google Scholar]
- Kinetic analysis of p-rGO/n-TiO2 nanocomposite generated by hydrothermal technique for simultaneous photocatalytic water splitting and degradation of methylene blue dye. Environ. Sci. Pollut. Res. 2022
- [CrossRef] [Google Scholar]
- Photodegradation of Congo red in aqueous solution on ZnO as an alternative catalyst to TiO2. JICS. 2009;6:570-577.
- [CrossRef] [Google Scholar]
- Photoluminescence study of anatase and rutile structures of Fe-doped TiO2 nanoparticles at different dopant concentrations. Appl. Phys. A. 2020;126:192.
- [CrossRef] [Google Scholar]
- Density functional approach to the frontier-electron theory of chemical reactivity. J. Am. Chem. Soc.. 1984;106:4049-4050.
- [Google Scholar]
- A review of gas sensors based on carbon nanomaterial. Carbon Lett.. 2022;32:339-364.
- [CrossRef] [Google Scholar]
- Parameters affecting the photocatalytic degradation of dyes using TiO2: a review. Appl Water Sci. 2017;7:1569-1578.
- [CrossRef] [Google Scholar]
- Efficient photodegradation of methyl violet dye using TiO2/Pt and TiO2/Pd photocatalysts. Appl. Water Sci.. 2017;7:3841-3848.
- [CrossRef] [Google Scholar]
- Sunlight-driven photocatalytic degradation of rhodamine B dye by Ag/FeWO4/g-C3N4 composites. Int. J. Environ. Sci. Technol.. 2021;18:927-938.
- [CrossRef] [Google Scholar]
- Electrochemical Fabrication of rGO-embedded Ag-TiO2 Nanoring/Nanotube Arrays for Plasmonic Solar Water Splitting. Nano-Micro Lett.. 2019;11:97.
- [CrossRef] [Google Scholar]
- Photocatalytic degradation and photo-Fenton oxidation of Congo red dye pollutants in water using natural chromite—response surface optimization. Appl. Water Sci. 2017;7:4743-4756.
- [CrossRef] [Google Scholar]
- Ionic liquid-assisted one-step hydrothermal synthesis of TiO2-reduced graphene oxide composites. Nano Res.. 2011;4:795-806.
- [CrossRef] [Google Scholar]
- Plasmonic Au–rGO–TiO2 ternary photocatalyst for photocatalytic hydrogen production and dye degradation. Nanotechnol. Environ. Eng.. 2022;7:119-137.
- [CrossRef] [Google Scholar]
- Absorbance determination and photocatalytic production of hydrogen using tungsten and TiO2 oxide nanostructures As catalyst. Clean. Eng. Technol.. 2021;5:100268
- [Google Scholar]
- Photoelectrochemical and theoretical investigation of the photocatalytic activity of TiO2: N. RSC Adv. 2016
- [CrossRef] [Google Scholar]
- Effective photocatalytic degradation of Congo red dye using alginate/carboxymethyl cellulose/TiO2 nanocomposite hydrogel under direct sunlight irradiation. J. Photochem. Photobiol. A: Chem.. 2016;327:33-43.
- [Google Scholar]
- Selective separation of Congo Red from a mixture of anionic and cationic dyes using magnetic-MOF: experimental and DFT study. J. Mol. Liq.. 2020;318:114051
- [Google Scholar]
- Photocatalytic TiO2/rGO/CuO Composite for Wastewater Treatment of Cr(VI) Under Visible Light. Water Air Soil Pollut. 2020;231:223.
- [CrossRef] [Google Scholar]
- One-step hydrothermal synthesis of TiO2 nanowires-reduced graphene oxide nanocomposite for supercapacitor. Ionics. 2019;25:2411-2418.
- [CrossRef] [Google Scholar]
Appendix A
Supplementary material
Supplementary data to this article can be found online at https://doi.org/10.1016/j.arabjc.2023.104992.
Appendix A
Supplementary material
The following are the Supplementary data to this article:Supplementary data 1
Supplementary data 1


