

Translate this page into:
Copper enhanced guanine electrochemical signal for nucleic acids detection in municipal tertiary wastewater
⁎Corresponding author. akawde@sharjah.ac.ae (Abdel-Nasser Kawde)
-
Received: ,
Accepted: ,
This article was originally published by Elsevier and was migrated to Scientific Scholar after the change of Publisher.
Abstract
Abstract
Cu2+-amplified guanine electroanalytical system is developed using clay-modified electrode. Cu2+-guanine complexation is studied and optimized. A high sensor sensitivity of 1.1 µA/µM and a low LOD of 0.16 µM are achieved. The sensor is validated for nucleic acid analysis in wastewater samples.
Abstract
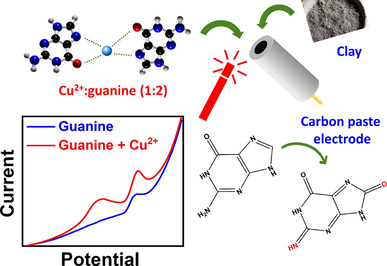
An electroanalytical method is developed for guanine detection based on its electrochemical oxidation on a clay-modified carbon paste electrode (clay-CPE). The electrochemical guanine signal is found to be significantly enhanced upon its complexation with Cu2+ ions. Cu2+-guanine complex formation is studied using UV–Vis spectroscopy and electrochemical pulse voltammetry at different ratios, with 1:2 Cu2+:guanine found to be the optimal stoichiometry. The clay modifier and the electrode are fully characterized using electron microscopy, Fourier-transform infrared, X-ray photoelectron and X-ray fluorescence spectroscopies, and X-ray diffractometry. The analytical method is fully optimized regarding the electrolyte, technique, and electrochemical parameters. A calibration curve is built obtaining a linear range of 0.1–45 µM, a limit of detection of 0.16 µM, a limit of quantification of 0.54 µM, and a sensitivity of 1.1 µA/µM, which are among the best reported so far and achieved with an environmentally friendly and low-cost method. Our system is very selective with minimal interference in the presence of interferents with concentrations as high as 100× that of guanine. The Cu2+-mediated clay-CPE-based analytical method is applied for the detection of nucleic acid in real-life wastewater, which is critical to achieving efficient wastewater treatment. This demonstrates the applicability of our method for environmental purposes and opens the door for other applications as well, such as diagnostics.
Keywords
DNA
Guanine
Copper
Clay
Electrochemical sensor
Modified-CPE

Nomenclature
- A
-
Surface area (cm2)
- C
-
Concentration (mol/cm3)
- Clay-modified CPE
-
CPE/RC
- CPE
-
Carbon paste electrode
- CV
-
Cyclic voltammetry
- D
-
Diffusion coefficient (cm2/s)
- DNA
-
Deoxyribonucleic acid
- DPV
-
Differential pulse voltammetry
- EDX
-
Energy dispersive X-ray spectroscopy
- EIS
-
Electrochemical impedance spectroscopy
- FTIR
-
Fourier-transform infrared spectroscopy
- GCE
-
Glassy carbon electrode
- GPE
-
Graphite pencil electrode
- Ipa
-
Anodic peak current
- LOD
-
Limit of detection
- LOQ
-
Limit of quantification
- LSV
-
Linear scan voltammetry
- n
-
Number of electrons
- NPV
-
Normal pulse voltammetry
- R2
-
Coefficient of determination
- RCT
-
Charge-transfer resistance
- RNA
-
Ribonucleic acid
- Rs
-
Solution resistance
- s
-
Slope of the calibration curve
- SEM
-
Scanning electron microscopy
- Sintered clay-modified CPE
-
CPE/SC
- SWV
-
Square wave voltammetry
- TGA
-
Thermogravimetric analysis
- UV–Vis
-
Ultraviolet–visible
- v
-
Scan rate (V/s)
- XPS
-
X-ray photoelectron spectroscopy
- XRD
-
X-ray diffraction
- XRF
-
X-ray fluorescence
-
Blank standard deviation
1 Introduction
A wide array of chemical and biological substances in municipal wastewater makes the pursuit of wastewater analysis a very attractive research field. Wastewater monitoring is paramount for public health because it provides information about community exposure to infectious diseases, heavy metals, pharmaceuticals, and pesticides (Mahmoudi et al., 2022, Wu et al., 2022, Sudhir, 2022, Huidobro-López et al., 2022, Hena et al., 2021, McClary-Gutierrez et al., 2021, Mao et al., 2021b, Larsen et al., 2021, Iqbal et al., 2021, de Oliveira et al., 2020, Kinuthia et al., 2020, Devault and Karolak, 2020, Ashfaq et al., 2019, Yang et al., 2019, Hwang et al., 2019, Youssef et al., 2019, Hargreaves et al., 2018, Feng et al., 2018, Daughton, 2018, Castiglioni et al., 2014, Kasprzyk-Hordern et al., 2008). Analysis of wastewater has also been applied to detect biological substances, such as hormones (Phoon et al., 2020, Chen et al., 2019, Roudbari and Rezakazemi, 2018).
Nitrogen-containing compounds are hazardous in water sources because they consume dissolved oxygen and reduce the efficacy of water disinfection using chlorine (Novikova et al., 2019, Jia and Yuan, 2016). Seven major nitrogenous compounds have been discovered in bodies of water with concentrations ranging from 20 to 860 µg/L (Liu et al., 2022, Ram and Morris, 1980). It is essential to develop analytical methods for the selective detection of different nitrogenous compounds (Hanson and Lee, 1971). Nucleosides constitute DNA and RNA, and their detection and quantification in municipal wastewater are crucial because they act as precursors for organic chloramines that stifle the antimicrobial efficiency of water disinfection processes and interfere with the analysis of residual chlorine (Liu et al., 2022, Ram and Morris, 1980). Guanine is a purine nucleobase, the main constituent of guanosine nucleoside, a nucleic acid building block. Little progress has been made in the analysis of guanine in wastewater, and most of the reported techniques need large sample volumes and use complex processes, such as mass spectrometry, chemiluminescence, and high-performance liquid chromatography (Brewer and Lunte, 2015, Graven et al., 2014, Haunschmidt et al., 2008, Todd et al., 1995, Kai et al., 1994). These techniques have many drawbacks, such as long sample preparation time, the need for trained personnel, and expensive instrumentation.
Electrochemical techniques have been proven to be rapid, sensitive, and cost-effective analytical methods (AbdelHamid et al., 2023, El-Kordy et al., 2023, Elgamouz et al., 2023, Eftekhari et al., 2021, Kavetskyy et al., 2019), and have been employed for detecting nucleobases such as guanine (Zhang et al., 2019a, Hu et al., 2014). Different types of electrodes could be applied for the electrochemical detection of guanine, among which carbon-based electrodes stand out as a promising candidate. Unlike other electrodes such as gold and mercury, which are challenging to reuse, and have limited potential window and mechanical stability, respectively (Lee et al., 2023, Barman and Jasimuddin, 2014, Barek, 2013, Wehmeyer and Wightman, 1985), carbon-based electrodes have high electrochemical activity, mechanical strength, and electrical conductivity (Papavasileiou et al., 2022, Aladag Tanik et al., 2018, Gao et al., 2014). In particular, carbon paste electrode (CPE) is cost-effective, easy to prepare, and stable. Several electrode additives have been used to improve CPE’s electrochemical activity for guanine detection, such as NdFeO3 (Kumar et al., 2019) and Ag-decorated polyaniline (Yari and Saidikhah, 2016), resulting in high analytical performance. However, the complex nature of these modifiers and their intricate synthesis and processing stifle the practicality and economic application of such electrodes. Materials with less complexity and lower cost need to be studied as electrode modifiers for guanine detection. Clay is an abundant naturally occurring material with very good electrocatalytic activity and thus is very promising as an economic CPE modifier (Jaber et al., 2022, Shahamirifard and Ghaedi, 2019, Thomas et al., 2013). A clay-based CPE could be used for guanine detection without the need for complex materials synthesis and/or processing; however, this has not been reported earlier.
Cu2+ has been used as an electrochemical response amplifier for purine base detection, producing a good stripping voltammetric signal (Wang and Kawde, 2002, Shiraishi and Takahashi, 1993). Cu2+ is known to form a complex with guanine where 2 guanine ligands chelate one Cu2+ ion through N(7) and carbonyl oxygen (Rana et al., 2014). However, the effect of complex stoichiometry was neither studied nor optimized for electrochemical signal amplification, and there are no prior reports on a Cu2+-enhanced electrochemical system using clay-modified CPE.
In the present study, an electrochemical analytical system was developed using clay as a CPE modifier, employing a signal amplification strategy based on Cu2+-guanine complex formation. This resulted in a highly sensitive guanine analytical system with excellent performance and highly competitive analytical parameters, achieving a wide linear range of 0.1–45 µM, a limit of detection (LOD) of 0.16 µM, a limit of quantification (LOQ) of 0.54 µM and a sensitivity of 1.1 µA/µM. The system showed high tolerance in the presence of interferents as high as 100× the concentration of guanine, in addition to high repeatability, reproducibility, and stability. Moreover, when applied for wastewater analysis, the system proved highly practical, detecting and quantifying guanine in a municipal tertiary wastewater sample contaminated with nucleic acid material.
This is the first report of using a natural clay CPE modifier for electrochemical guanine detection, which we have coupled with Cu2+-mediated signal amplification, demonstrating excellent and highly competitive analytical performance. It is also the first study on Cu2+-guanine complex stoichiometry optimization for maximal signal amplification. The developed guanine analytical system provides a practical, facile, rapid, low-cost, and highly sensitive method for nucleic acid analysis in wastewater, which would have a significant impact on improving wastewater treatment efficiency. In addition, guanine is a critical biomolecule with vast biological functions, ranging from cell signaling and energy supply to regulating enzymatic processes, blood flow, and neurotransmitter release. Abnormal guanine level is an important marker of immune deficiency and could indicate serious diseases such as cancer, epilepsy, and acquired immunodeficiency syndrome (Zhang et al., 2019b, Ibrahim et al., 2016, Wang et al., 2014). Thus, our method could also be applied for guanine analysis for diagnostics, which demonstrates the impact our method would have in different fields.
2 Experimental
In this section, we describe in detail the chemicals and reagents used, the electrode preparation process, instrumentation and characterization, and the electrochemical testing techniques employed.
2.1 Chemicals and reagents
The chemicals used in this study are of analytical grade and were used as received. Calf thymus DNA (A260/280 nm: ≥1.8) was used as the nucleic acid contaminant model. Guanine hydrochloride (≥99%), sodium hydroxide (98%), hydrochloric acid (37%), acetic acid (99%), sodium acetate trihydrate (99%), copper sulfate pentahydrate (>98%), ascorbic acid (≥99%), sucrose (99.5%), potassium nitrate (>99%), magnesium sulfate heptahydrate (>98%), urea (99.5%), citric acid (≥99%), sodium chloride (≥99%), potassium chloride (99.5%) were purchased from Sigma-Aldrich, USA. Clay was collected locally and processed per our previous work (Jaber et al., 2022). Sintered clay was prepared by heat treating raw clay at 1000 °C for 2 h in an air atmosphere. Ultrapure water was obtained using Elix® Essential 5 water purification system. Guanine hydrochloride stock solution was prepared in 1 M NaOH and then diluted using an acetate buffer at a pH of 4.5.
2.2 Electrode preparation
Clay-modified carbon paste working electrode was used for studying Cu2+-guanine complexation electrochemically and to develop the Cu2+-enhanced guanine electroanalytical system. CPE preparation was carried out according to our reported method (Jaber et al., 2022). The CPE was prepared by mixing graphite, clay, and mineral oil with different ratios as described below using a mortar and pestle for 15 min to form a homogenous paste. The paste was then loaded into 3D-printed hollow electrode bodies (diameter = 2 mm) fitted with copper wires as conductors. Three working electrodes were used; the first was unmodified CPE, comprising 70 wt% graphite and 30 wt% mineral oil. The second and third were clay-modified CPE (CPE/RC) and sintered clay-modified CPE (CPE/SC), comprising 65 wt% graphite, 30 wt% mineral oil, and 5 wt% raw and sintered clay, respectively, as shown in Table 1.
Electrode
Graphite (wt.%)
Clay (wt.%)
Mineral oil (wt.%)
CPE
70
0
30
CPE/RC
65
5
30
CPE/SC
65
5
30
2.3 Instrumentation
A box furnace (Carbolite, Type ELF 11/6B, UK) was used for clay sintering. The morphology and elemental composition of the clay powders and clay-modified CPE were studied by scanning electron microscopy (SEM) coupled with energy-dispersive X-ray spectroscopy (EDX) (Tescan Vega3, Czech Republic) at a voltage of 20 kV. Clay surface functional groups were characterized using Fourier-transform infrared spectroscopy (FTIR) (Bruker Tensor II, Germany) via the attenuated total reflectance mode in the range of 4000–400 cm−1. Powder X-ray diffraction (XRD) was used to examine the clay crystal structure using Bruker D8 Advance (Germany) with a Cu source wavelength of 0.15406 nm, a voltage of 40 kV, and a current of 40 mA. X-ray Fluorescence (XRF) was done to study the clay composition using Philips PW-1410 (Netherlands) using a PE crystal and a Cr target at 50 kV and 40 mA. Thermo Scientific Nexsa G2 Surface Analysis (USA) X-ray photoelectron spectroscopy (XPS) system supplied with monochromatic Al Kα X-ray (1486.6 eV) and operated under a pressure of ∼10−9 mbar was employed for clay surface chemistry analysis. Thermogravimetric analysis (TGA) was carried out in the temperature range of 30–800 °C at 10 °C/min in an air atmosphere using Shimadzu TGA-50 (Japan) to investigate the thermal weight change profiles of raw and sintered clay. Thermo Scientific Multiskan GO spectrophotometer (USA) was used for the UV–Vis study of Cu2+-guanine complexation. pH of buffers and other solutions was measured using OHAUS Starter 2100 pH meter (USA). Electrochemical analysis for studying Cu2+-guanine complexation and electrochemical sensor development was carried out using CHI 1232a electrochemical workstation (USA).
2.4 Electrochemical testing
All electrochemical experiments comprised a three-electrode system consisting of a platinum wire as the counter electrode, an Ag/AgCl (1.0 M KCl) reference electrode, and unmodified and clay-modified CPEs as the working electrodes. The electrochemical characterization of the electrodes was done in an equimolar solution (5 mM) of Fe(CN)63−/Fe(CN)64− prepared in 0.1 M KCl using cyclic voltammetry (CV) at a window of −0.2 V to + 0.75 V, and at different scan rates ranging from 5.00 mV/s to 200 mV/s. Electrochemical impedance spectroscopy (EIS) was conducted at a frequency range of 106–0.05 Hz and a voltage amplitude of 5.0 mV to study the electrode’s resistance profile. Electrochemical detection of guanine was carried out in the voltage range of −0.2 to +1.6 V using different voltammetric techniques as described in the Results and Discussion Section.
2.5 Analysis of municipal tertiary wastewater
Our analytical method was applied for analyzing municipal tertiary wastewater collected from a public irrigation area in Sharjah, UAE, which was used as received without further processing. Calf thymus DNA was used as the nucleic acid contaminant. It was spiked into the wastewater and digested using 1 M HCl in a boiling water bath for 2 h, followed by neutralization using 1 M NaOH (Gao et al., 2014). Using the standard addition method, the released guanine concentration was determined via the Cu2+-enhanced guanine sensor.
3 Results and discussion
CPE was used as the working electrode due to its low cost and ease of preparation and regeneration. 5 wt% clay was used as an electrode additive to improve the electrode’s electrochemical activity, according to our previous work (Jaber et al., 2022). We studied two different forms of clay; raw clay and sintered clay at 1000 °C. Both forms of clay displayed similar morphology under FESEM (Fig. 1a, b). However, their surface chemistry was different, as shown by FTIR (Fig. 1c), where raw clay showed multiple bands at 3543.2 cm−1 due to O–H stretching, 1640.7 cm−1 assigned to C⚌O stretching, and H—O—H bending, 1424.7 cm−1 assigned to C—H bending, 982.7 cm−1 attributed to Si—O and Al—O stretching, and 796.7 cm−1 due to O—H bending. In addition, peaks were detected at 636.6 cm−1, 523.5 cm−1, and 462.0 cm−1, corresponding to Si—O—Si bending vibrations (Jaber et al., 2022, Fonseca et al., 2010, Ekosse, 2005). The splitting of the O—H stretching band at 3543.2 cm−1 could be attributed to the contribution of both residual water and hydroxylated alumina (Jaber et al., 2022, Zabihi et al., 2015).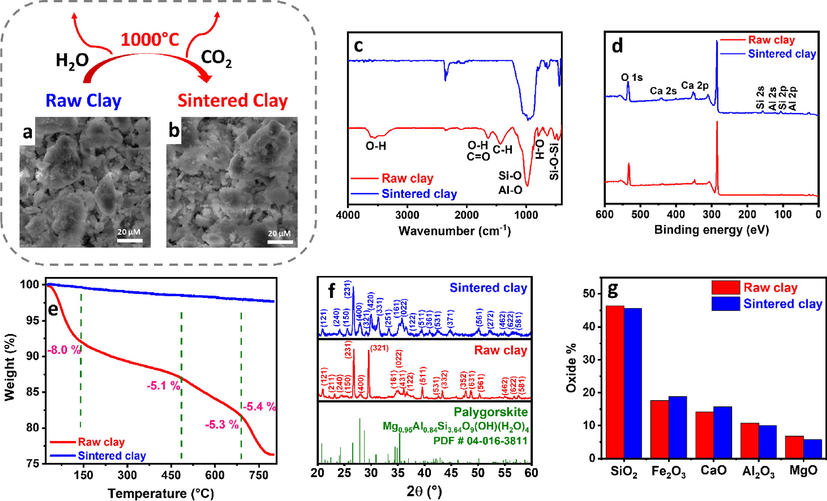
(a–b) SEM images, (c) FTIR spectra, (d) XPS spectra, (e) TGA profiles, (f) XRD patterns, and (g) XRF-derived oxide content of raw and sintered clay.
After sintering the clay at 1000 °C for 2 h, only metal–oxygen bond peaks could be observed, indicating dehydration and decomposition of hydroxides and carbonates. To further investigate such transformation, clay thermal decomposition was studied using TGA (Fig. 1e). Raw clay showed weight losses of 8.0 wt%, 5.1 wt%, 5.3 wt%, and 5.4 wt% at ∼140 °C, ∼485 °C, ∼690 °C and ∼800 °C, respectively, which could be attributed to surface water loss, clay pre-dehydration, dehydroxylation and carbonate decomposition, respectively (Jaber et al., 2022). On the contrary, sintered clay showed only a minimal loss of ∼2.3%, indicating that it is mainly composed of dehydrated oxides with minimal hydroxyl and carbonate groups. The surface chemistry of raw and sintered clay was studied using XPS showing C 1s, O 1s, Ca 2s, Ca 2p, Si 2s, Si 2p, Al 2s, and Al 2p peaks, indicating the abundance of oxides and/or hydroxides of Si, Ca, and Al on the clay surface (Fig. 1d). The core-level spectra of Si 2p, Ca 2p and Al 2p were further deconvoluted to gain more insight into the chemical composition of the clay surface. Si 2p of raw clay showed 2 peaks at 102.9 eV and 104.5 eV (SI, Fig. S1a), corresponding to Si—OH and Si—O—Si, respectively (Ishak et al., 2020). After sintering, Si—OH peak intensity decreased and a significant positive shift was observed for the Si—O—Si peak (SI, Fig. S1d), which could be due to further oxidation upon heat treatment. Raw clay Ca 2p spectrum showed a spin–orbit doublet at 347.4 eV and 351 eV with a peak-to-peak spacing of 3.6 eV (SI, Fig. S1b), perfectly matching Ca 2p1/2 and Ca 2p3/2, respectively (Liu et al., 2016), with no significant peak shift observed after sintering (SI, Fig. S1e), indicating CaO phase in both samples. Raw clay Al 2p showed 2 peaks at 75.5 eV and 76.3 eV (SI, Fig. S1c) that could be attributed to -Al2O3 and Al(OH)3, respectively (Barrera et al., 2018). After sintering the Al(OH)3 peak intensity decreased and a high-intensity peak appeared at 78.3 eV (SI, Fig. S1f), corresponding to anhydride Al2O3 (Barrera et al., 2018). The oxide and hydroxide components shown by XPS agreed with the excepted raw clay composition, which is mainly formed of metal silicates and their hydroxylated compounds (Uddin, 2008), while the decrease in hydroxylated groups, observation of higher oxidation states, and appearance of anhydride phases after sintering could be explained by the high-temperature treatment at 1000 °C. The bulk of the material was investigated using XRD (Fig. 1f) that showed the dominance of palygorskite phase, with peaks detected at 21.0°, 26.8°, 28.1°, 29.6°, 30.0°, and 31.3°, corresponding to (1 2 1), (2 3 1), (4 0 0), (3 2 1), (4 2 0), and (3 3 1) planes, respectively. The palygorskite phase was also dominant upon sintering, with some change in the peak relative intensity due to rearrangement and dehydration, indicating the stability of the clay crystal structure. XRF was used to further study the clay composition, identifying the main oxides to be SiO2, Fe2O3, CaO, Al2O3, and MgO (Fig. 1g), in agreement with the XRD and XPS, except for Fe2O3, whose absence from the XPS spectrum and the lack of specific hematite XRD peaks implied its existence in the bulk of the sample, in an amorphous form or doped within the crystal structure of palygorskite.
The effect of the clay additive within the CPE was studied in 5 mM Fe(CN)63−/Fe(CN)64− prepared in 0.1 M KCl at 100 mV/s. CPE/RC showed the highest electrochemical activity with an anodic peak current of 194.4 µA, as compared to 129.5 µA and 123.0 µA shown by CPE/SC and CPE, respectively (Fig. 2a). The electrochemical surface area of the electrodes was determined using Randles-Sevcik equation (Eq. (1)) by conducting CV at scan rates ranging from 5.00 to 200 mV/s (Fig. 2b–d) and plotting the anodic peak current of the 3 electrodes vs. the square root of the scan rate. (Fig. 3a) Slopes of 363.8, 569.6, and 394.6, corresponding to effective surface areas of 0.098 cm2, 0.15 cm2, and 0.11 cm2, respectively (Fig. 3c) were obtained, which showed the enhanced electrode effective surface area upon the inclusion of raw clay, corroborating the current response observed in the CV study. The high electrochemical activity indicated that the hydroxylated surface of the raw clay played a large part in its electrocatalytic activity, where the highly functionalized raw clay surface could interact more with the Fe2+/Fe3+ species and thus catalyzed their redox reactions.
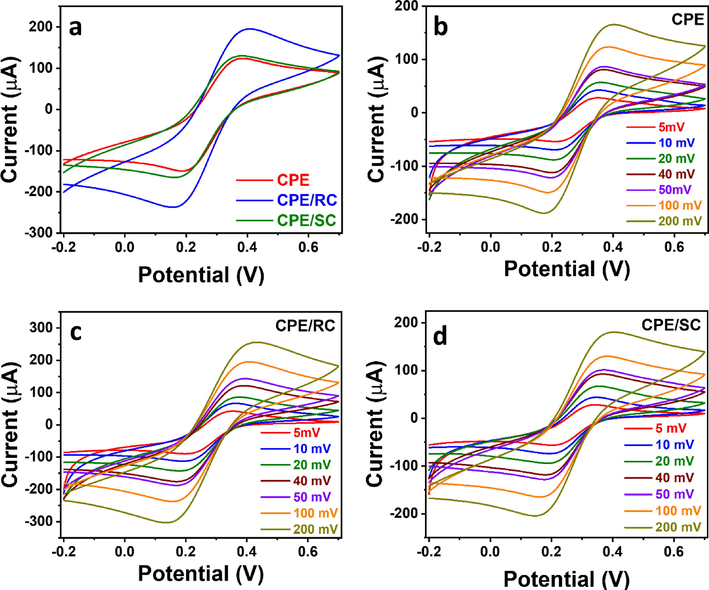
(a) CV at 100 mV/s, and (b-d) CV at different scan rates of (a) CPE, CPE/RC, and CPE/SC, (b) CPE, (c) CPE/RC, and (d) CPE/SC in an equimolar solution (5 mM) of Fe(CN)63−/Fe(CN)64− in 0.1 M KCl.
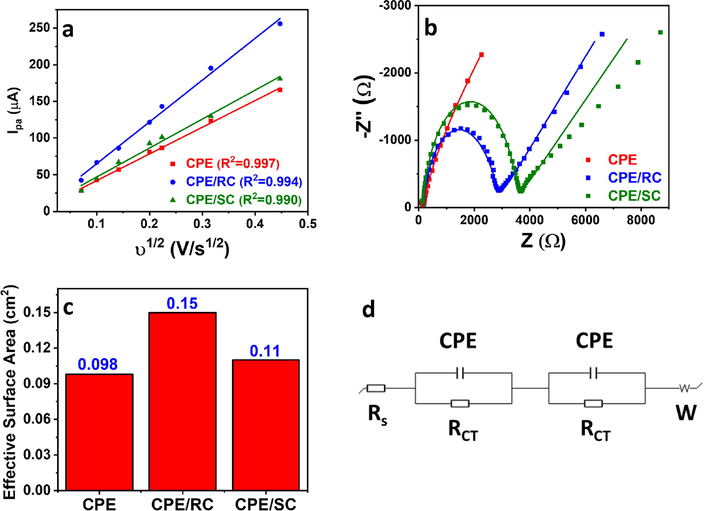
(a) Anodic peak current vs. square root of the scan rate plot of CPE, CPE/RC, and CPE/SC. (b) Nyquist plots and their fitted models using the equivalent circuit shown in (d) (c) Effective surface area of CPE, CPE/RC, and CPE/SC.
In Eq. (1), Ipa is the anodic peak current in A, n is the number of electrons transferred during the Fe2+/Fe3+ redox processes and is equal to 1, C is the concentration of Fe2+/3+ in mol/cm3, A is the electrochemical surface area of the electrode in cm2, D is the diffusion coefficient in cm2/s, and
is the scan rate in V/s. The electrode resistance was assessed using EIS (Fig. 3b) and fitted using a modified Randle’s equivalent circuit (Fig. 3d). The unmodified CPE showed the lowest solution resistance (RS) and total charge transfer resistance (RCT-total) of 40.3 Ω and 145.5 Ω, respectively, as compared to 163 Ω and 2554 Ω, and 160 Ω and 3356 shown by CPE/RC and CPE/SC, respectively (Table 2). The increase in the electrode resistance upon clay modification could be attributed to its insulative nature. The lower RCT of CPE/RC compared to CPE/SC indicated facilitated charge transfer by the functional groups in the raw clay.
Electrode
CPE
CPE/RC
CPE/SC
Rs
40.3
163
160
RCT-Total
145.5
2554
3356
The Cu2+-mediated guanine detection and the effect of the Cu2+:guanine ratio on signal amplification were assessed using the optimal clay-modified electrode. CPE/RC showed a smooth surface under SEM displaying graphite sheets as confirmed by the dominant carbon EDX signal, in addition to clay as shown by the Si and Al signals (Fig. 4a). Voltammetric guanine profile showed a peak at 1.07 V with a current of 19.8 µA (Fig. 4b), agreeing with previous reports (Fan et al., 2011). Upon the addition of Cu2+ ions at a 1:2 Cu2+:guanine molar ratio, an extra peak was observed at 0.67 V due to Cu+ oxidation to Cu2+ (Vukmirovic et al., 2020), and the guanine peak current increased significantly to 45.0 µA (Fig. 4b), ∼2.3× higher than in the absence of Cu2+ (Fig. 4c), which agreed with earlier reports on the high electrochemical activity of Cu2+-guanine complexes (Wang et al., 2003, Wang and Kawde, 2002). Cu2+-guanine complexation reaction was further studied using UV–Vis spectroscopy (Fig. 5a, c) and voltammetry (Fig. 5b, d). Interestingly, we found that the complex absorbance at 245 nm increased with the Cu2+:guanine molar ratio and stabilized at a ratio of ∼0.5. This trend was mirrored in the voltammetric study, where the complex oxidation current reached a maximum at a ratio of 0.5 and then started to decrease significantly. This analysis showed the stability of the 1:2 Cu2+:guanine complex and agreed with previous studies (Rana et al., 2014).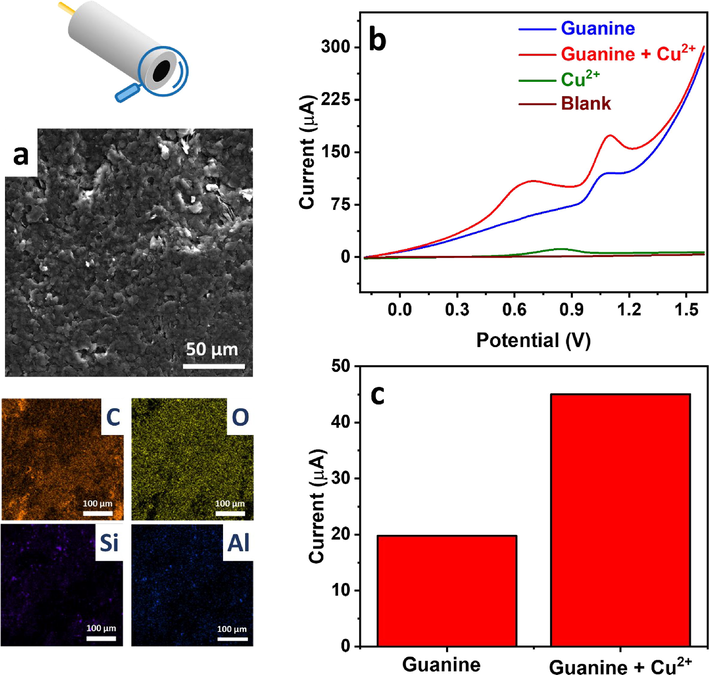
(a) SEM and EDX mapping images of CPE/RC. (b) NPV profiles of 50 µM guanine in 0.1 M acetate buffer (pH 4.5) in the presence and absence of 25 µM Cu2+, and (c) their current analysis.
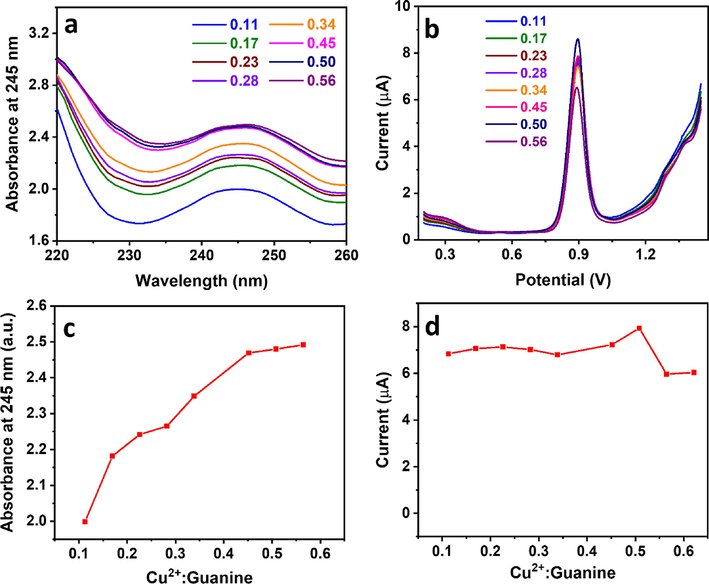
(a) UV–Vis and (b) DPV analysis of 50 µM guanine in 0.1 M acetate buffer (pH 4.5) at various Cu2+:guanine molar ratios and (c–d) their corresponding response vs. ratio plots, respectively.
Electrochemical analysis is one of the most rapid, facile, and sensitive analytical methods (Baig et al., 2022, Eftekhari et al., 2021, Baig et al., 2021, Kavetskyy et al., 2019). Electrochemical methods for guanine detection are typically conducted using carbon-based electrodes, such as the glassy carbon electrode (GCE) (Mao et al., 2021a, Ortolani et al., 2019, Gao et al., 2014, Fan et al., 2011), CPE (Kumar et al., 2019, Yari and Saidikhah, 2016), and graphite pencil electrode (GPE) (Vishnu and Badhulika, 2019). However such electrodes are usually not sensitive enough, thus, they are modified with polymers, graphene (Gao et al., 2014), carbon nanotubes (Ortolani et al., 2019), metals (Mao et al., 2021a), metal oxides (Fan et al., 2011), and metal sulfides (Vishnu and Badhulika, 2019) to enhance the electrochemical guanine oxidation signal, typically using tedious and time-consuming strategies. In this work, we used natural clay as a CPE additive and employed the Cu2+-mediated guanine electrochemical signal amplification strategy demonstrated earlier to further enhance the analytical sensitivity. This resulted in a facile, low-cost, and highly sensitive electroanalytical method for guanine detection. Our system is the first to report using a natural clay modifier for the electrochemical analysis of guanine. In addition, we are establishing the concept of Cu2+-guanine complexation as a basis for guanine electrooxidation signal enhancement for a highly sensitive sensor.
To establish the Cu2+-mediated analytical method, we optimized starting with the electrolyte. The guanine oxidation peak current was evaluated in acetate buffer (pH 4.5), phosphate buffer (pH 9.2), and NaOH (pH = 13) using linear scan voltammetry (LSV) at 100 mV/s (Fig. 6a, c), showing current responses of 5.4 µA, 1.9 µA, and 0.52 µA, respectively. The significantly high response in acetate buffer agreed with earlier reports (Gao et al., 2014, John Jeevagan and John, 2012) and could be explained by the instability of the Cu2+-guanine complex at high pH (Rana et al., 2014). We compared the influence of various voltammetric techniques at a similar scan rate of 100 mV/s, including CV, LSV, normal pulse voltammetry (NPV), differential pulse voltammetry (DPV), and square wave voltammetry (SWV) (Fig. 6b,d). Interestingly, LSV, CV, and DPV showed a similar current response of ∼15 µA. SWV showed a slightly higher signal of ∼19 µA, while NPV showed the highest guanine oxidation peak current of ∼72 µA. Pulse voltammetric techniques are known to enhance analytical sensitivity due to minimizing the capacitive current effect, which could explain the higher current in the case of NPV over CV and LSV (Qian et al., 2021). The lower current response of DPV and SWV compared to NPV is rather interesting. NPV and DPV were conducted with similar parameters of potential increment, pulse width, sampling width, and pulse period of 0.02 V, 0.05 s, 0.0167 s, and 0.2 s, respectively. The only different parameter is the amplitude which is a variable in NPV and fixed at 0.05 V in DPV. DPV showed a rather sharp peak indicating high efficiency in minimizing the capacitive effect. Still, it could have been at the expense of the Faradaic current, hence the low current response. SWV was also conducted using similar parameters of potential increment, pulse period, and amplitude of 0.02 V, 0.2 s, and 0.05 V, respectively, and behaved similarly to DPV, which could explain the comparable current. In addition, SWV was previously reported not to perform well for irreversible systems, as in the case of guanine (Scholz, 2015). Guanine accumulation on the electrode surface is critical to allow maximum adsorption before performing anodic stripping. This is especially important because the employed clay modifier has a high electrochemical surface area and is highly functionalized. We observed that guanine oxidation current tended to be enhanced at positive accumulation potentials (Fig. 7a, c), which could be attributed to the deprotonated form of guanine at pH 4.5, given its pKa of 3.5 (Villa et al., 2020), reaching a maximum at 0.8 V and decreasing drastically thereafter. The significant decrease beyond 0.8 V could be explained by guanine oxidation taking place during the accumulation step at the high potential of 1 V, which reduced the available guanine at the electrode surface during stripping. We have also studied the effect of accumulation time, observing an increase in oxidation current till 180 s, after which the rate of increase was insignificant (Fig. 7b, d). This demonstrated the significance of the high surface area CPE/RC, as the accumulation time peaked at only 20 s in previous reports (Gao et al., 2014). The highest accumulation time is mainly due to the adsorption time required by the porous clay material present in the electrode towards the Cu2+-guanine complex. The optimal accumulation time was chosen as 180 s for higher efficiency, as any further increase in time resulted in an insignificant current gain. All NPV parameters were also optimized to achieve the highest possible current repose. The current was found to increase with the increase of potential increment to 0.008 V due to the accompanying increase in scan rate. It decreased thereafter, possibly due to the very rapid scan rate that could not be matched by reaction kinetics (SI, Fig. S2a–b). The current also increased with the increase in pulse period (SI, Fig. S2c–d), which was unexpected given the associated decrease in scan rate. Such conflicting response to the pulse period was reported earlier (Ye et al., 2020, Ma et al., 2019). It could be due to the extra rest time in longer pulse periods causing more capacitance decay or increasing guanine diffusion from the bulk solution. A sampling width of 0.045 s was found to be optimal, reflecting a balance between current maximization and capacitance exclusion (SI, Fig. S3a–b). Finally, the current decreased with increasing pulse width (SI, Fig. S3c–d), probably due to higher capacitance decay and loss of part of the Faradaic current, and the optimal value was found to be 0.03 s. The optimal NPV parameters are listed in Table 3.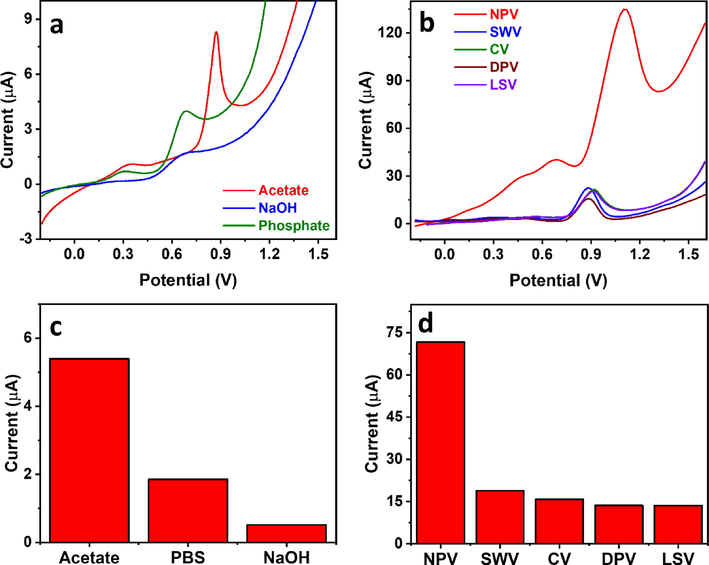
(a–b) NPV profiles of 50 µM guanine in the presence of 25 µM Cu2+ using different (a) electrolytes and (b) voltammetric techniques in 0.1 M acetate buffer (pH 4.5), and (c–d) their corresponding current analysis plots, respectively.
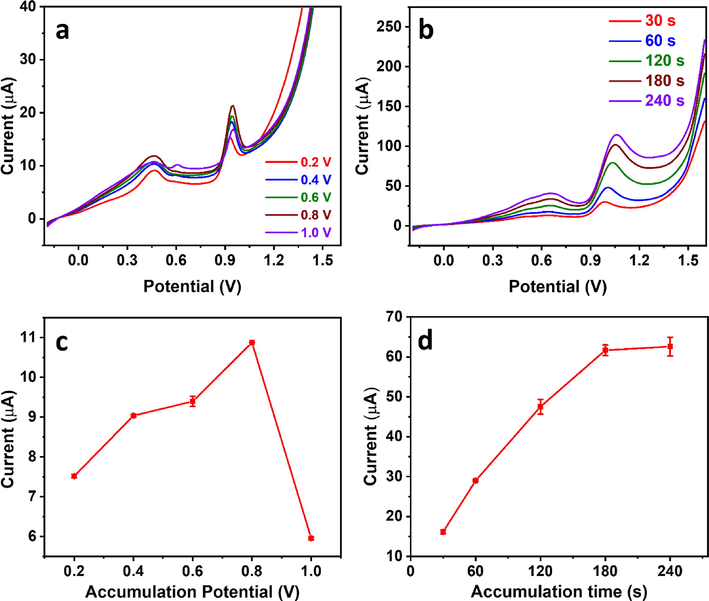
(a–b) NPV profiles of 50 µM guanine in the presence of 25 µM Cu2+ in 0.1 M acetate buffer (pH 4.5) using different accumulation (a) potential and (b) time, and (c–d) their corresponding current analysis plots, respectively.
NPV parameter
Optimum value
Accumulation potential (V)
0.8
Accumulation time (s)
180
Potential increment (V)
0.008
Pulse width (s)
0.03
Pulse period (s)
1.6
Sampling width (s)
0.045
A calibration curve for guanine detection was developed based on the optimized Cu2+-mediated signal amplification method parameters. A wide concentration range could be obtained comprising 2 linear ranges of 0.1–25 µM and 25–45 µM (Fig. 8a–b), with the regression equations below (Eqs. (2) and (3)).
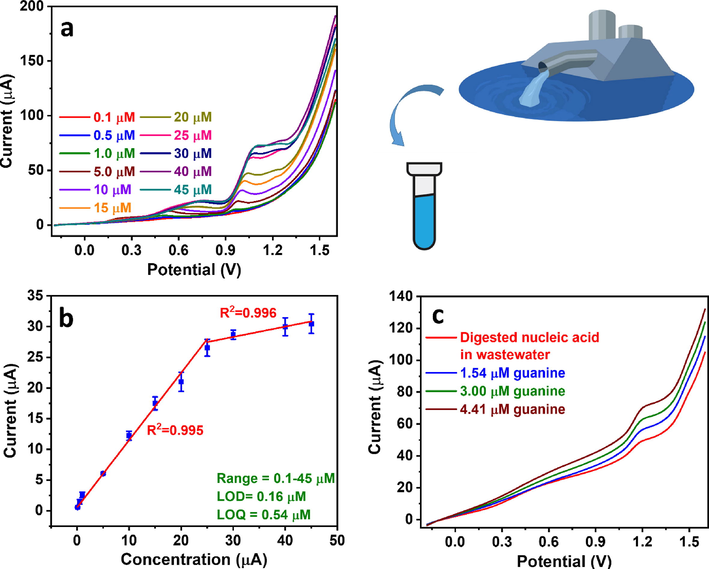
(a) NPV profiles of guanine in 0.1 M acetate buffer (pH 4.5) at different concentrations in the presence of Cu2+ and (b) the corresponding calibration curve. (c) Guanine detection in municipal tertiary wastewater containing digested nucleic acid using the standard addition method.
The LOD and LOQ were calculated according to Eqs. (4) and (5) (El Aamri et al., 2023, Ershadi and Shayanfar, 2018) to be 0.16 µM and 0.54 µM, respectively, and the electrode sensitivity was calculated based on the calibration curve slope to be 1.1 µA/µM (Ibrahim et al., 2020).
The electrochemical parameters of the Cu2+-mediated electrochemical guanine sensor are highly competitive and superior to many reported systems (Table 4). A comparison was done with the relevant literature reporting carbon-based electrodes for the electrochemical analysis of guanine. We limited our scope to the most recent reports from 2018 to 2023 (El Aamri et al., 2023, Mao et al., 2021a, Kumar et al., 2019, Ortolani et al., 2019, Vishnu and Badhulika, 2019, Zhang et al., 2019a); however, 3 earlier listings were also included due to high relevance (Yari and Saidikhah, 2016, Gao et al., 2014, Fan et al., 2011). The reported methods used more complex electrode additives such as graphene, metal nanoparticles, polymers, and metal oxides and sulfides. On the contrary, the natural clay modifier used in our work is much less expensive and easier to process. Moreover, the Cu2+-mediated signal amplification used in our study resulted in a superior sensitivity. As shown in Table 4, Our Cu2+-mediated analytical system employing natural clay modifier showed better sensitivity than that of complex systems utilizing metal oxides (Kumar et al., 2019, Fan et al., 2011), graphene (Gao et al., 2014, Fan et al., 2011), polymers (Yari and Saidikhah, 2016, Gao et al., 2014), sulfides (Vishnu and Badhulika, 2019, Zhang et al., 2019a), and metals (Wang et al., 2018, Yari and Saidikhah, 2016). The LOD is among the lowest out there and is superior to that of complex oxides (Kumar et al., 2019), carbon nanotubes (Ortolani et al., 2019, Wang et al., 2018), carbon black (El Aamri et al., 2023), Ag nanoparticles, polyaniline nanofibers (Yari and Saidikhah, 2016), and MoS2 (Vishnu and Badhulika, 2019). We have also achieved a vast linear range extending to a low concentration of 0.1 µM that is among the lowest reported even when compared to noble metal systems such as AuPt (Mao et al., 2021a), and having a very good upper limit of 45 µM. Most importantly, we have accomplished such competitive performance using affordable, abundant, and environmentally friendly materials and a facile Cu2+-mediated signal amplification strategy. This approach is more straightforward, economical, and practical than most of the oxide, sulfide, metal, and polymer-based electrodes that are complex, costly to synthesize, and challenging to scale up and commercialize. G: graphene. PPy: Polypyrrole. GCE: glassy carbon electrode. f-CB: functionalized carbon black. rGO: reduced graphene oxide. PGE: pencil graphite electrode. NC: nanocellulose. SWCNH: single-walled carbon nanohorns. MWCNTs: multi-walled carbon nanotubes. TAN: 1,3,5-Trithiane. PANF: polyaniline nanofibers.
Electrode
Technique
Linear Range (µM)
LOD (µM)
Sensitivity
(µA/µM)Ref.
TiO2/G/GCE
DPV
0.50–200
0.15
0.129
Fan et al., 2011
PPy/G/GCE
CV
0.040–100
0.010
0.125
Gao et al., 2014
NdFeO3-CPE
CV
0.50–100
0.25
0.01
Kumar et al., 2019
f-CB/SPE
DPV
0.0010–2.00
0.28
0.208
El Aamri et al., 2023
AuPt-rGO/GCE
SWV
1.00–200
0.060
1.42
Mao et al., 2021a)
WS2/graphite microfiber
DPV
0.50–20.0
0.090
–
Zhang et al., 2019a
MoS2-PGE
DPV
15–120
0.76
0.430
Vishnu and Badhulika, 2019
NC-SWCNH/GCE
LSV
0.74–6.40
0.17
1.68
Ortolani et al., 2019
Cu@Ni-MWCNTs/GCE
DPV
1.0–180
0.17
0.410
Wang et al., 2018
TAN-AgNP-PANF/CPE
DPV
0.90–140
3.0
0.021
Yari and Saidikhah, 2016
CPE/RC (+Cu2+)
NPV
0.10–45.0
0.16
1.10
This work
Our system is also highly selective, showing only minor response changes in the presence of several interfering ions and organic molecules, including Na+, K+, Mg2+, NO3–, Cl−, SO42−, ascorbic acid, citric acid, glucose, and urea at 10–100× higher molar concentration (Table 5). This demonstrated the high electrode tolerance to different matrices and its applicability for guanine detection in polluted samples like wastewater. We have also shown the repeatability and reproducibility of the proposed analytical system by performing repeated measurements using the same and different electrodes, achieving relative standard deviation (RSD) values of 1.24% (SI, Fig. S4a) and 4.75% (SI, Fig. S4b), respectively. Moreover, the system has outstanding stability with no response change after an electrode storage period of one week (SI, Fig. S4c).
Interferent
Interferent: Guanine molar ratio
Current Change (
Percent Current Change (%)
K+/NO3−
100:1
+0.659
8.86
Mg2+/SO42−
100:1
−0.530
6.50
Ascorbic Acid
10:1
−0.279
4.54
Urea
10:1
+0.0163
0.154
KCl
100:1
+2.66
3.00
NaCl
100:1
+1.96
2.21
Sucrose
100:1
−1.92
2.17
Citric acid
10:1
−5.8
8.31
To show the practicality of our system, we applied the Cu2+-mediated guanine sensor in the analysis of municipal tertiary wastewater containing digested nucleic acid as a real-life example. The digested nucleic acid guanine signal could be observed, and the peak was enhanced upon the addition of increasing concentrations of guanine standard. The concentration of guanine contaminant in the wastewater sample was calculated by standard addition as 2.98 µM. (Fig. 8c). The high sensitivity, selectivity, repeatability, reproducibility, stability, and practicality of the sensor demonstrated the impact of the Cu2+-mediated signal amplification at the clay-modified CPE approach. The high performance of the sensor could be attributed to two main factors: the modification of CPE with 5 wt% raw clay that proved significantly better than unmodified CPE, and the second is Cu2+-mediated signal amplification that enhanced the guanine oxidation signal significantly. Our sensor has shown one of the highest sensitives and least LODs with a wide linear range and superior performance parameters. More importantly, its preparation is more facile, less costly, and more environmentally friendly than previously reported systems. Moreover, we demonstrated its real-life applicability for wastewater analysis. Therefore, Cu2+-mediated electrochemical sensing using clay-modified CPE is a promising platform that could be further investigated in detecting other analytes.
4 Conclusion
We developed a new analytical system for detecting guanine in wastewater, exploiting the formation of a highly electrochemically active Cu2+-guanine complex at the surface of a clay-modified CPE. The inexpensive and readily available clay modifier is practical, economical, and has high electrocatalytic activity, while the Cu2+-guanine complexation resulted in a significant enhancement in guanine electrochemical oxidation on the electrode’s surface. The Cu2+-guanine complexation was studied using UV–Vis spectroscopy and pulse voltammetry and the optimal Cu2+:guanine complexation molar ratio was determined to be 1:2. A guanine analytical method was established and optimized based on the Cu2+-mediated electrochemical signal amplification on clay-modified electrode strategy, demonstrating superior sensor attributes with a wide linear range of 0.1–45 µM, LOD of 0.16 µM, LOQ of 0.54 µM and sensitivity of 1.1 µA/µM. The system was also highly selective in the presence of several interferents at a 10–100× molar ratio and displayed high repeatability, reproducibility, and stability. Finally, we demonstrated the sensor’s applicability in detecting nucleic acid guanine in wastewater showing its real-life validity. The excellent analytical performance of our system demonstrated the significance of the Cu2+-mediated signal amplification strategy using a practical and low-cost clay-modified CPE, which would simplify and lower the cost of wastewater analysis, and improve wastewater treatment efficiency. In addition, our system is a very promising candidate for guanine detection for biomedical applications such as diagnostics, promising superior performance at a lower cost. More work needs to be conducted for further validation of the system for environmental and biomedical applications.
Funding
This research is funded by the University of Sharjah, Seed Project No. (22021440119), (V.C.R.G./R. 447/2022), Collaborative Research Project No. (22021440122), V.C.R.G./R. 447/2022, and College of Graduate Studies, graduate students support grant number: U20105007, dated 24/02/2022, University of Sharjah, Sharjah, United Arab Emirates.
CRediT authorship contribution statement
Ayat Al Nimer: Investigation, Data curation, Validation, Formal analysis, Investigation, Writing – original draft, Writing – review & editing. Abdel-Nasser Kawde: Conceptualization, Methodology, Validation, Formal analysis, Investigation, Resources, Data curation, Writing – original draft, Writing – review & editing, Visualization, Supervision, Project administration, Funding acquisition. Abdelaziz Elgamouz: Conceptualization, Methodology, Validation, Formal analysis, Investigation, Resources, Data curation, Writing – original draft, Writing – review & editing, Visualization, Supervision, Project administration, Funding acquisition. Ihsan Shehadi: Conceptualization, Methodology, Validation, Formal analysis, Investigation, Resources, Data curation, Writing – original draft, Writing – review & editing, Visualization, Supervision, Project administration, Funding acquisition. Ayman AbdelHamid: Conceptualization, Methodology, Validation, Formal analysis, Investigation, Data curation, Writing – original draft, Writing – review & editing, Visualization, Supervision.
Acknowledgments
The authors acknowledge the support from the University of Sharjah, Seed Project No. (22021440119), (V.C.R.G./R. 447/2022), Collaborative Research Project No. (22021440122), V.C.R.G./R. 447/2022, and College of Graduate Studies, graduate students support grant number: U20105007, dated 24/02/2022, Sharjah, United Arab Emirates.
Declaration of Competing Interest
The authors declare that they have no known competing financial interests or personal relationships that could have appeared to influence the work reported in this paper.
References
- COVID-19 chloroquine drug detection using novel, highly sensitive SnO2-based electrochemical sensor. Arab. J. Chem.. 2023;16:104674
- [Google Scholar]
- Guanine oxidation signal enhancement in DNA via a polyacrylonitrile nanofiber-coated and cyclic voltammetry-treated pencil graphite electrode. J. Phys. Chem. Solids. 2018;118:73-79.
- [Google Scholar]
- Occurrence, spatial variation and risk assessment of pharmaceuticals and personal care products in urban wastewater, canal surface water, and their sediments: A case study of Lahore, Pakistan. Sci. Total Environ.. 2019;688:653-663.
- [Google Scholar]
- Porous graphene-based electrodes: Advances in electrochemical sensing of environmental contaminants. Trends Environ. Anal. Chem.. 2021;30:e00120.
- [Google Scholar]
- A cost-effective disposable graphene-based sensor for sensitive and selective detection of uric acid in human urine. Biosens. Bioelectron: X. 2022;11:100205
- [Google Scholar]
- Possibilities and limitations of mercury and mercury-based electrodes in practical electroanalysis of biologically active organic compounds. Port. Electrochim. Acta. 2013;31:291-295.
- [Google Scholar]
- Electrochemical detection of adenine and guanine using a self-assembled copper(II)–thiophenyl-azo-imidazole complex monolayer modified gold electrode. RSC Adv.. 2014;4:49819-49826.
- [Google Scholar]
- Photocatalytic activity of Ag/Al2O3–Gd2O3 photocatalysts prepared by the sol–gel method in the degradation of 4-chlorophenol. RSC Adv.. 2018;8:3108-3119.
- [Google Scholar]
- Analysis of nucleosides in municipal wastewater by large-volume liquid chromatography tandem mass spectrometry. Anal. Methods. 2015;7:5504-5510.
- [Google Scholar]
- Testing wastewater to detect illicit drugs: State of the art, potential and research needs. Sci. Total Environ.. 2014;487:613-620.
- [Google Scholar]
- Removal of steroid hormones and biocides from rural wastewater by an integrated constructed wetland. Sci. Total Environ.. 2019;660:358-365.
- [Google Scholar]
- Monitoring wastewater for assessing community health: Sewage Chemical-Information Mining (SCIM) Sci. Total Environ.. 2018;619–620:748-764.
- [Google Scholar]
- Pharmaceuticals residues and xenobiotics contaminants: Occurrence, analytical techniques and sustainable alternatives for wastewater treatment. Sci. Total Environ.. 2020;705:135568
- [Google Scholar]
- Wastewater-based epidemiology approach to assess population exposure to pesticides: a review of a pesticide pharmacokinetic dataset. Environ. Sci. Pollut. Res.. 2020;27:4695-4702.
- [Google Scholar]
- Sensitive and selective electrochemical detection of bisphenol A based on SBA-15 like Cu-PMO modified glassy carbon electrode. Food Chem.. 2021;358:129763
- [Google Scholar]
- Fourier Transform Infrared Spectrophotometry and X-ray powder Diffractometry as Complementary Techniques in characterizing Clay size fraction of Kaolin. J. Appl. Sci. Environ. Manag.. 2005;9:43-48.
- [Google Scholar]
- Development of a novel electrochemical sensor based on functionalized carbon black for the detection of guanine released from DNA hydrolysis. Electroanalysis. 2023;35:166-174.
- [Google Scholar]
- Modified graphite pencil electrode based on graphene oxide-modified Fe3O4 for ferrocene-mediated electrochemical detection of hemoglobin. ACS Omega. 2023;8:11880-11888.
- [Google Scholar]
- Development and characterization of a clay-HDTMABr composite for the removal of Cr(VI) from aqueous solutions with special emphasis on the electrochemical interface. Arab. J. Chem.. 2023;16:105027
- [Google Scholar]
- Are LOD and LOQ reliable parameters for sensitivity evaluation of spectroscopic methods? J. AOAC Int.. 2018;101:1212-1213.
- [Google Scholar]
- TiO2-graphene nanocomposite for electrochemical sensing of adenine and guanine. Electrochim. Acta. 2011;56:4685-4690.
- [Google Scholar]
- Monitoring of regional drug abuse through wastewater-based epidemiology—A critical review. Sci. China Earth Sci.. 2018;61:239-255.
- [Google Scholar]
- Clay minerals in sediments of Portuguese reservoirs and their significance as weathering products from over-eroded soils: a comparative study of the Maranhão, Monte Novo and Divor Reservoirs (South Portugal) Int. J. Earth Sci. (Geol Rundsch). 2010;99:1899-1916.
- [Google Scholar]
- Overoxidized polypyrrole/graphene nanocomposite with good electrochemical performance as novel electrode material for the detection of adenine and guanine. Biosens. Bioelectron.. 2014;62:261-267.
- [Google Scholar]
- Purine metabolite and energy charge analysis of Trypanosoma brucei cells in different growth phases using an optimized ion-pair RP-HPLC/UV for the quantification of adenine and guanine pools. Exp. Parasitol.. 2014;141:28-38.
- [Google Scholar]
- Forms of organic nitrogen in domestic wastewater. J. Water Pollut. Control Fed.. 1971;43:2271-2279.
- [Google Scholar]
- Fate and removal of metals in municipal wastewater treatment: a review. Environ. Technol. Rev.. 2018;7:1-18.
- [Google Scholar]
- Investigations on the migration behaviour of purines and pyrimidines in capillary electromigration techniques with UV detection and mass spectrometric detection. J. Chromatogr. A. 2008;1213:88-92.
- [Google Scholar]
- Removal of pharmaceutical and personal care products (PPCPs) from wastewater using microalgae: A review. J. Hazard. Mater.. 2021;403:124041
- [Google Scholar]
- Enzyme-Labeled Pt@BSA Nanocomposite as a Facile Electrochemical Biosensing Interface for Sensitive Glucose Determination. ACS Appl. Mater. Interfaces. 2014;6:4170-4178.
- [Google Scholar]
- Analytical method to monitor contaminants of emerging concern in water and soil samples from a non-conventional wastewater treatment system. J. Chromatogr. A. 2022;1671:463006
- [Google Scholar]
- A Novel Bismuth-Chitosan Nanocomposite Sensor for Simultaneous Detection of Pb(II), Cd(II) and Zn(II) in Wastewater. Micromachines. 2019;10:511.
- [Google Scholar]
- A Novel Platform Based on Au−CeO2@MWCNT Functionalized Glassy Carbon Microspheres for Voltammetric Sensing of Valrubicin as Bladder Anticancer Drug and its Interaction with DNA. Electroanalysis. 2020;32:2146-2155.
- [Google Scholar]
- Electrochemical sensor for individual and simultaneous determination of guanine and adenine in biological fluids and in DNA based on a nano-In–ceria modified glassy carbon paste electrode. RSC Adv.. 2016;6:90220-90231.
- [Google Scholar]
- An ultraperformance liquid chromatography tandem–mass spectrometry method for determination of multiclass pharmaceuticals in water sample by dispersive liquid–liquid microextraction combined with ultrasound assisted reverse extraction from solidified floating organic droplets. ACS Omega. 2021;6:7524-7532.
- [Google Scholar]
- Microencapsulation of stearic acid with SiO2 shell as phase change material for potential energy storage. Sci. Rep.. 2020;10:15023.
- [Google Scholar]
- An insight to the filtration mechanism of Pb(II) at the surface of a clay ceramic membrane through its preconcentration at the surface of a graphite/clay composite working electrode. Arab. J. Chem.. 2022;15:104303
- [Google Scholar]
- Removal of nitrogen from wastewater using microalgae and microalgae–bacteria consortia. Cogent Environ. Sci.. 2016;2:1275089.
- [Google Scholar]
- Electrochemical sensor for guanine using a self-assembled monolayer of 1,8,15,22-tetraaminophthalocyanatonickel(II) on glassy carbon electrode. Anal. Biochem.. 2012;424:21-26.
- [Google Scholar]
- Chemiluminescence determination of guanine and its nucleosides and nucleotides using phenylglyoxal. Anal. Chim. Acta. 1994;287:75-81.
- [Google Scholar]
- Multiresidue methods for the analysis of pharmaceuticals, personal care products and illicit drugs in surface water and wastewater by solid-phase extraction and ultra performance liquid chromatography–electrospray tandem mass spectrometry. Anal. Bioanal. Chem.. 2008;391:1293-1308.
- [Google Scholar]
- Construction of amperometric laccase-based biosensors using the ureasil and photocross-linked polymers. Adv. Biol. Earth Sci.. 2019;4:137-149.
- [Google Scholar]
- Levels of heavy metals in wastewater and soil samples from open drainage channels in Nairobi, Kenya: community health implication. Sci. Rep.. 2020;10:8434.
- [Google Scholar]
- Electrochemical determination of guanine and uric acid using NdFeO3 nps modified graphite paste electrode. J. Sci. Ind. Res.. 2019;78:177-181.
- [Google Scholar]
- Wastewater monitoring, surveillance and epidemiology: a review of terminology for a common understanding. FEMS Microbes. 2021;2:xtab011.
- [Google Scholar]
- Regenerative strategy of gold electrodes for long-term reuse of electrochemical biosensors. ACS Omega. 2023;8:1389-1400.
- [Google Scholar]
- Hydrophilic mineral coating of membrane substrate for reducing internal concentration polarization (ICP) in forward osmosis. Sci. Rep.. 2016;6:19593.
- [Google Scholar]
- Formation and control of organic chloramines and disinfection by-products during the degradation of pyrimidines and purines by UV/chlorine process in water. Chemosphere. 2022;286:131747
- [Google Scholar]
- Electrochemical preparation of gold nanoparticles-polypyrrole co-decorated 2D MoS2 nanocomposite sensor for sensitive detection of glucose. J. Electrochem. Soc.. 2019;166:B147-B154.
- [Google Scholar]
- Toward smart diagnosis of pandemic infectious diseases using wastewater-based epidemiology. TrAC, Trends Anal. Chem.. 2022;153:116635
- [Google Scholar]
- Simultaneous electrochemical detection of guanine and adenine using reduced graphene oxide decorated with AuPt nanoclusters. Microchim. Acta. 2021;188:276.
- [Google Scholar]
- Biosensors for wastewater-based epidemiology for monitoring public health. Water Res.. 2021;191:116787
- [Google Scholar]
- SARS-CoV-2 wastewater surveillance for public health action. Emerg. Infect. Dis.. 2021;27:1-8.
- [Google Scholar]
- Characterization of Badinsk zeolite and its use for removal of phosphorus and nitrogen compounds from wastewater. Mater. Sci. Forum. 2019;970:7-16.
- [Google Scholar]
- Electrochemical sensing of purines guanine and adenine using single-walled carbon nanohorns and nanocellulose. Electrochim. Acta. 2019;298:893-900.
- [Google Scholar]
- Simultaneous determination of guanine and adenine in human saliva with graphite sparked screen-printed electrodes. Talanta. 2022;239:123119
- [Google Scholar]
- Conventional and emerging technologies for removal of antibiotics from wastewater. J. Hazard. Mater.. 2020;400:122961
- [Google Scholar]
- Nanomaterial-based electrochemical sensors and biosensors for the detection of pharmaceutical compounds. Biosens. Bioelectron.. 2021;175:112836
- [Google Scholar]
- Environmental significance of nitrogenous organic compounds in aquatic sources. Environ. Int.. 1980;4:397-405.
- [Google Scholar]
- A CV study of copper complexation with guanine using glassy carbon electrode in aqueous medium. ISRN Electrochem.. 2014;2014:1-7.
- [Google Scholar]
- A new electrochemical sensor for simultaneous determination of arbutin and vitamin C based on hydroxyapatite-ZnO-Pd nanoparticles modified carbon paste electrode. Biosens. Bioelectron.. 2019;141:111474
- [Google Scholar]
- Accumulation of adenine and guanine as Cu+ compounds at glassy carbon electrodes followed by anodic stripping voltammetry. Bioelectrochem. Bioenerg.. 1993;31:203-213.
- [Google Scholar]
- Environmental friendly surface modified adsorbent for abatement of Cr(VI) from waste water. Int. J. Enhanced Res. Sci. Technol. Eng. 2022:11.
- [Google Scholar]
- Multi-walled carbon nanotube modified carbon paste electrode as a sensor for the amperometric detection of l-tryptophan in biological samples. J. Colloid Interface Sci.. 2013;402:223-229.
- [Google Scholar]
- HPLC measurement of guanine for the determination of nucleic acids (RNA) in yeasts. J. Microbiol. Methods. 1995;22:1-10.
- [Google Scholar]
- Clays, nanoclays, and montmorillonite minerals. Metall. Mater. Trans. A. 2008;39:2804-2814.
- [Google Scholar]
- Colloidal gold clusters formation and chemometrics for direct SERS determination of bioanalytes in complex media. Spectrochim. Acta A Mol. Biomol. Spectrosc.. 2020;224:117380
- [Google Scholar]
- Single step grown MoS2 on pencil graphite as an electrochemical sensor for guanine and adenine: A novel and low cost electrode for DNA studies. Biosens. Bioelectron.. 2019;124–125:122-128.
- [Google Scholar]
- Copper electrodeposition from deep eutectic solvents—voltammetric studies providing insights into the role of substrate: Platinum vs glassy carbon. J. Phys. Chem. B. 2020;124:5465-5475.
- [Google Scholar]
- A novel electrochemical sensor based on Cu@Ni/MWCNTs nanocomposite for simultaneous determination of guanine and adenine. Biosens. Bioelectron.. 2018;102:389-395.
- [Google Scholar]
- Amplified label-free electrical detection of DNA hybridization. Analyst. 2002;127:383-386.
- [Google Scholar]
- Carbon-nanotube-modified glassy carbon electrodes for amplified label-free electrochemical detection of DNA hybridization. Analyst. 2003;128:912-916.
- [Google Scholar]
- Electrochemical biosensor for simultaneous determination of guanine and adenine based on dopamine-melanin colloidal nanospheres–graphene composites. J. Solid State Electrochem.. 2014;18:2435-2442.
- [Google Scholar]
- Cyclic voltammetry and anodic stripping voltammetry with mercury ultramicroelectrodes. Anal. Chem.. 1985;57:1989-1993.
- [Google Scholar]
- Sensitive determination of illicit drugs in wastewater using enrichment bag-based liquid-phase microextraction and liquid-chromatography tandem mass spectrometry. J. Chromatogr. A. 2022;1661:462684
- [Google Scholar]
- Nanomaterials for the removal of heavy metals from wastewater. Nanomaterials. 2019;9:424.
- [Google Scholar]
- Trithiane silver-nanoparticles-decorated polyaniline nanofibers as sensing element for electrochemical determination of Adenine and Guanine in DNA. J. Electroanal. Chem.. 2016;783:288-294.
- [Google Scholar]
- Highly sensitive detection to gallic acid by polypyrrole-based MIES supported by MOFs-Co2+@Fe3O4. J. Electroanal. Chem.. 2020;859:113839
- [Google Scholar]
- Efficient removal of pesticides and heavy metals from wastewater and the antimicrobial activity of f-MWCNTs/PVA nanocomposite film. J. Clean. Prod.. 2019;206:315-325.
- [Google Scholar]
- Enhanced thermal stability and lifetime of epoxy nanocomposites using covalently functionalized clay: experimental and modelling. New J. Chem.. 2015;39:2269-2278.
- [Google Scholar]
- Electrochemical detection of adenine and guanine using a three-dimensional WS2 nanosheet/graphite microfiber hybrid electrode. Electrochem. Commun.. 2019;99:75-80.
- [Google Scholar]
- Simultaneous voltammetric determination of guanine and adenine using MnO2 nanosheets and ionic liquid-functionalized graphene combined with a permeation-selective polydopamine membrane. Microchim. Acta. 2019;186:450.
- [Google Scholar]
Appendix A
Supplementary material
Supplementary material to this article can be found online at https://doi.org/10.1016/j.arabjc.2023.105091.
Appendix A
Supplementary material
The following are the Supplementary material to this article:Supplementary data 1
Supplementary data 1


