

Translate this page into:
Rosiglitazone induces hepatocyte injury by increasing DCA accumulation through OATP1A4 inhibiting in mice
⁎Corresponding author. yqhe.pharm@foxmail.com (Yuqi He)
-
Received: ,
Accepted: ,
This article was originally published by Elsevier and was migrated to Scientific Scholar after the change of Publisher.
Peer review under responsibility of King Saud University.
Abstract
Rosiglitazone (RL), a second-generation thiazolidinedione (TZD), is an oral antidiabetic agent that is reportedly associated with hepatotoxicity. However, the molecular mechanism of Rosiglitazone induced hepatotoxicity has not been reported yet. To minimize clinical risk, in the present study, toxicity was evaluated initially in C57BL/6 mice to confirm the hepatotoxicity of Rosiglitazone. Subsequently, the transcription of genes, the up-regulated expression of proteins and changes of metabolite spectrum in bile acid system in accordance with system pharmacology and multi-omics profiling strategy were investigated to reveal its toxic mechanism. Results show an obvious Rosiglitazone induced hepatocyte injury in our experiment. Changes in bile acid profiles revealed that Rosiglitazone administration increased the concentration of deoxycholic acid (DCA) in the liver, but decreased those of other bile acids. Transcriptomic and proteomic data showed that while the expression of efflux transporters ABCC3, ABCC4 and ABCB11 was upregulated following Rosiglitazone treatment, the expression of two hepatic uptake transporters, OATP1A1 and OATP1A4, which were negatively associated with DCA accumulation, were significantly downregulated. These results indicated that cholestasis, especially the accumulation of DCA in the liver, is the primary factors responsible for Rosiglitazone induced hepatocyte injury. The mechanism of Rosiglitazone induced DCA accumulation in the liver may be the result of stimulated intestinal permeability and increased biosynthesis and uptake of DCA and weakening of DCA amidation to reduce DCA efflux due to the inhibition of OATP1A1 and OATP1A4 expression in the liver.
Keywords
Rosiglitazone
Drug-induced liver injury
Hepatotoxicity
Transcriptome
Proteome

1 Introduction
Drug-induced liver injury (DILI) is the primary reason for drug withdrawal from the market or termination of drug candidates from clinical development (Regev 2014, Oh et al., 2015). The incidence of DILI continues to increase and remains the primary cause of acute liver failure in the western world (Katarey and Verma 2016). The management of DILI, especially when its mechanism is unclear, is a significant challenge (Chatterjee and Annaert 2018). Therefore, elucidating the underlying mechanisms of DILI is essential for ensuring clinical safety of drugs.
DILI may be distinguished into three phenotypes, cholestatic, hepatocellular, and mixed types, based on histology and blood biomarkers (Bénichou 1990). Of these, the most common type is cholestatic DILI, which is characterized by impaired bile excretion resulting in the accumulation of bile acids in hepatocytes (Wagner et al., 2009, Vinken 2018). More than 1,000 drugs have been associated with cholestatic liver injury (Bhamidimarri and Schiff 2013, Yang et al., 2019, Tan et al., 2023). As an example, Troglitazone, a first generation thiazolidinedione (TZDs), was withdrawn from the US market in March 2000 because of severe hepatotoxicity cases, including cholestatic liver injury (Marcy et al., 2004). Previous studies have shown that cholestasis is an important factor in TZD-induced DILI (Tolman and Chandramouli 2003). Although the molecular mechanisms of cholestatic liver injury remain elusive, excessive intra-hepatic accumulation of bile acids and their metabolites play an important role in mediating cholestatic liver injury (Li et al., 2017). Furthermore, the expression levels of bile acid synthetic and detoxification enzymes and transporters were significantly altered in cholestasis (Zollner et al., 2006, Wagner et al., 2009, Notenboom et al., 2018, Yang et al., 2019).
TZDs as a class are not as hepatotoxic as Troglitazone, however, some cases of hepatoxicity induced by Rosiglitazone (RL), a new Troglitazone alternative, have been reported (Marcy et al., 2004). Unfortunately, the mechanism of RL-induced hepatotoxicity remains unclear. Thus, it is important to investigate the mechanism underlying its hepatotoxicity. In the present study, the aim is to investigate the role of Rosiglitazone in C57BL/6 mice and evaluate the hepatocyte injury mechanism of Rosiglitazone. We initially employed a multi-omics approach that included metabolomics, transcriptomics, and proteomics to analyze differences in bile acid metabolism and the activities of enzymes and transporters associated with bile acid homeostasis and elucidate the mechanism, so as to provide insights into improved safety assessment of oral administration of Rosiglitazone.
2 Materials and methods
2.1 Chemicals and reagents
Rosiglitazone sodium tablets were purchased from the Taiji group Sichuan Taiji Pharmaceutical Co., Ltd. Acetonitrile (Tedia, USA). Formic acid (Sigma-Aldrich, USA) were high-performance liquid chromatography grade and ammonium acetate (Fischer Scientific, USA) was liquid chromatography-mass spectrometry (LC-MS) grade. All other reagents were at least analytical grade and obtained from the Chengdu Kelong chemical reagent factory (Chengdu, China). Water was purified using a Milli-Q water purification system (Millipore, USA). Biochemical kits for total cholesterol (TC, A111-1), low-density lipoprotein (LDL, A113-1), and alanine aminotransferase (ALT, C009-2) were purchased from the Nanjing Jiancheng Bioengineering Institute (Nanjing, China). Blood glucose test strips were procured from Roche (Shanghai, China).
2.2 Animals
Eight-week-old male C57BL/6 mice (23–25 g) were obtained from the Beijing Huafukang Biotechnology Co., Ltd. (Beijing, China; certification no. SCXK 2014–0004). The mice were maintained individually in a 12-h light/dark cycle (07:00–19:00) environment controlled at 22 °C ± 2 °C and 55% ± 5% humidity. Animal procedures strictly followed the State Committee of Science and Technology of the People’s Republic of China Order No. 2 on November 14, 1988 (revised 2011) and were approved by the Animal Experimentation Ethics Committee of Zunyi Medical University. The study was conducted in accordance with ARRIVE guidelines (https://arriveguidelines.org).
2.3 Treatment
After one week of acclimation, the mice were randomly divided into five groups (n = 5), including two normal diet (ND) groups, two high-fat diet (HFD) groups, and the RL (RL) group. Once the pathological model was determined to be successful in the pair of ND and HFD groups until the 16th week, RL treatment (RL, 1.2 mg/Kg, i.g., qd) was initiated. In the ND and HFD groups, an equivalent volume of 0.1% CMC-Na was administered. At the end of the 38th week, the mice were anesthetized with pentobarbital sodium (100 mg/kg BW, i.p.), and blood was collected from eye orbital. After incubating for 60 min at room temperature, blood was centrifuged for 10 min at 3500 rpm to isolate the serum. A small slice of liver was immediately fixed in 10% formaldehyde solution for histology analysis. The remainder of the liver and the other tissues were snap-frozen in liquid nitrogen and stored at −80 °C. Bile samples were collected from the gallbladder in polypropylene tubes and stored at −80 °C for further analysis.
2.4 Serum biochemical factors
TC, low-density lipoprotein cholesterol (LDL-C), aspartate aminotransferase (Vargas-Gastélum et al., 2015), and ALT were analyzed using commercial enzymatic colorimetric kits according to the manufacturer’s instructions (Nanjing Jiancheng Bioengineering Institute, China). Blood glucose levels were determined using glucose test strips (Roche, China).
2.5 Histopathology analysis
The liver samples were fixed in 10% formalin solution for 24 h, dehydrated with alcohol, and placed in xylene. The fixed liver samples were embedded in paraffin and cut into 6–8 μm thick sections using a microtome. Liver tissue sections were stained using hematoxylin and eosin for microscopic examination.
2.6 Bile acid metabolic profiling analysis
2.6.1 Liver metabolic sample preparation
Liver tissues (100 mg) were homogenized in 300 μl ice-cold acetonitrile. The homogenates were centrifuged at 14,300 rpm at 4 °C for 15 min. The supernatant (250 μl) was dried under nitrogen gas flow. The residue was then reconstituted in 100 μl of 50% methanol/water. After centrifugation at 14,300 rpm for 10 min at 4 °C, the supernatant was transferred to a new vial for analysis.
2.6.2 Bile metabolic samples preparation
The bile sample (1 μl) was diluted with 100 μl of 66% acetonitrile/water. The mixtures were centrifuged at 14,300 rpm for 15 min at 4 °C. The supernatant (95 μl) was dried under nitrogen gas flow. The residue was reconstituted in 100 μl of 50% methanol/water. After centrifugation at 14,300 rpm for 10 min at 4 °C, the supernatant was transferred to a new vial for analysis.
2.6.3 Serum metabolic sample preparation
The serum sample (100 μl) was diluted with 200 μl acetonitrile. The mixtures were centrifuged at 14,300 rpm for 15 min at 4 °C. The supernatant (250 μl) was dried under nitrogen gas flow. The residue was then reconstituted in 100 μl of 50% methanol/water. After centrifugation at 14,300 rpm for 10 min at 4 °C, the supernatant was transferred to a new vial for analysis.
2.6.4 QC samples preparation and systematic stability analysis
The QC sample preparation method was described previously (Xi et al., 2013). The liver samples were prepared by combining equal aliquots (5 μl) of individual liver samples. QC samples of serum and bile were prepared in the same manner. Then, the three QC samples were processed by the same method as the analytical samples to monitor the stability of the UPLC-MS platform. During the process of bile acid profiling, one QC sample was inserted at an interval of every 10 samples in the analysis sequence for quality control. The systematic stability was evaluated by monitoring the reproducibility of QC samples to ensure the reliability of the collected data.
2.6.5 Bile acid mixed standard sample preparation
Fourteen bile acid standards were dissolved and diluted in 50% methanol/water to obtain individual stock solutions with concentrations of 1 mg/ml. The 14 stock solutions were then further diluted to create a mixed standard solution with final concentrations of 70 ng/ml.
2.6.6 Bile acid profiling data acquisition
Quantification of bile acids was performed using the Agilent 6420 Triple Quad UPLC-MS/MS system (Agilent, Santa Clara, CA). A CQUITY UPLC BEH C18 (100 × 2.1 mm, 1.7 μm) column was used for chromatographic separation. The mobile phase comprised acetonitrile and ammonium acetate in an aqueous solution as previously described (Zhang and Klaassen 2010, He et al., 2017). The flow rate was set at 0.3 ml/min. The column temperature was set at 45 °C, and the injection volume of all samples was 10 μl. For MS detection, the electrospray ionization (Hassan and Mathesius, 2012) ion source was run in the negative ion mode to scan the MS/MS spectra and the parameters were set as follows: spray voltage: 3.5 kV, capillary temperature: 326 °C, gas flow: 12 l/min, and nebulizer: 55 psi. The mass analyzer was set as the SIM mode.
2.7 RNA preparation and sequencing
2.7.1 Total RNA extraction
Liver tissues (20 mg) were homogenized in 1 ml of ice-cold Trizol reagent. The homogenates were incubated for 5 min at room temperature and then 200 μl of chloroform was added. The mixtures were incubated for 10 min at room temperature and then centrifuged at 14,300 rpm for 15 min at 4 °C. The supernatant was mixed with 500 μl of isopropanol to precipitate RNA. After centrifugation, as mentioned above, the residue was washed with 1 ml of 75% ethanol/diethyl pyrocarbonate (DEPC) water and dissolved in 30 μl DEPC water after evaporating the ethanol. 2 μl RNA were taken and the RNA concentration and OD260/OD280 values were measured by ultra-micro spectrophotometer.
2.7.2 RNA sequencing
RNA sequencing was performed on the BGISEQ-500 sequencing platform (Beijing Genomics Institute, BGI, China, https:// https://www.genomics.org.cn). The RNA concentration, purity and RNA integrity number (Rodríguez-Ortigosa et al.,) were first measured by Agilent 2100 Bioanalyzer, and 2 μg of RNA with RIN ≥ 7 and 28S/18S ≥ 1.0 were taken for pre-sequencing library building. After library construction, the samples were sequenced using the BGISEQ-500RS RNA-Seq sequencing platform. The sequenced data were compared and annotated using the GRCm38/mm10 mouse genome, and the FPKM values were used as quantitative units to output the expression matrix.
2.8 Proteomic profiling analysis
2.8.1 Protein extraction
Small pieces of frozen liver tissues (50 mg) were homogenized in liquid nitrogen. The frozen liver tissue powder was transferred to 200 ml of lysis buffer containing 1.0% Triton X-100 and 1.0% proteinase inhibitor. After sonication, the protein extracts were centrifuged at 12,000 × g for 10 min and the supernatant was collected and stored at −80 °C. The protein content of the extracts was determined using a BCA protein assay kit.
The protein was purified by sodium dodecyl sulfate-poly-acrylamide gel electrophoresis (SDS-PAGE). Trapped proteins were digested overnight with trypsin. Peptides were eluted, desalted, and centrifuged at 14,000 × g for 15 min, and the supernatant was collected for LC-MS/MS analysis.
2.8.2 Proteomic profiling data acquisition
Peptides were analyzed using a Nano Elute LC separation system coupled with a tims TOF Pro mass spectrometer (Bluker, Germany). A Reprosil-Pur C18-AQ (150 mm × 75 μm, 5 μm) column was employed for the chromatographic separation. Mobile phase A comprised 0.1% formic acid aqueous solution and mobile phase B comprised 0.1% formic acid acetonitrile solution. The flow rate was set at 450 nl/min. The elution gradient program was as follows: 0–70 min, 6% B to 24% B linearly; 70–84 min, 24% B to 35% B; 84–87 min, 35% B to 80% B; and 87–90 min, 80% B. The injection volume was 10 μl. The MS survey spectra were set at an m/z range of 100–1700. The 15 topmost abundant ions were selected for subsequent fragmentation of precursor peptides, and MS/MS spectra were obtained. Precursor ions selected in a 5 m/z isolation mass window were fragmented. The dynamic exclusion time was set as 30 sec.
2.9 Real-time quantitative polymerase chain reaction (PCR) validation
2.9.1 Isolation and culture of mice primary hepatocytes
Hepatocytes were isolated from male C57BL/6 mice using a two-step perfusion method according to a previous study (Yu et al., 2016). Primary hepatocytes were cultured in William's E-type medium containing 100 U penicillin/streptomycin, 10% fetal bovine serum, 1 × glutamine, and 1 × insulin-transferrin-selenium-sodium pyruvate solution and incubated for 4 h. The hepatocytes were placed into fresh William's E-type medium and incubated for 12 h.
2.9.2 Real-time quantitative PCR analysis
Total RNA was extracted using the RNAiso Plus reagent (Takara Bio, Japan) and reverse transcribed to cDNA using the Prime-Script RT-PCR kit (Takara Bio, Japan). Real-time quantitative PCR was performed on a BIO-RAD iQ Real-Time PCR System (Bio-Rad Laboratories, USA) with an iTaq™ Universal SYBR Green Supermix (Bio-Rad Laboratories, USA). The expression of glyceraldehyde 3-phosphate dehydrogenase (GAPDH) was used for normalization. The primer sequences are listed in Table S1.
2.9.3 Drug silencing experiments
Primary hepatocytes were seeded into 6-well plates at a density of 5 × 10⁵ cells per well. After 24 h, RL (6.25, 12.5, and 25.0 μM) or saline was added to the cell culture medium and incubated for 24 h. Cells were then collected for qPCR analysis.
2.10 Statistical analysis
Statistical analyses were performed using SPSS Statistics 18.0 (IBM, Chicago, USA). Statistical differences between groups were determined using a one-way analysis of variance. Values are expressed as means ± SEMs. Differences were considered statistically significant at p < 0.05.
3 Results
3.1 RL-induced liver injury in mice
After treatment with RL for 22 weeks, glucose, TC, LDL-C, and AST values significantly decreased to a normal level than those of the HFD group; however, the ALT levels markedly increased (Fig. 1a, b). The liver pathology exhibited no improvement in fat accumulation compared with the HFD group (Fig. 1c). Instead, hepatocyte necrosis was observed. These results indicate that RL inhibited blood glucose and simultaneously aggravated liver injury.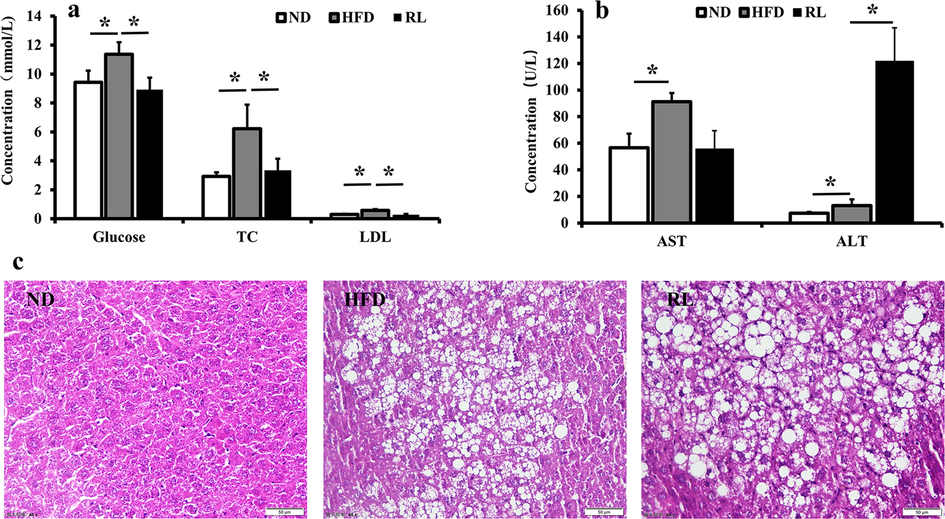
Serum biochemical factors (a, b) and liver histopathology (c) after Rosiglitazone (RL) administration (1.2 mg/Kg, i.g., qd) in mice. Data are expressed as the mean ± SEM (n = 5). *P < 0.05.
3.2 RL altered bile acid profile in mice
Bile acids are cholesterol metabolites that play an important role as potential mediators of liver injury. Therefore, to clarify the relationship between the bile acid profile and RL-induced hepatocyte injury, 14 bile acids in the liver, bile, and serum were measured using UPLC-MS. The QC sample results collected by UPLC-MS were subjected to Principal Component Analysis (PCA) by analyzing 13 QC samples. The results of each sample for the first principal component indicated that the deviations were within 2 SD and suggested that the established UPLC-MS analytical method was stable. For the overall bile acid profiling, PCA demonstrated a metabolic distinction between the three groups. In the liver, ND, HFD, and RL were clearly distributed in different regions of the PCA score plot. The PCA loading plot showed that DCA plays an important role in the RL group and was distinguished from other groups (Fig. 2a). In the bile and serum, taurocholic acid (TCA) was the critical parameter in the RL group (Fig. 2b, c).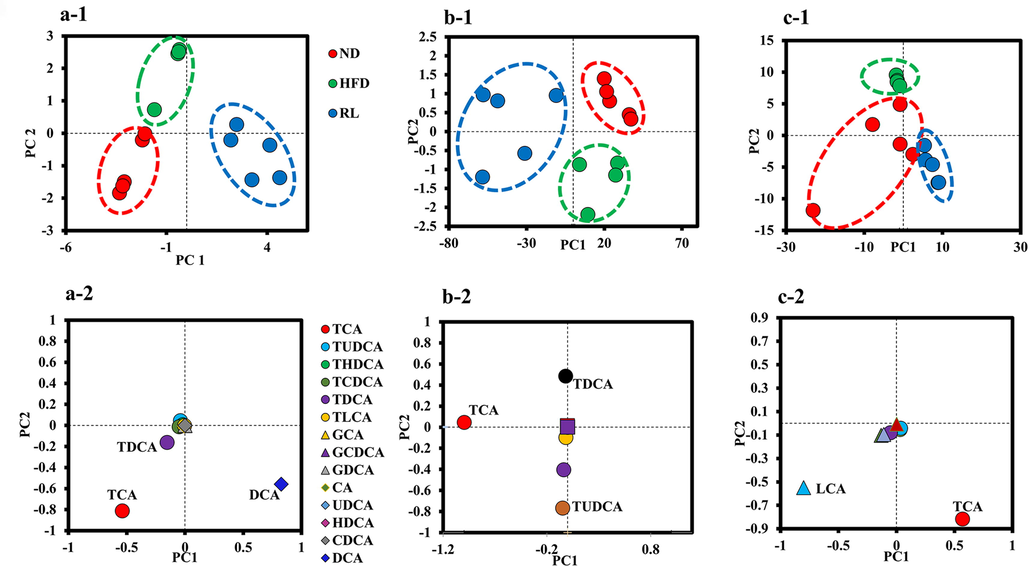
Principal component analysis of the metabolic distinction of bile acids. (a-1, b-1, and c-1) represent the score plots in liver, bile, and serum bile acids; (a-2, b-2, and c-2) represent the loading plots in liver, bile, and serum bile acids.
Next, the composition of bile acids in the liver, bile, and serum was analyzed. The results showed that the level of DCA in the liver was increased notably following Rosiglitazone administration. Conversely, the levels of the other conjugated or unconjugated bile acids were reduced (Fig. 3a). In the bile, the concentration of almost all 14 bile acids were increased in the RL group (Fig. 3b). In the serum, all detected bile acid concentrations were in the RL group compared with the HFD group (Fig. 3c).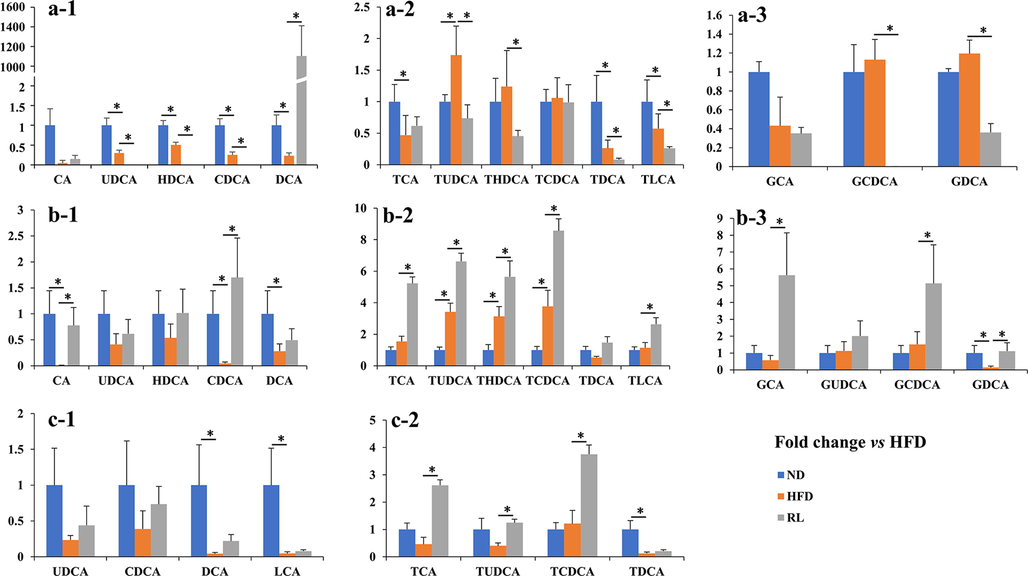
Fold-change in liver, bile, and serum bile acids in the normal diet (ND) and Rosiglitazone (RL) groups vs. the high-fat diet (HFD) group. (a-1, 2, and 3) represent free and conjugated bile acids in the liver of three groups of mice. (b-1, 2, and 3) represent free and conjugated bile acids in the bile of three groups of mice. (c-1 and 2) represent free and conjugated bile acids in the serum of three groups of mice. Data are expressed as the mean ± SEM (n = 5). *P < 0.05 vs. HFD.
3.3 Effect of RL on the mRNA expression of bile acid metabolism-related genes in mice
In this study, 46 genes associated with bile acid metabolism were collected by KEGG (Kyoto Encyclopedia of Genes and Genomes; https://www.kegg.jp/ or https://www.genome.jp/kegg/). A heatmap revealed completely different expression levels of 46 bile acid metabolism-related genes in the three groups (Fig. 4a). The result was also confirmed by PCA (Fig. 4b). Based on the expression of these genes, a volcano plot revealed how these genes were altered by RL. The hepatic expression of 18 genes were altered. Based on the altered fold-change of the expression levels, four genes (Cyp7a1, Abcc4, Cyp3a11, and Cyp46a1) were upregulated, whereas three genes (Nr0b2, Oatp1a1, and Cyp7b1) were downregulated by two-fold in the RL group compared with the HFD group (Fig. 4c). The top 7 regulated genes associated with RL administration included Abcc4, Cyp7a1, Cyp46a1, and Cyp7b1, which were regulated at a normal level, whereas the expression of Nr0b2 and Oatp1a1 were over retracement to a lower level (Fig. 4d).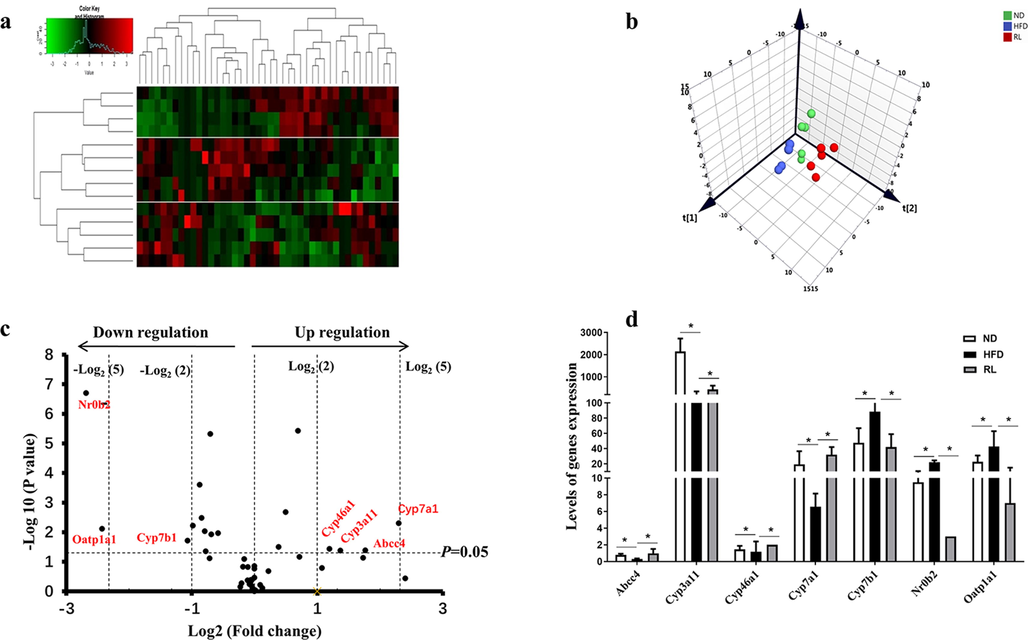
Alteration of bile acid metabolism-related genes induced by Rosiglitazone (RL) (1.2 mg/kg, i.g., qd). Heatmap analysis of bile acid metabolism-related genes, red indicates upregulation, green indicates downregulation, and black indicates no obvious change. (b) Principal component analysis of bile acid metabolism-related genes. (c) Volcano plot showing bile acid metabolism-related genes altered by RL. (d) Levels of genes significantly altered by RL. Data are expressed as the mean ± SEM (n = 5). *P < 0.05 vs. high-fat diet (HFD).
3.4 RL altered proteomic profiles in the liver of mice
Proteomic profiling of mouse liver tissue was performed using a UPLC-MS-based proteomic analysis. A total of 31 proteins related to bile acids were identified. A PCA revealed a completely different location in score plots among the three groups (Fig. 5a). The results indicated that the protein expression profiles associated with bile acids were significantly altered by RL treatment. Furthermore, the four-quadrant diagram based on the protein expression data indicated that the expression of some transporters and enzymes, such as CYP3A11, ABCC3, and ABCB11, was reversed, whereas the expression of OATP1A4 and ABCC2 was downregulated following RL administration (Fig. 5b).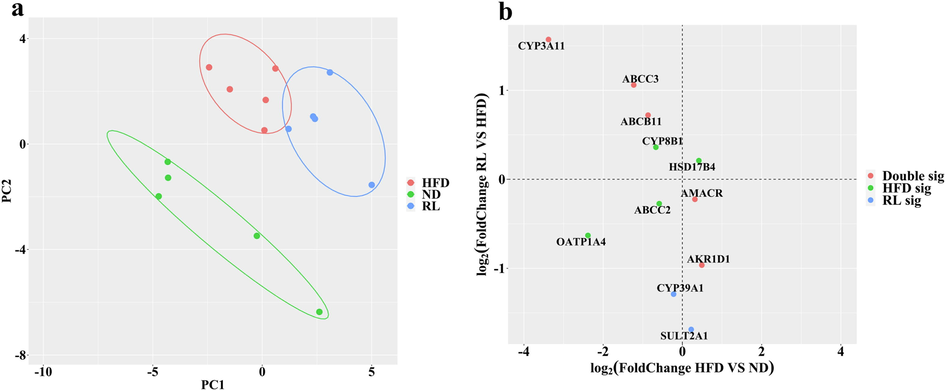
Alteration of bile acid metabolism-related enzymes and transporters induced by Rosiglitazone (RL) (1.2 mg/kg, i.g., qd). a Principal component analysis of bile acid metabolism-related proteins. (b) Variation analysis of enzymes and transporters induced by high-fat diet (HFD) and RL.
3.5 RL regulates the expression of the Oatp1a1, Oatp1a4, Abcc3, Abcc4, and Abcb11 genes in mouse primary hepatocytes
The effects of RL on Oatp1a1, Oatp1a4, Abcc3, Abcc4, and Abcb11 genes expression were measured in mouse primary hepatocytes. As shown in Fig. 6, RL dose-dependently inhibited the expression of Oatp1a1 and Oatp1a4, whereas increased expression of Abcc3, Abcc4, and Abcb11 was observed. These results demonstrated that RL regulates bile acid transporter expression.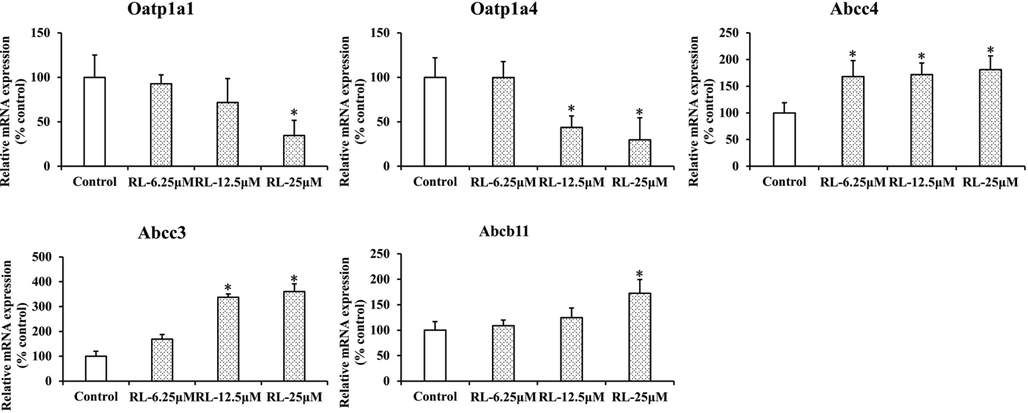
Rosiglitazone altered hepatic gene expression of transporters involved in bile acid homeostasis in mice. Data are mean ± SEM. (n = 3). *P < 0.05 vs. control.
4 Discussion
RL is considered a safe alternative to Troglitazone in the clinic. While cases of RL-induced hepatotoxicity have been reported (Forman et al., 2000, Marcy et al., 2004), its hepatotoxic mechanism is unknown. In this study, RL was used to treat HFD-induced hyperglycemia in mice. The results indicated that although blood glucose, TC, LDL-C were present at normal levels after RL administration, fat accumulation in hepatocytes was significantly increased, and symptoms of hepatocyte injury, such as a significant increase in ALT, were observed. RL is a well-known peroxisome proliferator-activated receptor γ (PPARγ) agonist that stimulates adipocyte differentiation through PPARγ activation (Kim et al., 2014). Therefore, it is expected that fat accumulation increased in mouse hepatocytes after RL administration. This is consistent with our observations in liver tissue sections.
Previous studies have demonstrated that cholestasis may be an important factor of TZD-associated hepatotoxicity (Snow and Moseley 2007). Clinical case reports have described patients with cholestatic hepatitis that developed after RL administration (Bonkovsky et al., 2002). Cholestatic DILI was induced by changes in the composition or concentration of bile acids (Chatterjee and Annaert 2018). Bile acids represent a group of endogenous metabolites synthesized from cholesterol in hepatocytes. The formation of bile acids is complex and includes several reaction steps catalyzed by different enzymes (de Aguiar Vallim et al., 2013). The synthesis of bile acids from cholesterol is accomplished by two metabolic pathways: the “classical” and “alternative” pathways. The “classical” pathway yields the primary bile acids, cholic acid (CA) and chenodeoxycholic acid (CDCA), which are catalyzed by three enzymes: CYP7A1, CYP8B1, and CYP27A1. The “alternative” pathway produces CDCA and is catalyzed by CYP27A1 and CYP7B1 (de Aguiar Vallim et al., 2013). Bile acids are conjugated (“amidated”) with the amino acids, taurine and glycine, and then secreted into the bile canaliculus via the canalicular bile salt export pump (BSEP, ABCB11) or members of the multidrug resistance-associated protein (MRP, ABCC) family, including ABCC2, ABCC3, and ABCC4, followed by passage to the duodenum. In the intestine, conjugated CA and CDCA are deconjugated by bacteria by bile salt hydrolase activity and metabolized by 7-dehydroxylation into secondary bile acids, lithocholic acid (LCA) from CDCA and DCA from CA. More than 95% of bile acids are reabsorbed in the ileum by apical sodium-dependent bile acid transporter (ASBT), and through the hepatic sodium-dependent taurocholate co-transporting polypeptide (NTCP), OATP1 or OATP4 and recirculated to the liver with portal blood in a process known as enterohepatic circulation (Klaassen and Aleksunes 2010, Zhang et al., 2012a, Zhang et al., 2012b, Wahlström et al., 2016). During cholestasis, the enterohepatic circulation is interrupted and bile acids accumulate in the hepatocytes. Therefore, changes in bile acid profiles and genes and enzymes associated with the bile acid pathway after RL administration were determined by a multi-omics approach, including targeted bile acid metabolomics, transcriptomics, and proteomics.
In this study, one of the most apparent changes in the bile acid profile was an increase in DCA levels in the liver of RL group mice (Fig. 3a1). DCA produces free radicals to induce oxidative stress and cell death during liver cirrhosis (Fitian et al., 2014) and is considered the second most toxic bile acid after LCA (Song et al., 2011). The administration of DCA resulted in a significant increase in ALT levels in mice(Shin et al., 2009, Li and Dawson 2019), which is consistent with the results of this study. Hence, these results indicated that cholestasis induced by RL is reflected by the accumulation of a single bile acid, DCA, in the liver.
It is of interest why only DCA was accumulated in the liver after Rosiglitazone exposure. To explore the underlying molecular mechanisms, transcriptomic and proteomic approaches were used to analyze the accumulation of DCA. At the transcriptome and proteome levels, significant changes in the expression of some genes and proteins in the liver of mice treated by RL were observed. These genes and proteins are mainly involved in the three aspects of bile acid metabolism: synthesis (CYP7A1, CYP7B1, SHP, CYP3A11, CYP46A1, CYP8B1, AMACR, and AKR1D1), efflux (ABCC4, ABCC3, ABCB11, ABCC2, and SULT2A1), and uptake (OATP1A1 and OATP1A4). Of these bile acid synthases with altered expression, CYP7A1, CYP7B1, and SHP affect the type and concentration of primary bile acids synthesized (Russell 2009, Rodríguez-Ortigosa et al., 2014, Vaz and Ferdinandusse 2017). The elevated expression of Cyp7a1 and decreased expression of Cyp7b1, as well as decreased Nr0b2 expression, the gene encoding SHP (Rodríguez-Ortigosa et al., 2014), indicate that the “classical” pathway of bile acid synthesis was predominant following Rosiglitazone intervention, which also indicates that more CA is synthesized and metabolized to DCA in the intestine. Among these efflux transporters, the MRP family, including MRP3 (ABCC3) and MRP4 (ABCC4), affect the excretion of excessive amounts of hepatic bile acids into the systemic circulation during cholestatic conditions (Trauner and Boyer 2003, Rius et al., 2006, Jia et al., 2018). In this study, upregulation of efflux transporters, ABCC3 and ABCC4, suggest an adaptive hepatocellular protection mechanism against cytotoxic bile acid (DCA) accumulation (Slopianka et al., 2017). Of note, the expression of two members of the solute carrier organic anion transporter family, OATP1A1 and OATP1A4, was decreased after RL administration (Fig. 4c, 5b). In mice, OATP1A1 and OATP1A4 are predominantly expressed in the liver and transport bile acids, such as TCA in vitro (Hagenbuch et al., 2000, Cheng et al., 2005). Thus, OATP1A1 and OATP1A4 are believed to transport bile acids in vivo from blood to the liver. However, the loss of OATP1A1 and OATP1A4 function exacerbates cholestatic liver injury in mice, suggesting that OATP1A1 and OATP1A4 play a unique role in cholestasis (Zhang et al., 2011, Zhang et al., 2012a, Zhang et al., 2012b, Zhang et al., 2013). OATP1A1 and OATP1A4 do not mediate the hepatic uptake of DCA or TDCA, but the lack of OATP1A1 and OATP1A4 increase intestinal permeability and, thus, enhance the absorption of DCA in mice (Zhang et al., 2011, Zhang et al., 2013). Additionally, previous studies have indicated that reduced expression of OATP1A1 may trigger the proliferation of DCA-synthesizing enteric bacteria in the intestine (Zhang et al., 2012a, Zhang et al., 2012b). Therefore, in this study, the crucial factor for DCA accumulation in liver of mice may be the downregulation of OATP1A4 induced by RL. These results were validated to some extent in primary mouse hepatocytes (Fig. 6). On the other hand, DCA is excreted from the liver and almost exclusively conjugated primarily with taurine in mice (Wahlström et al., 2016). Studies have indicated that thiazolidinediones, such as troglitazone, prevent the amidation of DCA, resulting in its accumulation in the liver (Ogimura et al., 2017). Therefore, excessive amounts of DCA absorbed into the liver may not be excreted.
Taken together, it is reasonable to conclude that the mechanism of RL-induced hepatocyte injury is partly due to the downregulation of OATP1A4 stimulating intestinal permeability to enhance DCA uptake and weakening of DCA amidation to reduce DCA efflux, leading to DCA accumulation in hepatocytes (Fig. 7).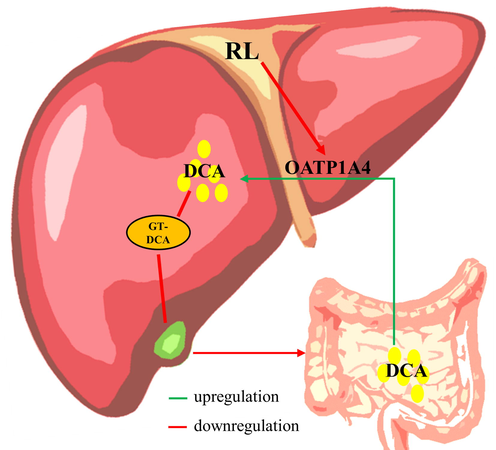
The potential mechanisms of RL-induced hepatocyte injury.
5 Conclusion
In conclusion, Rosiglitazone can induce hepatocyte injury by inhibiting OATP1A4 in mice to increase the accumulation of DCA. Although systematic validation of these results is still necessary, they may still provide useful information regarding the safety and potential risks of Rosiglitazone in clinic.
The authors declare that they have no known competing financial interests or personal relationships that could have appeared to influence the work reported in this paper.
Acknowledgements
The study was supported by the Department of Science and Technology of Guizhou Province (nos. QKHZC [2023] general 261, QKHZC [2021]420) and Guizhou Engineering Research Center of Industrial Key-technology for Dendrobium Nobile (QJJ[2022]48 and QJJ [2022]006).
Declaration of Competing Interest
The authors declare that they have no known competing financial interests or personal relationships that could have appeared to influence the work reported in this paper.
References
- Criteria of drug-induced liver disorders. Report of an international consensus meeting. J. Hepatol.. 1990;11:272-276.
- [CrossRef] [Google Scholar]
- Severe cholestatic hepatitis caused by thiazolidinediones: risks associated with substituting rosiglitazone for troglitazone. Dig. Dis. Sci.. 2002;47:1632-1637.
- [CrossRef] [Google Scholar]
- Drug-induced cholestasis: mechanisms, models, and markers. Curr. Drug Metab.. 2018;19:808-818.
- [CrossRef] [Google Scholar]
- Tissue distribution and ontogeny of mouse organic anion transporting polypeptides (Oatps) Drug Metab. Dispos.. 2005;33:1062-1073.
- [CrossRef] [Google Scholar]
- Pleiotropic roles of bile acids in metabolism. Cell Metab.. 2013;17:657-669.
- [CrossRef] [Google Scholar]
- Integrated metabolomic profiling of hepatocellular carcinoma in hepatitis C cirrhosis through GC/MS and UPLC/MS-MS. Liverint.: Official J. Int. Assoc. Study of the Liver.. 2014;34:1428-1444.
- [CrossRef] [Google Scholar]
- Hepatic failure in a patient taking rosiglitazone. Ann. Intern. Med.. 2000;132:118-121.
- [CrossRef] [Google Scholar]
- Molecular cloning and functional characterization of the mouse organic-anion-transporting polypeptide 1 (Oatp1) and mapping of the gene to chromosome X. Biochem. J.. 2000;345(Pt 1):115-120.
- [Google Scholar]
- The role of flavonoids in root-rhizosphere signalling: opportunities and challenges for improving plant-microbe interactions. J. Exp. Bot. 2012
- [Google Scholar]
- Regulatory effect of fenofibrate on hepatic bile acids homeostasis and the possible mechanism. Chin. J. New Drug. 2017;26:2334-2341.
- [Google Scholar]
- Bile acid-microbiota crosstalk in gastrointestinal inflammation and carcinogenesis. Nat. Rev. Gastroenterol. Hepatol.. 2018;15:111-128.
- [CrossRef] [Google Scholar]
- The role of prolyl hydroxylase domain protein (PHD) during rosiglitazone-induced adipocyte differentiation. J. Biol. Chem.. 2014;289:2755-2764.
- [CrossRef] [Google Scholar]
- Xenobiotic, bile acid, and cholesterol transporters: function and regulation. Pharmacol. Rev.. 2010;62:1-96.
- [CrossRef] [Google Scholar]
- Animal models to study bile acid metabolism. Biochimica et biophysica acta. Mol. Basis Dis.. 2019;1865:895-911.
- [CrossRef] [Google Scholar]
- Bile acids and intestinal microbiota in autoimmune cholestatic liver diseases. Autoimmun. Rev.. 2017;16:885-896.
- [CrossRef] [Google Scholar]
- Second-generation thiazolidinediones and hepatotoxicity. Ann. Pharmacother.. 2004;38:1419-1423.
- [CrossRef] [Google Scholar]
- Development of a mechanistic biokinetic model for hepatic bile acid handling to predict possible cholestatic effects of drugs. Eur. J. Pharm. Sci.: Off. J. Eur. Federation Pharm. Sci.. 2018;115:175-184.
- [CrossRef] [Google Scholar]
- Troglitazone inhibits bile acid amidation: a possible risk factor for liver injury. Toxicol. Sci.: An Off. J. Soc. Toxicol.. 2017;158:347-355.
- [CrossRef] [Google Scholar]
- Systematic review of the incidence of herbal drug-induced liver injury in Korea. J. Ethnopharmacol.. 2015;159:253-256.
- [CrossRef] [Google Scholar]
- Drug-induced liver injury and drug development: industry perspective. Semin. Liver Dis.. 2014;34:227-239.
- [CrossRef] [Google Scholar]
- Substrate specificity of human ABCC4 (MRP4)-mediated cotransport of bile acids and reduced glutathione. Am. J. Physiol. Gastrointestinal Liver Physiol.. 2006;290:G640-G649.
- [CrossRef] [Google Scholar]
- A GAPDH-mediated trans-nitrosylation pathway is required for feedback inhibition of bile salt synthesis in rat liver. Gastroenterology. 2014;147:1084-1093.
- [CrossRef] [Google Scholar]
- Fifty years of advances in bile acid synthesis and metabolism. J. Lipid Res.. 2009;50(Suppl):S120-S125.
- [CrossRef] [Google Scholar]
- Improvement of experimentally induced hepatic and renal disorders in rats using lactic acid bacteria-fermented soybean extract (BiofermenticsTM) Evidence-based Complementary Alternative Med.: eCAM.. 2009;6:357-363.
- [CrossRef] [Google Scholar]
- Quantitative targeted bile acid profiling as new markers for DILI in a model of methapyrilene-induced liver injury in rats. Toxicology. 2017;386:1-10.
- [CrossRef] [Google Scholar]
- Effect of thiazolidinediones on bile acid transport in rat liver. Life Sci.. 2007;80:732-740.
- [CrossRef] [Google Scholar]
- Dose-response of five bile acids on serum and liver bile Acid concentrations and hepatotoxicty in mice. Toxicol. Sci.: An Off. J. Soc. Toxicol.. 2011;123:359-367.
- [CrossRef] [Google Scholar]
- UDP-glycosyltransferases play a crucial role in the accumulation of alkaloids and sesquiterpene glycosides in Dendrobium nobile. Arab. J. Chem.. 2023;16
- [CrossRef] [Google Scholar]
- Hepatotoxicity of the thiazolidinediones. Clin. Liver Dis.. 2003;7(369–379):vi.
- [CrossRef] [Google Scholar]
- Bile salt transporters: molecular characterization, function, and regulation. Physiol. Rev.. 2003;83:633-671.
- [CrossRef] [Google Scholar]
- Impact of seasonal changes on fungal diversity of a semi-arid ecosystem revealed by 454 pyrosequencing. FEMS Microbiol. Ecol.. 2015;91
- [CrossRef] [Google Scholar]
- Bile acid analysis in human disorders of bile acid biosynthesis. Mol. Aspects Med.. 2017;56:10-24.
- [CrossRef] [Google Scholar]
- In vitro prediction of drug-induced cholestatic liver injury: a challenge for the toxicologist. Arch. Toxicol.. 2018;92:1909-1912.
- [CrossRef] [Google Scholar]
- New molecular insights into the mechanisms of cholestasis. J. Hepatol.. 2009;51:565-580.
- [CrossRef] [Google Scholar]
- Intestinal Crosstalk between Bile Acids and Microbiota and Its Impact on Host Metabolism. Cell Metab.. 2016;24:41-50.
- [CrossRef] [Google Scholar]
- Development of method for serum preparation and lipidomics analysis based on rapid resolution liquid chromatography-mass spectrometry. Chin. J. Anal. Chem.. 2013;41:1308-1314.
- [Google Scholar]
- Experimental evidence of liver injury by BSEP-inhibiting drugs with a bile salt supplementation in rats. Toxicol. Sci.: An Off. J. Soc. Toxicol.. 2019;170:95-108.
- [CrossRef] [Google Scholar]
- Protective effects of SRT1720 via the HNF1α/FXR signalling pathway and anti-inflammatory mechanisms in mice with estrogen-induced cholestatic liver injury. Toxicol. Lett.. 2016;264:1-11.
- [CrossRef] [Google Scholar]
- Loss of organic anion transporting polypeptide 1a1 increases deoxycholic acid absorption in mice by increasing intestinal permeability. Toxicol. Sci.: An Off. J. Soc. Toxicol.. 2011;124:251-260.
- [CrossRef] [Google Scholar]
- Organic anion transporting polypeptide 1a1 null mice are sensitive to cholestatic liver injury. Toxicol. Sci.: An Off. J. Soc. Toxicol.. 2012;127:451-462.
- [CrossRef] [Google Scholar]
- Organic anion-transporting polypeptide 1a4 (Oatp1a4) is important for secondary bile acid metabolism. Biochem. Pharmacol.. 2013;86:437-445.
- [CrossRef] [Google Scholar]
- Effects of feeding bile acids and a bile acid sequestrant on hepatic bile acid composition in mice. J. Lipid Res.. 2010;51:3230-3242.
- [CrossRef] [Google Scholar]
- Dysfunction of organic anion transporting polypeptide 1a1 alters intestinal bacteria and bile acid metabolism in mice. PLoS one.. 2012;7:e34522.
- [Google Scholar]
- Role of nuclear receptors in the adaptive response to bile acids and cholestasis: pathogenetic and therapeutic considerations. Mol. Pharm.. 2006;3:231-251.
- [CrossRef] [Google Scholar]
Appendix A
Supplementary material
Supplementary data to this article can be found online at https://doi.org/10.1016/j.arabjc.2023.105142.
Appendix A
Supplementary material
The following are the Supplementary data to this article:Supplementary data 1
Supplementary data 1


