

Translate this page into:
Investigation of silver nanoparticle synthesis with various nonthermal plasma reactor configurations
⁎Corresponding author at: Dr. Sarah Wu, Department of Chemical and Biological Engineering, University of Idaho, 875 Perimeter Drive MS 0904, Moscow, ID 83844-0904. xwu@uidaho.edu (Sarah Wu)
-
Received: ,
Accepted: ,
This article was originally published by Elsevier and was migrated to Scientific Scholar after the change of Publisher.
Peer review under responsibility of King Saud University.
Abstract
One-step silver nanoparticle synthesis by three types of nonthermal plasma reactors. Uniform spherical silver nanoparticles achieved under optimal operating conditions. The synthesised silver nanoparticles showed good stability. Like-free ground DBD showed best performance due to energy delivery capacity.
Abstract
In this work is investigated the effect of nonthermal plasma reactor configurations on the synthesis of silver nanoparticle (AgNP) comparing three reactor configurations: (i) coaxial dielectric barrier discharge (DBD), (ii) like-free ground DBD, and (iii) corona plasma discharge. To make the AgNP synthesis cost-effective and eco-friendly, no reducing agent was used and to get stable particles, instead inexpensive sucrose was used as capping agent. The formation and stability of AgNP were verified using ultraviolet–visible (UV–Vis) spectroscopy and energy dispersive spectroscopy (EDS). The concentration and stability of AgNP were found to be dependent on various process parameters, with the optimal conditions of applied voltage, gas flow rate, treatment time, nozzle distance, silver nitrate concentration and sucrose concentration determined at 12 kV, 1.5 L/min, 180 s, 1.0 cm, 0.5 mM, and 20 mM, respectively. The surface morphology and particle size distribution (PSD) obtained with transmission electron microscopy (TEM) showed that the nanoparticle (NP) synthesized by coaxial DBD and corona plasma were spherical in shape with a wide PSD, and their average size was 6.2 nm and 9.6 nm, respectively. On the other hand, those NP synthesized by like-free ground DBD were mostly spherical, along with a few hexagon and triangular shapes. With like-free ground DBD, the PSD was found to be significantly narrower, and the average particle size was 20 nm which is bigger compared to NP synthesized by coaxial DBD and corona plasma. Better performance of AgNP synthesis by the like-free ground DBD is most likely due to higher energy delivery capacity.
Keywords
Plasma jet
Corona plasma
Silver nanoparticles
Reactor configuration
Coaxial DBD
Particle size distribution

1 Introduction
Nanotechnology is one of the most studied subjects nowadays due to its uses in many areas of industry, including optical sensing, catalytic activities, electronics, biochemistry, energy storage, data storage, agriculture sector, cancer therapy, disease and diagnosis, drug delivery, antimicrobial coatings, and many more (Zhang, 2016; Habib et al., 2022; Dawadi, 2021; Calderón-Jiménez, 2017; Abou El-Nour, 2010). Nanoparticle (NP) has unique properties attributed to quantum effects, high surface area, and self-assembly (Khan et al., 2019; Properties, 2016). The quantum effect can control the optical, electrical, and magnetic properties. The high surface area, on the other hand, can increase the catalytic activity compared to the same mass of bulk particles, as the NP has a more active site than the bulk particles.
According to Precedence Research, the global nanotechnology market size was 97.42 billion in 2022, and it will expand to 288.71 billion by 2030 with a registered CAGR (compound annual growth rate) of 14.50% from 2022 to 2030 (Market, 2022). This massive market size indicates its importance at present and in the future. As a result, many technologies, including mechanical mailing, etching, sputtering, electro-explosion, supercritical fluid synthesis, spinning, sol–gel process, laser pyrolysis, chemical vapour deposition, chemical reduction, plasma synthesis, and green synthesis, have been introduced to synthesize NP (Tsang, 2018; Spreafico et al., 2022; Nasrollahzadeh, 2021; Mondal et al., 2020; Manawi, 2018; Li et al., 2004; Kotov, 2003; Hussain, 2020; Huang and Ehrman, 2007; He, 2022; Hashemi et al., 2020; Gogoi et al., 2019; Bokov, 2021; Baig et al., 2021). Currently, a variety of techniques are used in the state-of-the-art method for the manufacture of NP, including chemical reduction (Wang, 2005; Quintero-Quiroz, 2019; Eka Putri, 2019), physical procedures (Ijaz, 2020), photocatalyst (Zuo, 2022; Li, 2023), and biological approaches (Pandit, 2022). The chemical reduction process has some limitations, including size and shape control, reproducibility, use of toxic chemicals, stabilization issues, scale-up challenges, etc. Physical methods of synthesising nanoparticles, such as laser ablation, sputtering, or flame spray pyrolysis, also have some drawbacks, such as size and shape control, equipment complexity, limited scalability, narrow applications, high energy consumption, etc. Photocatalysis, which utilizes light to drive chemical reactions, including nanoparticle synthesis, also has certain limitations including limited material compatibility, narraw wavelength range, low quantum efficiency, reaction conditions, catalysts stability, and contaminations. The employment of microbes, plants, or enzymes in biological methods for synthesizing nanoparticles has some drawbacks as well which include lack of controle over size and shape, slow synthesis rate, limited material compatibility, contamination and purity, batch-to-batch variability, and scale-up challenges. To overcome these problems, in this study, an attempt was made to synthesize AgNP, using nonthermal plasma technology due to its unique advantages over the aforementioned technologies. Nonthermal plasma technology is relatively cheap, eco-friendly, provides extremely fast reactions using activated reactive chemical species and can realise better morphology and particle size distribution control (Vollath, 2008; Niu, 2022; Nancy, 2018; Mohammed et al., 2022; Jamkhande, 2019; Farajimotlagh et al., 2017; Bratescu, 2011). In general, plasma-based nanoparticle synthesis provides precise control, scalability, and a variety of material alternatives, making it an effective method for creating nanoparticles with specialized features to satisfy various technical and scientific objectives.
There are two main techniques for synthesising NP using plasma: (i) gas phase plasma-liquid interaction and (ii) plasma in-liquid phase (Bratescu, 2011; Rezaei, 2019; Horikoshi and Serpone, 2017; Bruggeman, 2016). A stable plasma in the gas phase is easy to generate with a simple and low-cost power source along with low frequency, low current and low applied voltage, and then this plasma can interact with the liquid surface and transfer the plasma species and energetic electrons to the solution, which helps to develop an electrochemical needed for NP formation (Kim et al., 2020). Plasma in-liquid phase, on the other hand, needs a high-cost power source with a high frequency, high current and high applied voltage in order to generate a stable plasma, which is somewhat difficult to control (Bruggeman, 2016; Kim et al., 2021; Chauvet, 2020; Sato, 2011). This study used a simple and low-cost power source to generate gas-phase plasma in three different configurations in order to compare and select the most effective plasma discharge configuration for NP synthesis.
Herein, three plasma reactor configurations: (i) coaxial DBD, (ii) like-free ground DBD, and (iii) corona plasma were studied to synthesize NP. The coaxial DBD is the simplest and widely used for the degradation of pollutants and wastewater treatment. It is made with a cylindrical tube with one or two dielectric barriers. Using this technique, glow discharge, micro discharge and plasma jet can be generated. In this work, coaxial DBD with a double barrier was used to generate DBD plasm jet to synthesize NP. Like-free ground DBD is mostly used for NP synthesis and wastewater treatment. This reactor configuration is mainly made with only a single barrier. Corona plasma, on the other hand, has no dielectric barrier or ground electrode; instead, it uses air as a ground electrode. To generate corona plasma, high voltage is needed for an electrode that has a sharp tip and the plasma forms at that sharp tip. The researchers often use a linear array of electrodes to create corona plasma. Herein, five electrodes with sharp tips were used to generate a corona jet for NP synthesis. All three reactor configurations were studied to synthesize noble metal silver nanoparticles.
Recent statistics show that AgNP is the most investigated and commercialised NP compared to other noble metals, which account for 55.4% of the total nanomaterial-based consumer goods available in the market as it is inexpensive, has good conductivity, chemical stability, catalytic activity, antibacterial activity, etc. (Zhang et al., 2007; Xu, 2006; Tejamaya, 2012; Sharma et al., 2009; Marciniak, 2020; Huang, 2018; Dobias and Bernier-Latmani, 2013; Agnihotri et al., 2014). Due to their special features, AgNP is used in a wide range of fields. AgNP is advantageous in applications, including wound dressings, coatings for medical equipment, and antibacterial textiles because they have good antimicrobial characteristics. In the area of heterogeneous catalysis, in particular, it has extraordinary catalytic activity. They can operate as catalysts in a variety of chemical processes, including oxidation, reduction, and organic changes (Wang, 2022; Tang, 2022). AgNP is used in the synthesis of fine compounds, pharmaceuticals, and environmental cleanup. In the area of nanomedicine, it offers intriguing uses. Their huge surface area makes them suitable for drug delivery systems, where it enables efficient loading and regulated release of medicinal substances. To synthesize AgNP, researchers often use reducing agents like citrate, sodium borohydride, ammonia, ethylene glycol, paraffin, and dimethylformamide which are not eco-friendly (Lee and Jun 2019; Iravani, 2014; Gamboa, 2019). Apart from this, to avoid uncontrol growth and departicle, capping agents such as poly (vinylpyrrolidone) polymers, trisodium, citrate, oleylamine, starch, polyethene glycol, and sucrose have been used by the researchers (Lee and Jun 2019; Iravani, 2014; Gamboa, 2019).
This work aims to investigate three different plasma reactor configurations and determine the optimal conditions for AgNP synthesis. To make this work simple, cost-effective, and eco-friendly, no reducing agent was used. However, because sucrose is cheap and ecologically friendly, it was chosen as a capping agent to produce stable AgNP.
2 Materials and methods
2.1 Materials
Two chemicals, namely silver nitrate and sucrose were used for this study. Metal salt silver nitrate (ASSAY: 99.9%) was used as a source of silver which was purchased from Thermo Fisher Scientific, USA. Sucrose (Sigma Aldrich, USA) (ASSAY: 99.5%) was used as a capping agent so that departicle (back to atomic form) and uncontrolled growth could be avoided. All the chemicals used in this study were used without further purification.
2.2 Solution preparation
All solutions were prepared using deionized water (DI). The pH and conductivity of the DI water were 4.1 and 49 µS, respectively. The main precursor (silver nitrate) concentration was varied from 0.1 to 1.0 mM, and the capping agent (sucrose) concentration was varied from 0 to 25 mM. All the chemicals were added to the DI water, and then the solution was stirred using a magnetic stirrer for 30 min to get a homogeneous solution. The pH and conductivity of the homogeneous solution were measured again and found to be 4.9 and 138 µS, respectively.
2.3 Apparatus and methods
The experimental setup of all the plasma reactors used in this study can be seen in Fig. 1. The plasma was generated using a PVM500-Plasma Power Generator from Information Unlimited, USA, with operating frequency set to 20 kHz. All the reactor housing was built with quartz tubes. 1.5 mm diameter stainless steel needle was used as a high voltage electrode for the like-free ground DBD plasma and corona plasma jet. A copper sheet with 0.5 mm thickness was used as high voltage and ground electrodes to generate a coaxial circles DBD plasma/coaxial DBD jet. The inner and outer diameters of the exit nozzle of all the reactors were 3.5 and 5 mm, respectively. The end of the nozzle from the surface of the solution was varied from 0.5 to 1.5 cm. The plasma formation was examined using applied voltage ranging from 6 to 14 kV, and the discharge gas flow rate varied from 0.5 to 2 L/min. In all cases, 40 ml of solution was used in this study and the treatment time also varied from 60 to 240 s. Argon gas (99.99%) was used at a rate of 1.5 L/min to generate the atmospheric pressure plasma. A mass flow controller was used to control the gas flow rate precisely. The applied voltage of plasma discharge was monitored and recorded using an oscilloscope (DPO 3034, Tektronix, USA) with a Tektronix high voltage probe (P6015A, Tektronix, USA). The applied power used by each reactor was recorded by a Watt meter (PN1500, Poniie Corporation). The plasma chemistry of this study was investigated to identify the plasma species produced during plasma discharge using optical emission spectroscopy (OES, Ocean Optics HDX-UV–VIS). An optical fiber tip was positioned 3 cm away from the plasma for all the reactors to record the OES data. The pH and conductivity of the solutions were measured using PC850 Portable pH/Conductivity Meter Kit (PC850, APERA Instrument, USA). The confirmation of AgNP formation was studied using a UV–visible spectrometer (Synergy HT, BIO-TEK INSTRUMENTS, INC., USA). The surface morphology and the particle size distribution (PSD) were studied using transmission electron microscopy (TEM) analysis (Libra 200 MC TEM, Carl Zeiss, Germany) and the ImageJ software. Elemental characterisation of AgNP was done using energy dispersive spectroscopy (EDS) (X-max 80 T, Oxford, UK).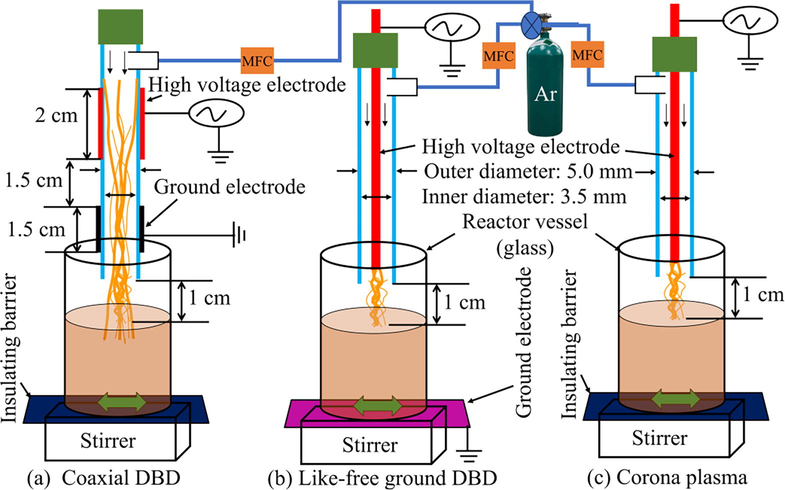
Experimental setup of the plasma reactors for nanoparticle synthesis using (a) coaxial DBD, (b) like-free ground DBD, and (c) corona plasma.
3 Results and discussion
3.1 Determination of optimal process conditions for AgNP synthesis
Synthesis of NP using plasma is a time and energy-saving technology compared with typical technology. Even though plasma technology has several advantages over the conventional method of NP synthesis, it is still challenging to find out the optimal parameters such as applied voltage, discharge gas flow rate, treatment time, exit nozzle distance from the solution surface, precursor concentration, capping/reducing agent concentration, etc. The focus of this study was to make a comparison between different reactors' configurations for NP synthesis. But the optimisation of process was first done using only one reactor configuration before further testing of optimal conditions with other reactor configurations.
Optimisation experiments were done using like-free ground DBD plasma configuration. Fig. 2 shows the effect of four different parameters, i.e., applied voltage (AV), gas flow rate (GFR), treatment time (TT), and nozzle distance (ND), on NP synthesis. The concentration of silver nitrate and sucrose were kept constant at 0.5 and 20 mM, respectively, where silver nitrate was used as a main precursor and sucrose was used as a capping agent. First of all, the effect of the applied voltage on NP formation was determined using 5 levels of applied voltage ranging from 6 kV to 14 kV and the results are shown in Fig. 2 (a). To understand the effect of applied voltage, gas flow rate, treatment time, and nozzle distance from the surface of the solution were kept constant at 1.5 L/min, 120 s, and 1.0 cm, respectively. The UV/Vis absorption peaks at around 410 nm confirmed the silver nanoparticles formation. At 6 kV applied voltage, a very small peak appears at 410 nm. The reason behind it is that at 6 kV, the plasma discharge was weak causing a low energy delivery, thus forming very small amount of AgNP. When the applied voltage increased from 6 to 14 kV with a 2 kV interval, the peak intensity of AgNP also increased. This phenomenon is due to the delivery of more energy. At low applied voltage, the delivered energy density is low, which means the nucleation process in the liquid is also slow, resulting in fewer particle formation. With the increased applied voltage, the energy density delivered to the solution also increased, resulting in faster nucleation and, therefore, more particle formation, which gives the higher peak intensity. Here also noticeable is that the particle formation at 12 kV and 14 kV is almost the same, and the 14 kV is the maximum output voltage that the used power source can deliver. Therefore, 12 kV was chosen as the optimal applied voltage based on the peak intensity and the power source's safe operation.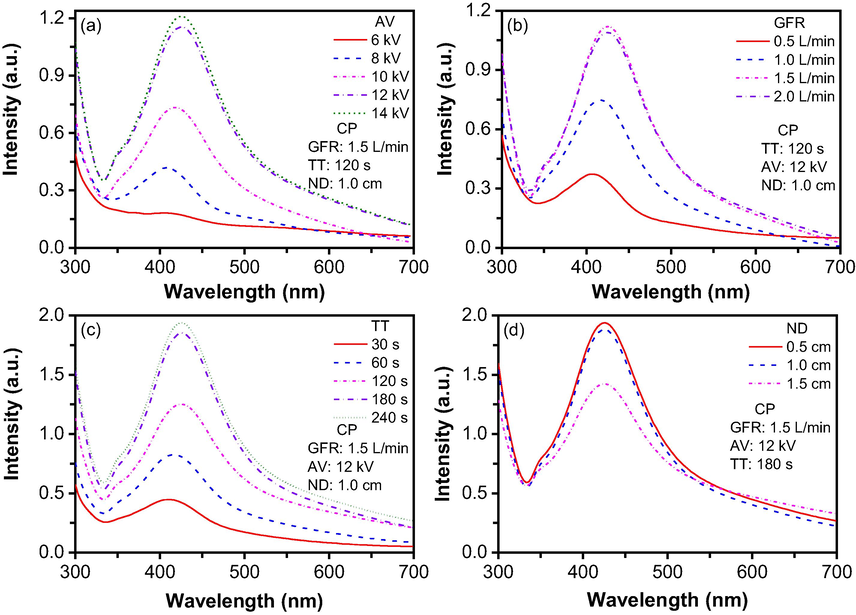
Dependence of nanoparticle formation on (a) applied voltage, (b) gas flow rate, (c) treatment time, and (d) nozzle distance from the surface of the solution.
After finding the optimal applied voltage, the goal was to determine the optimal gas flow rate. Fig. 2(b) shows the effect of gas flow rate on nanoparticles formation. In this study, treatment time, applied voltage, and nozzle distance from the surface of the solution were kept constant at 120 s, 12 kV, and 1.0 cm, respectively. An increase in peak intensity was observed when the GFR changed from 0.5 to 2 L/min. As the flow rate increases, the discharge power increases because with a higher flow rate, more gas molecules are available to form charged species which can propagate more readily toward the ground electrode (Nguyen, 2020), resulting in increased discharge power to help form more nanoparticles. The UV peak intensity depends on the nanoparticle concentration, therefore, more discharge power leads to forming more nanoparticles resulting in higher peak intensity. Gas flow rate of 1.5 and 2 L/min didn’t seem to produce a change in discharge power, and therefore no increase in peak intensity as the GFR increased to 2 L/min. As a result, 1.5 L/min was chosen as the optimal GFR for this study.
The third objective was to find the optimal treatment time to get the maximum UV peak intensity of AgNP without particle agglomeration. Fig. 2(c) shows the effect of treatment time on NP synthesis. In this case, gas flow rate, applied voltage, and nozzle distance from the surface of the solution were kept constant at 1.5 L/min, 12 kV, and 1.0 cm, respectively. The effect of plasma treatment time was essential to understanding the nucleation and crystal growth involved in the synthesis of NP. It seems that treatment time from 30 to 120 s was insufficient to reduce the cations. When the treatment time increased to 180 s, the UV peak intensity seemed to reach its maximum because further increasing the treatment time to 240 s had no significant enhancement in the UV peak intensity. It could be inferred that at 180 s treatment time, almost all the Ag atoms took part in the nucleation process; therefore, near-maximum peak intensity was found. Hence, 180 s was chosen as an optimal treatment time for this study.
The fourth parameter, nozzle distance from the surface of the solution, was studied to see the effect on NP formation. Fig. 2(d) shows the UV peak intensity at various nozzle distances from the surface of the solution in the range of 0.5–1.5 cm. In this study, we kept the determined optimal parameters, applied voltage, gas flow rate, and treatment time constant at 12 kV, 1.5 L/min, and 180 s, respectively. From Fig. 2(d), it is clearly shown that there is no significant difference in peak intensity between 0.5 and 1.0 cm nozzle distance from the surface of the solution (ND). It indicates that there is no difference in discharge power at 0.5 and 1.0 cm nozzle distance; therefore, the reaction kinetic remains the same resulting in similar UV peak intensity. But when the nozzle distance increases to 1.5 cm from the solution's surface, the discharge power delivery to the solution decreases; as a result, the nucleation also decreases, reducing the UV peak intensity. The main reason behind it was that when the gap increased between the solution's surface and the nozzle, it increased the resistance and decreased the power at a constant applied voltage, which was the main reason for the lower peak intensity. Either 0.5 cm or 1.0 cm ND can be used, together with the fact that 1.0 cm nozzle distance allowed to form stable plasma jet compared to 0.5 cm for the other two types of configurations for the plasma reactor, 1.0 cm was chosen as an optimal nozzle distance from the surface of the solution.
3.2 Influence of precursor and capping agent concentrations on NP formation
The precursor and capping agent concentrations have a huge effect on NP formation. Fig. 3 shows the effect of silver nitrate and sucrose content on NP formation. The concentration of precursor is critical in the plasma NP synthesis process because low concentrations often form no particles. High concentrations can create very bulky and agglomerated particles due to excessive energy if a capping agent is not used. Fig. 3(a) shows the effect of silver nitrate concentration when other parameters of applied voltage, treatment time, gas flow rate, nozzle distance from the surface of the solution, and sucrose concentration were kept constant at 12 kV, 180 s, 1.5 L/min, 1.0 cm, and 20 mM, respectively. The UV peak intensity increased for 5 times as the silver nitrate boosted from 0.1 mM to 0.5 mM, which indicated that the higher availability of silver atoms allowed the formation of more NP resulting in higher peak intensity. However, when the concentration further increased to 1.0 mM, the UV peak intensity reduced about 25% as compared to that for the AgNO3 concentration of 0.5 mM. This observation can be explained with the help of the effect of capping agent concentration on NP formation. Without a capping agent (0 mM sucrose in Fig. 3(b)), NP may have been formed, but these NP are not stable, and after just a few minutes, NP despair from the solution. The reduced peak intensity is due to insufficient capping agent concentration against per particle, therefore, the NP was not stable and resulting in a decrease in peak intensity. Apart from this, a higher concentration of Ag precursor in the solution also needs more energy to form stable NP. But the applied voltage was constant, which also means the supplied energy was constant; therefore, when silver nitrate concentration increased from 0.5 to 1.0 mM, the peak intensity decreased. Hence, 0.5 mM silver nitrate concentration was considered the optimal precursor concentration for this study.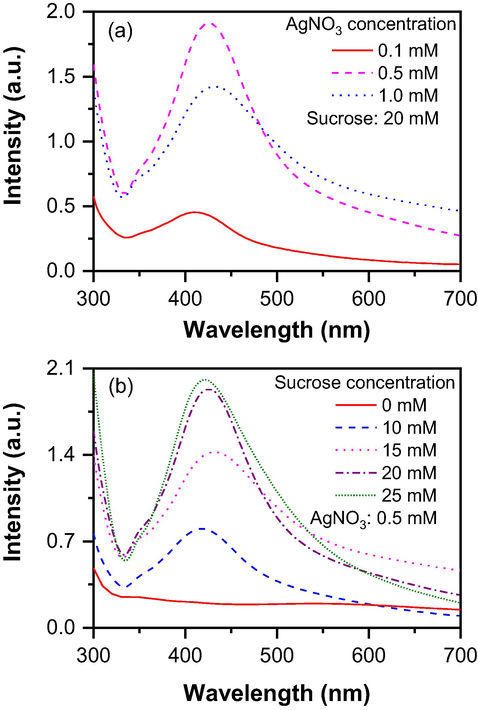
Dependence of nanoparticle formation on (a) silver nitrate concentration and (b) sucrose concentration.
The effect of capping agent concentration was also studied to find out the optimal level for AgNP synthesis. As sucrose was used as a capping agent, sucrose concentration varied from 0 to 25 mM and the NP formation was observed by the UV peak intensity. Fig. 3(b) shows the effect of sucrose concentration when all other parameters such as applied voltage, treatment time, gas flow rate, nozzle distance from the surface of the solution, and silver nitrate concentration were kept constant at 12 kV, 180 s, 1.5 L/min, 1.0 cm, and 0.5 mM, respectively. An interesting phenomenon was seen when sucrose was not used in the solution as a capping agent. After treating the solution, the color of the solution was changed, which indicates that the NP was formed but soon after the treatment, the color of the solution disappeared and, and no peak was found when UV intensity was measured for the samples, which can be seen in Fig. 3 (b). After that, the sucrose concentration was increased to 10 and 15 mM and observed raised UV peak intensity. The peak intensity of 15 mM was found to be higher than that of 10 mM. The reason behind this was that with higher sucrose concentration, more NP can be stabilised; therefore, fewer departicle happened and resulted in higher peak intensity with 15 mM sucrose. The peak intensity increased with the sucrose concentration as the sucrose concentration further increased to 20 and 25 mM. In these conditions, the UV peak intensity increased compared to sucrose concentration of 15 mM, but almost remained the same for 20 and 25 mM concentrations which indicated that all the silver atoms available in the solution took part in the nucleating process and formed NP and sufficient sucrose molecules available in the solution stabilised them, therefore, no significant change was found between 20 and 25 mM based on these results, 20 mM was determined as the optimal sucrose or capping agent concentration.
3.3 Effect of reactor configurations on NP synthesis
To further determine the effect of reactor configurations on NP synthesis, which is the main objective of this study, optimal process conditions determined in Section 3.2 were used to investigate the effectiveness of three different reactor configurations for AgNP production. Fig. 4(a) shows the UV–visible spectrum of AgNP at various reactor configurations. The formation of the AgNP can be seen from the UV–visible peak, and the peak intensity clearly showed the effect of NP formation by the various reactor configurations. The treatment time, applied voltage, gas flow rate, the distance between the exit of the nozzle and the surface of the water, AgNO3 concentration, and sucrose concentration were constant at 180 s, 12 kV, 1.5 L/min, 1.0 cm, 0.5 mM, and 20 mM, respectively, for the experiments of all the three reactor configurations. Fig. 4(a) shows AgNP synthesis by coaxial DBD produced a very small UV peak intensity compared with like-free ground DBD and corona. With the like-free ground DBD configuration, the maximum peak intensity was achieved as compared to other configurations used in this study in similar conditions. The maximum peak intensity in the context of AgNP synthesis using UV–vis spectroscopy refers to the maximum absorption peak seen in the UV–vis spectrum of the generated nanoparticles. When silver nanoparticles are formed, they exhibit a phenomenon called localized surface plasmon resonance (LSPR). LSPR is a collective oscillation of the conduction electrons brought on by the incident light in the metal nanoparticles. The UV–vis spectrum exhibits distinctive absorption peaks as a result of this resonance's intense light absorption at particular wavelengths. This maximum peak intensity only happens when all the available metal ions forms NP and there is nothing to form more NP in the colloidal solution. The maximum peak intensity of AgNP in the UV–vis spectrum offers details on the size, concentration, and quality of the synthesis process as well as the nanoparticles' composition. It is an important variable for describing and assessing the synthesized AgNP.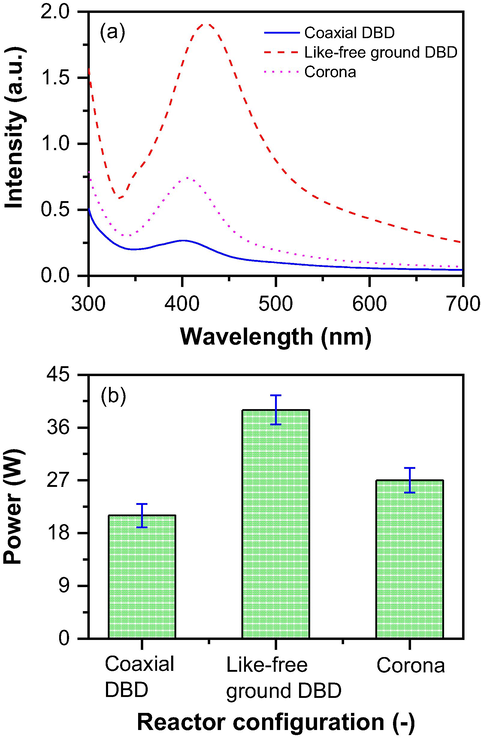
(a) Influence of plasma reactor configurations on nanoparticle formation and (b) power consumptions by the plasma reactors.
These different peak intensities with different configurations can be explained by estimating the power consumption of the reactors. Fig. 4(b) shows the input power drawn by the reactors during NP synthesis. From this figure, it is clearly seen that like-free ground DBD consumed much more power than coaxial DBD and corona. On the other hand, coaxial DBD consumed less power than other reactor configurations. The NP formation mainly depends on the energy supply to the solution. With high energy, the formation of nucleation starts quickly compared to low energy. The faster the nucleation, the faster the formation of the particles. As like-free ground DBD reactor configuration consumed more power, it can produce more nanoparticles in similar conditions compared to coaxial DBD and corona plasma reactor configurations.
3.4 Elemental characterisation of AgNP
The prepared AgNP were also characterised using EDS analysis, as it is simple and comes with a TEM device. All the data were prepared using optimal conditions are presented in a supplementary document. Fig. S1, S2, and S3 show the result of AgNP synthesis by coaxial DBD, like-free ground DBD, and corona discharge, respectively. All the figures show a strong EDS spectrum corresponding to Ag metal in the region of 3 keV which is actually a typical region for Ag metal, confirming the generation of AgNP. Apart from this, a strong carbon and copper spectrums can be seen in every figure, which came from the TEM grid used during sample characterization (Singh, 2016; Mao, 2018; Luo, 2015).
3.5 Stability of synthesized AgNP by various plasma reactor configurations
The stability test of AgNP was done using observation of treated solutions and UV–Vis spectroscopy. Fig. 5 shows the UV–vis results and photography image (images were taken by iPhone 7) of the synthesized AgNP by coaxial DBD, like-free ground DBD, and corona plasma. The images were captured in a 24 h interval from the fresh produced until 72 h storage under ambient conditions, shown in Fig. 5(a-d), (1)-(3) were those synthesized by coaxial DBD, like-free ground DBD, and corona plasma, respectively. The a1, a2, and a3 images (Fig. 5(a)) were taken right after the treatment, indicating 0 h and then 24 h later, b1, b2, and b3 images (Fig. 5(b)) were taken. By this time, there were no visible changes observed. Similar results also were also observed after 48 h. But after 72 h, it seems AgNP prepared by coaxial DBD (Fig. 5(d1)) and corona DBD (5 (d3)) were changed a little from their original (Fig. 5(a1) and 5 (a3) whereas AgNP prepared by like-free ground DBD (Fig. 5(d2)) remain unchanged even after 72 h. These results were backed up by UV–Vis spectroscopy. Fig. 5(e) shows the UV absorption peaks for the AgNP right after the synthesis while Fig. 5(f) shows the results after 72 h. It is clearly seen that the intensity of the UV peaks for coaxial DBD and corona plasma have been reduced, which indicates that particles may have gone back to their atomic form.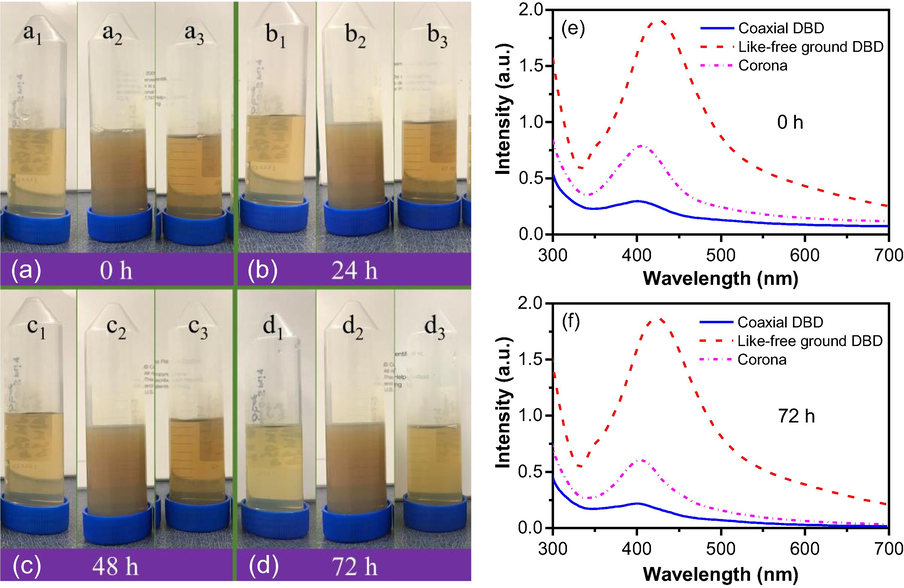
Photography images of treated solution of AgNP for stability check at (a) after 0 h, (b) 24 h, (c) after 48 h, (d) after 72 h, and UV–visible spectroscopy results of AgNP at (e) after 0 h and (b) after 72 h.
3.6 Surface morphology and particle size distribution
Surface morphology and particle size distribution (PSD) were studied using TEM analysis for treated samples from all three reactor configurations. Fig. 6(a), 6(b), and 6(c) show the two-dimensional surface morphological structure for NP synthesized by coaxial DBD, like-free ground DBD, and corona plasma, respectively, analysed by TEM. The particle size of the particles synthesized by the different plasma configurations are very different from each other, as can be seen clearly in Fig. 6, and these results can be explained by the power consumption of the reactor during the plasma treatment. Most of the particles were found to be spherical in shape, but a few triangular and hexagonal particles were found mainly in the AgNP sample prepared by the like-free ground DBD configuration.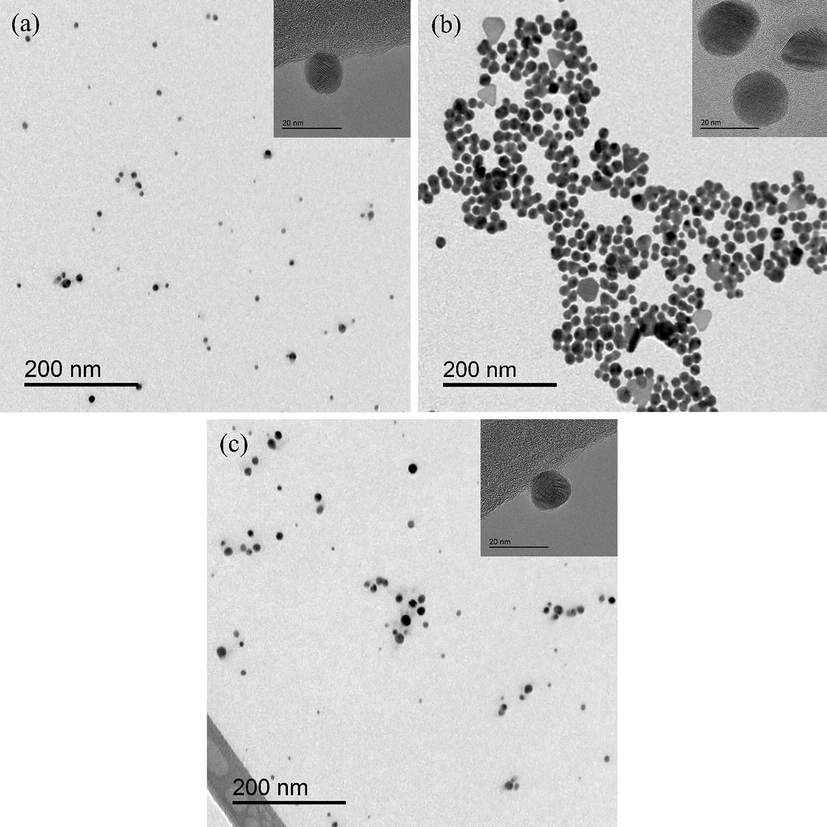
TEM images of AgNP synthesized by (a) coaxial DBD, (b) like-free ground DBD, and (c) corona plasma.
All the samples were treated at 12 kV applied voltage, but the power consumptions were different for the three reactor configurations at this applied voltage (see Fig. 4(b)), which indicated that the levels of electric current were different for the three reactor configurations, among which coaxial DBD (Fig. 6(a)) consumed less power than others, meaning less current was drawn. On the other hand, like-free ground DBD. (Fig. 6(b)) consumed the highest power, and the highest current was drawn. A higher current means more electrons flow; therefore, when the current increases, more electrons inject into the precursor solution from the plasma per unit time. This has probably led to an increase in particle nucleation rate compared to other configurations and, therefore, more particles produced with uniform size. Not all the injected electrons from plasma were involved in Ag+ reduction; some of them were involved in the charge transfer process, such as charging the produced AgNP at the interfacial region (Richmonds, 2011; Patel, 2013; Huang et al., 2014). On the other hand, more and more AgNP are being charged, which repel each other and therefore prevent particle agglomeration. Due to the high power consumption by the like-free ground DBD compared to other configurations used in this study, the AgNP is more uniform and relatively bigger in size, as seen in Fig. 6(b). On the other hand, power consumption by the corona reactor is slightly higher than that by the coaxial DBD reactor; therefore, the particle size (Fig. 6(c)) is also a little bigger and more uniform but not as uniform as that by the like-free ground DBD reactor.
Fig. 7 shows the particle size distribution (PSD) of AgNP synthesized by the coaxial DBD, like-free ground DBD, and corona plasma. To get the PSD, total of 200 NPs were counted. Based on their range of size, those data were plotted and obtained the PSD plots. Typically, uniform NP give narrow distribution, and nonuniform NP provide wide distribution. For NP synthesis, one of the primary goals is to obtain uniform NP. Uniform NP can be achieved only when the optimal parameters such as treatment time, energy density, precursor concentration and capping agent concentration are achieved (Sugimoto, 2007; Li et al., 2007; Čempel, 2017; Cattaneo, 2019; Abyadeh, 2017).
Particle size distribution of AgNP synthesized by (a) coaxial DBD, (b) like-free ground DBD, and (c) corona plasma.
Fig. 7 (a) shows the PSD obtained by the coaxial DBD reactor configuration treatment. A wide range PSD was achieved, indicating that particles are not uniform and their average size lies between 5.2 and 6.6 nm. In this case, the smaller particle size was found to be around 3 nm, and the maximum particle was around 10.5 nm. This wide range of particle sizes was only obtained due to a lack of enough energy supply to the solution. In the case of Fig. 7 (b), like-free ground DBD was used. In this case, a narrow PSD was achieved with an average NP size/diameter of around 20 nm. With this reactor configuration, a few triangular shape particles were also found, and those were very uniform in size, which was around 37 nm and considered to be the biggest of all. The reactor of corona configuration (Fig. 7 (c)) produced a much wider PSD with slightly bigger (9.6 nm) NP than the coaxial DBD configuration confirming the nonuniform PSD, most likely due to the insufficient energy delivered to the solution by the corona plasma as well.
3.7 Particle shape distribution
Particle shape distribution was also studied using TEM image analysis and the ImageJ software. The shape of the particles depends on several spatial processing conditions, including the capping agent in the solution, the energy provided by the power source, the reactor configuration, and the treatment time (Sau and Rogach, 2010; Riazi, 2016; Millstone, 2008; Henry, 2005; Bakshi, 2016). However, to understand the morphology or control the morphology, the reaction kinetic needs to be studied in-depth, which will be done in future studies. The presence of different structural shapes of the NP can be seen in Fig. 7, and Fig. 8 represents their percentage in the treated solution. The NP synthesis by the coaxial DBD and corona configurations show a wide range of particle distribution with 100% spherical (Fig. 8) in shapes. On the other hand, 76% spherical, 17% hexagon, and 7% triangular-like particles were found in the NP synthesized by the like-free ground DBD configuration, which can be seen in Fig. 8 (Patel, 2013; Čempel, 2017; Shukla, 2006; Lomelí-Rosales, 2019). Like the PSD, the different particle shape distribution produced by different reactor configurations can also be attributed to the power consumption by the reactors. As the reaction kinetic depends on many parameters, including the energy supply to the solution, the particle shapes can be different when the energy delivery varies.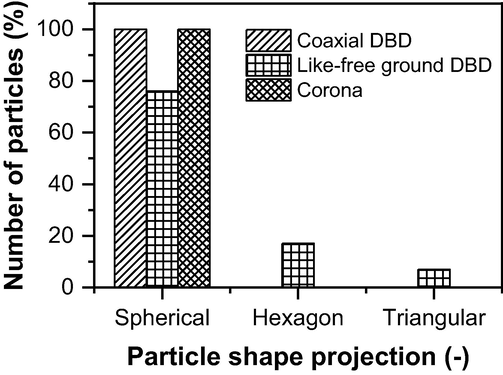
Particle shape distribution of AgNP synthesized by coaxial DBD, like-free ground DBD, and corona plasma.
This study justified the comparability over published works regarding applied energy, treatment time, and particle size with their size distribution, shown in Table 1. Since there are not a lot work done for plasma synthesis of AgNP and most of them mentioned only a single parameter such as power or applied voltage. Therefore, Table 1 gathered the available energy supply information and only the best results in terms of particle size and distribution from each study for the comparison. Sato et al. (Sato, 2011) used a microwave frequency power source to synthesize AgNP using the applied power of 500–600 W with 90 s treatment time. The synthesized NP was spherical in shape and showed a wide range of PSD. Jin et al., Kim et al., and Lee et al. (Jin, 2014; Kim, 2018; Lee, 2013) synthesized AgNP using an expensive pulse power source that consumes more power than a normal kHz power source. All the synthesized NPs were spherical in shape with wide PSD. Zhang et al., Tasche et al., Habib et al., and Yamada et al. (Habib et al., 2022; Zhang et al., 2011; Tasche, 2020; Yamada, 2019) also synthesize AgNP. They used a kHz power source to generate plasma discharge for NP synthesis. Among them, Tasche et al. (Tasche, 2020) found a narrow PSD but used high discharge power (160 W) for 60 s. All other studies found wide PSD with a spherical shape indicating that particles were not uniform. On the other hand, the synthesis of AgNP in this study uses only 39 W (20 kHz frequency) using like-free ground DBD to generate plasma that synthesizes very uniform nanoparticles compared to other similar studies. Therefore, this work is comparable over the reported work for energy efficiency. N/A: not applicable.
Stabiliser or surfactant
Reducing agent or solvent
Energy supplied (power, frequency, current, voltage)
Treatment time (s)
Particle size (nm)
Particle size distribution
Particle shape
Reference
Polyvinylpyrrolidone
N/A
500–700 kW (2.45 GHz, microwave)
90
1–12
wide
spherical
(Sato, 2011)
N/A
N/A
1000 V (20 kHz)
120–600
12–108
wide
spherical, dendritic
(Jin, 2014)
N/A
N/A
3.8 kV (5 kHz)
300
25–130
wide
spherical
(Kim, 2018)
Cetyltrimethylammonium bromide
N/A
250 V (30 kHz)
300
5–20
wide
spherical
(Lee, 2013)
Polyvinylpyrrolidone
Ethanol
5 kV (67.5 kHz)
600
3.5–30
wide
spherical
(Zhang et al., 2011)
Sodium citrate
N/A
160 W (14.5 kHz)
60
1–10
narrow
spherical
(Tasche, 2020)
Trisodium
citrateN/A
8 A (25 kHz)
300
100–200
wide
spherical
(Habib et al., 2022)
Starch
N/A
10 kV (10 kHz)
N/A
3–27
wide
spherical
(Yamada, 2019)
Sucrose
N/A
39 W (20 kHz)
180
15–24
narrow
spherical, triangular, hexagon
This work
3.8 Excited reactive species by different plasma reactor configuration
OES data were recorded to identify the excited reactive species that were formed during the plasma discharge with and without the presence of a liquid solution. Fig. 9 shows the OES spectrums using coaxial DBD, like-free ground DBD, and corona plasma discharge. All spectra were captured under conditions with the presence of liquid solutions except the plasma in air which was recorded without the presence of liquid solution for the purpose of comparison. The plasma was generated at12 kV of applied voltage, and an optical fiber with a tip for capturing the light was placed 3 cm away from the plasma discharge. Since the plasma was generated in atmospheric pressure, the spectrum was mostly dominated by the argon and nitrogen species due to the presence of nitrogen in the air. A group of NO species from 220 to 275 nm were only detected in the plasma plume generated in the air. The NO group and O radical disappeared in the presence of a liquid precursor for all cases. This may be due to the plasma tip interacting with the liquid solution, which did not allow enough time for the plasma to form NO species and O radicals. Apart from this, the OH radical at 295.9 was generated by all the plasma configurations, but OH radical at 313 (Hossain, 2022; Hossain, 2021) overlapped with nitrogen peaks. Interestingly, an atomic oxygen emission peak at 777.03 nm (3p-3 s) (Horikoshi and Serpone, 2017; Rezaei et al., 2014; Li, 2015; Alves Junior, 2009) was detected in all cases, indicating the presence of oxygen in the reactor. The main argon species Ar 2p-1 s lines were observed from 690 to 980 nm (Alves Junior, 2009; Kiss'ovski, 2009) from all the reactors. Besides that, the N2 (C3Πu − B3Πg) process can be seen from wavelengths 302 to 435 nm for every case indicating the presence of nitrogen in the reactors (Hossain, 2021). The emission peaks at 656.3 and 486.1 nm indicate the formation of Hα and Hβ, respectively, which can be seen in the inset figure more clearly. The formation of Hα and Hβ was observed only in like-free ground DBD and corona plasma configurations, while with coaxial DBD, only Hα was found. There was no trace of Hα and Hβ in the case of plasma in air. This can happen when water vaporises in the presence of plasma, and then the vaporised water also forms the plasma, which indicates that the coaxial DBD did not generate enough water vapor or enough power to form Hβ emission spectrum. And due to the lack of water present in the plasma discharge in air, no Hα and Hβ emission spectrums were observed in such conditions.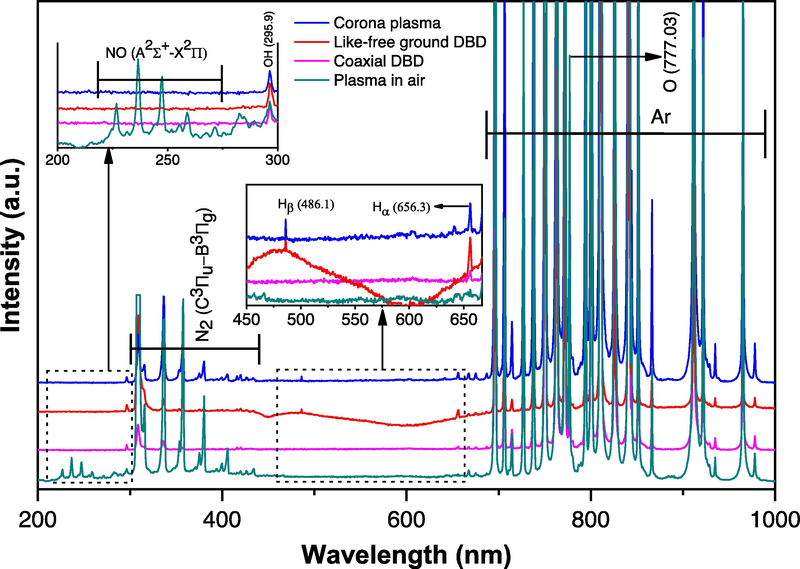
Optical emission spectrums of the reactors were taken during the synthesis of AgNP. All the spectrums were taken at 12 kV applied voltage.
3.9 The formation mechanism of AgNP
Argon was used as a feeding gas during the plasma technology process to synthesise silver nanoparticles. It was anticipated that the AgNP production method for each reactor might differ, however, once the OES data were obtained and analyzed, similar plasma species were found; as a result, the AgNP formation mechanism for each reactor remained the same.
NP formation after nucleation is a dim and slow process which follows a complex mechanism using the NTP (Kondeti, 2017; Dou et al., 2019; Darwish, 2022). The plasma species, including long-lived species, UV, short-lived radicals H, OH, energetic electrons (
), and the electric field of the argon plasma affects forming the NP and controlling the shape and size of the produced NP. Highly energetic electrons (
) in the discharge zone interact with water molecules to generate primary and secondary reactive species (Er, 2019).
Due to their strong reactivity, primary species frequently combine to create secondary, stable, long-lived species like H2, O2, and H2O2 or reform water (Er, 2019; Ruma, 2013; Lukeš, 2001).
As seen in the reactions, various reactive species can be generated in the plasma discharge zone. Among those reactive species,
and
can be identified as the most contributing species to form silver nanoparticles. And silver ions are known to scavenge these two species which results in the reduction of metal ion into zero valance silver atoms (
) (Soroushian, 2005). The reduction reaction of silver ions and the reduction rate are shown below (Kondeti, 2017; Chen et al., 2015).
Vos et al. (De Vos, 2017) also confirmed the role of short-lived species in the reduction of . Apart from this, when nucleation starts occurring, some atoms are exposed to the electric field and activated. These activated atoms provoke an activated reason, which develops a domino effect resulting in crystal growth until deterioration occurs (Shevchenko, 2006; Chen et al., 2002; Bigioni, 2006).
As OH is an oxidizer, it cannot reduce the
but OH can react with fructose. The capping agent in this investigation was sucrose. Plasma and heat both have the ability to break down sucrose to create glucose and fructose when present. Fructose, on its own, did not reduce
, but it can interact with OH radicals created at the plasma-liquid interface, acting as a scavenger for these OH radicals and generating an aldehyde that can improve
reduction. Aldehydes are strong reducing agents as they are easily oxidized to acids. The presence of hydrogen atom attached to the carbonyl group assists easy oxidation of aldehydes (
) by following the reaction, which reduces
(Kondeti, 2017)
In this investigation, it was found that AgNP is formed by OH radicals, hydrogen atoms, and energetic electrons. The formation of AgNP, however, may also be assisted by other partial reactions.
4 Conclusion
This study examined different reactor designs of the nonthermal plasma for generation of AgNP. It was found that the creation of NP was dependent on a number of factors, including the applied voltage, gas flow rate, treatment time, precursor and capping agent concentrations, and the distance of the nozzle from the solution surface. Therefore, optimal conditions such as applied voltage, gas flow rate, treatment time, nozzle distance, silver nitrate concentration and sucrose concentration were determined at 12 kV, 1.5 L/min, 180 s, 1.0 cm, 0.5 mM, and 20 mM, respectively. To confirm the synthesis of AgNP and the stability of the synthesized NP, UV–Vis spectroscopy and EDS were utilized. Maximum UV absorbance at 410 nm and stability of AgNP was achieved with the like-free ground DBD reactor. The synthesized AgNP was characterised using TEM, which revealed the particle size, shape, and PSD. NP synthesized by coaxial DBD and corona plasma reactors were spherical in shape and the average particle size was 6.2 and 9.6 nm, respectively, with wide PSD. In similar operational conditions, NP synthesized by like-free ground DBD reactor was shown narrow PSD which means particles were more uniform with 20 nm average particle size. Apart from this, a few hexagon and triangular shapes were also observed, and the rest of the particles remained spherical. Under similar conditions, it seems that like-free ground DBD reactor has advantages over coaxial DBD and corona plasma reactors as it produces uniform particles with higher concentration. Similar plasma species were detected in all of the studies utilizing similar conditions, but with varying emission intensities, according to the OES data that were recorded for each experiment. The NP formation method remains unchanged since the plasma species that the OES measured for all reactor designs are consistent.
As the plasma synthesis of AgNP remains easy, cost effective, and environmentally friendly, in the future this system can be scaled up and produced AgNP for commercial purpose. Despite the advantages of AgNP synthesis using palsma technology, the drawback of this work is that the solution used for treatment in this study was only 40 ml per run. If the solution increases, the plasma becomes weak and takes a long time to get similar results which are not economically viable.
Acknowledgements
This work is financially supported by the USDA National Institute of Food and Agriculture (NIFA) Foundational and Applied Science Program (Grant #: 2022-67017-36315) and USDA NIFA Hatch project IDA01723, United States.
Declaration of Competing Interest
The authors declare that they have no known competing financial interests or personal relationships that could have appeared to influence the work reported in this paper.
References
- Synthesis and applications of silver nanoparticles. Arab. J. Chem.. 2010;3(3):135-140.
- [Google Scholar]
- Evaluation of Factors Affecting Size and Size Distribution of Chitosan-Electrosprayed Nanoparticles. Avicenna J. Med. Biotechnol.. 2017;9(3):126-132.
- [Google Scholar]
- Size-controlled silver nanoparticles synthesized over the range 5–100 nm using the same protocol and their antibacterial efficacy. RSC Adv.. 2014;4(8):3974-3983.
- [Google Scholar]
- OES during reforming of methane by microwave plasma at atmospheric pressure. J. Anal. At. Spectrom. 2009;24(10):1459-1461.
- [Google Scholar]
- Nanomaterials: a review of synthesis methods, properties, recent progress, and challenges. Mater. Adv.. 2021;2(6):1821-1871.
- [Google Scholar]
- How surfactants control crystal growth of nanomaterials. Cryst. Growth Des.. 2016;16(2):1104-1133.
- [Google Scholar]
- Kinetically driven self assembly of highly ordered nanoparticle monolayers. Nat. Mater.. 2006;5(4):265-270.
- [Google Scholar]
- Nanomaterial by sol-gel method: synthesis and application. Adv. Mater. Sci. Eng.. 2021;2021:5102014.
- [Google Scholar]
- Size-controlled gold nanoparticles synthesized in solution plasma. J. Phys. Chem. C. 2011;115(50):24569-24576.
- [Google Scholar]
- Plasma–liquid interactions: a review and roadmap. Plasma Sources Sci. Technol.. 2016;25(5)
- [Google Scholar]
- Silver nanoparticles: technological advances, societal impacts, and metrological challenges. Front. Chem.. 2017;5
- [Google Scholar]
- Synthesis of highly uniform and composition-controlled gold–palladium supported nanoparticles in continuous flow. Nanoscale. 2019;11(17):8247-8259.
- [Google Scholar]
- l-Arginine-Stabilized Highly Uniform Ag Nanoparticles Prepared in a Microwave-Induced Plasma-in-Liquid Process (MWPLP) Bull. Chem. Soc. Jpn.. 2017;91(3):362-367.
- [Google Scholar]
- Chemistry in nanosecond plasmas in water. Plasma Processes Polym.. 2020;17(6):1900192.
- [Google Scholar]
- Silver nanodisks: synthesis, characterization, and self-assembly. J. Phys. Chem. B. 2002;106(42):10777-10781.
- [Google Scholar]
- A review of plasma–liquid interactions for nanomaterial synthesis. J. Phys. D Appl. Phys.. 2015;48(42)
- [Google Scholar]
- Rapid synthesis of metal nanoparticles using low-temperature, low-pressure argon plasma chemistry and self-assembly. Green Chem.. 2022;24(20):8142-8154.
- [Google Scholar]
- Current research on silver nanoparticles: synthesis, characterization, and applications. J. Nanomater.. 2021;2021:6687290.
- [Google Scholar]
- A comparative study of the reduction of silver and gold salts in water by a cathodic microplasma electrode. J. Phys. D Appl. Phys.. 2017;50(10)
- [Google Scholar]
- Silver release from silver nanoparticles in natural waters. Environ. Sci. Tech.. 2013;47(9):4140-4146.
- [Google Scholar]
- Rational design of transition metal-based materials for highly efficient electrocatalysis. Small Methods. 2019;3(1):1800211.
- [Google Scholar]
- Synthesis of silver nanoparticles used chemical reduction method by glucose as reducing agent. J. Phys. Conf. Ser.. 2019;1317(1)
- [Google Scholar]
- Er, M., 2019. Synthesis of silver nanoparticles using a plasma-liquid process Synthèse de nanoparticules d'argent a l'aide d'un procédé plasma-liquide, Université Sorbonne Paris Cité.
- Synthesis mechanisms, optical and structural properties of η-Al2O3 based nanoparticles prepared by DC arc discharge in environmentally friendly liquids. Ceram. Int.. 2017;43(10):7717-7723.
- [Google Scholar]
- Synthesis and characterization of silver nanoparticles and their application as an antibacterial agent. Int. J. Biosen. Bioelectron.. 2019;5:166-173.
- [Google Scholar]
- Plasma based synthesis of nanomaterials for development of plasmon enhanced infrared responsive optoelectronic device. Plasma Chem. Plasma Process.. 2019;39(1):277-292.
- [Google Scholar]
- Synthesis of silver nanoparticles by atmospheric pressure plasma jet. Nanotechnology. 2022;33(32)
- [Google Scholar]
- Green synthesis of silver nanoparticles using Teucrium polium leaf extract and assessment of their antitumor effects against MNK45 human gastric cancer cell line. J. Mol. Struct.. 2020;1208
- [Google Scholar]
- Dielectric barrier discharge plasma for nanomaterials: Fabrication, modification and analytical applications. TrAC Trends Anal. Chem.. 2022;156
- [Google Scholar]
- In-liquid plasma: a novel tool in the fabrication of nanomaterials and in the treatment of wastewaters. RSC Adv.. 2017;7(75):47196-47218.
- [Google Scholar]
- Non-thermal plasma in honeycomb catalyst for the high-throughput removal of dilute styrene from air. J. Environ. Chem. Eng.. 2021;9(4)
- [Google Scholar]
- Nonthermal plasma in practical-scale honeycomb catalysts for the removal of toluene. J. Hazard. Mater.. 2021;404
- [Google Scholar]
- Plasma-catalytic oxidation of volatile organic compounds with honeycomb catalyst for industrial application. Chem. Eng. Res. Des.. 2022;177:406-417.
- [Google Scholar]
- Recent developments in food packaging based on nanomaterials. Nanomaterials. 2018;8
- [CrossRef] [Google Scholar]
- Synthesis of iron nanoparticles via chemical reduction with palladium ion seeds. Langmuir. 2007;23(3):1419-1426.
- [Google Scholar]
- Effect of experimental conditions on size control of Au nanoparticles synthesized by atmospheric microplasma electrochemistry. Nanoscale Res. Lett.. 2014;9(1):572.
- [Google Scholar]
- Synthesis of various size gold nanoparticles by chemical reduction method with different solvent polarity. Nanoscale Res. Lett.. 2020;15(1):140.
- [Google Scholar]
- Detail review on chemical, physical and green synthesis, classification, characterizations and applications of nanoparticles. Green Chem. Lett. Rev.. 2020;13(3):223-245.
- [Google Scholar]
- Synthesis of silver nanoparticles: chemical, physical and biological methods. Res Pharm Sci. 2014;9(6):385-406.
- [Google Scholar]
- Metal nanoparticles synthesis: an overview on methods of preparation, advantages and disadvantages, and applications. J. Drug Delivery Sci. Technol.. 2019;53
- [Google Scholar]
- Synthesis and characterization of silver nanoparticles using a solution plasma process. J. Nanosci. Nanotechnol.. 2014;14(10):8094-8097.
- [Google Scholar]
- Nanoparticles: properties, applications and toxicities. Arab. J. Chem.. 2019;12(7):908-931.
- [Google Scholar]
- In-Liquid plasma process for size- and shape-controlled synthesis of silver nanoparticles by controlling gas bubbles in water. Materials. 2018;11
- [CrossRef] [Google Scholar]
- Plasma-assisted electrochemical synthesis of monodisperse Au and Au@Ag core–shell nanoparticles. Nanotechnology. 2020;31(16)
- [Google Scholar]
- Recent applications of the liquid phase plasma process. Korean J. Chem. Eng.. 2021;38(5):885-898.
- [Google Scholar]
- Small surface wave discharge at atmospheric pressure. J. Phys. D Appl. Phys.. 2009;42(18)
- [Google Scholar]
- Ag+ reduction and silver nanoparticle synthesis at the plasma–liquid interface by an RF driven atmospheric pressure plasma jet: Mechanisms and the effect of surfactant. J. Vac. Sci. Technol. A. 2017;35(6)
- [Google Scholar]
- Electric explosion of wires as a method for preparation of nanopowders. J. Nanopart. Res.. 2003;5(5):539-550.
- [Google Scholar]
- Preparation of nonaggregated silver nanoparticles by the liquid phase plasma reduction method. J. Mater. Res.. 2013;28(8):1105-1110.
- [Google Scholar]
- Silver Nanoparticles: Synthesis and Application for Nanomedicine. Int. J. Mol. Sci.. 2019;20
- [CrossRef] [Google Scholar]
- Emission and absorption spectroscopy study of Ar excited states in 13.56MHz argon plasma operating at sub-atmospheric to atmospheric pressure. Spectrochim. Acta B At. Spectrosc.. 2015;107:75-85.
- [Google Scholar]
- Synthesis of ZnTiO3/tourmaline/Ni foam catalyst and enhanced photocatalytic performance. Arab. J. Chem.. 2023;16(1)
- [Google Scholar]
- Direct spinning of carbon nanotube fibers from chemical vapor deposition synthesis. Science. 2004;304(5668):276-278.
- [Google Scholar]
- Electric energy density of dielectric nanocomposites. Appl. Phys. Lett.. 2007;90(13)
- [Google Scholar]
- One-step synthesis of gold and silver non-spherical nanoparticles mediated by Eosin Methylene Blue agar. Sci. Rep.. 2019;9(1):19327.
- [Google Scholar]
- Lukeš, P., 2001, Water treatment by pulsed streamer corona discharge. Institute of Plasma Physics AS CR, Prague, Czech Republic.
- Facile synthesis of novel size-controlled antibacterial hybrid spheres using silver nanoparticles loaded with poly-dopamine spheres. RSC Adv.. 2015;5(18):13470-13477.
- [Google Scholar]
- A review of carbon nanomaterials’ synthesis via the Chemical Vapor Deposition (CVD) Method. Mater.. 2018;11
- [CrossRef] [Google Scholar]
- Silver nanoparticles have lethal and sublethal adverse effects on development and longevity by inducing ROS-mediated stress responses. Sci. Rep.. 2018;8(1):2445.
- [Google Scholar]
- The effect of ph on the size of silver nanoparticles obtained in the reduction reaction with citric and malic acids. Materials 2020:13.
- [CrossRef] [Google Scholar]
- Nanotechnology Market (By Product: Nanotubes, Nanocomposites, Nano Clays, Nano Materials, Nano Particles, Nano Devices, Nano Tools, Others; By Application: Automotive, Medical, Electronics, Aerospace, Energy & Power, Paints and Coatings, Others) - Global Industry Analysis, Size, Share, Growth, Trends, Regional Outlook, and Forecast 2022 – 2030. 2022, Precedence Research: Canada. p. https://www.precedenceresearch.com/nanotechnology-market.
- Iodide ions control seed-mediated growth of anisotropic gold nanoparticles. Nano Lett.. 2008;8(8):2526-2529.
- [Google Scholar]
- Estimation of in vivo toxicity of MgO/ZnO core/shell nanoparticles synthesized by eco-friendly non-thermal plasma technology. Appl. Nanosci.. 2022;12(12):3783-3795.
- [Google Scholar]
- Green synthesis and environmental application of iron-based nanomaterials and nanocomposite: a review. Chemosphere. 2020;259
- [Google Scholar]
- Laser–plasma driven green synthesis of size controlled silver nanoparticles in ambient liquid. Nano-Struct. Nano-Objects. 2018;16:337-346.
- [Google Scholar]
- Green-synthesized nanocatalysts and nanomaterials for water treatment: current challenges and future perspectives. J. Hazard. Mater.. 2021;401
- [Google Scholar]
- Effective generation of atmospheric pressure plasma in a sandwich-type honeycomb monolith reactor by humidity control. Chem. Eng. J.. 2020;401
- [Google Scholar]
- Eco-Friendly synthesis of silver nanoparticles using pulsed plasma in liquid: effect of surfactants. Surfaces. 2022;5(1):202-208.
- [Google Scholar]
- Biological agents for synthesis of nanoparticles and their applications. J. King Saud Univ. – Sci.. 2022;34(3)
- [Google Scholar]
- Synthesis of surfactant-free electrostatically stabilized gold nanoparticles by plasma-induced liquid chemistry. Nanotechnology. 2013;24(24)
- [Google Scholar]
- Unique Properties, in: Essentials in Nanoscience and Nanotechnology. 2016. p. 326-360.
- Optimization of silver nanoparticle synthesis by chemical reduction and evaluation of its antimicrobial and toxic activity. Biomater. Res.. 2019;23(1):27.
- [Google Scholar]
- Investigation of antibacterial and wettability behaviours of plasma-modified PMMA films for application in ophthalmology. J. Phys. D Appl. Phys.. 2014;47(8)
- [Google Scholar]
- The effect of nanoparticle morphology on the specific heat of nanosalts. Int. J. Heat Mass Transf.. 2016;94:254-261.
- [Google Scholar]
- Electron-Transfer Reactions at the Plasma-Liquid Interface. J. Am. Chem. Soc.. 2011;133(44):17582-17585.
- [Google Scholar]
- Effects of pulse frequency of input power on the physical and chemical properties of pulsed streamer discharge plasmas in water. J. Phys. D Appl. Phys.. 2013;46(12)
- [Google Scholar]
- Synthesis of nanoparticles of silver and platinum by microwave-induced plasma in liquid. Surf. Coat. Technol.. 2011;206(5):955-958.
- [Google Scholar]
- Nonspherical noble metal nanoparticles: colloid-chemical synthesis and morphology control. Adv. Mater.. 2010;22(16):1781-1804.
- [Google Scholar]
- Silver nanoparticles: Green synthesis and their antimicrobial activities. Adv. Colloid Interface Sci.. 2009;145(1):83-96.
- [Google Scholar]
- Structural diversity in binary nanoparticle superlattices. Nature. 2006;439(7072):55-59.
- [Google Scholar]
- Surfactant effects on the shapes of cobalt nanoparticles. Mater. Lett.. 2006;60(16):1950-1955.
- [Google Scholar]
- The development of a green approach for the biosynthesis of silver and gold nanoparticles by using Panax ginseng root extract, and their biological applications. Artif. Cells Nanomed. Biotechnol.. 2016;44(4):1150-1157.
- [Google Scholar]
- Radiolysis of silver ion solutions in ethylene glycol: solvated electron and radical scavenging yields. Radiat. Phys. Chem.. 2005;72(2):111-118.
- [Google Scholar]
- Underlying mechanisms in size control of uniform nanoparticles. J. Colloid Interface Sci.. 2007;309(1):106-118.
- [Google Scholar]
- Ternary heterojunction in rGO-coated Ag/Cu2O catalysts for boosting selective photocatalytic CO2 reduction into CH4. Appl. Catal. B. 2022;311
- [Google Scholar]
- In situ investigation of the formation kinematics of plasma-generated silver nanoparticles. Nanomaterials. 2020;10
- [CrossRef] [Google Scholar]
- Stability of Citrate, PVP, and PEG Coated Silver Nanoparticles in Ecotoxicology Media. Environ. Sci. Tech.. 2012;46(13):7011-7017.
- [Google Scholar]
- Supercritical fluid flow synthesis to support sustainable production of engineered nanomaterials: case study of titanium dioxide. ACS Sustain. Chem. Eng.. 2018;6(4):5142-5151.
- [Google Scholar]
- Preparation of silver nanoparticles by chemical reduction method. Colloids Surf. A Physicochem. Eng Asp. 2005;256(2):111-115.
- [Google Scholar]
- Ag decoration-enabled sensitization enhancement of black phosphorus nanosheets for trace NO2 detection at room temperature. J. Hazard. Mater.. 2022;435
- [Google Scholar]
- Synthesis and optical properties of silver nanoparticles stabilized by gemini surfactant. Colloids Surf A Physicochem Eng Asp. 2006;273(1):179-183.
- [Google Scholar]
- Synthesis of silver nanoparticles by atmospheric-pressure pulsed discharge plasma in a slug flow system. Jpn. J. Appl. Phys.. 2019;58(1)
- [Google Scholar]
- Silver nanoparticles: synthesis, characterization, properties, applications, and therapeutic approaches. Int. J. Mol. Sci.. 2016;17
- [CrossRef] [Google Scholar]
- Synthesis of silver nanoparticles—Effects of concerned parameters in water/oil microemulsion. Mater. Sci. Eng. B. 2007;142(1):1-15.
- [Google Scholar]
- Preparation and Photoelectrocatalytic Performance Study of Au-RGO/TiO2 NTs Photoelectrode. Macromol. Res.. 2022;30(11):783-790.
- [Google Scholar]
Appendix A
Supplementary material
Supplementary data to this article can be found online at https://doi.org/10.1016/j.arabjc.2023.105174.
Appendix A
Supplementary material
The following are the Supplementary data to this article:Supplementary data 1
Supplementary data 1


