

Translate this page into:
Effect of fruit maturity on the composition of high-value components and biological activities of olives from newly developed cultivars
⁎Corresponding authors. fqanwar@yahoo.com (Farooq Anwar), rqsumra@gmail.com (Rahman Qadir)
-
Received: ,
Accepted: ,
This article was originally published by Elsevier and was migrated to Scientific Scholar after the change of Publisher.
Peer review under responsibility of King Saud University.
Abstract
The present study evaluates the variations in the composition of targeted high-value components (phenolics, fatty acids, organic acids and natural sugars) and biological activities of olive fruits, collected at different maturity stages, from two locally developed cultivars BARI Zaitoon-1 (BZ1) and BARI Zaitoon-2 (BZ2). Ultrasound-assisted extraction (UAE) was employed to extract phenolic compounds. The oil yield was significantly increased during the maturation, while a decrease in bioactives extract yield was noted. The maximum oil yield (33.8 %) was recovered from BZ1 olives at the fully ripen stage, while the maximum extract yield (34.5 %) was given by BZ2 at the unripen stage. According to HPLC analysis, total phenolic acids, including sinapic, caffeic, gallic, chlorogenic and benzoic acids in BZ1 and BZ2 olives, were higher at semi-ripen and unripen stages, respectively. Myricetin was detected as the major flavonoid in both cultivars, but its concentration gradually decreased during fruit maturation. A good correlation of total phenolic contents (TPC) with 1,1-diphenyl-2-picrylhydrazyl (DPPH) radical scavenging and total flavonoid contents (TFC) with ferric reducing antioxidant potential (FRAP) was observed. Similarly, an increase in the contents of total sugars and organic acids was noticed corresponding to fruit maturity. Furthermore, the tested olives fruit extracts inhibited the growth of Gram-positive bacterial strains (B. subtilis and S. aureus) more effectively than Gram-negative strains (K. oxytoca, S. typhi, and E. coli). The GC–MS analysis of extracted olive oil revealed that oleic acid was the major fatty acid found at three maturity stages for both cultivars. The current research revealed considerable variations in the selected components profile and biological activities of the tested olive cultivars as a function of fruit maturity. Based on these findings, the uses of olives can be recommended for specific applications to maximize the functional food and nutraceutical benefits of this valuable fruit.
Keywords
Ultrasound-assisted extraction
Phenolic antioxidants
HPLC
Oleic acid
Organic acids
Natural sugars
Thrombolysis
Hemolysis

1 Introduction
Lipid oxidation is considered a serious and major concern in the food industry as it exerts detrimental effects and causes the development of off-flavors and rancidity in end-use products. As a result of oxidative deterioration, foods lose their organoleptic flavor and nutritional value. Nevertheless, reactive oxygen species (ROS) and free radicals generated may allow the onset of inflammation, aging, some kinds of cancer, and metabolic and cardiovascular disorders in living organisms (Anwar et al., 2019; Qadir et al., 2019). Plants have always served as a vital source of a large portfolio of therapeutic agents with antiodixant activities and food preservative effects (Qadir et al., 2022). The presence of naturally occurring antioxidants like phenolics, flavonoids and tocols, among others, in various plants can play a key role in the treatment of various illnesses and disorders associated with oxidative stress as well as such compounds can be used to improve the shelf-life of foods (Mukhtar et al., 2019; Gardezi et al., 2022).
Besides the phenolic bioactives, organic acids are also important biomolecules used in the food, cosmetic, and chemical industries. Citric and lactic acids are the most important for the food and pharmaceutical sectors. Among natural compounds, organic acids can also serve as antimicrobial activity for food safety (Coban, 2020). Lactic acid is used as an acidulant and preservative (Chahal and Starr, 2000). Previous study shows that organic acids occupy a central position in the metabolism of plants (Burris, 1953). Moreover, assessment of organic acids and natural sugars is one of the most demanding aspects with regard to exploring the functional food potential of various fruits. In plant cells, sugar is required for lipids biosynthesis. Although the sugar from mature leaves is considered the major source, some studies reveal that photosynthesis in fruits also plays an important role in fruit growth and lipids biosynthesis (Donaire et al., 1984; Vanhercke et al., 2019). Sugars not only provide energy, but also function as signaling molecules to control plant growth and development. They regulate cascades of morphophysiological processes directly or indirectly under various abiotic stresses (Chen et al., 2021).
Among various medicinal food plants, olive (Olea europaea L.) is well-known for its high nutritional value and functional properties (Ghanbari et al., 2012). These trees, originally belonging to the Eastern Mediterranean basin, are now distributed in many parts of the world. As an emerging crop, the olive has a high potential for cultivation in Pakistan due to the unique and favorable agro-climatic conditions in several parts of the country. Since the last 5–10 years, a rapid increase in olive farming has been observed in Pakistan, and cultivation of this high-value crop has spread over an extensive area, especially in the Potohar region, being declared as the Olive Valley of Pakistan (Sumrah et al., 2021). Barani Agricultural Research Institute (BARI), Chakwal, has recently developed two olive varieties, BARI Zaitoon-1 and BARI Zaitoon-2, from wild olive (Olea ferruginea Royle) via germplasm of Coratina and Frantoio (imported from Italy), respectively (Sumrah et al., 2021). These cultivars have shown good environmental adaptability, and high fruit yield with higher oil content. These olive fruits are also being utilized locally to prepare different innovative olive products (olive pickles, olive jam, olive syrup, olive murabba, and olive sweets).
So far olive research conducted in Pakistan, is at a very basic level, mainly covering the botanical and agronomic aspects of this crop and as such no data is available on the detailed composition of nutraceutical components such as antioxidant phenolics, organic acids, fatty acids and natural sugars of developing olive cultivars. Meanwhile, some studies are reported on the biochemical composition of wild olives. For instance, (Ahmad et al., 2022) investigated the biological attributes (antimicrobial, antioxidants, hemolytic and thrombolytic) of wild olive fruits naturally grown in Soon Valley, Pakistan. In another study, (Shan et al., 2019) also evaluated the antioxidant potential and polyphenolic contents of wild olives (Olea ferruginea Royle) grown in the Himalayan region of Pakistan. Similarly, (Anwar et al., 2013) also characterized the olive oils extracted from wild olives of Pakistani origin.
With the new developments in optimal nutrition, there is a prompt need to investigate and explore the bioactives profile and biological principles of new cultivars of local Olives in Pakistan to establish the scientific basis for the functional food and medicinal applications of olives and olive products. Hence, it is worthwhile to appraise the composition of high-value bioactive phenolics in olive fruits from the newly developed cultivars in relation to their maturity stages to provide the data for consumers and the food industry for specific applications. Until now, the newly developed cultivars (BZ-1 and BZ-2) of olives have not yet been characterized for their high-value components such as antioxidant phenolics, organic acids, and natural sugars, along with their biological attributes.
The main target of the present research was to characterize the phenolic bioactives, organic acids, natural sugars and fatty acids in the fruits of two newly developed olive cultivars, BZ1 and BZ2 as a function of maturity, along with appraisal of their antioxidant, hemolytic, and thrombolytic activities. To the best of our knowledge, this is the first report on the characterization of high-value components and multiple biological activities of olives from these newly developed cultivars grown in the Potohar region of Pakistan.
2 Material and methods
2.1 Sample collection and preparation
Olive fruits from two newly developed cultivars BARI Zaitoon-1 (BZ1) and BARI Zaitoon-2 (BZ2) were collected at three different maturity stages (as shown in Fig. 1) such as unripen (green on 1st of August), semi-ripen (yellow on 15th of September), and fully-ripen (black on 1st of November) during the year 2020, from the Olive Garden of Barani Agricultural Research Institute (BARI) Chakwal, Pakistan. Olives were picked up manually under the instruction and supervision of Dr. Muhammad Ramzan Ansar (a senior scientist at BARI). Fruits of each cultivar (about 250 g/tree) from three different plants were picked up at each maturity level and then pooled. The fruits were washed with distilled water, destoned, shade dried, and then crushed to a coarse powder.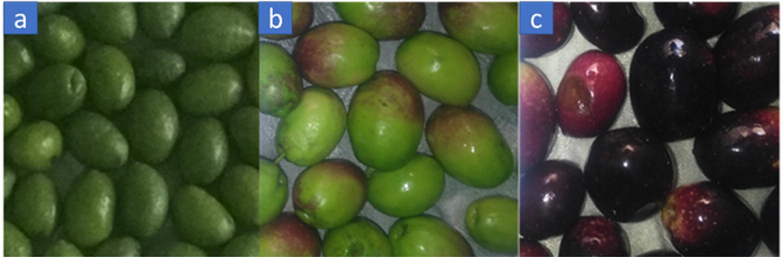
Olive fruits of BZ1: a; unripen, b: semi-ripen, c: fully-ripen.
2.2 Determination of oil yield
Briefly, the olive fruit (OF) powder (10 g) was defatted by extracting with n-hexane (100 mL), using an orbital shaker at 350 rpm for 2.5 h. After filtration (using Whatman, 8µ), the residue was placed in an oven at 35 °C for 6 h to evaporate any traces of n-hexane. While n-hexane in the filtrate was evaporated using a rotary vacuum evaporator (EYELA, N-N Series, Rikakikai Co. Ltd. Tokyo, Japan) to find out the oil yield.
2.3 Ultrasound-Assisted extraction of phenolic compounds
The olive fruit extracts (OFEs) were prepared by ultrasound-assisted extraction (UAE), as reported in our earlier study (Ullah et al., 2023). Briefly, a 10 g dried defatted sample was soaked in 100 mL solvent (80 % aqueous ethanol) and the sample was extracted by applying Ultrasonic Cleaner Bath (LPAU-A10 Labtron Equipment Ltd. UK) operated at 43 °C for 32 min followed by filtration using filter paper. The solvent from the filtrate was evaporated using a rotary evaporator to get concentrated extract and then the remaining solvent was evaporated using a water bath (Memmert, Germany) at 40 °C to get a semisolid form of extracts. The extracts were stored at −4 °C.
2.4 Total phenolics content (TPC) in OFEs
The amount of TPC in tested OFs was assessed by following a reported protocol (Ahmad et al., 2022). Briefly, 50 µL of OFEs solution (1 mg/mL), 50 µL of Folin-Ciocalteu reagent (FCR), and 500 µL of (7 % w/v) solution of sodium carbonate were mixed and diluted with 450 mL of deionized water and allowed to react in a water bath at 40 °C for 20 min. After that, the mixture was cooled to normal temperature and absorption was measured at 755 nm using a UV–visible spectrophotometer (U-2001, Hitachi Instruments Inc. Tokyo, Japan). The TPC of tested OFEs was calculated using a gallic acid standard curve (concentration range of 25–500 µg/mL) and computed as gallic acid equivalent (GAE) mg/g dried matter.
2.5 Total flavonoids content (TFC) in OFEs
The TFC in OFEs was measured as reported earlier (Ahmad et al., 2022). Briefly, 250 µL OFEs (conc. 1 mg/mL) was mixed with 75 µL sodium nitrite solution (5 % w/v), further diluted with 1.25 mL of deionized water, and then incubated for 5 min at ambient temperature. After that, 150 µL of (10 % w/v) aluminum chloride and 500 µL of 1 M sodium hydroxide solutions were added, and the optical density was measured at 510 nm using a UV–visible spectrophotometer. TFC was calculated using a quercetin standard curve (in a concentration range of 10–100 µg/mL) and represented as quercetin equivalents (QE) mg/g dried matter.
2.6 DPPH radical scavenging assay
The DPPH radical scavenging potential of different OFEs was determined spectrophotometrically (Tepe et al., 2005). Briefly, 1.0 mL of OFE was thoroughly mixed with 1 mL of freshly prepared DPPH solution (1 mM). The mixture was incubated at room temperature in the dark for 1 h. The absorbance was measured at 517 nm using a UV–Vis spectrophotometer. Various concentrations (25–700 µg/mL) of the tested samples/ standard were employed. Ethanol was used as a negative control, while ascorbic acid (Sigma-Aldrich, USA) was used as a positive control. The radical scavenging potential of OFEs was estimated by Eq. (1).
2.7 Ferric reducing antioxidant power (FRAP) assay
The reducing power of OFEs was assessed according to the protocol mentioned by (Benzie and Strain, 1999). Briefly, 50 µL of methanol was added to 950 μL of FRAP reagent (prepared by mixing 0.02 M FeCl3·6H2O, 0.01 M TPTZ solution, and 0.03 M acetate buffer in a 1:1:10 ratio) and absorbance was measured at 593 nm with a spectrophotometer. Then, 50 µL of different concentrations of OFEs (25–400 μg/mL) was used instead of methanol. After incubation at 37 °C for 8 min in the dark, absorbance was taken again and the change in absorbance was equivalent to the FRAP value. Furthermore, a similar process was repeated for ascorbic acid and results were compared between the sample and standard.
2.8 Antibacterial activity of OFEs
The disc diffusion method was used to investigate the antibacterial properties of the tested OFEs samples against Staphylococcus aureus, Salmonella typhi, Escherichia coli, Klebsiella oxytoca, and Bacillus subtilis. In a flask, distilled water was combined with agar (24 g), trypton (12 g), sodium chloride (12 g), and yeast (6 g) to form a volume of 600 mL and pH was kept at 7.4 by adding 0.01 M NaOH. The resulting mixture, cotton buds, petri plates, micropipette tips and filter paper discs were sterilized in an autoclave (121 °C, 20 min). The bacterium in petri dishes was spread using cotton buds, and then, after 6 h, a 5 mm paper disc (Whatman filter paper No.1) was soaked with 50 µL of OFEs (25 mg/mL), dried, and put on agar plates. The plates were then incubated at 37 °C for 24 h (Aslam et al., 2011; Mehwish et al., 2012). The inhibition zone for the tested OFEs and control was measured in mm. MIC (Minimum Inhibitory Concentration) was assessed by employing serial dilutions (2.5, 0.25, 0.025, 0.0025 mg/mL) of the standard drug (Cefixime) and tested samples (Aslam et al., 2011; Mehwish et al., 2012). The inhibition zones were measured using a vernier calliper. The concentration (in µg/mL) which showed no bacterial growth was termed as minimum inhibitory concentration (MIC) (Loo et al., 2018). The experiment was done three times, and the results were recorded as mean ± standard deviation (SD).
2.9 Hemolytic activity
In-vitro hemolytic activity of OFEs was assessed using a reported procedure (Rizwan et al., 2012). Red blood cells (RBC) were obtained by centrifugation (at 3000 rpm for 5 min) of 7 mL of fresh blood from a normal volunteer and washed three times with sterile saline solution. 500 µL of tested samples/standard was mixed with 500 µL of RBC suspension (prepared by diluting the RBC pellet to 0.5 % in saline solution) and incubated at 37 ˚C for 30 min followed by centrifugation at 1500 rpm for 10 min. Free hemoglobin in the supernatant was assessed by measuring absorbance at 540 nm using a UV–visible spectrophotometer. Triton X-100 was used as a standard drug for RBC lysis. RBC lysis/hemolysis was estimated using Eq. (2).
2.10 Thrombolytic activity
The thrombolytic activity of OFEs was performed as previously reported (Anwar and Alkharfy, 2017). Briefly, fresh human blood was collected from healthy volunteers in a pre-weighed sterile microcentrifuge tube containing 50 µL of thromboplastin (blood coagulant) solution and incubated at 37 °C for 45 min. Serum was removed (after clot formation), and the tube having the blood clot was weighed to determine the weight of the blood clot. Added 100 µL of tested sample/standard (streptokinase) to each microcentrifuge tube and incubated again at 37 °C for 1.5 h. After that, the liquid portion was decanted, and the tubes were weighed again. Clot-lysis activities of tested samples/standard were represented as a percentage of thrombolysis and estimated according to Eq. (3).
2.11 HPLC analysis of phenolics
For HPLC analysis, OFEs were filtered through a 0.45 μm syringe filter (Ramirez et al., 2013). The phenolics (gallic acid, caffeic acid, sinapic acid, benzoic acid and chlorogenic acid) analysis was performed using RP-HPLC (HPLC model 1260 infinity II, Agilent, USA), having quaternary pump 1260 and linked with VWD (UV–Vis.) detector. A 20 µL volume of the sample was injected into a Zorbax Eclips Plus (Agilent, USA) reverse phase (C18) column (4.6×150 mm; 5 µm particle size). The mobile phase contained two solvents (1:1 v/v), namely, A: mixture formic acid/distilled water (1:99, v/v) and B: mixture formic acid/acetonitrile (1:99, v/v). The isocratic elution of the mobile phase (at a rate of 0.6 mL/min) was performed, and the chromatograms were recorded at 280 nm (Nouman et al., 2016).
2.12 HPLC analysis of flavonoids
Flavonoids (kaempferol, quercetin and myricetin) were analyzed using HPLC (model 1260 infinity II, Agilent, USA), linked with quaternary pump 1260 and VWD (UV–Vis.) detector. A 20 µL volume of the sample was injected into a Zorbax Eclips Plus Agilent, USA) reverse phase (C18) column (4.6 × 150 mm; 5 µm particle size). The mobile phase was a mixture of solvent A: 3 % trifluoroacetic acid and solvent B: methanol /acetonitrile (1:4, v/v). The chromatographic separation was performed by isocratic elution of the mobile phase (mixture of solvent A and B (1:1, v/v) that was filtered under vacuum through a 0.45 µm membrane (Mradu et al., 2012) before use at a flow rate of 600 µL/min at 30 °C. Detection was performed at a wavelength of 360 nm (Sultana and Anwar, 2008). Both the phenolic acids and flavonoid compounds were identified by comparing their retention times with those of reference standards (Sigma Chemicals Co., St Louis, MO, USA). Quantitative determination was carried out using calibration curves of the standards.
2.13 Methylation and analyses of fatty acids in olive oil
To ascertain the fatty acid (FA) composition of olive oils, fatty acid methyl esters (FAMEs) were prepared by following a standard IUPAC method 2.301 (IUPAC, 1987) (Paquot and Hautfenne, 1987). The percentage of total fatty acids in their relative composition was then determined using a GC system, coupled with an auto-injector (Agilent Technologies 7683B series) and mass selective detector (Agilent-Technologies 5975 inert XL). Agilent Technologies capillary column HP-5MS (30 m length × 0.25 mm inner diameter × 0.25 µm film thickness) was employed for separation. As mobile phas (carrier gas), helium, supplied at a 1.2 mL/min, was used. The injector, column and detector, were set at temperatures of 180, 230 and 250 °C, respectively. The FAMEs were identified by comparing their relative retention times to those of the FAMEs' standards (Sigma Chemical Co., St Louis, MO, USA). FAMEs were additionally identified and verified by comparing their MS spectra to those from the GC/MS system's NIST20.L mass spectral library.
2.14 Analysis of natural sugars in fresh olive fruits
The analysis of natural sugars in olive fruits at different maturity stages was carried out by a method reported earlier (Mahmood et al., 2012). According to this method, 5 g of fresh olive fruit was homogenized in 10 mL of deionized water. This mixture was centrifuged at 3500 rpm for 10 min and the supernatant was then filtered using a Millipore filter (0.25 mm). 20 uL of this filtrate was injected into the separating column. Natural sugars in freshly prepared fruit juice were detected using HPLC (Shimadzu, Japan) equipped with a refractive index detector (RID-10A) and a quaternary pump (LC-10AT). Separation of natural sugar was performed by passing the mobile phase (acetonitrile) through the Lichrospher column (R-100) with a flow rate of 0.6 mL/min. Natural sugars in the tested olive fruits were identified by comparison of their retention time with those of pure standards (glucose and fructose) and were quantified using external standard calibration curves.
2.15 Analysis of organic acids in fresh olive fruits
The presence of organic acids in the olive fruits at different maturity stages was evaluated by HPLC method as reported earlier (Mahmood et al., 2012). According to this method, 5 g of fresh olive fruit was homogenized in 10 mL of deionized water. This mixture was centrifuged at 3500 rpm for 10 min and the supernatant was then filtered using a Millipore filter (0.25 mm). Organic acids in freshly prepared fruit juice were detected via a UV–Vis detector linked with HPLC (Varian Pro star, USA). Separation of organic acids was performed by passing the mobile phase (0.001 N H2SO4) through a lichrospher column (RP-C18) with a flow rate of 1.0 mL/min. Targeted organic acids in tested olive fruits were quantified using standard curves.
2.16 Statistical analysis
All measurements were taken in triplicate, and the results were computed as means ± standard deviation (SD). The data was statistically analyzed using CHEMSTATION software.
3 Results
3.1 Oil and extraction yield
The percent oil yield of two olives cultivars harvested at three different maturity stages is shown in Table 1. It was observed that oil yield increased with an increase in the maturity level of the fruits. At the fully ripened stage, BZ2 showed a higher (33.81 ± 1.51 %) oil yield than BZ1 (29.85 ± 0.93 %). In line with our present results, some previous studies, from different countries, also depicted considerable variation in the oil yield of olives with regard to fruit maturity stages. A significant difference in the oil yield was observed between the cultivars and among the maturity levels. Avidan et al., (1997) investigated the oil yield of Domat and Memecik olive cultivars that ranged from 3 to18 %. Another study found that the oil yields of four olive cultivars increased with ripening, ranging from 12.51 to 37.98 % (Nergiz and Engez 2000). Similarly, it was observed (Table 1) that the extract yield for both cultivars decreased as maturity progressed. BZ2 (at unripen stage) yielded maximum extract (34.50 ± 0.63 %) while BZ1 yielded (at fully-ripe level) minimum extract (13.92 ± 0.91 %). At each of the three stages, BZ2 produced more extract than BZ1. In Chinese olives, the highest extract yield (56.38 %) was observed in aqueous-ethanol (1:1), and the lowest extract yield (13.76 %) was found in ethyl acetate (Kuo et al., 2015). U: unripen; S: semi-ripen; F: fully-ripen. Values are mean ± SD (n = 3). Different superscripts (in the same column) for each cultivar show a significant variation (p < 0.05) among different maturity stages, while different subscripts (in the same column) show a significant variation (p< 0.05) between the two cultivars at the same maturity stage.
Cultivars
Stages
Oil yield
(%)
Extract yield
(%)
TPC
(GAE mg/g of extract)
TFC
(QE mg/g of extract)
DPPH
(IC50 µg/mL)
BZ1
U
18.37 ± 0.21aa
30.16 ± 0.60aa
56.66 ± 1.32aa
41.96 ± 1.20aa
318.52 ± 6.30aa
S
21.30 ± 0.30bb
23.12 ± 1.35bb
69.78 ± 0.81bb
36.20 ± 0.95bb
198.45 ± 8.32bb
F
29.85 ± 0.93 cc
13.92 ± 0.91 cc
34.11 ± 1.50 cc
26.82 ± 1.37 cc
447.78 ± 5.11 cc
BZ2
U
17.13 ± 0.45aa
34.50 ± 0.63da
45.41 ± 1.32da
27.33 ± 0.72da
429.21 ± 9.23da
S
22.12 ± 0.72bb
23.61 ± 0.78bb
35.74 ± 0.85eb
20.98 ± 1.28eb
503.15 ± 7.58eb
F
33.81 ± 1.51ec
17.10 ± 0.92ec
27.10 ± 0.83fc
20.57 ± 0.64fb
582.22 ± 5.10fc
3.2 TPC and TFC of olive fruit extracts
The total phenolics content (TPC), total flavonoids content (TFC) and DPPH radical scavenging potential of OFEs are given in Table 1. The TPC values ranged from 27.10 to 69.78 GAE mg/g of extract. Different trends in TPC values were observed between the selected cultivars. For BZ1, the highest TPC (69.78 GAE mg/g) was observed in the semi-ripe stage, while for BZ2, the highest TPC (45.41 GAE mg/g) was observed at the unripe stage. Both cultivars exhibited low TPC at the fully-ripe stage. Furthermore, both cultivars revealed higher TFC (41.96 and 27.33 QE mg/g for BZ1and BZ2, respectively) in unripe olive fruits, while lower TFC (26.82 and 20.57 QE mg/g for BZ1 and BZ2, respectively) was observed at fully ripe olive. Overall, BZ1 showed higher TPC and TFC values compared to BZ1.
It has been reported that during the ripening periods of three cultivars (Cobrancosa, Picual, and Galega vulgar), the TPC value gradually decreased with the ripening. The highest value (50.11 GAE mg/g extract) was observed for Cobrancosa and the lowest value (28.89 GAE mg/g) for Picual cultivars (Gouvinhas et al., 2017). It was also found that the TPC of cv. Ottobratica decreased from 4.08 to 1.90 GAE mg/g during fruit growth (Sicari et al., 2009). Similarly in another investigation, the TPC of OFE from the Gemlik variety (grown in Kuml, Turkey) was high (4.32 GAE mg/g) at the semi-ripened level compared to the un-ripened and fully ripened level (Uylaşer, 2015). In another study, the TPC of Co-brançosa cultivars decreased from 61.3 to 15.7 GAE mg/g from September to December (Machado et al., 2013). The study on the variation of polyphenolics content and radical scavenging potential of olive cultivars from Greece revealed that the TFC decreased from 20.03 to 12.76 QE mg/g during the development of olive fruits (Gougoulias et al., 2017). Similarly, the Dahbia and Sigoise cultivars showed the highest TFC (3500 and 3540 RE mg/g, respectively) at the green stage while the lowest (2600 and 2140 at RE mg/g, respectively) at the black stage (Benlarbi et al., 2018).
3.3 DPPH radical scavenging and ferric reducing antioxidant power (FRAP) of olive fruit extracts
DPPH radical scavenging and FRAP value of OFEs are displayed in Fig. 2a and 2b, respectively. The OFEs samples of selected cultivars at different ripening periods displayed considerable differences (p > 0.05) with respect to their antioxidant potential. Among the tested cultivars at all maturity stages, BZ1 and BZ2 offered the highest DPPH radical scavenging potential such as IC50:198.45 µg/mL and IC50: 582.22 µg/mL) at semi-ripened stage and fully-ripen stage, respectively. Similarly, OFEs displayed concentration-dependent ferric-reducing antioxidant potential. For both cultivars, the higher antioxidant potential was observed in unripe olives, while the lower antioxidant potential was noticed in fully-ripen olives. Overall, BZ1 showed significantly high antioxidant potential as compared to BZ2. A significant difference (p > 0.05) was observed between both cultivars and for all the maturity stages. It was observed that there existed a good correlation between TPC with DPPH radical scavenging potential (R2 = 0.9554) and TFC with FRAP (R2 = 0.9217) of the tested OFEs.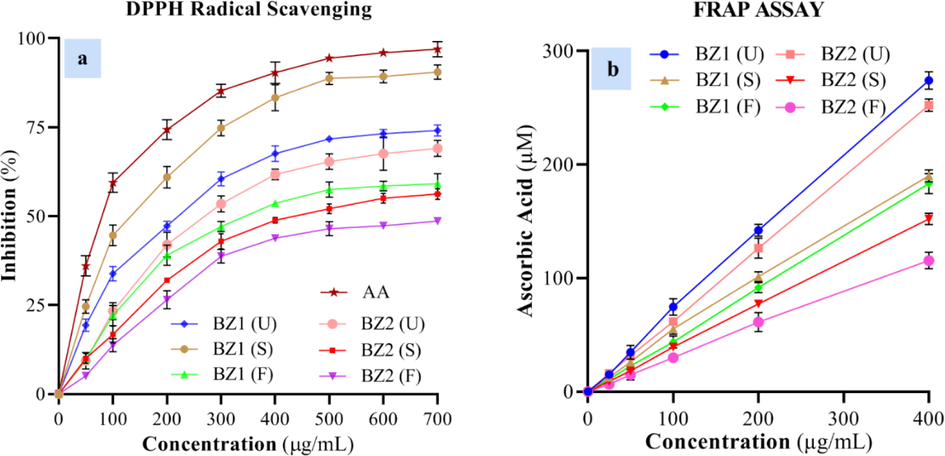
(a) DPPH radical scavenging activity and (b) FRAP of OFEs from BZ1 and BZ2 at unripen, semi-ripen (S.), and fully-ripen () stages and standard ascorbic acid (AA).
Benlarbi et al. (2018) demonstrated that green olive fruit extracts possess a higher ferric-reducing and Trolox equivalent antioxidant capacity than black olive fruit extracts. Similarly, in another study, the antioxidant potential of Koroneiki olive fruit extract, evaluated using the FRAP assay, was higher in un-ripen olives as compared to ripen olives, and it varied from 178.75 to 155.5 µmol AAE/g DW in 2008 and from 172.06 to 128.73 µmol AAE/g DW in 2009 (Kafkaletou et al., 2021). A similar trend was observed for ABTS free radicals scavenging capacities of oils extracted from Arbequina, Chemlali, and Koroneiki olive fruits at different maturation levels (Jellali et al., 2022). Fernandez-Orozco et al. (2011) estimated the TPC and DPPH of the phenolic bioactives of Arbequina olive fruit extract and observed that these parameters initially slightly increased and then significantly decreased with progress in the ripening of olives. Such variations in the results of antioxidant potential/activity can be attributed to the different agroclimatic, genetic (variety) and agro-ecological factors.
3.4 Phenolic bioactives analysis in OFEs
The individual phenolics and flavonoid composition (qualitative and quantitative) of OFEs, as analyzed by RP-HPLC, is shown in Table 2. The tested olives exhibited a good range of natural antioxidants such as phenolics and flavonoids. Among the phenolic components, sinapic acid was the most abundant ranging from 473.1 to 1560.5 µg/g dried-matter weight (DW) and it was found in both of the cultivars at un-ripe and semi-ripen olives but was absent in fully matured fruits. Whereas benzoic acid was least abundant and found only in the unripe olives of both cultivars and semi-ripe olives of BZ1. Caffeic acid was found at all maturity levels of BZ1 (during the maturation period, a gradual decrease was observed) and unripe stage of BZ2. Chlorogenic acid, the second most abundant phenolic bioactive, was found in unripe olives and fully ripe olives of BZ1. Similarly, gallic acid was detected at all maturity stages of BZ1 (a gradual increase was noticed during fruit development) and only at the fully-ripen stage of BZ2. The highest amount of sinapic acid (1560.01 µg/g) and caffeic acid (386.1 µg/g) was found at the semi-ripen stages of BZ1. The maximum amount of gallic acid (460.1 µg/g) and chlorogenic acid (818.21 µg/g) was detected in the fully-ripe stage of BZ2 and BZ1, respectively. The concentration of total phenolic compounds was higher at the unripe and lower at fully-ripe stage for both the cultivars. The maximum and minimum levels of total phenolic compounds were noted to be 2714.9 µg/g and 460.1 µg/g for BZ1 (at the un-ripen level) and BZ2 (at the fully-ripen level), respectively. U: unripen; S: semi-ripen; F: fully-ripen; ND: not detected. Values are mean ± SD (n = 3). Different superscripts (in the same column) for each cultivar show a significant variation (p < 0.05) among different maturity stages, while different subscripts (in the same column) show a significant variation (p < 0.05) between the two cultivars at same maturity stage (HPLC chromatograms for phenolics and flavonoids are give in Supplementary Figure S1 and S2).
Cultivars
Stages
Phenolic acids (µg/g DW)
Flavonoids (µg/g DW)
Gallic
Caffeic
Benzoic
Sinapic
Chlorogenic
Quercetin
Kaempferol
BZ1
U
144.33 ± 2.28aa
386.15 ± 4.04aa
131.23 ± 7.14aa
1560.50 ± 9.41aa
524.43 ± 6.52aa
2419.35 ± 9.13aa
ND
S
244.08 ± 4.13bb
186.03 ± 6.25bb
157.78 ± 3.15bb
1169.15 ± 9.82bb
ND
2378.55 ± 9.60ba
92.10 ± 3.19aa
F
318.21 ± 3.24 cc
106.24 ± 2.29 cc
ND
ND
818.26 ± 5.00bb
1765.24 ± 9.47cb
ND
BZ2
U
ND
53.90 ± 1.53da
142.01 ± 0.54ca
551.29 ± 6.34ca
293.25 ± 4.14ca
1833.36 ± 7.68da
ND
S
ND
ND
ND
473.15 ± 3.59db
ND
1481.50 ± 7.35eb
85.28 ± 4.54aa
F
460.08 ± 6.34aa
ND
ND
ND
ND
1343.24 ± 9.10fc
ND
Rt
7.9
9.3
10.0
11.6
12.0
2.848
4.462
The quantitative analysis of flavonoids (myricetin, quercetin, and kaempferol) depicted that the OFEs had higher amounts of myricetin at all maturity stages. The highest amount of myricetin (2419.3 µg/g) was observed in BZ1 at the unripen stage and the lowest (1343.2 µg/g) in BZ2 at the fully-ripen stage. Likewise, kaempferol was found in small amounts only at the semi-ripen stage of BZ1 (92.01 µg/g) and BZ2 (85.034 µg/g). Whereas quercetin was not detected in both of the cultivars. The total identified flavonoid compounds in BZ1 were almost the same in both semi-ripen and unripen olives but significantly higher as compared to fully-ripen stage of olives. The highest (6152.67 µg/g) and lowest (911.67 µg/g) flavonoid compounds were measured for BZ1 (at a semi-ripe level) and BZ1 (at a fully-ripe level), respectively.
In a previous study, Benlarbi et al., (2018) investigated that sinapic acid (in the Sigoise cultivar) was higher than chlorogenic acid. Furthermore, it was even higher at the green stage as compared to the black stage. It was also found that the total phenolic bioactives of different cultivars (Arbequina, Cornicabra, Picolimon, and Picual) were higher at the green stage when compared to the black stage (Gómez-Rico et al., 2008). Furthermore, (Xie et al., 2015) used aqueous-ethanol (1:3) for extraction purposes and determined 99.01 µg of gallic acid and 430.00 µg of chlorogenic acid per g of olive fruit extract. In another study (Talhaoui et al., 2015) on the OFEs of six cultivars (Picual, Changlot Real, Arbequina, Arbosana, Sikitita and Koroneiki) revealed that the total flavonoids compounds decreased during the ripening period from June to December, while, simple phenolic compounds were found higher in August (almost in the mid of fruit development). Our results are in good agreement with these findings.
3.5 Antibacterial activity
The results of antibacterial activity (as shown in Fig. 3) depicted that the OFEs are more effective against Gram-positive bacterial strains (B. subtilis and S. aureus) than Gram-negative bacterial strains (K. oxytoca, S. Typhi and E. coli). For S. aureus, the most sensitive pathogen, OFE derived from BZ2, at the semi-ripe stage displayed maximum antimicrobial activity with the lowest MIC values, 87.2 µg/mL (as given in Table 3), while OFE derived from BZ1 at fully-ripe stage exhibited minimum antimicrobial activity with maximum MIC values 136.3 µg/mL. whereas, B. subtilis was the second most sensitive micro-organism and its cell growth inhibition was higher for unripen stage fruits of both the cultivars and inhibition zones ranging from 8.3 to 14.2 mm. BZ1 at the unripen stage showed the highest antimicrobial potential with MIC value of 109.1 µg/mL, while, BZ2, at a fully-ripen level, revealed the lowest inhibition zone with a MIC value 187.4 µg/mL.(See Fig. 4.) U: unripen; S: semi-ripen; F: fully-ripen. Values are mean ± SD (n = 3).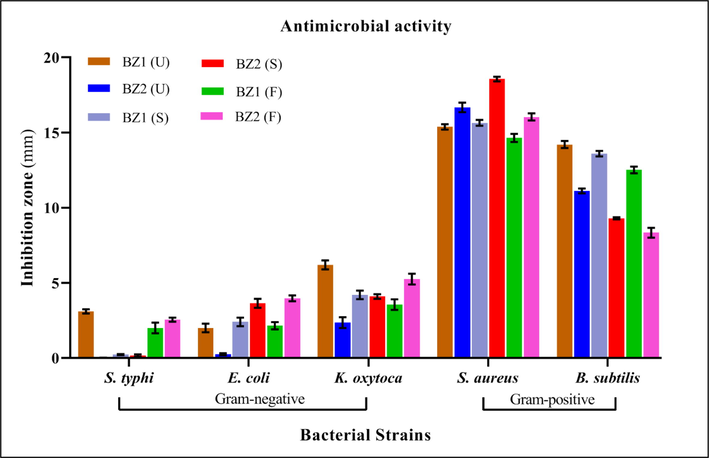
Inhibition zones of OFEs (2.5 mg/mL) from selected cultivars at different maturity stages against different bacterial strains (for more detail Table S1 is given in suplimentry data file).
Cultivars
Stages
MIC (µg/mL)
K. oxytoca
S. typhi
E. coli
S. aureus
B. subtilis
BZ1
U
225.7 ± 2.1
307.5 ± 4.7
456.2 ± 4.4
136.3 ± 2.2
109.1 ± 2.8
S
367.5 ± 2.6
------------
445.9 ± 3.2
120.7 ± 1.1
120.8 ± 1.9
F
394.9 ± 1.7
447.7 ± 4.0
467.5 ± 1.6
109.3 ± 0.7
145.6 ± 3.5
BZ2
U
403.5 ± 2.3
-------------
------------
98.2 ± 1.2
153.8 ± 2.2
S
356.7 ± 2.7
-------------
353.7 ± 2.9
87.2 ± 0.9
168.0 ± 0.3
F
301.7 ± 1.1
380.4 ± 4.5
305.9 ± 3.2
106.3 ± 1.3
187.4 ± 1.9
Cefixime
6.3 ± 0.6
64.1 ± 0.4
5.4 ± 0.1
9.4 ± 0.5
3.2 ± 0.8
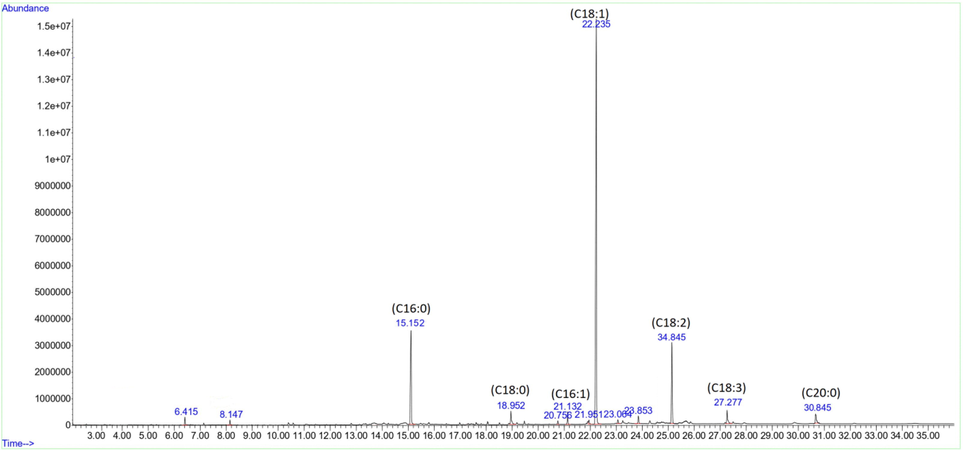
A typical GC–MS chromatogram for fatty acids analysis of lipid fraction from olive fruit of BARI-Zaitoon-1 at the fully-ripen stage.
Among the Gram-negative bacterial stains, K. oxytoca was relatively more susceptible, and maximum inhibition was observed by BZ1 (with a minimum MIC value of 225.7 µg/mL) at the unripen stage, and lowest inhibition was observed for BZ2 (with the highest MIC value of 403.5 µg/mL). For the other two bacterial strains (S. Typhi and E. coli), the tested OFE samples showed almost negligible antimicrobial potential. Our findings were consistent with previous research showing that olive phenolic extracts inhibited the growth of Gram-positive bacteria more effectively than Gram-negative bacteria (Korukluoglu et al., 2010). It has been evaluated that the antimicrobial activity of phenolic extracts from olive oil of three cultivars was quite stronger against Clostridium perfringens (Gram-positive bacteria) while no inhibition activity was observed against E. coli (Dağdelen, 2016).
3.6 Hemolytic and thrombolytic activities of OFEs
The tested OFEs exhibited very low hemolytic activity or negligible cytotoxicity. It was noticed that hemolytic activity (expressed as % of red blood cells lysis) decreased with the maturation of olive fruits for both the cultivars, and it ranged from 1.75 ± 0.04 (for BZ1 at fully-ripe stage) to 4.65 ± 0.05 % (for BZ1 at the un-ripened stage) as shown in Table 4. Moreover, thromboembolic pathologies are becoming more common and are the leading cause of morbidity and death across the globe (Raskob et al., 2014).
Cultivars
Stages
Hemolytic
activity (%)
Thrombolytic
activity (%)
BZ1
U
4.65 ± 0.05aa
23.60 ± 0.06aa
S
3.68 ± 0.02bb
19.36 ± 0.02bb
F
2.81 ± 0.03 cc
25.89 ± 0.04 cc
BZ2
U
5.09 ± 0.01da
18.90 ± 0.12da
S
2.63 ± 0.00eb
20.09 ± 0.04eb
F
1.75 ± 0.04fc
20.62 ± 0.23fb
Standard
Positive
99. 91 ± 0.02T
86.81 ± 1.68S
Negative
0.00P
2.51 ± 0.01D
The Mediterranean diet is noted for its high intake of olive products, which has been linked to improved cholesterol levels, blood pressure profiles, and thrombogenesis (Covas, 2007). This study investigated the optimized ethanolic OFEs for in-vitro antithrombotic activity (Table 4). For both the cultivars, the thrombolysis effect of OFEs was slightly higher at fully-ripe olives stage compared with unripen and semi-ripen samples. The un-ripened stage varied between 18.90 ± 0.12 % (for BZ2) and 25.89 ± 0.04 % (for BZ1). Lins et al., (2018) investigated the protective action of olive leaf extract against oxidative damage in human erythrocytes and EC50 for the extract was found to be 157.0 and 186.3 µg/mL, respectively. According to a recent study, the thrombolytic activity of wild olive crud extract and phenolic-rich extract ranged (depending upon solvent) from 38.15 to 59.21 % and 56.24 to 71.42 %, respectively (Ahmad et al., 2022).
3.7 Fatty acids composition of olive oils
The fatty acids (FA) detected in olive fruit oil (n-hexane fraction) (Fig. 4) at different maturity stages are given in Table 5. The oleic acid was the major FA found at all stages of both cultivars. It increased from 63.07 to 68.73 % for BZ1 and 60.59 to 62.12 % with olive fruits maturation. Linoleic acid was the second most abundant fatty acid, followed by palmitic acid. The concentration of linoleic was slightly increased from 16.53 to 17.75 % and 17.75 to 18.03 %, while the content of palmitic acid was decreased from 15.01 to 7.52 % and 16.23 to 13.70 % for BZ-1 and BZ-2, respectively. Moreover, Stearic, palmitoleic, linolenic and arachidic acids were also detected in minor quanitities. The result showed that the concentration of unsaturated FAs decreased, and in a while, the concentration of saturated FAs increased during the ripening period. A considerably high level of monounsaturated fatty acids was found in both selected cultivars at a fully ripen stage. The health benefits of the olive oil consumption are directly related to its well-balanced FA composition. Various factors such as agroclimatic conditions, cultivar, geographic area, fruit maturity and agricultural practices affect FA's relative composition in olive oils. Kesen et al. (2017) reported that the major FAs (their concentration range) in olive oil were oleic (55–85 %), linoleic (7.5–20 %), palmitic (7.5–20 %), linolenic (0.0–1.5 %) stearic (0.5–5 %), and palmitoleic (0.3–3.5 %) acids. Furthermore, the author observed that the concertation of oleic acid was higher during the last harvested period compared to the first harvested period. In another study, the variation in FAs in two Greek olive cultivars (Koroneiki and Throumbolia) was investigated and the predominant FA was found to be oleic acid and its content was increased from 74.97 to 76.33 % in Koroneiki and 61.07 to 62.92 % in Throumbolia variety during the maturation period (Vekiari et al., 2010). U: unripen; S: semi-ripen; F: fully-ripen. Values are mean ± SD (n = 3). Different superscript (In the same column) for each cultivar show a significant variation (p < 0.05) among different maturity stages, while different subscripts (in the same column) show the significant variation (p < 0.05) between the two cultivars at the same maturity stage.
Cultivars
Stages
Fatty acids (%)
Palmitic
Stearic
Arachidic
Palmitoleic
Oleic
Linoleic
Linolenic
BZ1
U
15.01 ± 0.23aa
2.19 ± 0.10aa
0.35 ± 0.01aa
0.55 ± 0.03aa
63.07 ± 0.32aa
16.53 ± 0.12aa
0.42 ± 0.02aa
S
10.03 ± 0.32bb
2.08 ± 0.07ba
0.20 ± 0.05bb
1.43 ± 0.05bb
67.26 ± 0.44bb
17.12 ± 0.21bb
0.96 ± 0.04bb
F
7.52 ± 0.21 cc
1.95 ± 0.07cb
0.34 ± 0.03ca
1.20 ± 0.06 cc
68.73 ± 0.50 cc
17.75 ± 0.24cb
1.67 ± 0.06 cc
BZ2
U
16.23 ± 0.50aa
2.69 ± 0.21da
0.41 ± 0.08da
0.49 ± 0.02da
60.59 ± 0.21da
17.75 ± 0.02da
0.64 ± 0.02da
S
14.94 ± 0.20db
2.64 ± 0.32ea
0.44 ± 0.06eb
0.50 ± 0.02ea
61.23 ± 0.32eb
18.34 ± 0.31eb
0.87 ± 0.05bb
F
13.7 ± 0.17ec
2.42 ± 0.06fa
0.35 ± 0.08 cc
0.61 ± 0.04fa
62.12 ± 0.71fb
18.03 ± 0.11cb
1.22 ± 0.03ec
Anwar et al., (2013) found that oleic acid (60.0 %), palmitic acid (15.7 %) and linoleic acid (14.1 %) were the major fatty acids found in the olive oil of wild olives collected from different locations in Rawalpindi, Pakistan. A recent report on the fatty acid profile of oil collected from wild olive fruit in District Chakwal revealed that the concentration of oleic acid (47.41 %) was the highest among all identified fatty acids, followed by the palmitic acid (21.70 %) and linoleic acid (16.24 %) (Ahmad et al., 2022). But in the present study, the BZ-1 cultivar was blessed with a significantly higher level of oleic acid (68 %). According to the International Olive Council (OIC), the acceptable values of oleic acid, linoleic acid, palmitic acid, and palmitoleic acid varied in the range of 55–83 %, 2.50–21 %, 7.5–20 %, 0.50–5, and 0.30–3.50, respectively (Espínola et al., 2021). Although the fatty acid profile of the selected two olive cultivars in the present study, varied considerably as compared with other olive varieties such as Koronieki, Ottobratica, etc., however it fell within the acceptable range as mentioned by OIC.
3.8 Organic acids and simple sugars
The variations depcited in organic acids composition of the olives from BZ1 and BZ2 during maturation are given in Table 6. With the development of olive fruits, a gradual increase in total organic acid content was observed in both cultivars. The highest total organic acid (2555.7 ± 5.23 ppm) was measured in BZ2 (at fully-ripen stage) and the lowest total organic acid (850.29 ± 6.86 ppm) was found in BZ1 in unripen olives. Different trends in the variation of individual organic acids were observed during the fruit maturation. The concentration of tartaric acid and oxalic acid was high, while the concentration of malic acid was low in semi-ripen olives compared to unripen and fully-ripen olive fruits from both cultivars. Whereas, the content of citric acid gradually increased from unripen to fully-ripen stages. Among the individual organic acids, citric acid was the most abundant, followed by malic acid, tartaric acid and oxalic acid. U: unripen; S: semi-ripen; F: fully-ripen. Different superscript in the same column for each cultivar shows a significant variation (p < 0.05) among different maturity stages, while different subscripts (in same column) show a significant variation (p < 0.05) between the two cultivars at the same maturity stage.
Cultivars
Stages
Organic Acids (ppm)
Sugars (g/kg)
Tartaric
Malic
Oxalic
Citric
Total
Glucose
Fructose
Total
BZ1
U
62.29 ± 1.01ab
551.45 ± 4.62ab
31.6 ± 0.11ab
205.32 ± 1.20aa
850.20 ± 6.85aa
1.21 ± 0.03aa
5.30 ± 0.01aa
6.51 ± 0.04aa
S
111.26 ± 3.14bb
381.29 ± 1.49bb
44.35 ± 0.57ab
301.05 ± 3.22bb
857.44 ± 9.02ba
5.01 ± 0.07bb
3.23 ± 0.03bb
8.08 ± 0.10bb
F
110.14 ± 0.49cb
708.14 ± 2.68 cc
22.25 ± 0.23ab
411.10 ± 3.39 cc
1252.63 ± 8.81cb
8.37 ± 0.05 cc
3.19 ± 0.06cb
11.56 ± 0.11 cc
BZ2
U
150.28 ± 1.90da
980.21 ± 4.90da
73.19 ± 1.14ab
807.35 ± 4.48db
1970.71 ± 8.20da
1.52 ± 0.02da
6.17 ± 0.15da
7.69 ± 0.17da
S
138.54 ± 0.74eb
390.13 ± 2.35bb
85.60 ± 0.89ab
1392.79 ± 6.90eb
2018.81 ± 9.91eb
5.32 ± 0.3bb
3.98 ± 0.11eb
9.30 ± 0.23eb
F
130.82 ± 3.13fc
940.00 ± 4.12eb
52.54 ± 1.01ab
1424.70 ± 5.40fb
2555.70 ± 5.90fc
9.32 ± 0.12ec
3.45 ± 0.52cb
12.77 ± 0.83 cc
Variations in individual sugar (glucose and fructose) and total sugar in the tested olives of two cultivars are given in Table 6. As the maturity progressed, a gradual increase in total sugar was noticed in both cultivars. The highest total sugar content (12.77 ± 0.83 g/kg) was analyzed in BZ2 (fully-ripen stage), and the lowest total sugar content (6.51 ± 0.04 g/kg) was found in BZ1 in unripe olive. In both cultivars, at semi-ripen and fully-ripen maturity stages, glucose was more prominent than fructose, while at unripe stage, fructose was prominent than glucose. Moreover, with the increase in fruit maturity, an increase in glucose while a decrease in fructose concentration was noticed. The highest amount of glucose (9.32 ± 0.12 g/kg) and fructose (6.17 ± 0.15 g/kg) was found in BZ1 at the fully ripen and unripen maturity stages, respectively. Overall, BZ2 has more sugar content compared to BZ1. In a previous study, olive fruits from Dhokar cultivars grown in Southern Tunisia were picked at five different ripening stages and a gradual increase in total sugar contents was observed (Jemai et al., 2009). In another investigation, the sugar contents in olive fruits of Hojiblanca, Douro, Taggiasca, Thasos and Cassanese were significantly higher at the last harvested time. Fructose, glucose, and galactose were the main sugars in olive fruit pulp.
During the maturation of olives, a decrease in fructose while an increase in glucose was observed (Marsilio et al., 2001). In an earlier study, the sugar content of cv Domat and cv Memecik decreased continuously from the early maturity level to the end of the maturity level. But in the case of cv. Uslu sugar content increased with an increase in maturity (till October) and then significantly decreased onward (Nergiz and Ergönül, 2009). In another study, Nergiz and Enges observed that fructose and glucose were the main sugars in olive fruits. In general, glucose content was found to be larger than that of fructose in all maturity stages of olive fruit from cv. Memecik and cv. Domat (Nergiz and Engez, 2000).
As can be noted from the data of Table 6, in the present study, generally a higher amount of the individual and total sugars were detected in BZ2 compared to BZ1. Likewise, BZ2 also contained a higher amount of organic acids. Variations in the sugar contents of different olive varieties across regions can be linked to the ongoing synthesis of sugar during the ripening process and its utilization in the biosynthesis of fatty acids (Menz and Vriesekoop, 2010). Aktas et al. (2014) found that olive samples from different varieties (Hurma, Erkence and Gemlik) contain higher amounts of citric acid than malic acids at all maturation. A study of Turkish olives from several locations showed that citric acid was the main organic acid followed by succinic acid (Arslan and Özcan, 2011). While, some studies also revealed that in Turkish olives, malic acid was the dominant organic acid (Ergönül and Nergiz, 2010). Nergiz and Ergönül reported that the total organic acid contents decrease for the first 3 months of fruit development and then start increasing till the fully-ripen stage.
4 Conclusion
The tested extracts recovered from olive fruits of selected olive cultivars, depicted the presence of considerable and significantly variable levels of phenolic compounds as well as biological activities in relation to maturity stages. The maximum values for extract yield and antioxidant potential were investigated for the unripen olives. The tested OFEs from both the cultivars exhibited stronger antibacterial activity against the Gram-positive but weaker against Gram-negative tested strains. HPLC analysis confirmed the presence of various phenolic bioactives in the OFEs as well. The major phenolic acid and flavonoid components detected were sinapic acid and myricetin, respectively. A variable but appreciable amount of oleic acid was detected in the olive oils of both the cultivars using GC–MS. Higher levels of total organic acid and natural sugars were observed in fully-ripen olives with their contents relatively higher in BZ2 fruit. The tested OFEs also offered appreciable thrombolytic activity that supports the significance of consumption of olive products in routine diet to minimize coronary-heart related ailments. Furthermore, the negligible hemolytic activities (red blood cell lysis) exhibited by the OFEs suggest support that these can be safely utilized as ingredients in nutra-pharmaceuticals developments.However, it is important to harvest the olives at an appropriate maturity satge in order to get maximum nutritional and nutraceuticals benefits of this valuable fruit.
Funding
This work was funded by the Researchers Supporting Project number (RSP2023R123), King Saud University, Riyadh, Saudi Arabia.
Acknowledgements
Authors would like to extend their sincere appreciation to the Researchers Supporting Project number (RSP2023R123), King Saud University, Riyadh, Saudi Arabia.
Declaration of Competing Interest
The authors declare that they have no known competing financial interests or personal relationships that could have appeared to influence the work reported in this paper.
References
- Wild olive fruits: Phenolics profiling, antioxidants, antimicrobial, thrombolytic and haemolytic activities. Arab. J. Chem.. 2022;15:104241
- [Google Scholar]
- Comparison of some chemical parameters of a naturally debittered olive (Olea europaea L.) type with regular olive varieties. Food Chem.. 2014;161:104-111.
- [Google Scholar]
- Mentha: a genus rich in vital nutra-pharmaceuticals—A review. Phytotherapy Res.. 2019;33:2548-2570.
- [Google Scholar]
- Najeeb-ur-Rehman; Adam, EHK; Gilani, A. Chemo-geographical variations in the composition of volatiles and the biological attributes of Mentha longifolia (L.) Essential oils from Saudi Arabia. Int. J. Pharmacol.. 2017;13:408-424.
- [Google Scholar]
- Characterization of olive oils obtained from wild olive trees (Olea ferruginea Royle) in Pakistan. Food Res. Int.. 2013;54:1965-1971.
- [Google Scholar]
- Influence of growing area and harvest date on the organic acid composition of olive fruits from Gemlik variety. Scientia Horticulturae. 2011;130:633-641.
- [Google Scholar]
- Purification and characterization of bacteriocin isolated from Streptococcus thermophilus. Afr. J. Microbiol. Res.. 2011;5:2642-2648.
- [Google Scholar]
- Investigation of antioxidant and antihemolytic activities of Algerian defatted olive fruits (olea europaea L.) at two ripening stages. Mediterr. J. Nutr. Metab.. 2018;11:217-233.
- [Google Scholar]
- [2] Ferric reducing/antioxidant power assay: direct measure of total antioxidant activity of biological fluids and modified version for simultaneous measurement of total antioxidant power and ascorbic acid concentration. In: Methods in Enzymol.. Vol 299. Elsevier; 1999. p. :15-27.
- [Google Scholar]
- Chahal, S. P., Starr, J.N., 2000. Lactic acid. Ullmann's encyclopedia of industrial chemistry.
- Dynamic epigenetic modifications in plant sugar signal transduction. Trends Plant Sci. 2021
- [Google Scholar]
- Organic acids as antimicrobial food agents: applications and microbial productions. Bioprocess Biosyst. Eng.. 2020;43:569-591.
- [Google Scholar]
- Identifying antioxidant and antimicrobial activities of the phenolic extracts and mineral contents of virgin olive oils (Olea europaea L. cv Edincik Su) from different regions in Turkey. J. Chem. 2016
- [Google Scholar]
- Donaire, J. P., Belver, A., Rodríguez García, M.I., et al., 1984. Lipid biosynthesis, oxidative enzyme activities and cellular changes in growing olive fruit.
- Determination of organic acids in olive fruit by HPLC. Czech J. Food Sci.. 2010;28:202-205.
- [Google Scholar]
- Processing effect and characterization of olive oils from Spanish wild olive trees (Olea europaea var. sylvestris. Molecules. 2021;26:1304
- [Google Scholar]
- DPPH-scavenging capacity of chloroplastic pigments and phenolic compounds of olive fruits (cv. Arbequina) during ripening. J. Food Compos. Anal.. 2011;24:858-864.
- [Google Scholar]
- Biological and hypoglycemic effects of a polyherbal extract on alloxanized diabetic rats. ACS Omega 2022
- [Google Scholar]
- Valuable nutrients and functional bioactives in different parts of olive (Olea europaea L.)—a review. Int. J. Mol. Sci.. 2012;13:3291-3340.
- [Google Scholar]
- Effect of cultivar and ripening on minor components in Spanish olive fruits and their corresponding virgin olive oils. Food Res. Int.. 2008;41:433-440.
- [Google Scholar]
- Comparative study on polyphenols content and antioxidant effect of olive cultivars from the Island Paros, Greece. Carpathian J. Food Sci. Technol.. 2017;9
- [Google Scholar]
- Kinetics of the polyphenolic content and radical scavenging capacity in olives through on-tree ripening. J. Chem. 2017
- [Google Scholar]
- The effects of ripening stage and mode of culture of Chemlali, Arbequina and Koroneiki on the capacities of oils to scavenge ABTS free radicals. ESI Preprints. 2022;9:381
- [Google Scholar]
- Phenolic composition, sugar contents and antioxidant activity of Tunisian sweet olive cultivar with regard to fruit ripening. J. Agric. Food Chem.. 2009;57:2961-2968.
- [Google Scholar]
- Fruit ripening, antioxidants and oil composition in Koroneiki olives (Olea europea L.) at different maturity indices. Agronomy. 2021;11:122
- [Google Scholar]
- Effects of cultivar, maturity index and growing region on fatty acid composition of olive oils. Eurasian J. Food Sci. Technol.. 2017;1:18-28.
- [Google Scholar]
- Antibacterial activity and chemical constitutions of Olea europaea L. leaf extracts. J. Food Process. Preserv.. 2010;34:383-396.
- [Google Scholar]
- Antioxidant and antiglycation properties of different solvent extracts from Chinese olive (Canarium album L.) fruit. Asian Pac. J. Trop. Med.. 2015;8:1013-1021.
- [Google Scholar]
- In vitro antioxidant activity of olive leaf extract (Olea europaea L.) and its protective effect on oxidative damage in human erythrocytes. Heliyon. 2018;4:e00805
- [Google Scholar]
- In vitro antimicrobial activity of green synthesized silver nanoparticles against selected Gram-negative foodborne pathogens. Front. Microbiol.. 2018;9:1555
- [Google Scholar]
- Polyphenolic compounds, antioxidant activity and l-phenylalanine ammonia-lyase activity during ripening of olive cv. “Cobrançosa” under different irrigation regimes. Food Res. Int.. 2013;51:412-421.
- [Google Scholar]
- Effect of maturity on phenolics (phenolic acids and flavonoids) profile of strawberry cultivars and mulberry species from Pakistan. Int. J. Mol. Sci.. 2012;13:4591-4607.
- [Google Scholar]
- Sugar and polyol compositions of some European olive fruit varieties (Olea europaea L.) suitable for table olive purposes. Food Chem.. 2001;72:485-490.
- [Google Scholar]
- Production optimization and characterization of a low molecular weight bacteriocin from Lactococcus lactis subsp. lactis. Afr. J. Microbiol. Res.. 2012;6:5924-5933.
- [Google Scholar]
- Physical and chemical changes during the maturation of Gordal Sevillana olives (Olea europaea L., cv. Gordal Sevillana) J. Agric. Food Chem.. 2010;58:4934-4938.
- [Google Scholar]
- HPLC profiles of standard phenolic compounds present in medicinal plants. Int. J. Pharmacognosy Phytochem. Res.. 2012;4:162-167.
- [Google Scholar]
- Nigella sativa L. seed and seed oil: Potential sources of high-value components for development of functional foods and nutraceuticals/pharmaceuticals. J. Essent. Oil Res.. 2019;31:171-183.
- [Google Scholar]
- Organic acid content and composition of the olive fruits during ripening and its relationship with oil and sugar. Scientia Horticulturae. 2009;122:216-220.
- [Google Scholar]
- Profiling of polyphenolics, nutrients and antioxidant potential of germplasm’s leaves from seven cultivars of Moringa oleifera Lam. Ind. Crop. Prod.. 2016;83:166-176.
- [Google Scholar]
- Standard methods for the analysis of oils, fats and derivatives. Blackwell scientific publications Oxford; 1987.
- Enzyme-assisted extraction of Momordica balsamina L. fruit phenolics: process optimized by response surface methodology. J. Food Meas. Charact.. 2019;13:697-706.
- [Google Scholar]
- Variation in nutritional and antioxidant attributes of Moringa oleifera L. leaves at different maturity stages. Front. Energy Res. 20221034
- [Google Scholar]
- Antioxidant properties and hyphenated HPLC-PDA-MS profiling of Chilean Pica mango fruits (Mangifera indica L. cv. piqueño) Molecules. 2013;19:438-458.
- [Google Scholar]
- Thrombosis: a major contributor to global disease burden. Arterioscler. Thromb. Vasc. Biol.. 2014;34:2363-2371.
- [Google Scholar]
- Phytochemical and biological studies of Agave attenuata. Int. J. Mol. Sci.. 2012;13:6440-6451.
- [Google Scholar]
- Evaluation of polyphenolics content and antioxidant activity in edible wild fruits. BioMed Res. Int. 2019
- [Google Scholar]
- Effect of the “Ottobratica” variety ripening stage on the phenolic profile of the obtained olive oil. Rivista Italiana delle Sostanze Grasse. 2009;86:215-219.
- [Google Scholar]
- Flavonols (kaempeferol, quercetin, myricetin) contents of selected fruits, vegetables and medicinal plants. Food Chem.. 2008;108:879-884.
- [Google Scholar]
- Evaluation of some promising varieties of olive (Olea europaea L.) for growth and yield under Pothwar Regions of Punjab, Pakistan. Pakistan J. Agric. Res.. 2021;34:446-453.
- [Google Scholar]
- Pattern of variation of fruit traits and phenol content in olive fruits from six different cultivars. J. Agric. Food Chem.. 2015;63:10466-10476.
- [Google Scholar]
- Antimicrobial and antioxidant activities of the essential oil and various extracts of Salvia tomentosa Miller (Lamiaceae) Food Chem.. 2005;90:333-340.
- [Google Scholar]
- Response surface methodology-based optimized ultrasonic-assisted extraction and characterization of selected high-value components from Gemlik olive fruit. Chem. Biodivers. 2023e202300107
- [Google Scholar]
- Changes in phenolic compounds during ripening in Gemlik variety olive fruits obtained from different locations. CyTAJournal of Food. 2015;13(2):167-173.
- [Google Scholar]
- Up-regulation of lipid biosynthesis increases the oil content in leaves of Sorghum bicolor. Plant Biotechnol. J.. 2019;17:220-232.
- [Google Scholar]
- Characterization and seasonal variation of the quality of virgin olive oil of the Throumbolia and Koroneiki varieties from Southern Greece. Grasas y Aceites. 2010;61:221-231.
- [Google Scholar]
- Phenolic compositions, and antioxidant performance of olive leaf and fruit (Olea europaea L.) extracts and their structure–activity relationships. J. Funct. Foods. 2015;16:460-471.
- [Google Scholar]
Appendix A
Supplementary material
Supplementary data to this article can be found online at https://doi.org/10.1016/j.arabjc.2023.105195.
Appendix A
Supplementary material
The following are the Supplementary data to this article:Supplementary data 1
Supplementary data 1


