

Translate this page into:
A novel interfacial polymerization approach towards synthesis of graphene oxide-incorporated thin film nanocomposite membrane with improved surface properties
⁎Corresponding author at: Advanced Membrane Technology Research Centre (AMTEC), Universiti Teknologi Malaysia, 81310 Skudai, Johor, Malaysia. lwoeijye@utm.my (W.J. Lau) lau_woeijye@yahoo.com (W.J. Lau)
-
Received: ,
Accepted: ,
This article was originally published by Elsevier and was migrated to Scientific Scholar after the change of Publisher.
Peer review under responsibility of King Saud University.
Abstract

Abstract
Filtration IP technique is more effective than rolling IP technique in TFN membrane fabrication. Membrane incorporated with GO showed significantly higher water flux and better antifouling property. Membrane incorporated with GO could overcome trade-off between water flux and rejection.
Abstract
The conventional interfacial polymerization (IP) technique that requires a rubber roller in removing amine aqueous solution is likely to cause uneven distribution of nanomaterials on microporous substrate during thin film nanocomposite (TFN) membrane fabrication. A novel IP technique was developed in this work to pre-coat the substrate with graphene oxide (GO) nanosheets followed by vacuum filtration of amine aqueous solution through the substrate before initiating polyamide cross-linking process. This novel technique was also employed to fabricate a composite membrane that contained no nanomaterials. The results showed that the GO-incorporated TFN membrane exhibited 71.7% and 129.4% higher pure water flux compared to the composite membranes without GO incorporation that were synthesized using conventional and filtration IP technique, respectively. The water enhancement of the TFN membrane could be attributed to the existence of hydrophilic GO that was distributed evenly throughout the substrate surface coupled with the formation of porous selective layer that reduced water transport resistance. Besides exhibiting promising rejection against divalent ions, the newly developed TFN membrane also showed significantly lower water flux deterioration in filtrating bovine serum albumin and Reactive Black 5 solution. The enhanced membrane antifouling resistance was mainly due to the improved membrane surface properties that minimize deposition and adsorption of foulants on the TFN membrane surface.
Keywords
Thin film nanocomposite
Vacuum filtration
Water permeability
Salt rejection
Antifouling

1 Introduction
Dwindling water resources and ever-rising demand of freshwater have forced scientists to develop advanced membrane technologies for desalination process to ensure continuous water supply in a safer, energy efficient and environmentally sustainable way (Baker, 2002). Nanofiltration (NF) has been heavily studied over the past 20 years and close to 7000 papers related to NF membrane and its applications were published in the peer-reviewed journals (Lau and Ismail, 2016). In general, NF membrane could produce promising water flux at relatively low energy consumption while exhibiting high retention against multivalent ions and organic molecules (Diawara, 2008; Eriksson, 1988; Mänttäri et al., 2013.; Mohammad et al., 2015).
Currently, the NF membrane market is dominated by polyamide (PA) thin film composite (TFC) membrane made by interfacial polymerization (IP) technique. The unique characteristics of TFC membrane (compared to asymmetric membrane formed via phase inversion technique) are the significantly higher water flux coupled with excellent separation capability and wide pH tolerance. By embedding a small quantity of nanofillers into PA selective layer of membranes, it was reported the water permeability of the resultant thin film nanocomposite (TFN) membranes could be significantly improved with minimum impact on salt rejection rate due to higher membrane hydrophilicity (Ingole et al., 2016; Lau et al., 2015a; Lind et al., 2009; Ma et al., 2017; Sirinupong et al., 2018; Wang et al., 2015; Zheng et al., 2017). The resultant TFN membranes also show huge potential not only in overcoming flux-rejection trade-off of TFC membranes, but also introducing additional features rendered by inorganic nanofillers such as excellent antifouling properties and antibacterial effect (Emadzadeh et al., 2014; Lau et al., 2015b, 2012, Lee et al., 2008, 2007; Li et al., 2015).
The recently emerging graphene-based materials, e.g., graphene oxide (GO) nanosheets have drawn world attention owing to their superior hydrophilic properties resulted from bulk amount of oxygen functionalities such as hydroxyl, epoxy and carboxyl (Gao et al., 2009; Raidongia et al., 2014; Stobinski et al., 2014). The presence of these functional groups offers an extraordinary potential for synthesis of nanocomposite membranes with enhanced hydrophilicity, antifouling resistance and chlorine resistance for various water treatment applications (Chae et al., 2015; Hegab and Zou, 2015; Zhang et al., 2017; Zhao et al., 2013). To prepare GO-embedded membranes, various strategies have been explored to maximize the potential of GO, particularly to obtain an evenly distribution of GO throughout the membrane surface. One of the strategies is to coat a few-layered GO on porous polymeric substrates through vacuum filtration of GO suspension (Han et al., 2013; Hu and Mi, 2013; Joshi et al., 2014). Although such membranes were shown to have improved water permeability, the relatively weak bonding between GO nanosheets and membrane surface could cause GO detaching from the membrane easily when fluid shear exists.
Another strategy is to disperse the GO nanosheets in the monomer-contained solvents (polar or non-polar) during IP process (Zhang et al., 2017). Nevertheless, it is found that the GO with high degree of hydrophilicity is not able to disperse homogeneously in non-polar solvent compared to its dispersion quality in polar solvent (Fig. S1). Hydrophilic nanoparticles do not have any problem to disperse in polar solution, but the conventional IP technique that requires the use of rubber roller to remove excess polar solution containing nanoparticles can result in the uneven distribution of nanoparticles and/or loss of most of the nanoparticles from the substrate surface (Fig. S2) (Lai et al., 2016b). Chemical modification was proposed by Layek and Nandi (2013) to improve the dispersion quality of GO in non-polar solvent, but the change in surface properties can alter the hydrophilicity and surface charge density of the nanomaterials.
In this work, a new IP technique based on vacuum filtration was developed to overcome the technical challenges encountered by the conventional rolling IP technique, improving the distribution of GO on the substrate surface and enhancing the properties of PA-GO nanocomposite layer for separation process. Another two types of composite membranes that contained no GO were also synthesized using filtration IP and conventional (rolling) IP technique, respectively and were used as comparison purpose. All these membranes were subjected to same instrumental characterization and water filtration process prior to antifouling study using bovine serum albumin (BSA) and Reactive Black 5 (RB5) solution. The successful incorporation of small quantity of hydrophilic GO nanosheets in the PA layer of TFN membrane is expected to show enhanced anti fouling resistance, in addition to greater water flux following the improvement in the membrane surface characteristics.
2 Experimental section
2.1 Materials
Polysulfone Udel® P-3500 (Solvay) in pellet form, polyvinylpyrrolidone (PVP K29-32, Acros Organics) and 1-methyl-2-pyrrolidinone (NMP, 99%, Acros Organics) were used for fabrication of PSf substrate. Piperazine (PIP, 99%, Acros Organics) and trimesoyl chloride (TMC, 98%, Acros Organics) were used as the active monomers to form the PA selective layer on PSf substrate surface. Milipore RO water (ASTM Type III) and n-hexane (99%, RCI Labscan) were used to dissolve PIP and TMC, respectively to prepare monomer solution. Graphene oxide (GO) which was used as nanofiller was self-synthesized according to our previous work (Lai et al., 2016a). Inorganic salts including sodium sulfate (Na2SO4, Riedel-de Haen), magnesium sulfate (MgSO4, Merck) and sodium chloride (NaCl, Merck) were used as the charged solutes in studying the membrane separation performance. For antifouling test, bovine serum albumin (BSA, Sigma-Aldrich) and Reactive Black 5 (RB5, Mw = 991 g mol−1, Sigma-Aldrich) were used as the foulants to monitor the membrane water flux change as a function of filtration time. All feed solutions were prepared by dissolving specific amount of single solute in Milipore RO water.
2.2 Preparation of PSf substrate
A dope formulation (15 wt% PSf, 1 wt% PVP and 84 wt% NMP) reported in our previous work (Misdan et al., 2013) was used here to prepare PSf substrate. At first, PVP was added into NMP and stirred until it was dissolved completely. This was followed by 30 min ultrasonication to minimize agglomeration. PSf pellets were then added slowly into the mixture under vigorous stirring. The mixture was continuously stirred overnight until it became homogenous. To remove any trapped air bubbles, the dope solution was sonicated for 1 h and left for overnight at room conditions before being used. PSf substrate was fabricated by casting the dope solution on a glass plate using a glass rod. The cast substrate was left for 10 s at ambient temperature before immersing into a water coagulation bath at room temperature for solvent/non-solvent exchange (wet phase inversion) to take place. The substrate was transferred to another clean water bath once it was peeled off from the glass plate and kept for at least 24 h to remove residual solvent and PVP. Lastly, the microporous PSf substrate was washed with RO water and kept in wet condition prior to use.
2.3 Preparation of polyamide selective layer
Three different types of PA composite membranes were fabricated using either rolling IP or filtration IP technique) as shown in Table 1. The amine and acyl chloride monomers used to establish PA selective layer of all these membranes are PIP and TMC, respectively. The TFC membrane fabricated using rolling IP technique was served as control and used to compare with membranes made by filtration IP technique. In brief, a substrate that clamped in between a glass plate and Viton frame was poured with 2 w/v% of PIP aqueous solution (20 mL) on its top surface. The aqueous solution was then poured off after 2 min contact time following by soft rubber rolling to remove residual droplets. Then, 0.2 w/v% of TMC in n-hexane solution (20 mL) was poured onto the same substrate surface and drained off after 1 min contact time. The established PA layer as a result of interaction between PIP and TMC was further post-treated in an oven at 60 °C for 8 min to enhance its cross-linking degree. At last, the resultant TFC membrane was washed thoroughly with RO water and stored in RO water at 5 °C prior to use.
Membrane
Mass density of GO (g/m2)
IP technique
TFC (control)
–
Rolling (conventional)
TFC-f
–
Filtration
TFN-f 0.03
0.03a
Filtration
The composite membranes made by modified IP technique (filtration technique) was synthesized using a lab-scale vacuum filtration setup as illustrated in Fig. 1. In preparing neat TFC membrane based on the filtration technique (denoted as TFC-f membrane), 2 w/v% of PIP aqueous solution (5 mL) was first poured onto the substrate (Effective surface area of 21.65 cm2) clamped within a vacuum filtration setup. After 2 min contact time, the PIP solution was removed through the substrate by vacuum pressure. The substrate was then contacted with the organic phase that contained 0.2 w/v% TMC (5 mL) for 1 min followed by removing it from membrane surface by pouring. The as-treated membrane was oven-dried and washed following the same procedure as for rolling IP technique. In preparing TFN-f 0.03 membrane, the substrate was first pre-coated by 0.03 g/m2 of GO through vacuum filtration of 0.0013 w/v% GO aqueous suspension (5 mL). PA layer was then formed on the GO-deposited substrate using filtration technique as described for TFN-f 0.03 membrane.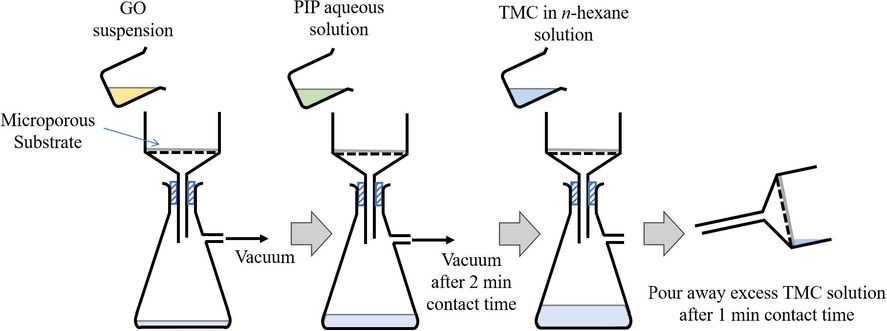
Schematic diagram of TFN-f 0.03 membrane fabrication via filtration IP technique. Desired amount of GO aqueous solution is deposited on the microporous substrate surface via vacuum filtration followed by 2-min contact time with PIP aqueous solution. The PIP solution is then withdrawn via vacuum filtration and the substrate deposited with GO and PIP will be further contacted with TMC organic solution for 1 min to form PA selective layer.
2.4 GO characterization
Transmission electron microscopy (TEM) analysis was conducted to study the morphological structure of GO nanosheets using Hitachi HT7700 at 120 kV. X-ray diffraction (XRD) of GO was measured with Rigaku X-ray diffractometer with Cu Kα radiation (λ = 0.154 nm, D/maz-rB 12 kW) and operated at 30 mA. Fourier transform infrared spectroscopy (FTIR) of GO was performed using PerkinElmer Spectrum One FTIR Spectrometer using GO embedded pressed KBr pellet with wavelength range of 4000–500 cm−1. X-ray photoelectron spectrum of GO was recorded on Kratos Axis Ultra DLD X-ray photoelectron spectroscopy (XPS). Thermogravimetric analysis (TGA) on GO was conducted using Mettler Toledo thermogravimetric analyser with a heating rate of 10 °C/min under a nitrogen atmosphere from 50 to 800 °C.
2.5 Membrane characterization
The existence of GO nanosheets within the PA layer of composite membrane was visualized using TEM analysis with Hitachi HT7700 at 120 kV. The membrane samples were first embedded in resin (Eponate 12, Ted Pella. Inc., Redding, CA) and sliced into thin section (50 nm thick) using PT-PC PowerTome ultramicrotomes (RMC Boeckeler). The surface and cross-sectional morphologies of membranes were observed by field emission scanning electron microscopy (FESEM, Hitachi SU8020). The membrane samples were fractured in liquid nitrogen before placing on stubs using carbon tape. All FESEM samples were sputter-coated with gold to make the samples electrically conductive and to avoid charging effect. Atomic force microscopy (AFM) (Park System XE-100) was utilized to measure the surface roughness of the prepared substrates and membranes using non-contact mode. The scanning area of each membrane sample was set at 10 µm × 10 µm. The surface wetting characteristic of membranes were determined by conducting contact angle (CA) measurement with contact angle goniometer (DataPhysics OCA 15Pro) using RO water as the probe liquid. For each membrane sample, the CA of the membrane as a function of time was recorded at room conditions. The elemental composition of the composite membrane surface was quantified by Kratos Axis Ultra DLD X-ray photoelectron spectroscopy (XPS) with aluminium Kα (1486 eV) radiation. The O/N ratio can be calculated based on the obtained atomic concentration of elements for the calculation of m and n values which represent the cross-linked and linear parts of PA layer, respectively using Eq. (1).
The degree of cross-linking of PA layer (%) can be calculated by Eq. (2).
2.6 Performance evaluation of NF membranes
The NF performance of TFC and TFN membranes were evaluated using a laboratory-scale dead-end filtration cell (Sterlitech™ HP4750 Stirred Cell) under nitrogen atmosphere with effective membrane surface area of 14.6 cm2. Prior to any measurement, the membrane was compacted at a pressure of 9 bar for 30 min in order to achieve flux steady state condition. Permeate was then collected for analysis after the filtration was run at desired pressure for 15 min. Pure water flux, salt water flux and salt rejection of each membrane were evaluated in this study. For salt rejection experiment, 1000 ppm single salt solution (Na2SO4, MgSO4 or NaCl) was used as feed solution at operating pressure of 8 bar. All filtration experiments were conducted at room temperature. Pure water flux, J (L/m2·h) and pure water permeability (PWP), A (L/m2·h·bar) of the membrane were calculated using Eqs. (3) and (4) as follows.
Antifouling performance test using 500 ppm BSA and RB5 solution, respectively was also conducted using the fabricated composite membranes to determine water flux change as a function of filtration time. The water permeability of the membrane (A) was measured at time interval of 30 min for up to 4 h and was compared with initial membrane water permeability (Ao) at the early stage of experiment. Normalized permeability of the membrane (A/Ao) was then calculated to study the antifouling resistance of membrane.
3 Results and discussion
3.1 GO characterization
The morphology of synthesized GO nanosheets is visualized via TEM as shown in Fig. 2(a). It is found that synthesized GO is in single flake form with wrinkled structure and lateral size of several micrometer (Chua and Pumera, 2014; Shahriary and Athawale, 2014). A significant diffraction peak at 2θ at 11.2° as shown in Fig. 2(b) confirms the successful formation of GO (Chen et al., 2013; Marcano et al., 2010). FTIR spectrum in Fig. 2(c) shows the presence of bulk amounts of oxygen functional groups in GO such as —OH stretching, stretching vibration in COOH, unoxidized sp2 aromatic C—C bonds, —OH deformation, C—O stretching vibration in alkoxy and epoxy groups. The detection of strong signal at 3393 cm−1 is the main factor causing GO to be superhydrophilic in nature (Dreyer et al., 2010). The composition of GO is further confirmed by referring to XPS spectrum as shown in Fig. 2(d). The C/O atomic ratio of the synthesized GO is found to be 2.44 and is within the range (2.1–2.9) reported elsewhere (Chen et al., 2013). The C1s XPS spectrum of GO in Fig. 2(e) indicates that 53% of the carbon atoms of GO are successfully oxidized, indicating high degree of oxidation. TGA curve of GO in Fig. 2(f) indicates the thermal stability of the nanosheets. The minimum weight loss before 100 °C is due to the release of trapped water between GO nanosheets while significant weight loss between 200 and 230 °C is attributed to the decomposition of less stable oxygen functional groups in GO. Other more stable functional groups only start to decompose after 230 °C.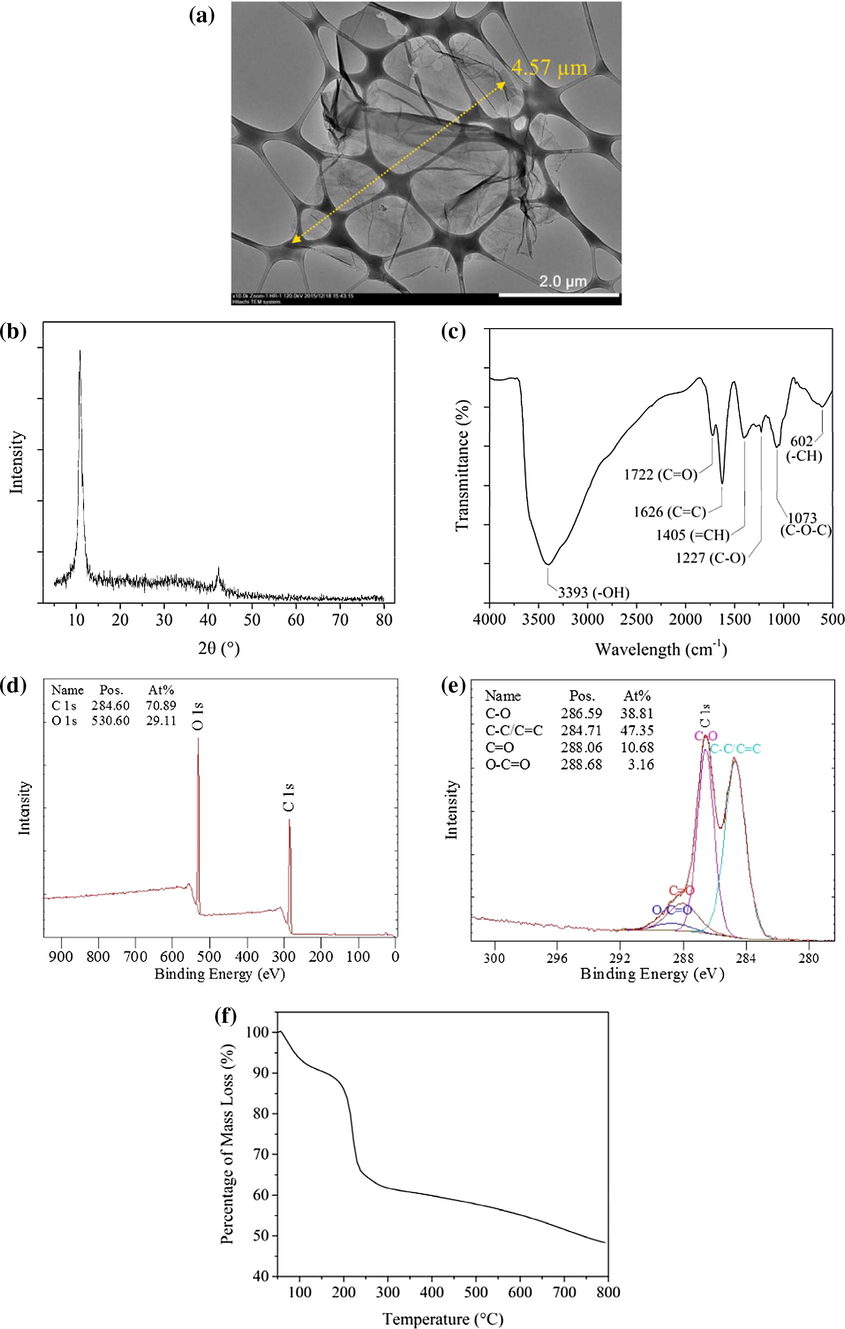
Properties of synthesized GO, (a) TEM image, (b) XRD spectra, (c) FTIR spectra, (d) XPS survey spectra, (e) C 1 s XPS spectra and (f) TGA curve.
3.2 Membrane structure and surface topography
Fig. 3 presents the surface morphology of the PSf substrate with and without GO nanosheets coating together with AFM measurement. It is found that the visible pores on the surface of the PSf substrate cannot be seen after vacuum filtration of solution containing GO nanosheets. This indicates that a thin layer of GO is successfully formed on the top of substrate. The effective retention of GO nanosheets by the substrate is due to flake form of GO as shown in Fig. 2(a). The GO-coated substrate also exhibits rougher surface compared to the pristine substrate due to wrinkled structure of GO itself. The wrinkles can be attributed to the edges and folding of GO nanosheets as reported elsewhere (Chua and Pumera, 2014; Zhang et al., 2016). However, it must be pointed out that the GO coating layer is found to be extremely thin as the beneath substrate surface pores could be roughly observed.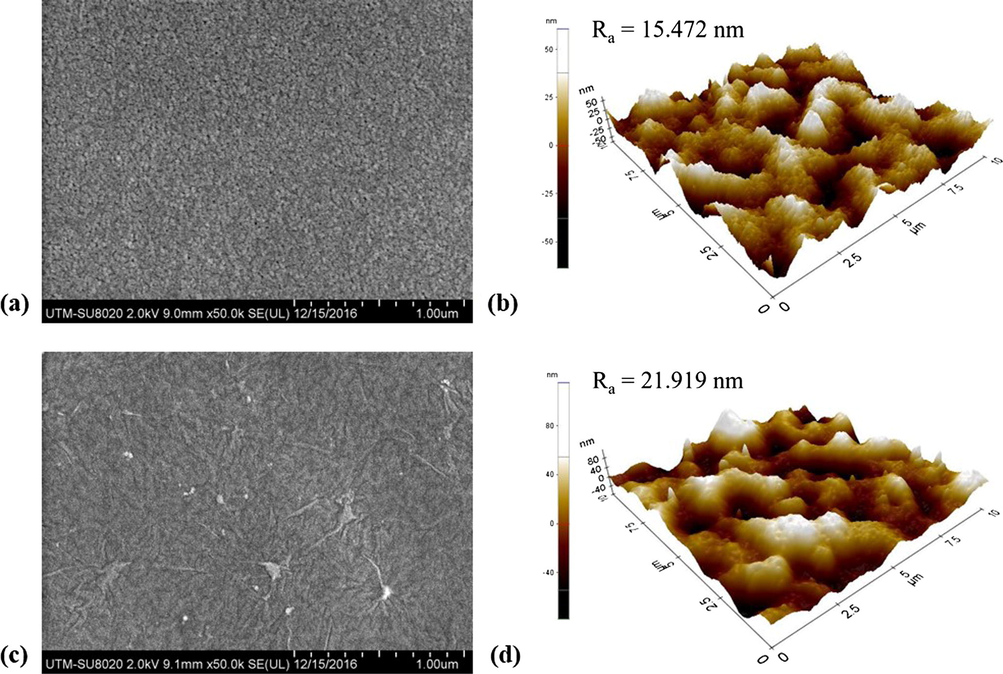
FESEM surface images and AFM images of (a and b) PSf microporous substrate and (c and d) GO-coated PSf (with GO mass density of 0.03 g/m2) substrate.
Cross-section TEM images in Fig. 4 clearly show the ridge-and-valley structures of typical characteristics of interfacially polymerized PA selective layers. However, for the TFN-f 0.03 membrane, the presence of wrinkled GO nanosheets within PA layer could be clearly seen. It can be observed that the PA layer acts as an encapsulating layer or “blanket” for the nanosheets, preventing them from detachment during filtration. Obviously, the embedment of GO nanosheets results in the formation of thicker but porous PA layer compared to the PA layer without any nanomaterials.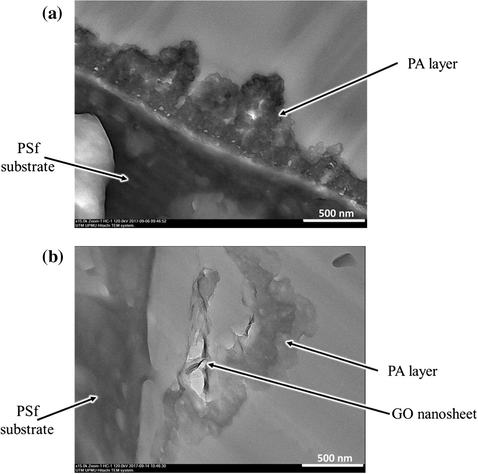
TEM images of cross-section of (a) TFC-f and (b) TFN-f 0.03 membrane.
FESEM images in Fig. 5 also indicate the formation of PA layer that consists of ridge-and-valley structures on all the composite membrane surfaces. The TFC-f membrane in general exhibits smoother surface compared to the TFC membrane, owing to the use of different technique in removing PIP solution. The vacuum filtration approach is effective to ensure PIP monomers remain thin and uniform on the substrate surface compared to the conventional rolling method that uses rubber roller. This as a consequence leads to the formation of thinner PA layer in the TFC-f membrane (52.9 nm) compared to the control TFC membrane (67.4 nm) as shown in Fig. 6.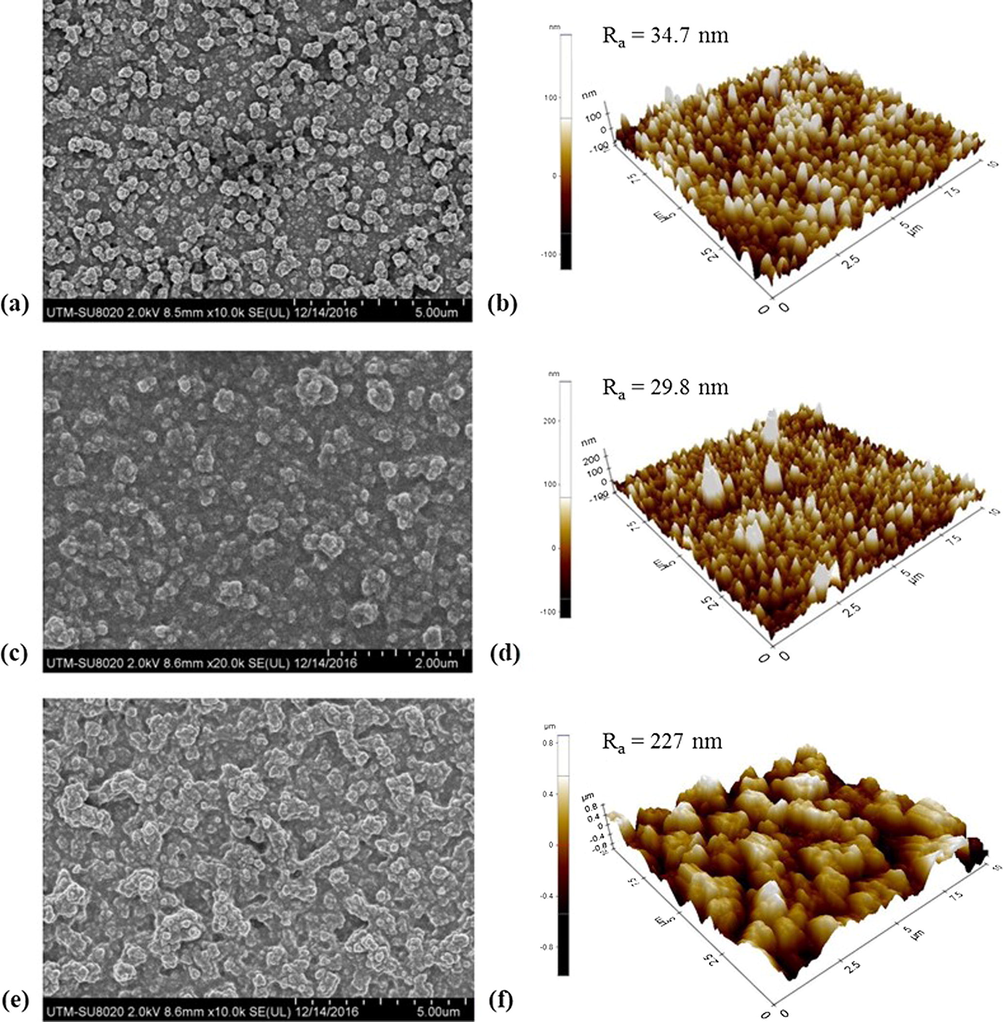
Membrane top surface morphologies and AFM images of (a and b) TFC, (c and d) TFC-f and (e and f) TFN-f 0.03.
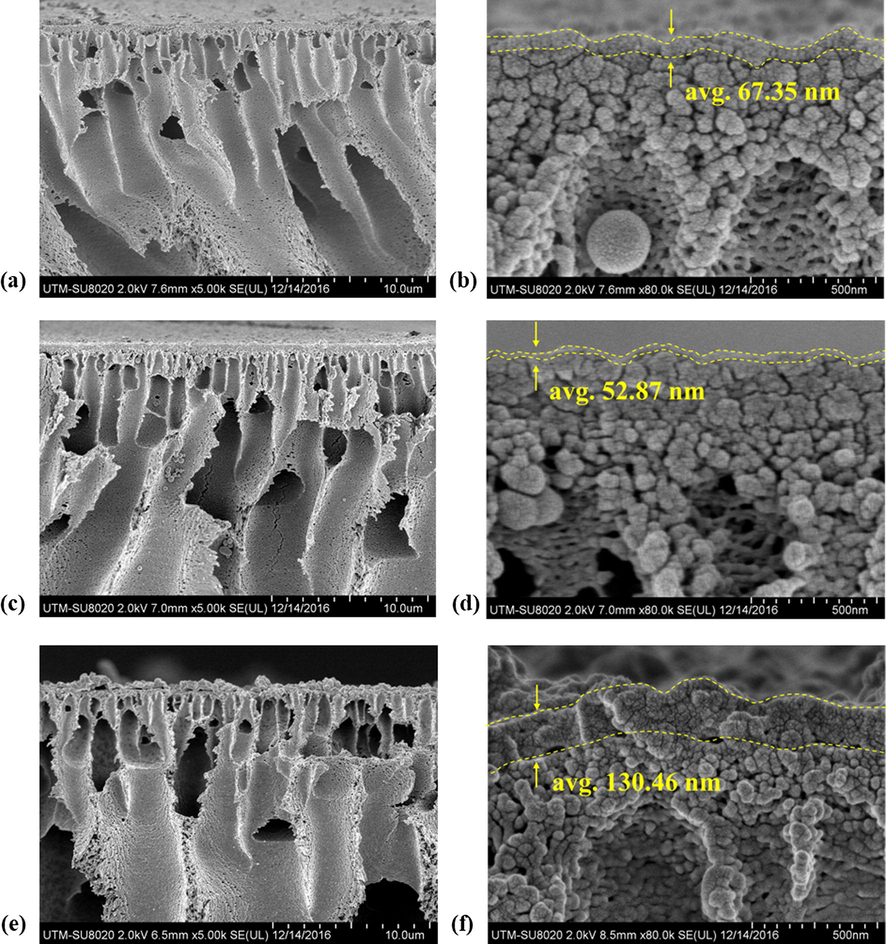
FESEM images of cross sectional of membranes (a and b) TFC, (c and d) TFC-f and (e and f) TFN-f 0.03 with the measured thickness of the PA layer.
The TFN-f 0.03 membrane on the other hand shows coarser nodular structures than those of other two membranes. The Ra parameter values obtained from AFM 3D images verify the statement, i.e., the surface of TFN-f 0.03 is rougher than those of TFC-f and TFC membrane. The roughest surface of TFN-f 0.03 membrane can be ascribed to the presence of GO layer on the substrate surface that is able to retain excess aqueous monomers in the hydrophilic and rough GO interlayer (Lai et al., 2016a). Because of the existence of higher amount of PIP available to cross-link with TMC, thicker and rougher PA surface is resulted as shown in Fig. 6. It is also likely that GO which acts as an interlayer causing larger reaction zone between PIP and TMC interface on the PSf substrate surface. Due to this reason, the PA growth is preferentially propagated down toward the substrate instead of laterally because of lower growth resistance (Zhang et al., 2012). This justifies the formation of thicker but porous PA layer with larger nodular structures as presented in Fig. 5(e) and (f).
3.3 Membrane surface chemistry
Table 2 summaries the PA layer properties of composite membrane with respect to atomic concentration (C, O and N), O/N ratio and cross-linking degree. The O/N ratio of TFC-f membrane is slightly higher compared to the TFC membrane, indicating the formation of PA layer with relatively lower cross-linking degree. Although the cross-linking degree of TFN-f membrane is determined to be lower than other two composite membranes, we can't rule out that the presence of GO (contains abundant amount of oxygen element) in the PA layer is likely to cause higher O/N ratio and affect the interpretation. To further compare the PA layer properties of each membrane, more discussion related to membrane filtration performance will be provided in Section 3.5.
Membrane
Atomic concentration (%)
O/N ratio
Degree of cross-linking (%)
C (1s)
O (1s)
N (1s)
TFC
73.71
14.06
12.23
1.150
79.12
TFC-f
73.79
14.19
12.01
1.182
75.06
TFN-f 0.03
73.49
14.86
11.65
1.276
63.57
3.4 Membrane surface hydrophilicity
Fig. 7 shows the water contact angle of TFC and TFN membranes made of different IP techniques as a function of time. As can be seen, both TFC and TFC-f membranes exhibit very similar trend of contact angle change. Their water contact angle decreases gradually from 46° to about 13° within 6 min. Meanwhile, the contact angle of TFN-f 0.03 membrane decreases drastically from 36° to 10° within 2.5 min. The significant change in the water contact angle of TFN-f 0.03 membrane indicated the higher degree of membrane surface hydrophilicity as a result of the incorporation of superhydrophilic GO nanosheets within the PA layer that draws water molecule at very fast rate.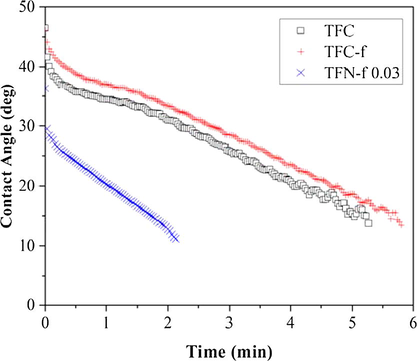
Contact angle of composite membranes against the time. A 0.5 µL of water droplet was dropped on the membrane surface and the change in water contact angle was recorded every second until the water droplet was disappeared from the surface.
3.5 NF performance of TFC and TFN membranes
Fig. 8 shows the filtration performance of composite membranes with respect to water permeability and salt rejection. The TFC-f membrane shows 72% higher PWP than that of TFC membrane owing to the formation of thinner PA selective layer using filtration IP technique. Reduced PA layer thickness would lead to lower water transport resistance, enhancing value of water permeability. When GO nanosheets are embedded within PA layer, the TFN-f 0.03 membrane demonstrates much higher PWP (4.13 L/m2·h·bar) than that of TFC (1.80 L/m2·h·bar) and TFC-f membrane (3.09 L/m2·h·bar), recording 129 and 34% flux enhancement, respectively. The enhanced membrane performance could be mainly attributed to the presence of hydrophilic oxidized region of GO that tends to draw water molecules at a faster rate through membrane matrix (Chae et al., 2015; Hegab and Zou, 2015; Hu and Mi, 2013). The non-oxidized region of GO meanwhile is also likely to provide nearly frictionless nanochannels (Fig. 9) to facilitate the flow of water molecules at a speed of magnitude faster than that occur through diffusion as reported elsewhere (Han et al., 2013; Joshi et al., 2014; Nair et al., 2012).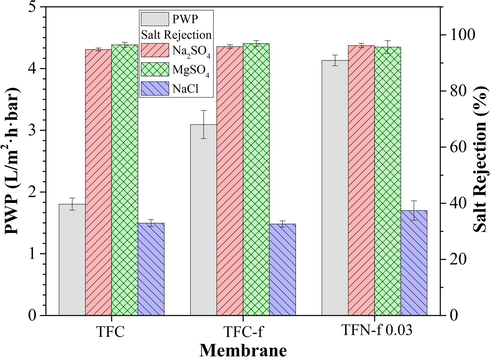
Pure water permeability and salt rejection of the composite membranes in filtering feed solution containing 1000 ppm single salt solution. Experiments were conducted at operating pressure of 8 bar and room temperature. All the membranes were subjected to 30-min compaction at 9 bar using RO water as feed solution prior to any filtration test.

Transport of water through the frictionless nanochannels in the TFN-f 0.03 membrane. PA layer acts as encapsulating layer to prevent GO nanosheets from detachment during filtration. (Note: Image not to scale).
The performance of the membranes is further evaluated by determining their rejection against monovalent and divalent salts. Overall, all the membranes are found to have high rejection towards MgSO4 and Na2SO4 (above 95%) and the rejection follows an order of R(MgSO4) ≈ R(Na2SO4) > R(NaCl). The high rejection rate against divalent ions can be explained by Donnan exclusion mechanism that normally takes place in the NF process (Bellona, 2014; Van der Bruggen et al., 2013). The negatively charged PA layer formed by the polymerization between PIP and TMC tends repel high-valent anion (SO42−) compared to monovalent anion (Cl−), leading to greater rejection of MgSO4 and Na2SO4. Further comparison indicates that the TFN-f 0.03 membrane could achieve higher NaCl rejection (37.4%) compared to TFC and TFC-f membranes (∼32%). This is likely due to the presence of GO layer between substrate and PA layers (Lai et al., 2016a). The nanochannels with size of 0.3–0.7 nm provide additional sieving effect for better separation capability to reject partially NaCl (hydrating radius Na+ and Cl− are 0.36 and 0.33 nm, respectively) (Mi, 2014; Schaep et al., 1998). Based on the findings, it can be said that the TFN-f 0.03 membrane made of filtration IP technique is more effective compared to conventional IP technique in improving membrane water permeability without compromising salt rejection. This modified approach shows huge potential to overcome membrane trade-off effect between water flux and salt rejection.
3.6 Membrane fouling behavior
From Fig. 10(a), it can be seen that both TFC and TFC-f membranes show higher degree of flux decline than that of TFN-f 0.03 membrane when BSA solution is used as the feed. Both membranes suffer 24.1% and 16.4% flux decline, respectively compared to only 1.1% shown by the TFN-f 0.03 membrane after completing 4-h filtration process. The TFN-f 0.03 membrane also demonstrates smaller degree of flux deterioration in comparison to other membranes when subjecting to dye filtration process as in Fig. 10(b). The filtration results are in good agreement with the direct observation on the membrane surface after filtration process. As shown in Fig. 11, the colour stained on the TFN-f 0.03 membrane surface is obviously less in comparison to the TFC and TFC-f membranes.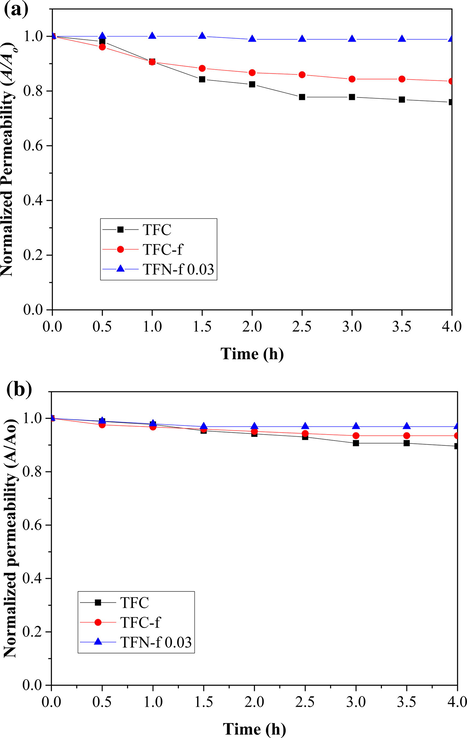
Normalized permeability of TFC, TFC-f and TNF-f 0.03 as a function of time using 500 ppm of (a) BSA and (b) RB5 as feed solution. Experiments were conducted at operating pressure of 8 bar and room temperature. All the membranes were subjected to 30-min compaction at 9 bar using RO water as feed solution prior to fouling test.
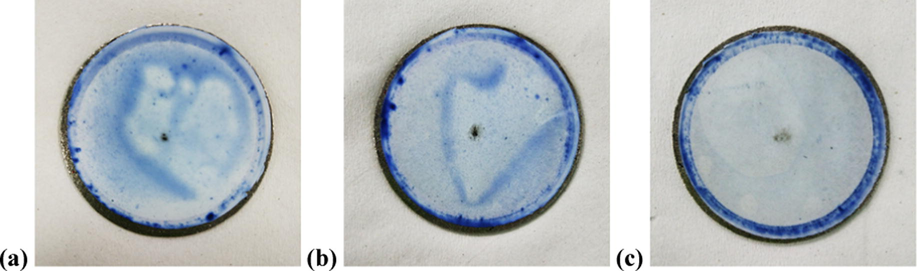
Top surface of (a) TFC, (b) TFC-f and (c) TFN-f 0.03 membranes after 4-h dye filtration process.
By comparing between the composite membranes without GO incorporation, the TFC-f membrane exhibits better antifouling resistance than the TFC membrane. Smoother PA layer of the TFC-f membrane is the main reason contributing to lower flux decline. Previous work has indicated that foulants are less likely to be entrained by smoother and more hydrophilic membrane topologies due to the hydration via hydrogen bonding (Hegab et al., 2015; Kang and Cao, 2012). The insignificant flux reduction of the TFN-f 0.03 membrane meanwhile could be greatly attributed to the existence of GO in PA layer that reduces the interaction between foulants and GO-PA nanocomposite surface, minimizing the deposition and/or adsorption of foulants. Compared to the GO-PA nanocomposite surface, the BSA is more likely to attach on the typical PA layer and adsorb onto it firmly, leading to build-up of water transport resistance within short period of filtration time (Bano et al., 2015; Hegab et al., 2015). The protein adsorption analysis also reveals that the TFN-f 0.03 shows remarkably lower protein adsorption capacity (0.56 g/m2) than that of TFC membrane (2.03 g/m2) (Table S1).
4 Conclusion
The potential of filtration IP technique was first demonstrated in this work to synthesize TFN membrane with improved separation characteristics. In comparison to the conventional IP technique, it is found that the filtration IP technique is very effective in ensuring the uniform distribution of GO nanosheets within the PA layer which leads to significant improvement of water flux of TFN membrane (TFN-f 0.03). This modified technique is also able to remove PIP solution from the substrate surface without interrupting GO nanosheets coating and further tackle the major weakness of rolling IP technique in removing PIP-nanomaterial solution. The incorporation of 0.03 g/m2 GO nanosheets in the PA layer of TFN-f 0.03 membrane had demonstrated the highest pure water permeability (4.13 L/m2·h·bar) compared to the TFC (1.80 L/m2·h·bar) and TFC-f membrane (3.09 L/m2·h·bar) owing to presence of hydrophilic GO. Most importantly, the rejection of TFN-f 0.03 membrane was not compromised as it showed comparable separation rate as other two membranes. Furthermore, the embedment of GO in PA layer had remarkably enhanced the antifouling resistance of the TFN-f 0.03 membrane against BSA and dye molecules. As a conclusion, it can be said that the filtration IP technique has a great potential to overcome the technical limitation of conventional IP technique in preparing TFN membrane by producing a novel NF membrane with high flux/high selectivity.
Acknowledgments
The first author is grateful for the financial sponsorship provided by MyBrain15 from the Malaysian Ministry of Higher Education (MoHE) during his study period. Financial support for this research was provided by the Universiti Teknologi Malaysia (UTM) under the UTMShine flagship program (Grant no: Q.J130000.2446.03G38) and MOHE under the AMTEC-HICOE project (Grant no.: R.J090301.7846.4 J174). Particular thanks to Ms. Norhazalina Binti Haliba, a science officer from the University Industries Research Laboratory (UIRL), UTM in conducting TEM analysis on the membrane samples.
References
- Membrane Technology. In: Encyclopedia of Polymer Science and Technology. John Wiley & Sons, Inc.; 2002.
- [CrossRef] [Google Scholar]
- Graphene oxide modified polyamide nanofiltration membrane with improved flux and antifouling properties. J. Mater. Chem. A. 2015;3:2065-2071.
- [Google Scholar]
- Graphene oxide-embedded thin-film composite reverse osmosis membrane with high flux, anti-biofouling, and chlorine resistance. J. Memb. Sci.. 2015;483:128-135.
- [CrossRef] [Google Scholar]
- An improved Hummers method for eco-friendly synthesis of graphene oxide. Carbon NY. 2013;64:225-229.
- [CrossRef] [Google Scholar]
- Chemical reduction of graphene oxide: a synthetic chemistry viewpoint. Chem. Soc. Rev.. 2014;43:291-312.
- [CrossRef] [Google Scholar]
- Nanofiltration process efficiency in water desalination. Sep. Purif. Rev.. 2008;37:303-325.
- [CrossRef] [Google Scholar]
- Synthesis and characterization of thin film nanocomposite forward osmosis membrane with hydrophilic nanocomposite support to reduce internal concentration polarization. J. Memb. Sci.. 2014;449:74-85.
- [Google Scholar]
- Nanofiltration extends the range of membrane filtration. Environ. Prog.. 1988;7:58-62.
- [Google Scholar]
- New insights into the structure and reduction of graphite oxide. Nat. Chem.. 2009;1:403-408.
- [CrossRef] [Google Scholar]
- Ultrathin graphene nanofiltration membrane for water purification. Adv. Funct. Mater.. 2013;23:3693-3700.
- [Google Scholar]
- Graphene oxide-assisted membranes: fabrication and potential applications in desalination and water purification. J. Memb. Sci.. 2015;484:95-106.
- [CrossRef] [Google Scholar]
- Improving the fouling resistance of brackish water membranes via surface modification with graphene oxide functionalized chitosan. Desalination. 2015;365:99-107.
- [Google Scholar]
- Enabling graphene oxide nanosheets as water separation membranes. Environ. Sci. Technol.. 2013;47:3715-3723.
- [CrossRef] [Google Scholar]
- Synthesis and characterization of polyamide/polyester thin-film nanocomposite membranes achieved by functionalized TiO 2 nanoparticles for water vapor separation. J. Mater. Chem. A. 2016;4:5592-5604.
- [Google Scholar]
- Precise and ultrafast molecular sieving through graphene oxide membranes. Science. 2014;343(80-):752-754.
- [CrossRef] [Google Scholar]
- Development of antifouling reverse osmosis membranes for water treatment: a review. Water Res.. 2012;46:584-600.
- [Google Scholar]
- A practical approach to synthesize polyamide thin film nanocomposite (TFN) membranes with improved separation properties for water/wastewater treatment. J. Mater. Chem. A. 2016;4:4134-4144.
- [CrossRef] [Google Scholar]
- Graphene oxide incorporated thin film nanocomposite nanofiltration membrane for enhanced salt removal performance. Desalination. 2016;387:14-24.
- [CrossRef] [Google Scholar]
- A recent progress in thin film composite membrane: a review. Desalination. 2012;287:190-199.
- [CrossRef] [Google Scholar]
- Nanofiltration Membranes: Synthesis, Characterization, and Applications. CRC Press; 2016.
- A review on polyamide thin film nanocomposite (TFN) membranes: History, applications, challenges and approaches. Water Res.. 2015;80:306-324.
- [CrossRef] [Google Scholar]
- Characterization methods of thin film composite nanofiltration membranes. Sep. Purif. Rev.. 2015;44:135-156.
- [CrossRef] [Google Scholar]
- A review on synthesis and properties of polymer functionalized graphene. Polymer (Guildf). 2013;54:5087-5103.
- [CrossRef] [Google Scholar]
- Polyamide thin-film nanofiltration membranes containing TiO2 nanoparticles. Desalination. 2008;219:48-56.
- [CrossRef] [Google Scholar]
- Silver nanoparticles immobilized on thin film composite polyamide membrane: characterization, nanofiltration, antifouling properties. Polym. Adv. Technol.. 2007;18:562-568.
- [CrossRef] [Google Scholar]
- Influence of silica nanospheres on the separation performance of thin film composite poly(piperazine-amide) nanofiltration membranes. Appl. Surf. Sci.. 2015;324:757-764.
- [CrossRef] [Google Scholar]
- Influence of zeolite crystal size on zeolite-polyamide thin film nanocomposite membranes. Langmuir. 2009;25:10139-10145.
- [CrossRef] [Google Scholar]
- Thin-film nanocomposite (TFN) membranes incorporated with super-hydrophilic metal-organic framework (MOF) UiO-66: toward enhancement of water flux and salt rejection. ACS Appl. Mater. Interfaces. 2017;9:7523-7534.
- [Google Scholar]
- Graphene oxide membranes for ionic and molecular sieving. Science. 2014;343(80):740-742.
- [Google Scholar]
- Formation of thin film composite nanofiltration membrane: effect of polysulfone substrate characteristics. Desalination. 2013;329:9-18.
- [CrossRef] [Google Scholar]
- Nanofiltration membranes review: recent advances and future prospects. Desalination. 2015;356:226-254.
- [CrossRef] [Google Scholar]
- Unimpeded permeation of water through helium-leak–tight graphene-based membranes. Science. 2012;335(80):442-444.
- [Google Scholar]
- Chapter 14. Graphene Oxide: Some New Insights into an Old Material. In: Carbon Nanotubes and Graphene (second ed.). Elsevier; 2014.
- [Google Scholar]
- Influence of ion size and charge in nanofiltration. Sep. Purif. Technol.. 1998;14:155-162.
- [CrossRef] [Google Scholar]
- Graphene oxide synthesized by using modified hummers approach. IJREEE. 2014;2:58-63.
- [Google Scholar]
- Synthesis and characterization of thin film composite membranes made of PSF-TiO2/GO nanocomposite substrate for forward osmosis applications. Arab. J. Chem.. 2018;11:1144-1153.
- [CrossRef] [Google Scholar]
- Graphene oxide and reduced graphene oxide studied by the XRD, TEM and electron spectroscopy methods. J. Electron Spectros. Relat. Phenomena. 2014;195:145-154.
- [CrossRef] [Google Scholar]
- Nanofiltration. In: Encyclopedia of Membrane Science and Technology. John Wiley & Sons, Inc.; 2013.
- [CrossRef] [Google Scholar]
- Layer-by-layer fabrication of high-performance polyamide/ZIF-8 nanocomposite membrane for nanofiltration applications. ACS Appl. Mater. Interfaces. 2015;7:24082-24093.
- [Google Scholar]
- Effect of the manufacturing conditions on the structure and performance of thin-film composite membranes. J. Appl. Polym. Sci.. 2012;125:3755-3769.
- [Google Scholar]
- Graphene oxide quantum dots incorporated into a thin film nanocomposite membrane with high flux and antifouling properties for low-pressure nanofiltration. ACS Appl. Mater. Interfaces. 2017;9:11082-11094.
- [Google Scholar]
- Layer-by-layer construction of graphene oxide (GO) framework composite membranes for highly efficient heavy metal removal. J. Memb. Sci.. 2016;515:230-237.
- [CrossRef] [Google Scholar]
- Effect of graphene oxide concentration on the morphologies and antifouling properties of PVDF ultrafiltration membranes. J. Environ. Chem. Eng.. 2013;1:349-354.
- [Google Scholar]
- Zwitterionic carbon nanotube assisted thin-film nanocomposite membrane with excellent efficiency for separation of mono/divalent ions from brackish water. J. Mater. Chem. A.. 2017;5:13730-13739.
- [Google Scholar]
Appendix A
Supplementary material
Supplementary data associated with this article can be found, in the online version, at https://doi.org/10.1016/j.arabjc.2017.12.009.
Appendix A
Supplementary material
Supplementary data 1
Supplementary data 1


