

Translate this page into:
Iodinated carbon materials for oxygen reduction reaction in proton exchange membrane fuel cell. Scalable synthesis and electrochemical performances
⁎Corresponding author. Fax: +250 732746. adriana.marinoiu@icsi.ro (A. Marinoiu)
-
Received: ,
Accepted: ,
This article was originally published by Elsevier and was migrated to Scientific Scholar after the change of Publisher.
Peer review under responsibility of King Saud University.
Abstract
Doped graphene-based cathode catalysts are considered as promising competitors for ORR, but their power density has been low compared to Pt-based cathodes, mainly due to poor mass-transport properties. A new electrocatalyst for PEMFCs, an iodine doped grahene was prepared, characterized, and tested and the results are presented in this paper. We report a hybrid derived electrocatalyst with increased electrochemical active area and enhanced mass-transport properties. The electrochemical performances of several configurations were tested and compared with a typical Pt/C cathode configuration. As a standalone catalyst, the iodine doped graphene gives a performance with 60% lower than if it is placed between gas diffusion layer and catalyst layer. If it is included as microporous layer, the electrochemical performances of the fuel cell are with 15% bigger in terms of power density than the typical fuel cell with the same Pt/C loading, proving the beneficial effect of the iodine doped graphene for the fuel cell in the ohmic and mass transfer region. Moreover, the hybrid cathode manufactured by commercial Pt/C together with the material with best proprieties, is tested in a H2-Air fuel cell and a power density of 0.55 W cm−2 at 0.52 V was obtained, which is superior to that of a commercial Pt-based cathode tested under identical conditions (0.46 W cm−2).
Keywords
Iodine doped graphene
Catalyst
Fuel cell
Nucleophilic substitution
Electrophilic substitution

1 Introduction
Polymer electrolyte membrane fuel cells (PEMFC) exhibit good energy efficiency and high power density per volume (Ahluwalia and Wang, 2008; Stumper and Stone, 2008; Yousfi-Steiner et al., 2008). The high costs mainly due to the presence of noble metal catalysts limit the large-scale marketing. Currently, the most promising electrocatalyst is still precious platinum supported on carbon (Pt/C), because of the reliable electrochemical performance (He et al., 2005; Holton and Stevenson, 2013; Secanell et al., 2008; Vielstich et al., 2003). The membrane electrode assemblies’ (MEAs) fabrication costs can be reduced through several approaches. However, one of the bottlenecks for large-scale applications of FC is the sluggish oxygen reduction reaction (ORR) at the cathode side. Up until the present day, expensive and rare Pt and its alloys have been taken into account as the most confident cathodic ORR electrocatalysts in FC. Besides the high cost, Pt base catalysts also suffer from carbon monoxide (CO) and sulfur (S) poisoning effect and poor operation stability. Therefore, it is essential to identify non-precious metals or metal-free electrocatalysts possessing a high catalytic activity and longtime steadiness operation, in order to reduce/replace Pt electrocatalysts.
The development of a new class of materials with low-cost, high-efficiency for ORR and good durability is required to recognize fuel cells as one of the most promising energy sources (Choi et al., 2012; Ren et al., 2016; Sun et al., 2013). Exploring the substitutes for Pt catalysts by employing non-precious metal catalysts is a very promising direction. In this regard, one-dimensional (1D) carbon nanotubes (CNTs) and two-dimensional (2D) graphene have attracted a great mindfulness for ORR due to their excellent electronic conductivity. Graphene and its related materials are chemically stable and exhibit high electrical and thermal conductivity, high surface area and excellent mechanical proprieties. In the field of FC, graphene is probably the most promising material as support/catalyst due to its remarkably proprieties (Ban and Majid, 2012; Kakaei and Zhiani, 2013; Marinoiu et al., 2015).
In the last years, graphene-nanocomposites have attracted an intense interest as functional components for fuel cells (Ji et al., 2015; Wang, 2005; Wang et al., 2011; Zhang et al., 2014). According to this trend, the electrochemical performance of carbon support could be improved by introducing of specific elements, which favors the developing of surface functional groups or providing important physicochemical modification. An effective strategy to increase the electrocatalytic performances of graphene base materials is to chemically dope the materials (Li et al., 2011; Shan et al., 2016; Sheng et al., 2011; Xiong et al., 2016). One simple method to accomplish this is to introduce a doping precursor gas during a high temperature thermal treatment step. In one instance, nitrogen and boron doping was successfully achieved using ammonia and boron trichloride, as precursor molecules (Aliofkhazraei et al., 2016). Chemical doping of graphene with varied elements offers a proper solution to modify its electronic proprieties. However, the main attempts were focused on nitrogen or boron doped graphene and less on halogenated graphenes (fluorinated, brominated graphene) (Fazio et al., 2014; Kraszkiewicz et al., 2006; Qu et al., 2010; Shui et al., 2015; Xu et al., 2014). According to theoretical predictions the iodinated graphenes could be the most interesting materials for ORR (Jeon et al., 2013; Poh et al., 2013; Sheng et al., 2011; Zhan et al., 2015). Moreover, iodine-doped graphene can exhibit a high catalytic activity, long-term stability, and an excellent methanol tolerance for the ORR. Nowadays, the developing of graphene-iodine catalyst is more affordable, by far, than platinum-based fuel cell catalysts and more easily to be obtained. In spite of these, there are only few papers reporting the preparation of iodine-based graphene, mainly by chemical vapor deposition (CVD). Also, the covalent bonding of iodine to the carbon framework was confirmed mostly on carbon nanotubes, while the intercalated and physisorbed iodine species were assigned to p-type electrical doping of graphene (Lau et al., 2008; Lee et al., 2006; Serp et al., 2003).
Quantum mechanics calculations have already demonstrated that the electron accepting/donating ability of the heteroatom dopants could create net positive/negative charges on adjacent carbon atoms in graphitic lattice and therefore facilitates the ORR process (Peng et al., 2013). Notwithstanding the basic catalytic mechanism that has been already established, the full output of carbon based metal free catalysts is difficult to obtain without taking into account the large-scale production at low cost. It's worth to mention that the common affordable routes such as chemical vapor deposition (CVD) and/or Hummer's method for graphene materials production are too expensive, and involve environmental hazard reagents, making those improper techniques for large-scale production. Furthermore, the physical-chemical proprieties of iodine doped graphene, such as chemical state and reaction conditions have not been intensively investigated even though they are critical parameters for a successful developing of graphene based electrodes in industrial application.
Our recently experimental results regarding the successful preparation of graphene and graphene nanocomposites, by a low cost and simple route, as a scalable synthesis enable the use of developed protocol (Marinoiu et al., 2016) for the manufacture of electrodes for FC. Based on some remarkable obtained results (several layers, surface area more than 700 m2 g−1), the actual study intends to implement the synthesis protocol in a new concept of ORR electrodes fabrication. In this context we present several scalable methods for preparation of iodine doped graphene in order to study the possibility of their use as cathode catalyst in PEMFC. In order to provide new insights and practical method for designing a high performance metal-free ORR catalyst by a scalable technique, the electrical and electrochemical performances were tested and compared with a typical PEMFC configuration.
2 Experimental
2.1 Catalyst preparation
Different methods were used for preparation of iodine doped graphene materials (GrI). Starting from graphite, going through several steps, namely the oxidation to graphite oxide (GO), the GO exfoliation to graphene oxide (GrO), the reduction of GrO, the separation of elemental iodine, different samples GrI 1 and GrI 2 were obtained. The nucleophilic substitution of GrO using HI as reduction agent via a non-catalyzed reaction (for GrI 1 preparation) and respectively by a catalyzed reaction (using AlI3 catalyst for GrI 2 preparation) was carried out. Starting from two varieties of commercial graphene, passing over a direct iodination method by electrophilic substitution, different doped graphene samples were obtained (GrI 3 and GrI 4).
In the pre-oxidation step, the graphite powder was mixed with conc. H2SO4 (35 mL), 4 g P2O5 and 4 g K2S2O8 at 80 °C, under stirring. The washed solid was separated and dried to constant weight in air at 60 °C. In the oxidation step, the GO is mixed with 300 mL H2SO4 95 wt.% and 35 g P2O5 (strong exothermic effect). Then 30 g of KMnO4 was slowly added into the flask while maintaining vigorous stirring and the temperature was kept below 10 °C. The mixture was stirred at 45 °C until it became pasty brownish, and it was then diluted using de-ionized (DI) water. 30 mL H2O2 (30 wt.%) solution was slowly poured into the mixture, after which the color of the mixture changed to bright yellow. The mixture was centrifuged, and then the pellet was resuspended and washed with a 1:10 HCl aqueous solution in order to remove residual metal ions. The resulting precipitate was washed repeatedly with DI water until a neutral pH was observed. The GO solution was homogenized by stirring for 1 h using an IKA Ultraturrax T 25, and then is ultrasonic pulsed for 4 h at 110 W/40 kHz and max. 40 °C with an ultrasound bath ELMA T 490DH model. Graphene oxide (GrO) 3.4 g l−1 is obtained. In order to reduce GrO to graphene and to dope it with iodine, by nucleophilic substitution, approx. 145 g HI 55 wt.% is added in 3 h at 80–85 °C at GrO solution. The reaction mass was cooled and separated by centrifugation, which is the only applicable separation method and then the separated solid was washed. Although the third wash test for SO42− is negative, the solution is still acidic pH (approx. 3.0) and the test for X− is positive due to the HI presence. The separated solid is brought to constant weight at 50 °C in a vacuum desiccator placed in an oven (approx. 7 h). After grinding to a powdery form, a black product is obtained. The elemental iodine is separated by repeated extraction with acetone using a cartridge paper and a Soxhlet extractor, until extract is colorless. After drying to constant weight (loss mass is approx. 31%) at 50 °C, iodine doped graphene GrI 1 was obtained. For GrI 2 preparation, the entire protocol was carried out, excepting the reduction step. In this case, HI 55 wt.% is added in 3 h at 80–85 °C, together with a solution containing AlI3 (a recommended catalyst for introducing iodine into the structure by nucleophilic substitution).
Commercial graphene is iodinated by the direct method of electrophilic substitution, using the system KI/NaIO4 at the molar ratio I+/Gr = 1. For this purpose, H2SO4 min. 95 wt.% was introduced at room temperature, in a round 5-neck round flask of 1000 mL, thermostated in glycerin bath and equipped with mechanical stirrer with tight guide KPG, thermometer, air-cooled reflux condenser and drying tube. Small portions of NaIO4 and finely milled KI are inserted under continuously stirring. The mixture is stirred 30 min at max. 35 °C. Then 2 g commercial graphene (type XG Graphene Nanoplatelets Science, grade M, specific surface area 105 m2 g−1) is added to the reaction mass and stirred for 24 h at 30–35 °C. The reaction mass is stirred gently, transferred into a beaker of 3000 mL and cooled externally with ice. The obtained solid is washed, separated by settling and filtration, and dried at 50 °C and 0.5 ata in a vacuum desiccator to constant weight (it takes several days due to high elementary iodine content). The obtained solid is separated from elemental iodine by repeated extraction with acetone using a cartridge paper in a Soxhlet extractor, until the extract is colorless. After drying to constant mass at 50 °C iodine doped sample GrI 3 was obtained. The same protocol was followed for GrI 4 synthesis except that the starting raw material was single layer graphene powder (specific surface area 750 m2 g−1, ACS Material, USA).
2.2 Catalyst characterization
The structure, morphology and properties were characterized during different preparation steps using XRF, Scanning Electron Microscopy (SEM), Raman investigation, XPS analysis, and BET method. The XRF data were analyzed using EZ-scan combined with Rigaku’s SQX fundamental parameters software (standard less) which is capable of automatically correcting for all matrix effects, including line overlaps. The Rigaku ZSX Primus II spectrometer is equipped with an X-ray tube with Rh anode, 4.0 kW power, with front Be window of 30 μm thickness. The measurements were performed onto pressed pellets under vacuum. All spectra were recorded from 48 to 2895 cm−1 Raman Shift, at room temperature, using a NRS-5100 Raman micro-spectrometer (Jasco Analytical Instruments, Japan) with laser power 6.1 mW of 532.11 nm line of a SOC (Showa Optronics Co. Ltd, Japan) frequency-doubled Nd:YAG for excitation. Fourier transform infrared (FT-IR) spectra were recorded in this study on a NICOLET IMPACT 410 Fourier Transform Infrared spectrophotometer.
The specific surface areas of the samples were determined using the BET method by performing nitrogen sorption measurements using a Quantachrome Autosorb IQ equipment. The adsorption and desorption experiments were done at 77 K after initial pre-treatment of the samples by degassing at 115 °C for 4 h.
2.3 Catalyst evaluation by electrochemical performance
A single cell system with an active area of 5 cm2 from ElectroChem was used for electrical and electrochemical performances to test the prepared catalysts. Four configurations for PEMFCs were assembled and tested. Several steps have been carried out for manufacturing each PEMFC. First, a catalytic ink containing catalyst was prepared by ultrasonically mixing of catalyst powder, isopropanol, 5 wt.% Nafion ionomer solution (Dupont, USA) for 2 h. The ink was afterward sprayed (using SonoTek, USA) on each side of the pretreated membrane (Nafion Dupont, USA). 0.2 mg cm−2 Pt loading was used for all anode sides of the fuel cell developed, based on a commercial Hispec 4000 Pt/C catalyst (Alfa Aesar, USA). The cathode catalyst layer was modified taking into account different Pt and iodine loadings, resulting in 4 configurations, described in detail in the next section. The Pt/C raw material used for cathode catalyst was also Hispec 4000. The catalyst coated membrane method was used for developing the MEA. Next, the prepared MEA and GDL layers from both sides (anode-cathode) were pressed at 300 kgf, 125 °C for 2 min, and then were assembled in a single 5 cm2 cell system. Fuel cell polarization plots and ORR performances were recorded using a homemade test station, which includes electrochemical workstation, fuel cell (ElectroChem, USA), DS electronic load (AMETEK Sorensen SLH 60V/120A 600 W), and humidifier (ARBIN DPHS 10, USA). H2 and air were used as fuel and oxidant and the following operating conditions were used: H2 flow rate: 100 mL min−1, O2 flow rate: 300 mL min−1, fully humidified reactants, temperature in the range 60–80 °C, 1 bar pressure. The flow rates of reactants gases were adjusted using flow controllers (Alicat Scientific, USA) calibrated before experiments. Bubble-type humidifier was installed as external gas humidification systems. The RH of the reactants was set by adjusting the temperature of humidifier and the operating temperature of FC. During experiments the RH values were verified using a dew point hygrometer (Vaisala, HMT 310, Finland). Temperature and pressures were also measured using thermocouples K-type and pressure transmitters (PN 3004, IFM, Germany). The electrochemical impedance spectroscopy (EIS) experiments were performed with PARSTAT® (Princeton Applied Research, USA) advanced electrochemical workstation equipped with EIS testing instrument PMC 2000A and measurement software VersaStudio. The EIS tests were recorded in a frequency range from 20 kHz to 50 mHz at the 10 points per decade in galvanostatic mode, using an AC signal of amplitude 200 mA.
3 Results and discussion
Iodine-doped graphene has been successfully obtained by a simple and cost-effective synthetic strategy. The characterization of the materials was first performed by elemental analysis, determined by wavelength dispersive X-ray fluorescence (WDXRF) spectroscopy method. Elemental composition, including carbon, oxygen and iodine is presented in Table 1. Due to the differences in the reaction mechanism of iodination (using elemental iodine or hydroiodic acid), different concentrations were obtained.
Element
Result (mass%)
Det. Limit
El. Line
Intensity
GrI 1
GrI 2
GrI 3
GrI 4
C
74.5415
72.7685
84.2357
73.2895
0.30351
C -KA
14.4556
O
24.2411
25.6247
13.2159
26.7026
1.39174
O -KA
0.3569
I
0.3308
0.0994
0.6892
0.0789
0.00691
I -KA
15.3304
The scanning electron microscopy SEM was carried out in order to determine the effect of the reaction conditions on the morphology of iodine doped graphene (Fig. 1). In the case of iodinated graphenes obtained by electrophilic substitution of commercial graphene (GrI 3 and GrI4), a typical layered structure appeared, usually observable in graphite oxide and partially reduced graphene. As regards the prepared materials by reduction in graphite with HI via non-catalyzed reaction and by reduction in graphite using HI catalyzed by AlI3 (GrI 1 and GrI 2), a more wrinkled structure appeared, which is a typical morphology for the chemically reduced graphite oxide. However, all the micrographs of prepared iodine-doped graphene, reveal the fact that reaction conditions were proper in the sense of producing of partially expholiated iodine doped graphenes and tend to exhibit a very rough surface structure. As can be seen, the flakes built a very good connected network which is crucial for the electronic transport for fuel cell applications.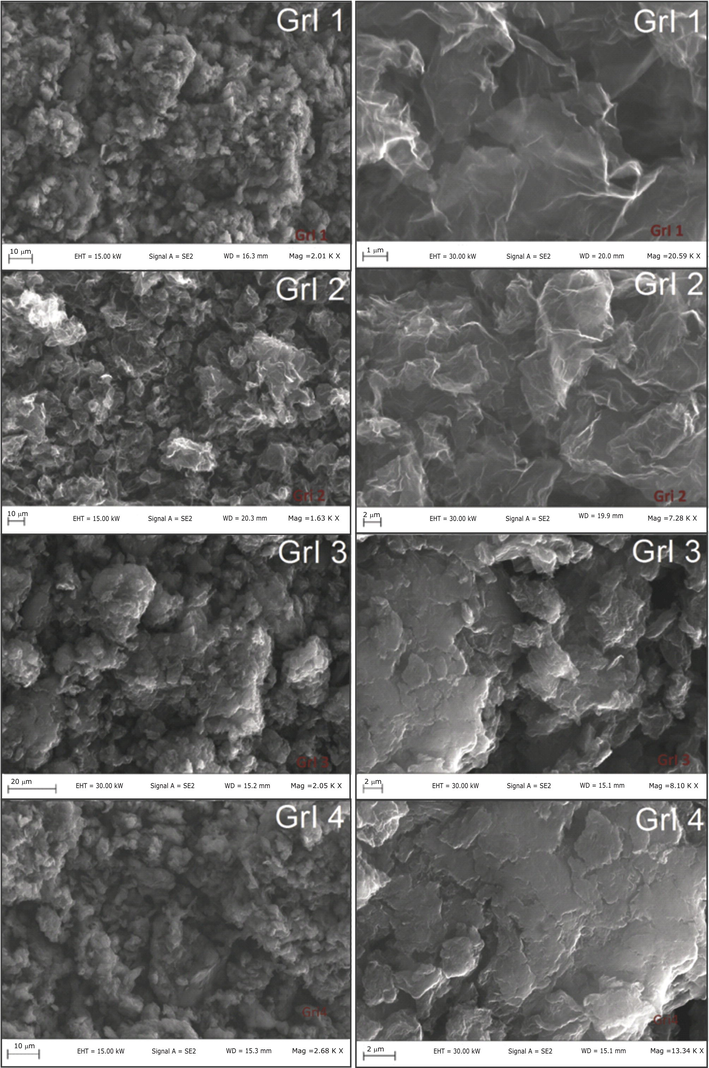
SEM analysis of the prepared iodine doped graphene nanocomposite.
High-resolution transmission electron microscopy (HRTEM) reveals that multi-layer iodine-doped graphene sheets were obtained. The images were obtained with different detectors: SE (secondary electrons) and ZC (phase contrast) and TE (transmission electrons) in the same place. In principle, we couldn’t identify directly the exact number of layers on flat iodine doped graphene by HRTEM for all prepared catalysts, maybe because of existence of multi layer sheets, which made difficult a cross-sectional view of the sheet. However, the clearest images were obtained for GrI3 sample (Fig. 2). Electron diffraction (ED) on the doped graphene sheet illustrates one set of hexagonal diffraction spots confirming the threefold symmetry of the arrangement of carbon atoms. The well-defined diffraction spots in the ED patterns confirm the crystalline structure of the iodinated graphene. Therefore, graphene used in this work might contain one- to few-layer sheets. The symmetry characterization implies that in spite of the iodine-heteroatom incorporation in the hexagonal carbon network, the doped graphene sheets are still ordered in crystalline structures. For the EDAX analysis was used two instruments STEM/EDAX and STEM/EDX analysis (in 2 areas). Elemental mapping analysis was performed in the secondary electron image in order to highlight the presence and dispersion of main elements, namely carbon and iodine as uniform spread.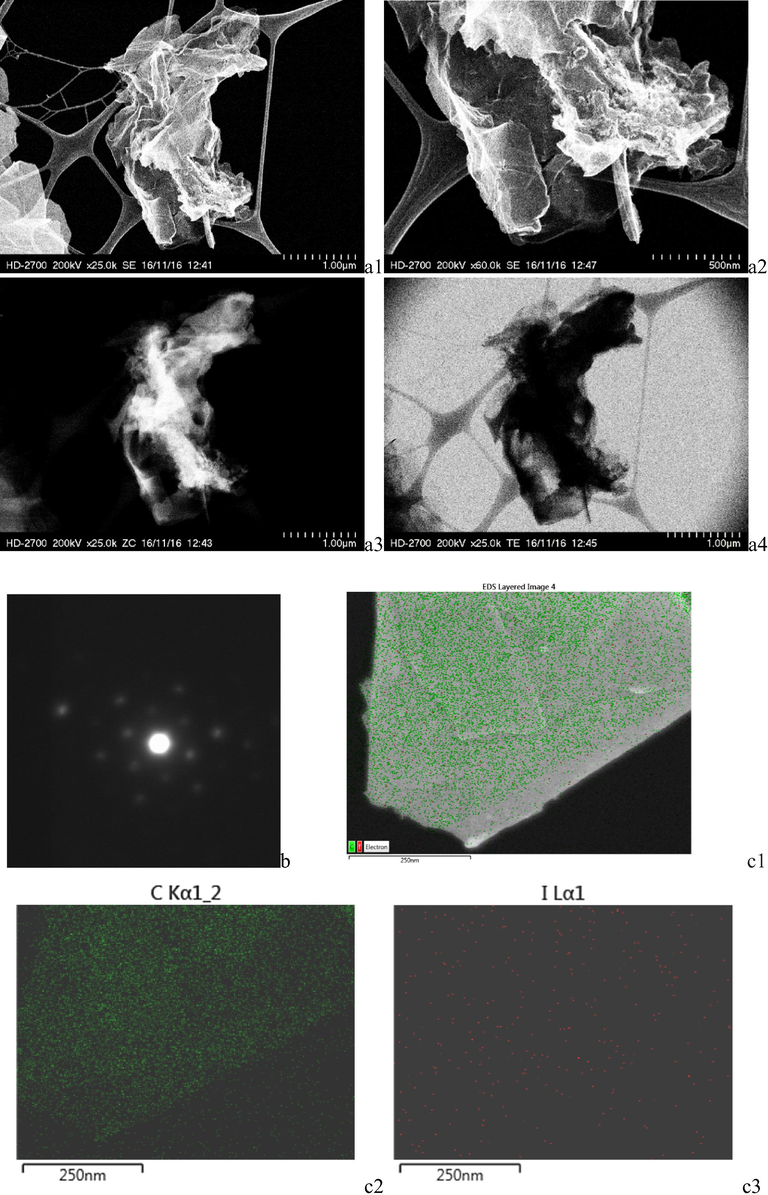
HRTEM images of iodine doped graphene GrI 3, showing multi layers, a1–a4; electron diffraction showing crystalline structure feature of iodine-doped graphene, b; elemental mapping, c1–c3.
Fig. 3 presents the FT-IR spectra for prepared GrI samples and illustrates the corresponding bands, as follows: a stretching vibration peak of C—I is observed at 725 cm−1; a broad signal including the peaks at 1100 and 1250 cm−1 is originated from the remaining oxygen functionalities; vibration band of the carbon atoms of the graphene layer is observed at 1590 cm−1; stretching vibration peaks of C⚌C (aromatic) and C—O are observed at 1611 cm−1 and 1723 cm−1, respectively; a signal including the peaks of 2850 and 2920 cm−1 is attributed to the C—H deformation vibration; also, the contribution from the remaining hydroxil groups is located at 3650 cm−1. However, the most interesting case is the peak at 725 cm−1 which is attributed to the C—I stretching vibration, this peak being specific to all GrI samples. It is easily noticed that this peak is absent in pristine graphene.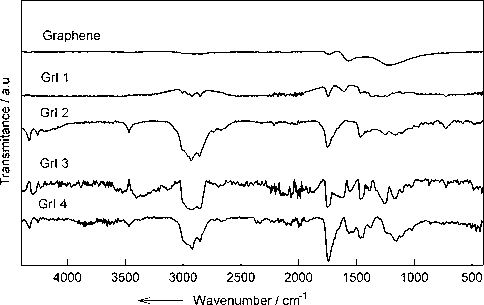
FT-IR spectra for prepared GrI samples.
Important structural information of iodine-doped graphenes, such as the density of defects, can be determined by Raman spectroscopic measurements. Raman spectra of iodine-doped graphene show characteristic peaks of graphene materials namely D, G and 2D. The presence of defects is indicated by the appearance of a D band which is attributed to the sp3-hybridized carbon atoms in the network, at approximately 1342 cm−1 for GrI 1 and GrI 2 while the same peak is up-shifted in the spectrum of GrI 3 and weakly down-shifted for GrI 4. Pristine sp2 lattice carbon atoms in the network appear as a G band at approximately 1591 cm−1, for GrI 1 and GrI 2 while the same band is down-shifted in the spectra of GrI 3 and GrI 4 (Fig. 4). The intensity of these bands is also useful to evaluate the crystalline size of sp2 lattice of the various samples (Caņado et al., 2006), that indicate the best crystalline structure with minimum defects for GrI3.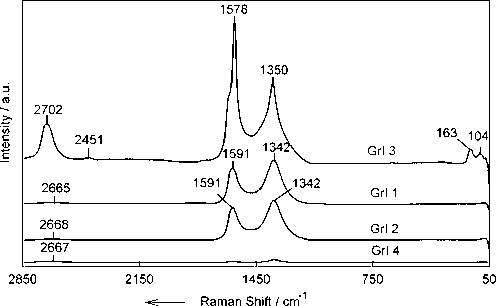
Raman spectra of iodine-doped graphenes at λ = 514 nm from 50 to 2850 cm−1 Raman shift.
Moreover, the 2D peak in bulk graphite consists of two components 2D1 and 2D2, (Caņado et al., 2006; Nemanich and Solin, 1979) roughly 1/4 and 1/2 the height of the G peak, respectively. Graphene has a single, sharp 2D peak, roughly four times more intense than the G peak (Ferrari et al., 2006; Vidano et al., 1981). Accordingly, the evidence of 2D1 component, the broadening and up-shifting over 2700 cm−1, of the 2D peak, suggest that GrI 3 consists of few-layers. Also, no evidence for the presence of elemental iodine, namely a band around 185 cm−1 was identified.
The sharper and more intense 2D peak of GrI 3 is certainly due to the pristine material used for its synthesis, The Raman spectrum of this interesting material corresponds more to the exfoliated graphite. Indeed, Figure, comparing the Raman spectra of the two starting materials used for the synthesis of GrI 3 and GrI 4, reveals a more extensive sp2 lattice (increased G/D band ratio).
It is of great interest to note that GrI 3 was found to possess two additional peaks at approximately 104 and 163 cm−1 that are absent in the Raman spectra of GrI 1, 2 and 4 (Fig. 5a). Furthermore, Fig. 5b shows that these signals are not due to the pristine material (labeled graphene). The presence of I3− in the material leads to the appearance of the peak at 104 cm−1 and the presence of I5− gives rise to the peak at 163 cm−1 (Jung et al., 2009; Kalita et al., 2011; Sheng et al., 2011; Wang et al., 1992; Zeng and Ko, 1997). The appearance of these peaks indicates the successful incorporation of iodine atoms into the GrI 3 sample during the electrophilic substitution of commercial graphene. The increased intensity of 2D peak of GrI 3 Raman spectra with respect to its precursor (Fig. 5c) also indicates that a successful electrophilic substitution produces an exfoliating process. The latter aspect is confirmed by Fig. 5d where it is evident that the increasing intensity of 2D peak also occurs during the production of GrI 4 but the high surface area of the starting material probably does not allow the same iodine functionalization grade of GrI 3. This could be an indication of a restored graphene structure which occurs when a graphene with high surface area is the raw material (Fig. 6).
Raman spectra of GrI 3 indicates the presence of I3− and I5− (a); Raman spectra comparison between: SL graphene and XGrP graphene as starting material (b); GrI 3 and XGrP graphene as starting material (c) and GrI 4 and SL graphene as starting material (d).
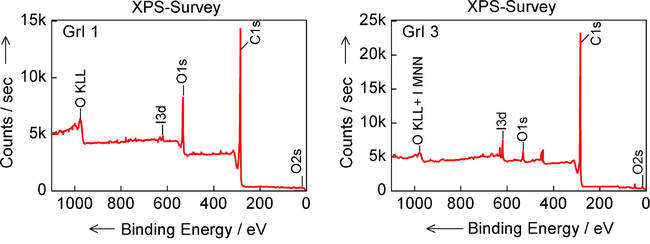
XPS general spectra of iodinated graphenes samples GrI 1 and GrI 3.
The existence of iodine substitution in the graphene lattices is confirmed by X-ray photoelectron spectroscopy. High-resolution XPS was also used to determine the chemical composition of the surface of the iodinated graphenes. The general spectra reveal in Figure the existing elements on the surface of the samples, namely carbon, oxygen and iodine. Depending on the synthesis method, iodine has a different doping amount (Table 2). XPS survey spectra for representative sample (highest iodine content) prepared by nucleophilic substitution and by electrophilic substitution are shown separately below.
Sample
C1s
O1s
I3d5/2
GrI 1
84.11
15.68
0.21
GrI 2
81.21
18.72
0.07
GrI 3
93.53
5.77
0.7
GrI 4
79.86
20.09
0.05
To further explore the chemical states involved, Fig. 7 shows the deconvoluted spectra of carbon for both samples. sp2, sp3 features and OH—C—O, O—C⚌O chemical bondings occur. The XPS survey spectra are presented below, where I 3d, C 1s and O 1s and I peaks are obtained. The C1s peak was found at 284.5 eV binding energy, the O1s at 533 eV and the I3d at 619.5 eV. Concentrations for C, O and I, determined by using the obtained XPS spectra, were in a good agreement with elemental analysis by X-ray fluorescence spectroscopy as regards the iodine concentrations, but were not in agreement concerning the C and O concentrations. The explanations are may be due to the high surface sensitivity of XPS, when the amounts of C and O can be different compared to the bulk.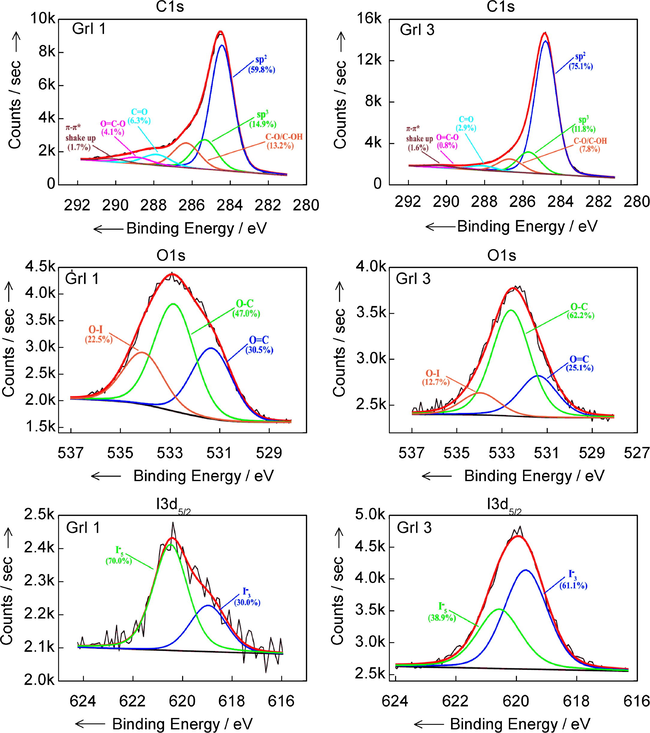
XPS deconvoluted spectra of C1s, O1s and I 3d peaks.
The noisy I3d5/2 XPS deconvoluted spectrum shows I−3 (triodide) and I−5 (pentaiodide). These findings suggest that iodine atoms are successfully incorporated into graphene network and the I−3 and I−5 appear on its surface.
The BET surface areas for obtained samples were obtained from the nitrogen adsorption–desorption isotherm (supplementary material). The isotherms were similar exhibiting a typical type IV curve at low relative pressure and a hysteresis loop at relative pressure from 0.4, indicating the presence of microporosity, mesoporosity, and some macroporosity. The BET surface area was estimated of 410 m2 g−1 (corresponding to GrI1), 480 m2 g−1 (GrI2), 70 m2 g−1 (GrI3) and respectively 440 m2 g−1 (GrI4). These results clearly show a lower specific surface area, comparatively to our results obtained in the case of graphene sheets (795 m2 g−1) or to surface area of commercial starting graphene (XGrN Science with 105 m2 g−1 used for GrI3 preparation and ACS Material type with 750 m2 g−1 used for GrI4). The explanation is that obtained values correspond to an agglomerated morphology of the few layer doped graphene sheets for GrI1, GrI2 and GrI4 and to the exfoliated graphite in case GrI3.
A single cell system with an active area of 5 cm2 was used for testing the fuel cell developed. Four configurations for PEMFCs were assembled and tested. The same anode catalyst (Hispec 4000 Pt/C catalyst, 0.2 mg cm−2 Pt loading) was used for all fuel cells developed. In the cathode side, the configurations used are based on different Pt and iodine loadings, resulting in four cases: (1): 0.4 mg cm−2 Pt loading sprayed on membrane, (2) 0.2 mg cm−2 Pt loading sprayed on membrane; (3) 0.2 mg cm−2 iodine loading sprayed on membrane and (4) 0.2 mg cm−2 Pt loadings sprayed on membrane + 0.2 mg/c cm−2 iodine loading sprayed on gas diffusion layer (GDL). The iodine doped graphene used in the above configurations is the GrI3 sample, the material with the best crystalline structure and higher iodine content obtained in our research. The components, including serpentine flow fields machined into the graphite bipolar plates, were set up in a cross-flow configuration and sandwiched together.
The electrochemical performances of the PEMFCs developed were measured and compared using a polarization curve, as can be seen in Fig. 8. The comparative performances presented reveal an obvious fact that a higher platinum loading on a supported carbon will lead to a better current density. Because the platinum loading must be minimized we have taken into consideration the 0.2 mg cm−2 Pt/C catalyst (CASE 2) and we modified the structure of the fuel cell by adding 0.2% iodine doped graphene to the GDL (CASE 4). This layer seems to act as a micro-porous layer, improving the performance in the ohmic and mass transfer region. This improvement is attributed to the better electrical contacts established and maybe to the creation of additional pathways for water removal, which reduces flooding and improves oxygen access to the reaction sites (Kandlikar et al., 2011; Kang and Ju, 2009; Nam et al., 2009). But if it is considered alone (CASE 3), as catalyst, it does not give a very good performance, having an abrupt decrease starting from the activation region due to activation of electrochemical reaction between surface areas of iodine doped graphene catalyst with hydrogen gas. It can be noticed that the OCV of the CASE 3 is 1.1V which is much higher than the other cases: 0.959 V for the CASE 1, 0.929 V for the CASE 2 and 0.938 V for the CASE 4. The maximum power density (Figure) obtained is 0.606 W cm−2 at 0.52 V in the CASE 1, 0.468 W cm−2 at 0.48 V in the CASE 2, 0.217 W cm−2 at 0.45 V in the CASE 3 and 0.551 W cm−2 at 0.52 V in the CASE 4. We have to mention that we established 0.2 mg cm−2Pt/C as reference value, based on recommended value for 2015 technical target for reduction in the total Pt group metal (PGM) loading, by the US Department of Energy (DOE) established (Vojislav and Markovic, 2015).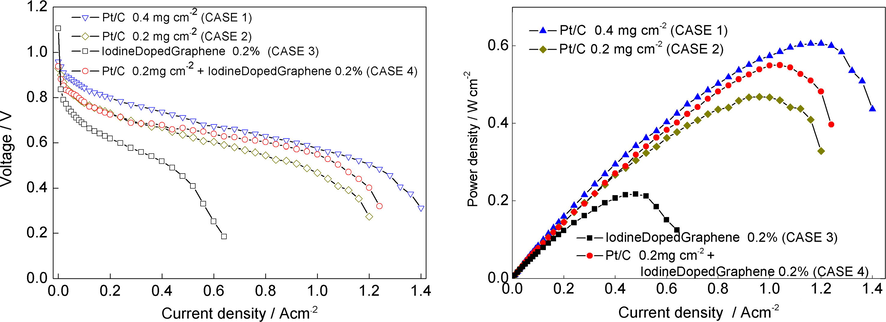
Polarization curve plots (left) and power density plots (right) of a single hydrogen-air PEMFC with cathode loadings: (1) 0.4 mg cm−2 Pt loading sprayed on membrane; (2) 0.2 mg cm−2 Pt loading sprayed on membrane; (3) 0.2 mg cm−2 iodine loading sprayed on membrane; (4) 0.2 mg cm−2 Pt loading sprayed on membrane + 0.2 mg cm−2 iodine sprayed on GDL. Cell runs with H2/air, 1 bar anode and cathode back pressure; temperature 60 °C; flow rates H2/Air: 100 mL min−1/300 mL min−1.
From the polarization measurements for the FCs with the electrodes containing the same Pt 0.2 mg cm−2 loading (Pt/C – green dot and Pt/C + iodine doped graphene – red dot) it was noted that the Pt/C + iodine graphene composed electrode leaded to a better performance for FC. We consider that this increase in performance is due to the synergic effect of catalytic system including Pt and iodine doped graphene.
Considering the presumed mechanism for developed cathode, the first step refers at oxygen adsorption on Pt surface and dissociation into oxygen atoms. The electron transfer reaction occurs with the adsorbed molecular oxygen and the final step of the ORR mechanism is the formation of water. The water formed must be removed from the platinum surface. A proper balance is necessary for the strength of the bond of oxygen to the platinum surface. A week bond does not allow the oxygen adsorption and in contrary, a strong strength means that the water produced will not leave the surface after the reaction and the platinum sites are blocked in further reaction.
Taking into account the result about electrochemical response for ORR in case 4 based on GrI3 as cathode material, more detailed electrochemical analysis is required to really consider the electrochemical performance of GrI3. Since the performance of 0.2 mg cm−2 PtC + 0.2 mg cm−2 GrI3 is between those of 0.2 mg cm−2 Pt/C and 0.4 mg cm−2 Pt/C and the performance of 0.2 mg cm−2 GrI3 is given, it would be preferable to compare this results with those of 0.1 mg cm−2 Pt/C and 0.3 mg cm−2 Pt/C. In this way the potential of GrI3 would be better appreciated. Therefore, new electrochemical analyses were performed in order to reconsider the electrochemical performance and the potential of GrI3 and the results are presented in Table 3.
Parameter
Cathode
0.4 mgPt cm−2 (case 1)
0.3 mgPt cm−2
0.2 mgPt cm−2 (case 2)
0.1 mgPt cm−2
0.2 mgPt + 0.2% iodinated graphene (case 4)
Iodinated graphene (case 3)
Lit. Ref Peng et al. (2013)
OCV [V]
0.959
0.947
0.929
0.91
0.938
1.1
0.96
Peak power density [W cm−2]
0.606
0.51
0.468
0.38
0.551
0.217
0.33
CurrentDensity@ Voltage 0.8 V [A cm−2]
0.19
0.11
0.08
0.04
0.08
0.02
0.08
CurrentDensity@ Voltage 0.6 V [A cm−2]
0.92
0.7
0.59
0.46
0.83
0.24
0.4
Even if literature contains several papers dealing with iodinated graphene preparation, we have to mention that, all their electrochemical tests were performed ex situ, and a comparison would be improper. Related to in situ test other efficient doped graphene catalysts for ORR (Peng et al., 2013), are reported recently in the literature, allowing the obtaining to obtain some important electrochemical performances. One of these studies is related to a Fe- and N- doped carbon catalyst with graphene structure for ORR, which was used for comparison (last column of table) with the other results obtained from our study.
In order to determine the reason for the demonstrated performances, the two electrodes were subjected to in situ electrochemically active area measurements. Fig. 9 shows the in situ cyclic voltammetry (CV) at a scan rate of 50 mV s−1 for electrode from case 2 (reference) and case 4 (modified electrode). It was found that the shapes of all CV curves exhibited a good symmetry at different work conditions of FC regarding temperature, at a relative high scan rate, which demonstrated an excellent capacitive behavior. Well-defined anodic and cathodic peaks were recorded for the modified electrodes in case 4. The onset potentials of iodine-doped graphene shift positively confirmed a better electrocatalytic activity toward ORR. Thus, the electrochemical area of the Pt/C + iodine doped graphene electrode was 82 m2 g−1 Pt, at 60 °C and 90 m2 g−1 Pt at 80 °C, which is about 3 times higher than that of commercial Pt/C electrode at the same Pt loading (case 2). The results are summarized in Table 4. This higher active area suggests more platinum sites available for the ORR which leads to the improved fuel cell performance seen in the polarization curve.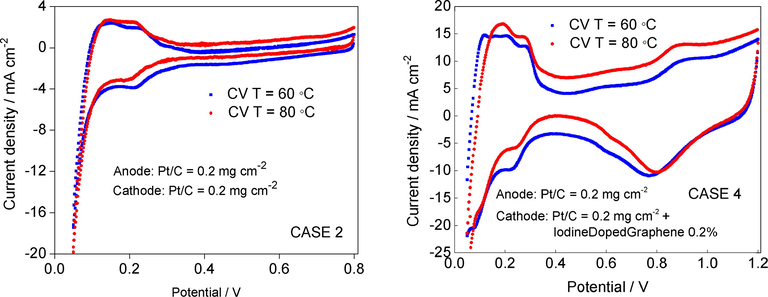
Cyclic voltammetry of iodinated graphenes performed on in situ FC measurements on cathode electrodes: Pt/C 0.2 mg cm−2 at 60 °C and 80 °C (left) and Pt/C 0.2 mg cm−2 + GrI 0.2 mg cm−2 at 60 °C and 80 °C (right). The air in the original FC cathode was replaced with N2. Potential scan rate: 50 mV s−1.
Temperature, °C
Cathode electrode
0.2 mg cm−2 Pt loading sprayed on membrane (CASE 2)
0.2 mg cm−2 Pt loadings sprayed on membrane + 0.2 mg cm−2 iodine loading sprayed on GDL (CASE 4)
60 °C
ECSA 35 m2 g−1 Pt
ECSA 82 m2 g−1 Pt
80 °C
ECSA 38 m2 g−1 Pt
ECSA 90 m2 g−1 Pt
The peaks for the Pt/C are centered at −0.21 V and −0.23 V, corresponding to 60 °C respectively to 80, with corresponding current densities of −0.4 mA cm−2 −0.43 and mA cm−2, respectively. The results on modified electrode indicated that the iodine doping onto graphenic structures not only shifts the cathodic reduction peak more positively (0.15 V compared with that of the Pt/C) but exhibits a high electrocatalytic activity. The current density of hybrid cathode increased with 15% compared with that of commercial Pt/C having an equivalent Pt loading. Thus, iodine doping in graphene framework could plays an exceedingly role in the improvement of the overall ORR performance.
The explanation of enhanced ORR activity with iodine doped graphene can be attributed to the ORR mechanism based on a higher electronegativity of iodine (2.66) than carbon (2.55) to polarize adjacent carbon atoms in graphitic frameworks to facilitate the oxygen adsorption and charge-transfer. The ORR is a well-known multi-electron charge transfer reaction with two main possible paths: (a) one step direct pathway, involving four electrons transfer to produce H2O directly; and (b) two steps indirect pathway, involving two electrons transfer for the first step and another two electrons for second step to obtain water. We presume that doped iodine can form partially ionized bonds of -I+- to enhance the charge transfer because of its relativity large atomic size. Otherwise, some results suggest that the edges of halogenated graphene have enough activities to attract O2 and to weaken the O—O bond of the adsorbed O2, which is favorable for an efficient development into water upon reduction and protonation (Jeon et al., 2013). However, further experimental and theoretical work on the iodine content and doping mechanism of graphene is necessary.
In order to gain further insight into electrochemical performances, the electrochemical impedance spectroscopy (EIS) was carried out. Impedance analyses for proposed modified electrode were measured in the frequency range of 20 kHz–50 mHz.
To highlight the increasing of power density for the fuel cell with the cathode electrode from case 4 compared with the fuel cell with the cathode electrode from case 2 new EIS electrochemical tests were done (Wu, 2016). The major losses that occur in fuel cell electrochemical reactions are due to charge transfer between the electrode-electrolyte interfaces, due to gas transport through the porous layers and conduction of protons through the electrolyte. These losses dependent on fuel cell current density and are described in terms of voltage losses.
EIS experiments are performed at four current densities (0.4, 0.6, 0.8 and 1 A cm−2) using a 60 °C operating temperature, 58 °C dew point temperature and 1 barg operating pressure. The amplitude of AC signal was optimized (200 mA) for high fuel cell current densities.
EIS spectra presented in Fig. 10(a)–(d) have highlighted two overlapping circles. The main contribution in the voltage decrease is driven entirely by the cathode losses. Table 5 presents the values of fuel cell losses identified using Versa Studio software. Total ohmic losses, RΩ, represents the sum of all contact resistances plus the membrane ohmic resistance. The ohmic resistance of the cell fuel is obtained from the intercept with real axis at frequency about 2 kHz in impedance spectra. RΩ decreases slightly with increasing current density and remains almost equal for both cases. The arch from the average frequency (1 kHz – 2 Hz) is associated with the charge transfer resistance, Rct, and with double layer capacitance of the catalyst. The difference between the anode and cathode charge transfer resistances is difficult to observe separately; therefore, this contribution is presented in Table 5 as a sum of both losses (Rct = Rct,a + Rct,c).
EIS spectra for case 2 and case 4 at different current densities. (a) Current density = 0.4 mA cm−2, (b) current density = 0.6 mA cm−2, (c) current density = 0.8 mA cm−2 and (d) current density = 1.0 mA cm−2. Active cell area 5 cm2; 1 barg anode and cathode back pressure; temperature 60 °C; flow rates H2/Air: 100 mL min−1/300 mL min−1.
Param.
Curr.Den.
0.4 [A cm−2]
0.6 [A cm−2]
0.8 [A cm−2]
1.0 [A cm−2]
Case 2
Case 4
Case 2
Case 4
Case 2
Case 4
Case 2
Case 4
RΩ [mΩ]
21.6
21.5
22.1
21.9
18.2
17.6
17.6
16.6
Rct,A + Rct,C [mΩ]
14.4
13.1
12.5
10.7
11.8
11.2
12.3
10.9
Maximum |C|./Freq [mF]/[Hz]
44/200
39/251
59/200
55/251
61/200
57/251
45/251
35/316
The double layer capacitance is the maximum of the Nyquist plot and is presented in the table as modulus and frequency. As the current density increases, it is observed that Rct and |C| values are lower for the hybrid electrode (iodine doped and platinum) compared to the reference electrode (0.2 mgPt cm−2). At low frequencies (2 Hz–50 mHz) an inductive character is observed which decreases with increasing current density due to fuel cells mass transport. This evident decrease is connected to charge transfer impedance of hybrid cathode compared to Pt/C cathode and could be caused to an increased conductivity from the first case. According to EIS results the charge transfer resistance of iodinated graphene is much less that Pt/C, which is in agreement with demonstrated ORR of these cases. The explanation derives from outcome of iodine doping into graphitic structure, favoring the conductivity and charge carrier effect.
4 Conclusions
In this paper, we demonstrated an easy and verifiable process to obtain iodine doped-graphene materials, using different preparation routes, based on nucleophilic substitution of graphene oxide and on electrophilic substitution of commercial graphene.
The iodination method, as well the starting material, had a significant effect on the iodine content. SEM image illustrates a very rough surface structure and a very good connected network, which certainly favors the electronic transport in fuel cell applications. Six physical-chemical characterization methods have been used during this work, but the most important of these, namely the Raman and XPS deconvoluted spectra suggest that iodine atoms were successfully incorporated into graphene network as I−3 (triodide) and I−5 (pentaiodide) species. The GrI 3 as sample with highest iodine content was included and tested in a singular PEMFC, as catalyst and as porous layer between gas diffusion layer (GDL) and a 0.2 mg cm−2 Pt/C catalyst layer (CL). The electrochemical performances of proposed configurations were tested and compared with a typical PEMFC configuration with different Pt/C catalysts loadings (0.4 and 0.2 mg cm−2). As a standalone catalyst, the iodine doped graphene give a performance with 60% lower than if is placed between GDL and CL, as microporous layer (MPL). If it is included as an MPL, the electrochemical performances of the fuel cell are with 15% bigger in terms of power density than the typical fuel cell with 0.2 mg cm−2 Pt/C catalysts, proving the beneficial effect of the iodine doped graphene for the fuel cell in the ohmic and mass transfer region. The study revealed an obvious fact, that the typical fuel cell with 0.4 mg cm−2 Pt/C catalyst has the better performance, but only with 10% better in terms of maximum power density than the hybrid iodine doped graphene – Pt/C fuel cell, which gives confidence to continue our research. The results suggest new insights and practical method for designing a high performance metal-free ORR catalyst by a scalable technique.
Acknowledgment
This work is supported by the National Agency of Scientific Research from Romania by the National Plan of R & D, Project No. PN 16 36 01 02 and by the Romanian partnership in priority domains-PNII Programme, from MEN-UEFISCDI, under the project no 284/2014. The authors wish to thank Dr. Balan Danut from Center for Surface Science and NanoTechnology University Politehnica of Bucharest, for TEM analysis; Dr Soare Amalia from RD Institute for Cryogenics and Isotopic Technologies Romania for SEM analysis and Dr Alessandro Mellichio from Calabria University-Italy, for Raman spectra.
References
- Fuel cell systems for transportation: status and trends. J. Power Sources. 2008;177:167-176.
- [CrossRef] [Google Scholar]
- Graphene Science Handbook: Applications and Industrialization. CRC Press; 2016.
- Graphene oxide and its electrochemical performance. J. Electrochem.. 2012;7:4345-4351.
- [Google Scholar]
- General equation for the determination of the crystallite size la of nanographite by Raman spectroscopy. Appl. Phys. Lett.. 2006;88
- [CrossRef] [Google Scholar]
- Graphene for energy conversion and storage in fuel cells and supercapacitors. Nano Energy 2012
- [CrossRef] [Google Scholar]
- Boron-doped graphene as active electrocatalyst for oxygen reduction reaction at a fuel-cell cathode. J. Catal.. 2014;318:203-210.
- [CrossRef] [Google Scholar]
- Raman spectrum of graphene and graphene layers. Phys. Rev. Lett.. 2006;97
- [CrossRef] [Google Scholar]
- PEM fuel cell catalysts: cost, performance, and durability. Electrochem. Soc. Interface 2005:41-44.
- [Google Scholar]
- The role of platinum in proton exchange membrane fuel cells. Platin. Met. Rev. 2013
- [CrossRef] [Google Scholar]
- Facile, scalable synthesis of edge-halogenated graphene nanoplatelets as efficient metal-free eletrocatalysts for oxygen reduction reaction. Sci. Rep.. 2013;3:1810.
- [CrossRef] [Google Scholar]
- Three-dimensional graphene-based nanomaterials as electrocatalysts for oxygen reduction reaction. J. Nanomater. 2015
- [CrossRef] [Google Scholar]
- Charge transfer chemical doping of few layer graphenes: Charge distribution and band gap formation. Nano Lett.. 2009;9:4133-4137.
- [CrossRef] [Google Scholar]
- A new method for manufacturing graphene and electrochemical characteristic of graphene-supported Pt nanoparticles in methanol oxidation. J. Power Sources. 2013;225:356-363.
- [CrossRef] [Google Scholar]
- Iodine doping in solid precursor-based CVD growth graphene film. J. Mater. Chem.. 2011;21:15209.
- [CrossRef] [Google Scholar]
- Water management in A PEMFC: water transport mechanism and material degradation in gas diffusion layers. Fuel Cell. 2011;11:814-823.
- [CrossRef] [Google Scholar]
- Numerical modeling and analysis of micro-porous layer effects in polymer electrolyte fuel cells. J. Power Sources. 2009;194:763-773.
- [CrossRef] [Google Scholar]
- Oxidative iodination of deactivated arenes in concentrated sulfuric acid with I2/NaIO4 and KI/NaIO4 iodinating systems. Synthesis (Stuttg). 2006:1195-1199.
- [CrossRef] [Google Scholar]
- The effect of functionalization on structure and electrical conductivity of multi-walled carbon nanotubes. J. Nanoparticle Res.. 2008;10:77-88.
- [CrossRef] [Google Scholar]
- Progress in the synthesis of carbon nanotube- And nanofiber-supported Pt electrocatalysts for PEM fuel cell catalysis. J. Appl. Electrochem. 2006
- [CrossRef] [Google Scholar]
- Superior cycle stability of nitrogen-doped graphene nanosheets as anodes for lithium ion batteries. Electrochem. Commun. 2011
- [CrossRef] [Google Scholar]
- Convenient graphene based materials as potential candidates for low cost fuel cell catalysts. React. Kinet. Mech. Catal.. 2016;118:281-296.
- [CrossRef] [Google Scholar]
- Graphene-based materials used as the catalyst support for PEMFC applications. In: Materials Today: Proceedings. Elsevier Ltd; 2015. p. :3797-3805.
- [CrossRef] [Google Scholar]
- Microporous layer for water morphology control in PEMFC. Int. J. Heat Mass Transf.. 2009;52:2779-2791.
- [CrossRef] [Google Scholar]
- First- and second-order Raman scattering from finite-size crystals of graphite. Phys. Rev. B. 1979;20:392-401.
- [CrossRef] [Google Scholar]
- High performance Fe- and N- doped carbon catalyst with graphene structure for oxygen reduction. Sci. Rep.. 2013;3:1765.
- [CrossRef] [Google Scholar]
- Halogenation of graphene with chlorine, bromine, or iodine by exfoliation in a halogen atmosphere. Chem. - A Eur. J.. 2013;19:2655-2662.
- [CrossRef] [Google Scholar]
- Nitrogen-doped graphene as efficient metal-free electrocatalyst for oxygen reduction in fuel cells. ACS Nano. 2010;4:1321-1326.
- [CrossRef] [Google Scholar]
- Porous Core-Shell Fe 3 C Embedded N-doped Carbon Nanofibers as an Effective Electrocatalysts for Oxygen Reduction Reaction. ACS Appl. Mater. Interf.. 2016;8:4118-4125.
- [CrossRef] [Google Scholar]
- Optimal design of ultralow-platinum PEMFC anode electrodes. J. Electrochem. Soc.. 2008;155:B125-B133.
- [CrossRef] [Google Scholar]
- Carbon nanotubes and nanofibers in catalysis. Appl. Catal. A Gen.. 2003;253:337-358.
- [CrossRef] [Google Scholar]
- Sulfur/nitrogen dual-doped porous graphene aerogels enhancing anode performance of lithium ion batteries. Electrochim. Acta. 2016;205:188-197.
- [CrossRef] [Google Scholar]
- Catalyst-free synthesis of nitrogen-doped graphene via thermal annealing graphite oxide with melamine and its excellent electrocatalysis. ACS Nano. 2011;5:4350-4358.
- [CrossRef] [Google Scholar]
- N-doped carbon nanomaterials are durable catalysts for oxygen reduction reaction in acidic fuel cells. Sci. Adv.. 2015;1:e1400129.
- [CrossRef] [Google Scholar]
- Recent advances in fuel cell technology at Ballard. J. Power Sources. 2008;176:468-476.
- [Google Scholar]
- A class of high performance metal-free oxygen reduction electrocatalysts based on cheap carbon blacks. Sci. Rep.. 2013;3:2505.
- [CrossRef] [Google Scholar]
- Observation of Raman band shifting with excitation wavelength for carbons and graphites. Solid State Commun.. 1981;39:341-344.
- [CrossRef] [Google Scholar]
- Handbook of Fuel Cells—Fundamentals, Technology and Applications. Handb. Fuel Cells—Fundamentals, Technol. Appl.. 2003;3:190.
- [Google Scholar]
- Vojislav, S., Markovic, N., 2015. Nanosegregated Cathode Alloy Catalysts with Ultra-Low Platinum Loading. DOE Hydrog. Fuel Cells Program, Annu. Prog. Rep. V_13-V_19.
- Recent development of non-platinum catalysts for oxygen reduction reaction. J. Power Sources. 2005;152:1-15.
- [CrossRef] [Google Scholar]
- Synthesis, doping and polarized Raman spectra of highly conducting polyacetylene. Synth. Met.. 1992;46:85-91.
- [CrossRef] [Google Scholar]
- Polyelectrolyte-functionalized graphene as metal-free electrocatalysts for oxygen reduction. ACS Nano. 2011;5:6202-6209.
- [CrossRef] [Google Scholar]
- A review of recent development: Transport and performance modeling of PEM fuel cells. Appl. Energy. 2016;165:81-106.
- [CrossRef] [Google Scholar]
- Scalable synthesis of functionalized graphene as cathodes in Li-ion electrochemical energy storage devices. Appl. Energy 2016
- [Google Scholar]
- Facile synthesis of boron and nitrogen-doped graphene as efficient electrocatalyst for the oxygen reduction reaction in alkaline media. Int. J. Hydrogen Energy. 2014;39:16043-16052.
- [CrossRef] [Google Scholar]
- A review on PEM voltage degradation associated with water management: Impacts, influent factors and characterization. J. Power Sources 2008
- [CrossRef] [Google Scholar]
- Structure-conductivity relationships of iodine-doped polyaniline. J. Polym. Sci. Part B-Polym. Phys.. 1997;35:1993-2001.
- [CrossRef] [Google Scholar]
- Iodine/nitrogen co-doped graphene as metal free catalyst for oxygen reduction reaction. Carbon N. Y.. 2015;95:930-939.
- [CrossRef] [Google Scholar]
- Catalytic mechanisms of sulfur-doped graphene as efficient oxygen reduction reaction catalysts for fuel cells. J. Phys. Chem. C. 2014;118:3545-3553.
- [CrossRef] [Google Scholar]
Appendix A
Supplementary material
Supplementary data associated with this article can be found, in the online version, at http://dx.doi.org/10.1016/j.arabjc.2016.12.002.
Appendix A
Supplementary material
Supplementary data 1
Supplementary data 1
Supplementary data contains Supplementary Figs. 1 and 2.


