

Translate this page into:
Rapid pH-dependent Photocatalytic Degradation of Methylene Blue by CdS Nanorods Synthesized through Hydrothermal Process
⁎Corresponding authors. zeeshanabbasi@mail.ustc.edu.cn (Zeeshan Abbasi), muhammadhafeezchemist@gmail.com (Muhammad Hafeez)
-
Received: ,
Accepted: ,
This article was originally published by Elsevier and was migrated to Scientific Scholar after the change of Publisher.
Peer review under responsibility of King Saud University.
Abstract
CdS nanorods were successfully synthesized using a hydrothermal method and their photocatalytic degradation activity was tested on methylene blue (MB) at different pH levels. The synthesis of CdS nanorods was confirmed using various techniques including UV–Vis and FTIR spectrometers, X-ray diffraction (XRD), dynamic light scattering (DLS), and high-resolution transmission electron microscope (HRTEM). UV–Vis analysis showed an absorption peak at 385 nm in the CdS nanorods suspension. FTIR spectroscopy revealed the presence of different functional groups responsible for stabilizing the nanorods. TEM analysis showed that the particles had a rod-like morphology with crystallite sizes ranging from 2 to 10 nm, consistent with the DLS studies. XRD analysis confirmed the crystalline nature of CdS. A photocatalytic reactor was used to degrade methylene blue at different pH values, and the residual concentration was monitored using UV–Vis spectroscopy. The photocatalytic activity of CdS nanorods was found to be improved by adjusting the pH of the solution. The nanorods showed high efficiency in degrading methylene blue, with degradation performance of approximately 32 % and 35 % after just 30 min under sunlight at pH 4 and pH 10, respectively. This research has potential applications in the photodegradation of harmful pollutants in both industrial wastewater and domestic water supplies.
Keywords
CdS nanorods
Photocatalytic degradation
Photocatalysis
Visible light
Water pollutant

1 Introduction
Environmental issues related to organic contaminants and toxic water contaminants foster the sustainable applied and basic research in the discipline of environmental reclamation. Photocatalysis by semiconductors provides an opportunity to completely eliminate toxic chemicals through its effectiveness and wide-ranging applications (Hoffmann et al., 1995). The majority of dyes manufactured by paper and textile industries are hard to degrade, owing to their relatively stable chemical structures and heavily contaminate potable water and irrigation systems in certain regions. Lately, sulfides of transition-metals, especially ZnS and FeS, were extensively investigated owing to their distinct catalytic abilities in comparison to TiO2 (Salem et al., 2003; Chauhan et al., 2013).
The photocatalytic properties occur not only in the photo reductive production of H2 from water and the photo reduction of CO2 (Fujiwara et al., 1998; Velanganni et al., 2018), but also in the photo transformation of various organic substrates such as the oxidative formation of carbon–carbon bonds from organic electron donors, cis–trans photo isomerization of alkenes, and the photo reduction of aldehydes and their derivatives (Yanagida et al., 1995). One strategy for enhancing the activity of particulate photocatalysts has been to reduce size of the particles down to the nanoscale (Wang et al., 1997; Dodd et al., 2006; Ganesh et al., 2017). The specific surface area increases on reducing the average size of particle and so the amount of active surface sites where formation of free radicals from the reaction of photogenerated charge carriers and adsorbed molecules takes place. However, reducing a photocatalyst’s particle size also accelerates the rate of recombination of surface charges. This means that as the particle size decreases, the particulate’s photocatalytic activity will not increase monotonically (Zhang et al., 1998). As a result, it is clear that achieving high activity of nano particulate photocatalysts necessitates a method of preventing recombination of surface charges.
Lately, metal chalcogenides, like cadmium sulfide, have drawn a lot of attention because of their likely uses in photoelectronic, optical, and photocatalytic degradation (Yang et al., 2005; Tang and Huang, 1995). CdS, a II-VI compound semiconductor, is the most suitable contender for detection of visible radiation because of its direct band gap of 2.42 eV at room temperature with a cubic and hexagonal wurtzite structure having lattice spacing a = b = c = 5. 83˚A for cubic and a = 4.21A˚, c = 6.68 ˚A for hexagonal. Due to wide bandgap and stability, heterojunction solar cells employ CdS as window material to inhibit the recombination of charge carriers that in result enhances the performance of solar cell (Morales-Acevedo, 2006; Cheng et al., 2018). Additionally it is used in light emitting diodes, photodetectors (Wang et al., 2006), sensors (Ponzoni et al., 2006), and electrically operated lasers (Duan et al., 2003). CdS particles were effectively synthesized using a range of media, including non-aqueous solvents (Rossetti et al., 1985; Rossetti et al., 1984), reversed micelles (Petit and Pileni, 1988), vesicles (Watzke and Fendler, 1987), zeolites (Wang and Herron, 1987) and other methods (Ohtaki et al., 1996; Ahmad et al., 2023; Xie et al., 2011).
This study reports a successful, easy and effective approach for the synthesis of CdS nanorods by adjusting the water/en ratio, via hydrothermal method (Murray et al., 1993) using ethylenediamine as capping agent. The synthesized nanorods were characterized and then successfully utilized as photo catalyst in the photodegradation of methylene blue as organic cationic dye at different pH levels. Methylene blue [3,7-bis(dimethylamino)- phenothiazin-5-iumchloride] is a blue cationic thiazine dye which was used as a model dye to evaluate the photocatalytic activity of pure CdS nanorods.
2 Materials and methods
Dimethylamine was purchased from sigma Aldrich and used as it is. Carbon disulphide was purchased from Merk. Cadmium nitrate tetrahydrate was purchased from sigma Aldrich. Ethylenediamine was purchased from Sigma Aldrich. Methylene Blue was purchased from Merck. Methanol, hydrogen peroxide, sodium hydroxide (NaOH) and hydrochloric acid were purchased from Merck. Without additional purification, all chemicals were utilized exactly as they were received.
2.1 Synthesis of CdS nanorods
Synthesis of nanorods was done in three steps (Li et al., 2003). In the first step, ligand (sodium dibutylcarbamodithioate) is synthesized by the reaction of an amine and a sulfide precursor. 10 mL dibutyl amine was taken in a two-neck flask filled with 25 mL methanol. 2.36 g sodium hydroxide was added in this mixture and kept the stirring on. The temperature of this mixture was maintained at 0˚C. A solution of 3.56 mL CS2 in 8 mL methanol was added in this mixture at 0 ˚C. Upon addition of CS2, the color of solution turned to pale yellow. Reaction is given below: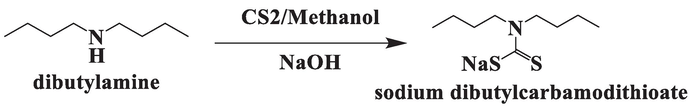
The second step was the synthesis of complex in which solution of 9.10 g cadmium nitrate tetrahydrate in 15 mL methanol was added to the ligand. White precipitates were formed immediately. After 3 h of stirring the white precipitates turned to pale yellow color. This mixture was filtered and washed with distilled water and then methanol. After decantation, the complex was dried at room temperature. The powdered complex was then collected. Reaction for the synthesis of complex is: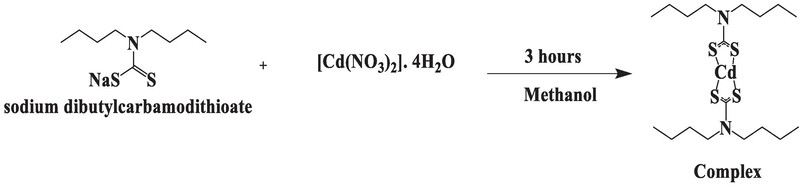
The complex formation between sodium dibutylcarbamodithioate and cadmium nitrate involves the coordination of the carbamodithioate ligand with the cadmium ion. Sodium dibutylcarbamodithioate is a chelating ligand that contains a carbamodithioate functional group. This ligand has sulfur atoms that can act as donor sites for coordination with metal ions. In the presence of Cd(NO3)2, the sulfur atoms of sodium dibutylcarbamodithioate can coordinate with the cadmium ions.
In the third step synthesis of CdS nanorods was done. Briefly, 1 g of the complex was taken in a two-neck flask. 20 mL of ethylenediamine/water mixture in 1:1 was added in it and stirred until the complex dissolved. The temperature of the mixture was then increased gradually up to 140 ˚C for approximately 1 h. When color of the mixture changed, heating was turned off and temperature of mixture was brought to 0 ˚C. Change in color from pale yellow to deep yellow showed the decomposition of the complex. Upon cooling, the mixture was filtered and washed with methanol. To achieve uniformity, this mixture was stirred for 1 h in two-neck flask. After stirring, this mixture was again filtered and washed with methanol. This mixture was stirred again and then washed with methanol and then kept aside for few hours. After decantation, the cadmium sulfide nanorods were dried at room temperature. Finally, the nanorods were dried in a furnace at 500 ˚C. Here the en is used as caping agent in the synthesis of CdS nanorods due to its unique properties and its ability to influence the growth and morphology of the nanoparticles. en can effectively passivate the surface of CdS nanostructures, preventing the agglomeration of nanoparticles and reducing surface defects. This passivation improves the stability and dispersibility of the nano-rods, leading to enhanced performance in various applications. Photo corrosion is a common phenomenon and Cd materials are very sensitive towards photo corrosion. en coordinate with the surface of CdS nanorods, forming a protective layer that acts as a barrier against photo corrosion (Ning and Lu, 2020; Ning et al., 2017). The synthesized nanorods were stored and then used for the catalytic application.
2.2 Photocatalytic activity experiments
The photocatalytic performance of CdS nanorods was evaluated by photo degradation of MB dye. The experimentation was performed in an open atmosphere under the light coming from sun. Under constant stirring, a 50 mL solution of MB (15 × 10−6 M concentration) and 5 mg powder of the CdS catalyst was used to conduct the catalytic studies. For efficient photocatalytic reaction, the solution was continuously stirred to ensure thorough mixing and interaction between the catalyst and the dye molecules. pH of solutions was maintained by using 0.1 M solution of NaOH. At predefined time intervals (5 min), a 4 mL of the aliquot solution was taken out of the reacting mixture and centrifuged. The decrease in absorbance was measured by using UV–Vis spectrophotometer.
2.3 Characterization of CdS nanorods
2.3.1 UV–visible spectroscopy
For UV–vis spectrum analysis, a Shimadzu UV-1700 UV–vis spectrophotometer outfitted with tungsten and deuterium lamps was employed having the wavelength range of 190–1100 nm with 1 nm wide slit and the light source change wavelength was fixed at 340.8 nm. The sampling interval was 0.5 nm. Quartz cuvettes with a fixed path length of 10 mm were employed for spectral analysis. In this paper the UV–vis spectra of pure CdS and photocatalytic activity were investigated and reported.
2.3.2 High resolution transmission electron microscopy (HRTEM)
Hitachi 80–300 kV TEM was used for determining the size of CdS nanorods. The resolution of TEM was 0.2 nm.
2.3.3 Dynamic light scattering and zeta potential measurements
Malvern Zetasizer Nano ZSP used for the measurements of the size through dynamic light scattering (DLS) and zeta potential (ζ) of dispersions, the product of Malvern Panalytical technologies, UK, with Malvern Zetasizer Software (v7.13) which have a size range of 0.3 nm-10 μm and size range of 3.8 nm-100 μm (for zeta potential measurements). The observations were taken in distilled water at a temperature of 25 °C. The samples for DLS measurements were prepared by taking 0.5 mg of CdS in 10 mL of distilled water.
2.3.4 X-ray diffraction
X-ray diffraction (XRD) pattern was recorded for CdS Nanorods using Bruker D8 Advance with (Cu) Kα radiation of wavelength λ = 1.5406 \AA. The scan range 2θ was 20°-70° with a step of 0.02 degrees and the generator settings were 30 mA at 40 kV.
2.3.5 FT-IR spectroscopy
FTIR studies were conducted on the Shimadzu FTIR-8400S Spectrometer having resolution of 0.85 cm−1 and peak-to-peak S/N ratio of 20,000:1. To check the transmittance of CdS Nanorods, a range of 500–4000 cm−1 was employed. FT-IR was used to identify different functional groups present in CdS sample.
3 Results and discussion
Fig. 1 shows several characterizations like UV–Vis spectroscopy, FT-IR spectroscopy, Dynamic light scattering (DLS), X-ray diffraction analysis (XRD), and Transmission electron microscope image of CdS nanorods. UV–Vis spectrum (Fig. 1a) of CdS nanorods dispersed in water showed the broad absorption band at 385 nm showing enhanced visible light response potential. In spectrum, the band at 385 nm is due to surface plasmon absorption of cadmium sulphide. Absorption band at 385 nm confirms the CdS formation (Mullaugh and Luther, 2010). Using optimum conditions, FTIR measurement was done to authenticate the bond structure of CdS particles. The infrared absorption spectra of hydrothermally synthesized CdS nanoparticles, covering 4000 to 400 cm−1 wavenumber range, are shown in Fig. 1b. The peak at 3427 cm−1 in the higher energy area is attributed to stretching of the O–H group of the water absorbed on surface of CdS. Methanol absorption contributes to the C-O stretching vibration, which gives its strong peak at 1108 cm−1 (Duchaniya, 2014). Frequency band at 1625 cm−1 because of bending vibration, was assigned to O–H for the water. Absorption band at 622 cm−1 was consistent with Cd-S stretching bond (Acharya et al., 2010). Hydrodynamic diameter (Fig. 1c) of CdS, the average three measurements was found to be at 12 ± 5 nm. The hydrodynamic diameter always greater than the actual diameter as it gives us the diameter of the sphere which includes the outer core present around the particles such as solvent molecules or any stabilizing materials (Saeed et al., 2021; Saeed et al., 2023). Zeta potential (Fig. 1; SI) of CdS, the average of three measurements was observed to be at −28.5 ± 3.48 mV. As far as stability is concerned the synthesized CdS were found to be very stable as zeta potential values > +30 and < -30 show good stability of the particles, so there were no chances of aggregation (Abbasi et al., 2021). Fig. 1d. shows the XRD spectrum of CdS nanorods synthesized by hydrothermal method. The XRD was taken at a scanning step of 0.020°, in 2θ range from 20° to 70° with mono-chromated Cu-Kα radiation (λ = 0.51418 nm). The XRD peaks’ distinct line broadening indicates that the synthesized material comprises of particles in nanoscale range. Peak intensity, position and width (Full Width at Half Maximum) (FWHM) data could be verified by analyzing XRD patterns. As reported in several research works, the diffraction peaks at 2θ are identified a hexagonal wurtzite phase of CdS which correspond to the following lattice planes (1 0 0), (0 0 2), (1 0 1), (1 0 2), (1 1 0), (1 0 3), and (2 0 0) respectively (Lee et al., 2010) and are compatible with reported ICDC(No.00–041-1049) file card. Any impurity related peaks that are present are a sign that high purity CdS nanostructure is developing. Sharp peaks signify good crystallinity in the product (AL-Mamoori et al., 2018). The strong (0 0 2) diffraction peak is stronger and narrower in comparison with other peaks which suggests a better growth along [0 0 1] hexagonal CdS crystallites. Parameters such as D-spacing and crystallite size calculated from XRD spectrum come out to be at 3.40A and 13.2 nm respectively with density of 4.82 g/cm−3.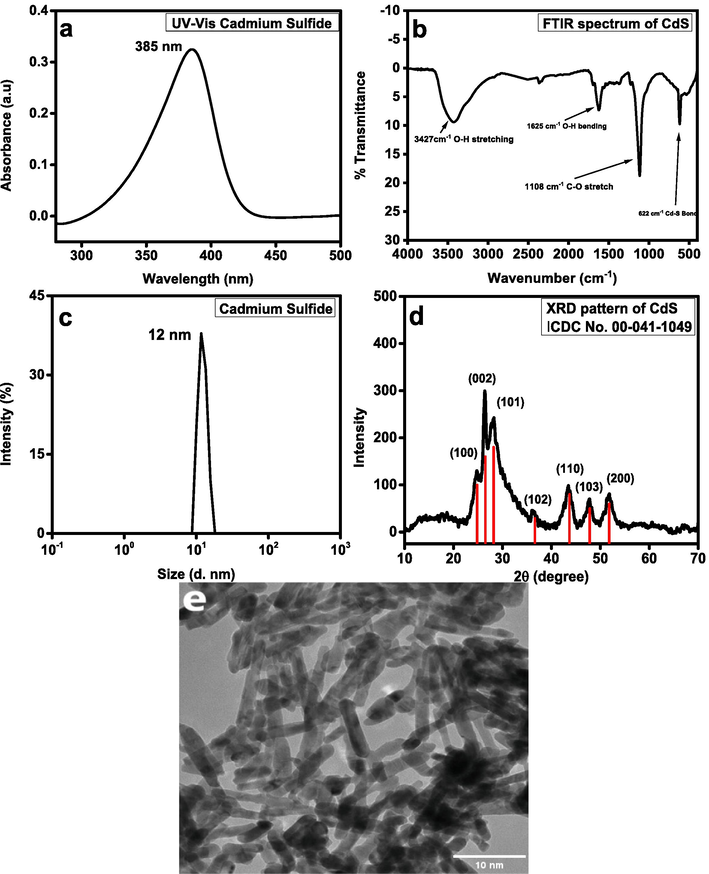
(a) UV absorption spectrum of CdS, (b) FT-IR spectrum of CdS, (c) DLS size distribution of CdS, (d) XRD pattern of CdS, (e) HRTEM image of CdS.
Morphology and size of CdS nanorods are analyzed at the magnifications of 100 nm, with the help of Hitachi TEM showing in Fig. 1e. In determining material’s shape and particle size, Transmission electron microscope is an effective technique. It can be seen from the HRTEM image that the surface morphologies take the shape of nanorods with a consistent shape over the whole observed surface. The nanorods in HRTEM image have an average particle size between 5 and 10 nm. Particle size calculated from TEM image by using ImageJ software is found to be averaged at 10 nm. Surface is smooth with clear boundaries except agglomerated points. All the above obtained results confirmed the synthesis of CdS Nanorods.
3.1 Photocatalytic activity
The irradiated semiconductor nanoparticles can efficiently eliminate several organic pollutants in the presence of air or oxygen. When light (hυ) activates CdS, electron-hole pairs are created that are potent oxidizing and reducing agents, respectively. CdS + hυ → h+ + e−
The redox reactions are represented as: OH− + h+ → ·OH and O2 + e− → O2−
The hydroxyl radical, which is produced adsorbed water or adsorbed OH– and oxygen are oxidized, is the major oxidant involved in degradation of organic compounds (MB), and can stop hole-electron pairs from re-combining. The ultimate byproducts of the complete reaction include CO2 and H2O, among others (Zhao and Yang, 2003; Das et al., 2011): MB + ·OH → products (CO2 + H2O + NH4+ + NO3− + SO42− + Cl−)
Fig. 2 (a, b, c) show the absorption spectra of photo degradation of MB (5 × 10⁻⁶ M concentration) solution containing CdS nanorods at different pH values under visible light. The degradation efficacy was used to track the photo degradation of MB as the normalized fluctuation in its concentration. As can be seen from these graphs, the intensity of the adsorption peaks declined steadily with increasing exposure time, with the effect being more pronounced when CdS nanorods were used at pH 10. As a result, after 30 min, the normalized change in concentration of MB in the presence of CdS nanorods had fallen by 50 % and the degrading efficiency reached 35 % in just 30 min.![(a), (b), (c) Absorbance spectra of 50 mL Methylene Blue [5 × 10⁻⁶ M] dye solution containing 5 mg of CdS Nanorods at different pH values.](/content/184/2024/17/1/img/10.1016_j.arabjc.2023.105422-fig4.png)
(a), (b), (c) Absorbance spectra of 50 mL Methylene Blue [5 × 10⁻⁶ M] dye solution containing 5 mg of CdS Nanorods at different pH values.
3.2 Effect of band gap on photocatalytic activity
Fig. 3 shows the Tauc plot of the CdS nanorods with inset UV–Vis plot. It is crucial for a photocatalyst to have a small band gap in order to exhibit visible-light activity. The H2O/·OH (OH− = ·OH + e−; E° = −2.8 V) couple’s redox potential must lie within the semiconductor’s band gap, which is another main standard of degradation the of organic molecules (Chirita et al., 2009). CdS nanorods’ band gap has a high correlation with their photocatalytic activity. Because of its narrow band gap, CdS is an effective absorber of visible light, therefore CdS shows high degradation efficiency (∼35 % after only 30 min at pH 10). Along with band gap, size of particle, surface area, structure of the crystal and degree of crystallinity all affect how photogenerated electrons and holes are transported, which in turn affects how well photocatalyst functions.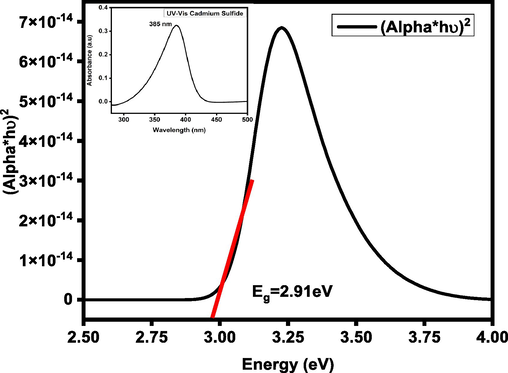
Tauc plot of the CdS nanorods.
3.3 Why pH dependent photocatalytic degradation?
Typically, one of the key factors that affects the photo-oxidation process for industrial waste water properties, is pH. The alteration of solid electrolyte interface’s electrical double layer, which has impact on the adsorption–desorption process along with the detachment of the photogenerated hole-electron pairs on catalyst particles’ surface, is what causes the pH to have an impact on the degradation rate (Franco et al., 2009). Photo catalyst’s surface is positively charged in acidic solutions while in alkaline solutions it is negatively charged (Tang and Huang, 1995). When the photo catalyst’s negative surface develops electrostatic interactions with the MB cations, it is anticipated that the photodegradation efficiency of MB will improve with pH. Consequently, photocatalyst’s corrosion becomes negligible at high pH, making it most optimal for oxidizing organic molecules that contain sulfur (Davis and Huang, 1991). It is an extensively accepted process that in an acidic or alkaline solution, degradation of MB is brought on by solutions’ shift in hydrogen concentration towards higher pH. The outcome of MB photodegradation, though, varies with varying pH of the solution that contains MB and CdS as catalyst. To demonstrate this we conducted photodegradation of MB in 3 distinct pH solutions in order to evaluate the impact of catalytic performance in acidic and alkaline solutions. The performance of cations of CdS along with MB resulted in a slight adsorption on the photocatalyst surface at pH 4 throughout 30 min. On the other hand, a significant amount of the MB was adsorbed at pH 10. At pH 7 an intermediate level of adsorption scenario was seen.
3.4 Comparison of photocatalytic degradation
The process of photocatalytic degradation makes it clearly evident that the absorbance declines steadily with increasing exposure time. Fig. 4(a) shows the photo-degradation & photocatalytic performances of CdS catalyst for MB dye’s photo degradation when exposed to irradiation. It demonstrates that the photocatalytic efficiency of CdS nanorods is much better at pH 10 then other two pHs under irradiation. Further, Fig. 4a. compares the photo degradation performances of the synthesized CdS nanorods at different pH of solutions on MB when exposed to UV radiations. It is examined from this comparative analysis that CdS nanorods display increased photo degradation performance at pH 10 than pH 7 and pH 4. Fig. 4(b) depicts the linear fitting associated with the absorbance spectra of solution of MB dye which contains 5 mg of CdS photocatalyst. It is also noticed that photocatalyst with 5 mg concentration at pH 10 of solution is the most efficient degradation. The degradation efficiency of nanocomposite is also greater than the other two pH. The degradation performance can be estimated by using Eq. (1).
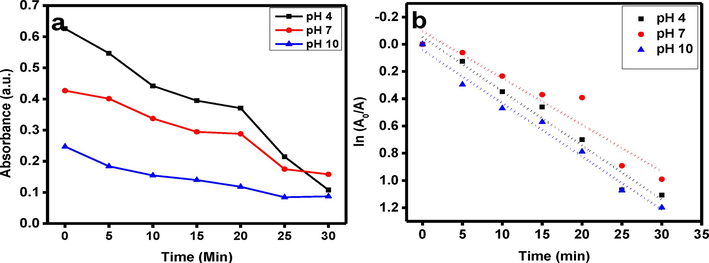
(a), photo-degradation & photocatalytic performances, (b) The linear fitting for the absorbance spectra of MB dye solution containing 5 mg of CdS nanorods powder.
For all the samples, Fig. 4(b) shows the ln(A0/A) plots against irradiation time.
With the use of linear regression and the first-order kinetic law ln(A0/A) = kt, degradation rate constants (k) were derived from the slope of the straight line (Ravichandran et al., 2014; Li et al., 2014).
Table 1 displays the estimated k values together with the associated linear regression coefficient degree (R2) values.
Sr. No
pH
Amount of catalyst (mg)
Rate constant (K) min−1
R2
1
4
5
0.0354
0.8468
2
7
5
0.0342
0.9196
3
10
5
0.0391
0.9869
It is evident from k and R2 values that at pH 10 CdS nanorods show improved photocatalytic efficiency. Greater surface area, more reacting species (ions), and more active sites improve the effectiveness of photocatalysis. In light of the previous discussion, it is deduced that the photocatalytic performance of CdS nanorods is significantly higher at pH 10 as compared to the other two pH values.
4 Conclusion
Employing en as a template agent and coordination agent, the CdS nanocrystals were successfully synthesized by a hydrothermal process and tested their photocatalytic degradation of methylene blue (MB) at various pH. X-ray diffraction (XRD), dynamic light scattering (DLS), UV–vis and FTIR spectrometers as well as high resolution transmission electron microscope (HRTEM), all confirmed the synthesis of CdS nanorods. An absorption peak at 385 nm was observed in the CdS nanorods suspension’s UV–Vis spectra which is the characteristic LSPR absorption peak of CdS nanorods. The presence of different functional groups, clearly demonstrated by FTIR spectroscopy, was responsible for the stabilization of the CdS nanorods with absorption band at 622 cm−1 is compatible to Cd-S stretching bond. The results of TEM study supported the findings of the DLS research by demonstrating that the particles are synthesized on the Nano scale with rod like morphology having crystallites sizes in the range of 2–10 nm. The X-ray diffraction investigation indicated sharp peaks that are consistent with the crystalline structure of CdS. Methylene blue’s (MB) degradation in a photocatalytic reactor at various pH values was used to test the nanorods’s photocatalytic performance and UV–Vis spectroscopy was used to track residual concentration. The performance of CdS nanorods as photocatalysts was enhanced by adjusting the pH of the solution while keeping the catalyst amount constant. From the analysis of pH change, it was observed that CdS nanorods exhibit a high effectiveness in degrading methylene blue. CdS nanorods’ band gap has a significant impact on their photocatalytic performance. Because of CdS’s narrow band gap, it is an effective visible light absorber, therefore CdS shows high degradation efficiency. The degradation efficiency of very small amount of catalyst at pH 4 and pH 10 after only 30 mins was about 32 % and 35 % respectively. This work can be very useful for the photo degradation of poisonous chemicals present in both industrial and domestic water.
5 Author's contributions
QA performed bench work and wrote the initial draft; SKC helped with characterizations; ZA was the major contributor in writing the manuscript; IU, FK and FUR helped in writing and analysis of data. MH supervised, conceived the idea and was a major contributor in writing the manuscript. All authors read and approved the final manuscript.
Funding
This research is funded by INTI International University, Malaysia.
Declaration of competing interest
The authors declare that they have no known competing financial interests or personal relationships that could have appeared to influence the work reported in this paper.
References
- Binding efficiency of functional groups towards noble metal surfaces using graphene oxide – metal nanoparticle hybrids. Colloids Surf. A Physicochem. Eng. Asp.. 2021;611:125858
- [Google Scholar]
- Comparative study of performance of CdS, CdSe thin filmCdS-PTh, CdSe-PTh nanocomposite thin films using SEM-EDXA (Scanning Electron Microscope) and FTIR (Fourier Transform Infrared Spectroscopy) Latin-Am. J. Phys. Edu.. 2010;4(3):22.
- [Google Scholar]
- Review on CdS-derived photocatalysts for solar photocatalytic applications – Advances and challenges. J. Ind. Eng. Chem. 2023
- [Google Scholar]
- AL-Mamoori, M.H., D.K. Mahdi, and S.M. Alshrefi. Synthesis and spectroscopic study of CdS nanoparticles using hydrothermal method. in AIP Conference Proceedings. 2018. AIP Publishing LLC.
- Successive photocatalytic degradation of methylene blue by ZnO, CuO and ZnO/CuO synthesized from coriandrum sativum plant extract via green synthesis technique. Crystals. 2023;13(2):281.
- [Google Scholar]
- Visible-light photocatalytic degradation of methylene blue with Fe doped CdS nanoparticles. Appl. Surf. Sci.. 2013;270:655-660.
- [Google Scholar]
- Fe2O3–nanoparticles, physical properties and their photochemical and photoelectrochemical applications. Chem. Bull.. 2009;54(68):1-8.
- [Google Scholar]
- Solar-light induced photodegradation of organic pollutants over CdS-pillared zirconium–titanium phosphate (ZTP) J. Mol. Catal. A Chem.. 2011;349(1–2):36-41.
- [Google Scholar]
- The photocatalytic oxidation of sulfur-containing organic compounds using cadmium sulfide and the effect on CdS photocorrosion. Water Res.. 1991;25(10):1273-1278.
- [Google Scholar]
- Effect of particle size on the photocatalytic activity of nanoparticulate zinc oxide. J. Nanopart. Res.. 2006;8(1):43-51.
- [Google Scholar]
- Optical studies of chemically synthesis CdS nanoparticles. Int. J. Mining Metall. Mech. Eng. (IJMMME) 2014:2.
- [Google Scholar]
- Photocatalytic decolorization of methylene blue in the presence of TiO2/ZnS nanocomposites. J. Hazard. Mater.. 2009;161(1):545-550.
- [Google Scholar]
- Surface characteristics of ZnS nanocrystallites relating to their photocatalysis for CO2 reduction1. Langmuir. 1998;14(18):5154-5159.
- [Google Scholar]
- Visible light induced photocatalytic degradation of methylene blue and rhodamine B from the catalyst of CdS nanowire. Chem. Phys. Lett.. 2017;684:126-134.
- [Google Scholar]
- Environmental applications of semiconductor photocatalysis. Chem. Rev.. 1995;95(1):69-96.
- [Google Scholar]
- Photoluminescence and photocatalysis of the flower-like nano-ZnO photocatalysts prepared by a facile hydrothermal method with or without ultrasonic assistance. Appl. Catal. B: Environ.. 2011;105(3):335-345.
- [Google Scholar]
- pH-controlled hydrothermal synthesis of submicrometer-sized CdS spheres with uniform size distribution. Bull. Kor. Chem. Soc.. 2010;31(12):3818-3821.
- [Google Scholar]
- Controlled synthesis of CdS nanorods and hexagonal nanocrystals. J. Mater. Chem.. 2003;13(10):2641-2648.
- [Google Scholar]
- Microwave hydrothermal synthesis of Sr2+ doped ZnO crystallites with enhanced photocatalytic properties. Ceram. Int.. 2014;40(2):2647-2653.
- [Google Scholar]
- Can we improve the record efficiency of CdS/CdTe solar cells? Sol. Energy Mater. Sol. Cells. 2006;90(15):2213-2220.
- [Google Scholar]
- Spectroscopic determination of the size of cadmium sulfide nanoparticles formed under environmentally relevant conditions. J. Environ. Monit.. 2010;12(4):890-897.
- [Google Scholar]
- Murray, C., D. Norris, and M. Bawendi, Synthesis and Characterization of Nearly M0nodisperse CdE (E: S, S e, Te) S emic0nduct0r NanocrystaUites. Am. Chem. Soc, 1993. 8706.
- Inhibition of photocorrosion of CdS via assembling with thin film TiO2 and removing formed oxygen by artificial gill for visible light overall water splitting. Appl. Catal. B: Environ.. 2017;212:129-139.
- [Google Scholar]
- Photocorrosion inhibition of CdS-based catalysts for photocatalytic overall water splitting. Nanoscale. 2020;12(3):1213-1223.
- [Google Scholar]
- Preparation of nanosized CdS particles using decomposition of P2S5 in a non-aqueous solvent. Chem. Commun.. 1996;10:1209-1210.
- [Google Scholar]
- Synthesis of cadmium sulfide in situ in reverse micelles and in hydrocarbon gels. J. Phys. Chem.. 1988;92(8):2282-2286.
- [Google Scholar]
- Ultrasensitive and highly selective gas sensors using three-dimensional tungsten oxide nanowire networks. Appl. Phys. Lett.. 2006;88(20):203101
- [Google Scholar]
- Enhancing the photocatalytic efficiency of sprayed ZnO thin films through double doping (Sn+F) and annealing under different ambiences. Appl. Surf. Sci.. 2014;321:310-317.
- [Google Scholar]
- Size effects in the excited electronic states of small colloidal CdS crystallites. J. Chem. Phys.. 1984;80(9):4464-4469.
- [Google Scholar]
- Excited electronic states and optical spectra of ZnS and CdS crystallites in the≊ 15 to 50 Å size range: Evolution from molecular to bulk semiconducting properties. J. Chem. Phys.. 1985;82(1):552-559.
- [Google Scholar]
- An insight into the binding behavior of graphene oxide and noble metal nanoparticles. J. Appl. Phys.. 2021;129(12)
- [Google Scholar]
- Interactive behavior of graphene quantum dots towards noble metal surfaces. Physica E. 2023;147:115596
- [Google Scholar]
- Recent studies on the catalytic activity of titanium, zirconium, and hafnium oxides. Catal. Rev.. 2003;45(2):205-296.
- [Google Scholar]
- Inhibitory effect of thioacetamide on CdS dissolution during photocatalytic oxidation of 2, 4-dichlorophenol. Chemosphere. 1995;30(7):1385-1399.
- [Google Scholar]
- Nanostructure CdS/ZnO heterojunction configuration for photocatalytic degradation of Methylene blue. Phys. B Condens. Matter. 2018;534:56-62.
- [Google Scholar]
- Electric field modulation of infrared absorption at room temperature in electrochemically self assembled quantum dots. J. Nanosci. Nanotechnol.. 2006;6(7):2077-2080.
- [Google Scholar]
- Optical properties of cadmium sulfide and lead (II) sulfide clusters encapsulated in zeolites. J. Phys. Chem.. 1987;91(2):257-260.
- [Google Scholar]
- Photocatalytic decomposition of halogenated organics over nanocrystalline titania. Nanostruct. Mater.. 1997;9(1–8):583-586.
- [Google Scholar]
- Quantum size effects of in situ generated colloidal cadmium sulfide particles in dioctadecyldimethylammonium chloride surfactant vesicles. J. Phys. Chem.. 1987;91(4):854-861.
- [Google Scholar]
- Effect of CdS distribution on the photocatalytic performance of resin-CdS nanocomposites. Chem. Eng. J.. 2011;174(1):351-356.
- [Google Scholar]
- Semiconductor photocatalysis. ZnS-nanocrystallite-catalyzed photooxidation of organic compounds. Bull. Chem. Soc. Jpn.. 1995;68(7):1811-1823.
- [Google Scholar]
- Luminescent and photocatalytic properties of cadmium sulfide nanoparticles synthesized via microwave irradiation. Mater. Chem. Phys.. 2005;90(1):155-158.
- [Google Scholar]
- Role of particle size in nanocrystalline TiO2-based photocatalysts. J. Phys. Chem. B. 1998;102(52):10871-10878.
- [Google Scholar]
- Photocatalytic oxidation for indoor air purification: a literature review. Build. Environ.. 2003;38(5):645-654.
- [Google Scholar]
Appendix A
Supplementary material
The supplementary information includes Zeta potential of CdS nanorods. Supplementary data to this article can be found online at https://doi.org/10.1016/j.arabjc.2023.105422.
Appendix A
Supplementary material
The following are the Supplementary data to this article:Supplementary data 1
Supplementary data 1


