

Translate this page into:
Cd-CeO2@C: Synthesis via consumption of Cd2+ and organic pollutants and removal of organic pollutants
⁎Corresponding author. sky54@zjnu.cn (Shiyou Hao)
-
Received: ,
Accepted: ,
This article was originally published by Elsevier and was migrated to Scientific Scholar after the change of Publisher.
Abstract
In this study, a Cd-CeO2@C photocatalyst was produced via the calcination of a precursor (Cd-Ce(OH)4@AR14) obtained by co-precipitation of Ce(NO3)3·6H2O, Cd(NO3)2·4H2O and acid red 14 (AR14). The structure, composition, morphology, and optical properties of the synthesized products were characterized by X-ray diffraction (XRD), scanning electron microscopy (SEM), infrared spectrum (FT-IR), Ultraviolet–Visible Diffuse Reflectance Spectroscopy (UV–Vis DRS), X-ray photoelectron spectroscopy (XPS) and Photoluminescence Spectroscopy (PL). The photocatalytic activity of the synthetized materials was evaluated by performing the degradation of AR14. The results showed that the band gap of CeO2 could be effectively reduced by Cd-doping, and that carbon bonds could decrease the recombination rate of photogenerated electrons and holes, resulting in enhancing the photocatalytic efficiency of the synthesized materials compared with that of pure CeO2. Hydroxyl groups play an important role in the photocatalysis because the adsorption of AR14 over Cd-CeO2@C is greatly affected by the content of hydroxyl groups. Moreover, effect of oxygen vacancies on the photocatalytic efficiency was investigated and the results showed that oxygen vacancies could improve the photocatalytic efficiency of the resulted samples.
Keywords
Organic dyes
Heavy metal ions
Cd-CeO2@C
Carbon bond
Photocatalysis

1 Introduction
Nowadays, synthetic dyes are widely used in textile, leather, coating, dyeing and other industries. As a result, a large volume of dye-containing wastewater not thoroughly treated are emitted to the environment, causing serious harm (Bilińska et al., 2016). At present, adsorption (Bello et al., 2015), membrane filtration (Rashidi et al., 2015), biodegradation (Elumalai et al., 2021), chemical oxidation (Yao et al., 2016), etc, have been used to remove dyes wastewater. However, these methods have some disadvantages, such as high cost, complex plant design and operation, long processing cycle, probable secondary pollution, etc. It is reported that photocatalysis technology could degrade organic pollutants through the activity of radical species such as hydroxyl radical, superoxide radical, and photogenerated holes. Recently, many researchers have focused their attention on photocatalysis and piezo-photocatalysis due to its low cost, environmental compatibility, and efficient removal of pollutants (Bueno-Alejo et al., 2021, zhang et al., 2022, wang et al., 2023). At present, the most used photocatalysts are TiO2, ZnO, CeO2, WO3 etc. (Zhuang et al., 2017, Kumar et al., 2021, Fang et al., 2015, Tahir et al., 2019).
Among them, CeO2 has attracted much attention due to its unique 4f electronic structure, high chemical stability, strong redox ability, and easy occurrence of oxygen vacancies (Fang et al., 2015, Subramanyam et al., 2020). However, the application of pure CeO2 is limited due to its wide band gap (about 3.2 eV), low utilization of visible light and low carrier mobility (Zeng et al., 2015). The photocatalytic efficiency of CeO2 can be improved by modifying its structure with several techniques, such as doping with metal or non-metal ions, precious metal deposition, formation of complexes etc. (Ma et al., 2019). Some studies have shown that doping CeO2 with ions can accelerate the charge separation and expand the light absorption spectral range, which is an effective way to improve the photocatalytic efficiency of semiconductors (Miao et al., 2016). Gnanam et al. found that Cd2+ doping can effectively improve the degradation rate of organic dyes (Gnanam and Rajendran, 2018). Later, Murugadoss et al. investigated the effect of doping with different metal ions on the photocatalytic efficiency of CeO2 and furtherly proved the effect of Cd2+ (Murugadoss et al., 2019). Although Cd2+-doping can change the band gap of ceria and improve the utilization of the adsorbed light energy, such a photocatalyst is still not ideal for adsorbing pollutants and improving the separation efficiency of photogenerated electrons and holes. It was reported that combining the ceria with carbon-based materials could effectively accelerate the electron-hole separation rate because of the carbon bonds formed in the catalyst (Qian et al., 2018). Xu et al. combined CeO2 with graphite carbon nitride (g-C3N4) by means of a one-pot hydrothermal synthesis process and found that: (i) C-doping could effectively improve the utilization of sunlight and the reduction ability of photogenerated electrons; (ii) low loading of carbon could effectively promote the migration of photogenerated electrons and improve the specific surface area of materials (Xu et al., 2021). Another ceria/carbon-based photocatalyst, CeO2/rGO (rGO: reduced graphene oxide) was synthesized by Murali et al., who reported that its photocatalytic efficiency was significantly improved because rGO acts as an electron acceptor and effectively promotes the separation and transmission of electron-hole pairs (Murali et al., 2019).
It was also reported that the photocatalytic efficiency could be further improved by introducing C and Cd into the photocatalysts at the same time. Azqhandi et al. synthesized Cd2+ doped ZnO/CNT (CNT: carbon nanotubes) composites by a microwave-assisted hydrothermal method. The resulted composite showed a high photocatalytic degradation efficiency of methylene orange due to its efficient adsorption behavior, unique mesoporous surface of CNT and lower band gap (Azqhandi et al., 2017). Karimi et al. prepared a new photocatalyst (NiO/Cd/g-C3N4) by microwave-assisted method. The material showed excellent activity for the degradation of methylene blue, mainly attributed to its low band gap, improved photogenerated electron-hole separation efficiency, and good visible light absorption (Karimi et al., 2020). Based on the above data, it can be inferred that the photocatalysis efficiency of CeO2 can be further improved by introducing C and Cd at the same time. However, the scalability of the catalyst production can be hampered by the fact that the most used carbon sources are commercial ones (such as carbon nanotubes, graphene, g-C3N4, etc.), that results in high costs and weak carbon-ceria adhesion (Wang et al., 2020). In addition, Cd is usually introduced in the form of chemicals, which can further increase the synthesis cost and easily cause heavy metals pollution. In this frame, the possibility of using raw materials recovered from waste, with the aim of both finding a simple way to efficiently introduce C and Cd into CeO2 and keeping the synthesis cost low, appears very appealing. Interestingly, some research report that wastewater containing dyes can often contain heavy metal ions such as Cd2+, Ni2+, Cu2+ (Velusamy et al., 2021). Using such wastewater for the preparation of photocatalysts would hit the double target of lowering the synthesis cost while recycling a waste. Based on this assumption, a Cd-CeO2@C photocatalyst was synthesized starting from acid red 14 (AR14, used as C source) and cadmium nitrate tetrachloride (used as Cd source), selected as simulant of typical pollutants present in dye industry wastewaters. The catalyst was produced (Fig. S1) via calcination under N2 atmosphere of a precursor (Cd-Ce(OH)4@AR14) obtained by inducing a coprecipitation in a Ce3+, Cd2+ and AR14 solution. The obtained mixture consists of Ce(OH)4 and Cd(OH)2 crystals coated by a layer of AR14, so that, after calcining the precursor, Cd2+ is uniformly distributed in the final product, and the carbon layer is wrapped on its surface. The performance of the photocatalyst was evaluated by the degradation of AR14. The results showed that the photocatalytic efficiency of Cd-CeO2@C was greatly improved due to the formation of a large number of carbon bonds and oxygen vacancies.
2 Experimental
2.1 Chemicals and synthesis
Cerium nitrate hexahydrate (Ce(NO3)3·6H2O), potassium iodide (KI), terephthalic acid (PTA), absolute ethanol (C2H6O) were purchased from Shanghai Guoyao Reagent Co., Ltd.. Cadmium nitrate tetrahydrate (Cd(NO3)2·4H2O) was purchased from Shanghai Jinshanting New Chemical Reagent Factory. Acid Red 14 (AR14, analytical grade) was purchased from Nanjing Chemical Reagent Co., Ltd. 28% ammonia solution (NH3·H2O) was purchased from Zhejiang Hannuo Chemical Technology Co., Ltd. P-benzoquinone (BQ, analytical grade) was purchased from Shanghai Puzhen Biotechnology Co., Ltd. All the chemicals were used without further purification.
The synthesis of Cd doped CeO2 can be described as follows. 1 g of a mixture of Ce(NO3)3·6H2O and a small amount of Cd(NO3)2·4H2O (0.1%, 0.5% and 1%, respectively) was dissolved in 50 mL of deionized water. After stirring for 30 min to dissolve the salts, the pH of the solution was adjusted to 9 by adding NH3·H2O, and then the solution was kept under stirring for 1 h and aged for 3 h. The precipitate (Cd-Ce(OH)4) was then recovered by filtration, washed three times with water and ethanol, and dried at 60 ℃ for 2 h. Finally, the precursor was calcined in N2 at 600 °C for 2 h to synthesize the resulted composite, which was labeled, depending on the Cd content, as 0.1%Cd-CeO2, 0.5%Cd-CeO2, 1%Cd-CeO2, respectively.
The preparation process of 0.5%Cd-CeO2-0.01C, 0.5%Cd-CeO2-0.02C, 0.5%Cd-CeO2-0.03C followed the same route, except that 1 g of Ce(NO3)3·6H2O and 0.5%Cd(NO3)2·4H2O are dissolved in AR14 solutions at different concentrations (0.01, 0.02 and 0.03 mM).
2.2 Characterization
The X-ray diffraction pattern (XRD) was acquired on a Philips PW3040/60 powder diffractometer using Cu Kα (λ = 0.15406 nm) radiation at 40 kV and 40 mA, over a 2θ interval ranging from 20° to 80°. The elements distribution of the samples was obtained on Hitachi S-4800 scanning electron microscope under the following test conditions: 10 mA current, 5 kV acceleration voltage, and 8 mm workbench height. The Fourier transform infrared spectroscopy (FT-IR) spectra were recorded by a Nicolet Nexus 670 spectrometer with a resolution of 4 cm−1 using the KBr pellet method. The solid-state UV–vis DRS was measured by Cary 5000, under a 200–800 nm measurement range. The photoluminescence spectra (PL) were obtained on a Hitachi F-7000 fluorescence spectrophotometer equipped with a commercial 980 nm NIR laser. The electrochemical tests were carried out with a CH Instruments CHI660D electrochemical station in a standard three electrode configuration. X-ray photoelectron spectroscopy (XPS) data was obtained on a Perkin Elmer PHI-5000C ESCA instrument with a sample surface carbon C 1 s (284.8 eV) as internal standard, Al K (E = 1486.5 eV) as excitation source, and 2 × 10⁻⁹ mbar as base pressure. The measurements of N2 adsorption–desorption were performed on a Micromeritics ASAP 2020 apparatus at −196 °C, and the specific surface areas of the investigated samples were calculated using the multiple-point Brunauer-Emmett-Teller (BET) method.
2.3 Photocatalysis experiment
The photocatalytic activity of various samples was evaluated by the degradation of AR14. Accordingly, 0.02 g of catalyst was evenly dispersed in 20 mL of 0.15 mM AR14 aqueous solution. The suspensions were first placed in the dark and kept in agitation in a magnetic stirring for 30 min to reach the adsorption–desorption equilibrium. Then a 300 W mercury lamp (λ = 380 ∼ 800 nm) was used as visible light source to irradiate the suspension for 2 h. Every 30 min, 3 mL solution was taken out and centrifuged to remove the photocatalyst. The residual AR14 levels in the filtrates were then analyzed by recording the variations of the absorbance at 516 nm with a UV–vis spectrophotometer (Evolution 500 LC). The degradation rate of AR14(η) was calculated according to Equation (1).
where C0 and C are the concentration of AR14 solution before and after photocatalysis, respectively. The concentration of AR14 before and after photocatalysis has been obtained according to the Lambert-Beer law: A = εbc (ε: absorption coefficient, b: width of cuvette, C: concentration of AR14).
3 Results and discussion
3.1 Structural and morphological characterization
Fig. 1 shows the XRD patterns of CeO2, CeO2-0.02C, 0.5%Cd-CeO2 and 0.5%Cd-CeO2-0.02C. According to Fig. 1, the diffraction peaks of all samples correspond to the pattern of CeO2 with cubic fluorite structure (JCPDS no. 43-1002). No carbon peak is found in the XRD of CeO2-0.02C, which may be caused by the amorphous structure of carbon. The XRD pattern of Cd-doped samples did not show any significant difference, indicating that Cd2+ effectively enters CeO2 lattice and partially replaces Ce4+ cations (Gnanam and Rajendran, 2018, Phattranit et al., 2021). In addition, it can be seen from Fig. 1 that the XRD peak intensity of the samples decreased, and the peak position of (1 1 1) crystal plane shifted slightly to a higher angle after doping with Cd2+. This indicates that when Cd2+ (0.074 nm) replaces Ce4+ (0.092 nm) (Yao et al., 2015, Zhu et al., 2017), the crystal face is depressed and the interplanar spacing becomes smaller, which is consistent with Bragg's law (2dsinθ = nλ), so the diffraction peak shifts to a high diffraction angle (Qi et al., 2019).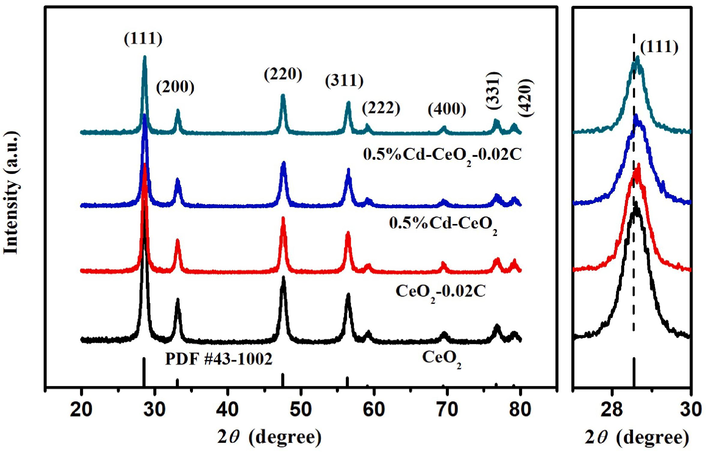
XRD patterns of CeO2, CeO2-0.02C, 0.5%Cd-CeO2, and 0.5%Cd-CeO2-0.02C.
The FT-IR spectra of CeO2 and doped CeO2 samples, acquired to determine the surface functional groups of the different catalysts, are shown in Fig. 2. It can be seen from Fig. 2 that all samples have evident bands near 500, 1105, 1395, 1640, 3430 cm−1, of which the bands near 500 cm−1 are caused by the vibration of Ce-O, Cd-O and Ce-O-Ce, while the characteristic absorption band at 1105 cm−1 can be attributed to the vibration of non-bridging Ce-O and Cd-O (Syed et al., 2021). The bands at 3430 and 1640 cm−1 are related to the O–H vibration in surface adsorbed water (Gnanam and Rajendran, 2018, Murugadoss et al., 2019). The weak band at 1395 cm−1 may be caused by the absorption of CO2 from the atmosphere (Syed et al., 2021, Wang et al., 2017).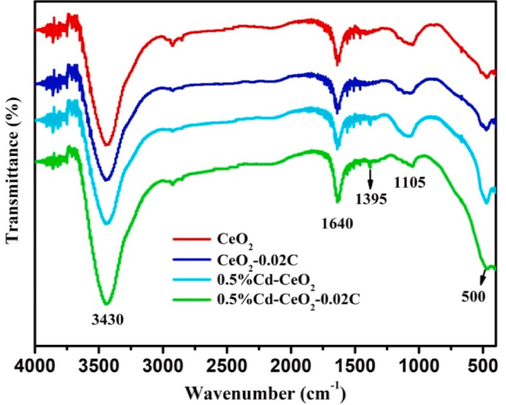
FT-IR spectra of different catalysts.
Field emission scanning electron microscopy (SEM) of 0.5%Cd-CeO2-0.02C is illustrated in Fig. S2, from which it can be seen that the synthesized product exhibits irregular blocky morphology. Other samples have similar morphology to that of 0.5%Cd-CeO2-0.02C (not shown). Element distribution and EDS spectra of 0.5%Cd-CeO2-0.02C are shown in Fig. 3. According to Fig. 3 (a)-(d), it can be found that 0.5%Cd-CeO2-0.02C does contain C, O, Ce, Cd, and that all the elements are evenly distributed in the catalyst. It can be seen from Fig. 3 (e) that the mass ratio and atomic percentage of Cd in the sample are close to the theoretical value of 0.86% and 0.51%, respectively. The mass ratio and atomic percentage of C are 0.88% and 4.84%, respectively, which proved that the adsorbed dye was indeed converted into carbon after calcination. The distribution of elements in other carbon containing samples are similar to that of 0.5%Cd-CeO2-0.02C (not shown).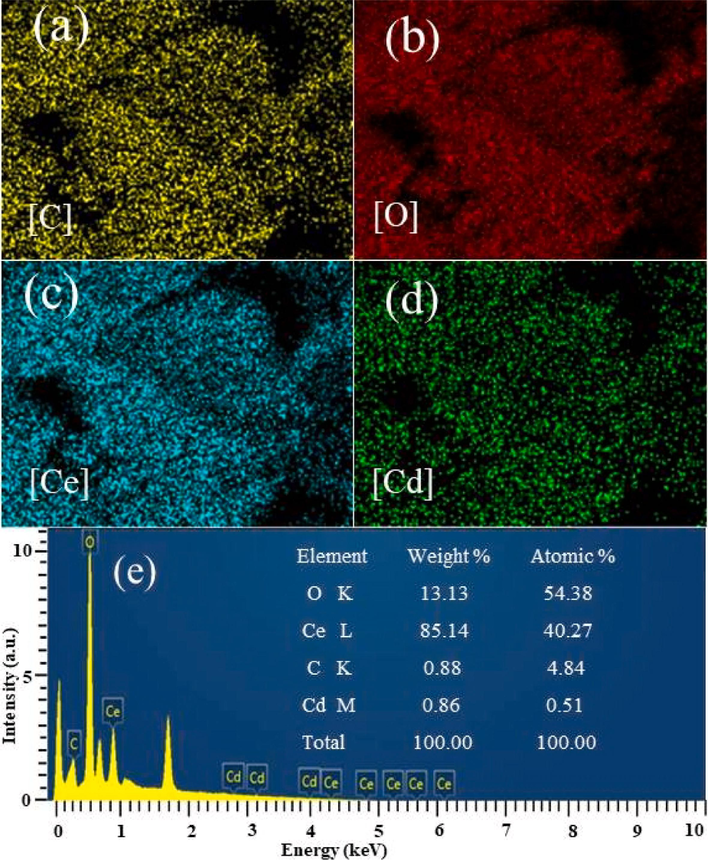
Element distribution and EDS spectra in 0.5%Cd-CeO2-0.02C.
The Cd 3d XPS spectra of samples 0.5%Cd-CeO2-0.01C, 0.5%Cd-CeO2-0.02C, 0.5%Cd-CeO2-0.03C and 0.5%Cd-CeO2 are shown in Fig. 4. According to Fig. 4, all samples have obvious peaks near 404 and 411 eV, corresponding to the spin of Cd 3d5/2 and 3d3/2, respectively (Shanmugam et al., 2019), which proves that Cd2+ successfully entered the CeO2 framework, in agreement with the findings obtained from Fig. 3 (d).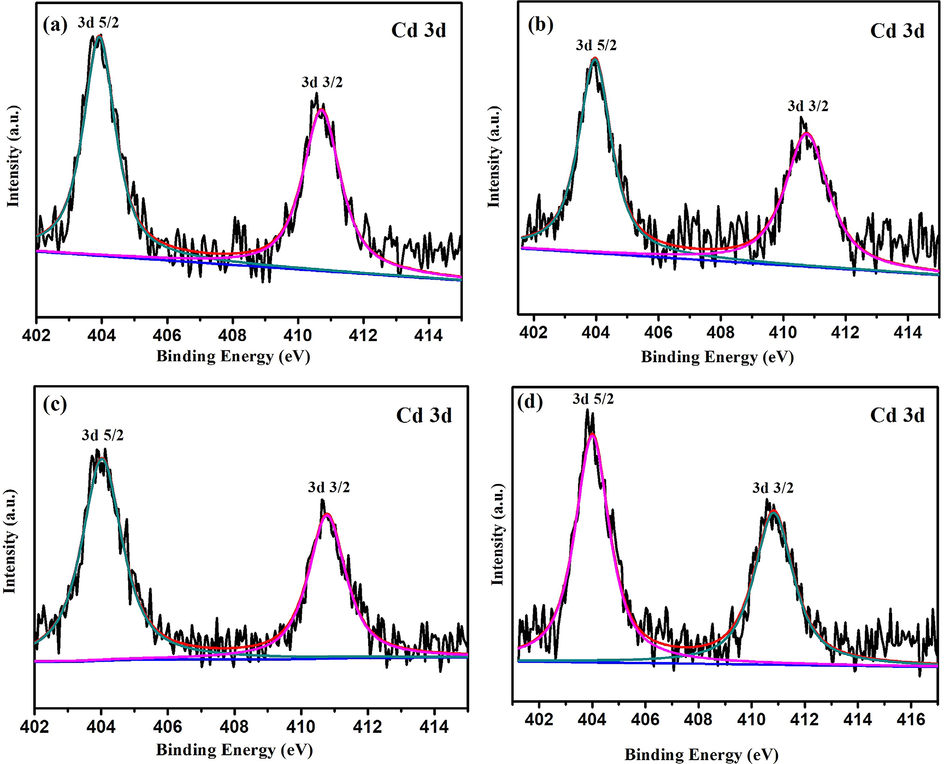
Cd 3d deconvolution XPS spectra of (a) 0.5%Cd-CeO2-0.01C, (b) 0.5%Cd-CeO2-0.02C, (c) 0.5%Cd-CeO2-0.03C, (d) 0.5%Cd-CeO2.
3.2 Photocatalytic degradation tests
The results of AR14 photocatalytic degradation tests are shown in Fig. 5. The curves clearly show that the presence of a small amount of Cd is favorable to improve the photocatalytic efficiency of CeO2. The possible reason is that oxygen vacancies are formed on the surface of the sample after Cd2+ replaces Ce3+ or Ce4+ in CeO2 lattice (see O 2p XPS diagram for details). These oxygen vacancies can easily entrap the photogenerated electrons, reducing the recombination rate of photogenerated electron-hole pairs. As a result, the doped Cd catalysts showed a better catalytic efficiency than that of pure CeO2. The improvement in the photocatalytic efficiency reaches a maximum for a 0.5% Cd loading, while the 1% Cd sample shows a worse performance. PL tests were carried out to further investigate this effect. The results, shown in Fig. 5 (b), indicate a trend in the PL intensity of the catalysts consistent with that of the photocatalytic degradation tests (Fig. 5 (a)), which proves that Cd doping can indeed inhibit the recombination of photogenerated electrons and holes. As a matter of fact, the intensity of the peak at 435 nm in the PL spectrum (caused by the recombination of conduction band electrons and holes (Choudhary et al., 2020)) is reduced after Cd-doping. The peak intensity of 0.5%Cd-CeO2 is the lowest, indicating that with 0.5% Cd-doping the best separation efficiency of photogenerated electrons and holes, and then the highest photocatalytic activity, is obtained. In addition, it can be seen from Fig. 7 that doping of Cd promotes the absorption of light, increasing the yield of photogenerated electrons and thus the photocatalytic efficiency.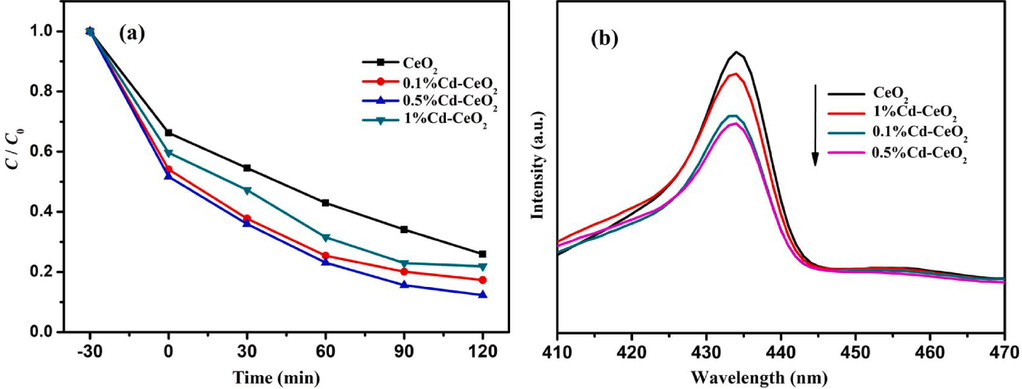
Photocatalytic degradation efficiency of AR14 (a) and photoluminescence spectra (b) of CeO2, 0.1%Cd-CeO2, 0.5%Cd-CeO2 and 1%Cd-CeO2.
After finding the optimal amount of Cd, to evaluate the influence of C content on the photocatalytic efficiency, different catalysts have been synthesized introducing different amounts of AR14 into 0.5%Cd-CeO2: 0.5%Cd-CeO2-0.01C, 0.5%Cd-CeO2-0.02C, 0.5%Cd-CeO2-0.03C. The photocatalytic activities of the obtained catalysts are shown in Fig. 6 (a) and the results demonstrate that the introduction of C has a great impact on the catalyst activity. Also in this case the amount of C has an optimal value: according to Fig. 6 (b), 0.5%Cd-CeO2-0.02C promoted an effective degradation of AR14 because the characteristic peaks of this dye (benzene ring vibration peak at 1504 and 1604 cm−1, sulfonic acid group (-SO3H) vibration peak at 1198 and 1277 cm−1) (Hao et al., 2016) are not found on the recovered catalyst, that shows the same infrared spectrum of the fresh one. From the results of specific surface area (SBET), it can be found that introducing of C is helpful for the improvement of SBET because SBET of 0.5%Cd-CeO2, 0.5%Cd-CeO2-0.01C, 0.5%Cd-CeO2-0.02C, 0.5%Cd-CeO2-0.03C are 8.6, 46.5, 53.1, 43.6 m2/g, respectively. Generally, the higher SBET, the greater the adsorption capacity. Therefore, introducing of C is benefit to improve the photocatalytic efficiency of the resulted samples.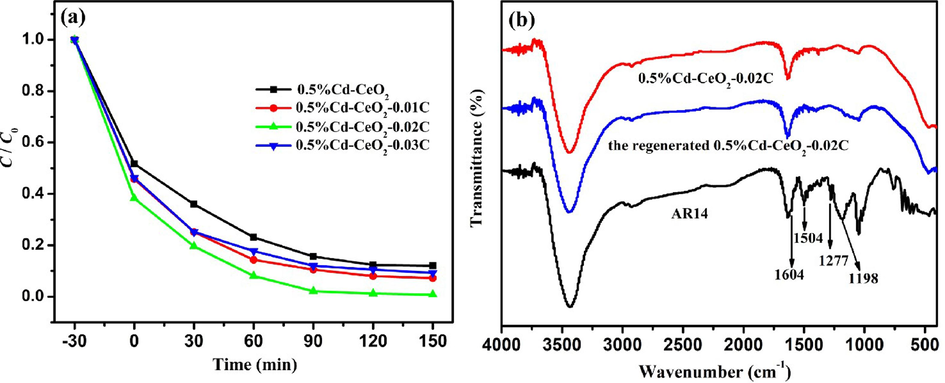
Photocatalytic degradation efficiency of AR14 by 0.5%Cd-CeO2, 0.5%Cd-CeO2-0.01C, 0.5%Cd-CeO2-C0.02, 0.5%Cd-CeO2-0.03C (a) and FT-IR spectra of AR14 and 0.5%Cd-CeO2-0.02C (before and after photodegradation) (b).
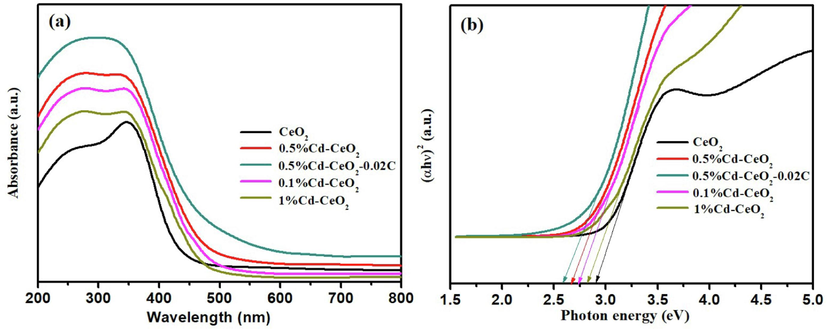
Diffuse reflectance UV–vis spectra (a), optical absorption edges (b) of different catalysts.
It is obvious from Fig. S3 (a) that pH value has a great effect on the photocatalytic efficiency of AR14 over 0.5%Cd-CeO2-0.02C and that the photocatalytic efficiency decrease gradually with increase of pH value. The reason may be that acidic media is conducive to the protonation of hydroxyl groups on the surface of 0.5%Cd-CeO2-0.02C, which is helpful for improving the adsorption of AR14 due to the formation of electrostatic interactions between the sulfonic acid group in AR14 and the protonated hydroxyl groups on the surface of photocatalyst. It can be seen from Fig. S3 (b) that the photocatalytic efficiency decrease gradually with increase of AR14 dosage.
The reuse performance of 0.5%Cd-CeO2-0.02C is shown in Fig. S4 (a). It can be seen from Fig. S4 (a) that the photocatalytic efficiency of AR14 for 0.5%Cd-CeO2-0.02C remains basically unchanged after 5 times of repeated use, implying that the photocatalyst has a good reusability. It can be concluded from Fig. S4 (b) that 0.5%Cd-CeO2-0.02C has a high stability because the structure of the fresh photocatalyst is similar to that of after 5 photocatalytic cycles.
3.3 Study of the photocatalytic mechanism
The UV–vis diffuse reflectance spectra of CeO2, 0.1%Cd-CeO2, 0.5%Cd-CeO2, 1%Cd-CeO2 and 0.5%Cd-CeO2-0.02C is shown in Fig. 7 (a). According to Fig. 7 (a), it can be found that, after Cd-doping, the sample not only increases the absorption of UV radiation, but also extends the absorption band to a higher wavelength limit, making the Cd-doped samples sensitive to visible light, and thus resulting in the improvement of light absorption efficiency. The band gap of each sample can be estimated by extrapolating the linear region of the plot of (αhν)2 versus hν (Murugadoss et al., 2019). According to the results, shown in Fig. 7 (b), the optical band gap energies of the doped samples are lower than that of CeO2, which leads to the improvement of their photocatalytic efficiency.
Photoluminescence and photocurrent techniques are usually used to investigate the separation of photogenerated electrons and holes. Fig. 8 (a) shows the photoluminescence spectra of CeO2, 0.5%Cd-CeO2, 0.5%Cd-CeO2-0.01C, 0.5%Cd-CeO2-0.02C, 0.5%Cd-CeO2-0.03C. According to Fig. 8 (a), the photoluminescence intensity of 0.5%Cd-CeO2 decreases after introduction of C, indicating that the recombination rate of photogenerated electrons and holes is reduced, which improves the lifetime of photogenerated carriers (Wang et al., 2020). Fig. 8 (a) suggests that the separation efficiency of photogenerated electrons and holes increases along the following sequence: 0.5%Cd-CeO2-0.02C, 0.5%Cd-CeO2-0.01C, 0.5%Cd-CeO2-0.03C, 0.5%Cd-CeO2, CeO2. To prove this evidence, photocurrent experiments were carried out and the results are shown in Fig. 8 (b). Generally, the higher the photocurrent intensity, the higher the separation efficiency of photogenerated electrons and holes (Xu et al., 2020). According to Fig. 8 (b), the behavior of all samples is also consistent with the photoluminescence results. Moreover, being the highest photocurrent intensity for 0.5%Cd-CeO2-0.02C, it can be found that the photocatalytic efficiency of 0.5%Cd-CeO2 is further improved after introduction of C.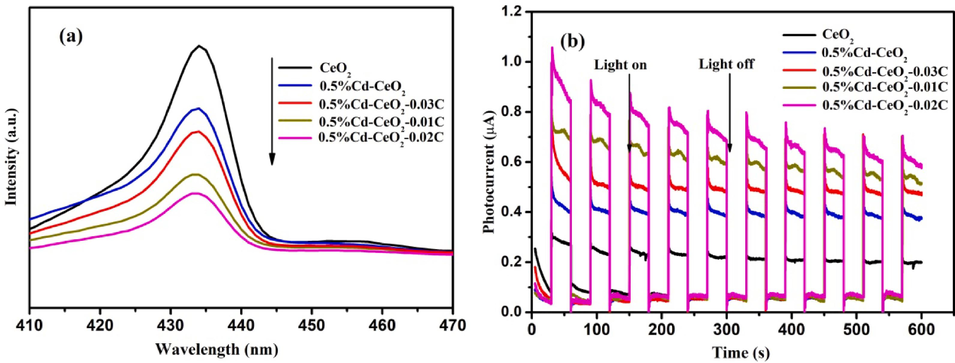
Photoluminescence spectra (a) and photocurrent spectra (b) of different catalysts.
Several important information, such as elemental composition and chemical state of the sample surface, can be investigated by X-ray photoelectron spectroscopy (XPS). Therefore, XPS tests were carried out for 0.5%Cd-CeO2-0.01C, 0.5%Cd-CeO2-0.02C, 0.5%Cd-CeO2-0.03C and 0.5%Cd-CeO2, respectively. Fig. 9 shows the C 1 s XPS spectra of different samples. All samples have evident peaks at 284.0, 284.4, 284.9, 286.2 and 288.3 eV, which can be attributed to C = C, C–C, C-OH, C = O and O = C-O bonds (Pérez-González and Tomás, 2021), indicating that the carbon deriving from the dye pyrolysis is successfully combined with the matrix. The formation of carbon bond is beneficial to the transmission of photogenerated electrons, thus improving the separation efficiency of photogenerated electrons and holes and enhancing the photocatalytic efficiency (Ye et al., 2019). Because the formation of a large number of carbon bonds can promote the separation of photogenerated electrons and holes, the PL intensity of the corresponding synthetic products decreases and the photogenerated current intensity increases. The carbon bond peak areas of 0.5%Cd-CeO2-0.01C, 0.5%Cd-CeO2-0.02C and 0.5%Cd-CeO2-0.03C are shown in Table 1. The results are, once again, consistent with the photocatalytic data. In fact, the total carbon bond peak area, and so the number of C bonds, of 0.5%Cd-CeO2-0.02C is the largest, according to the best photocatalytic activity showed by this sample, and the same holds for the other two samples. It can be seen from table 1 that the peak areas of O = C-O and O = C in 0.5%Cd-CeO2-0.02C are higher than those in 0.5%Cd-CeO2-0.01C and 0.5%Cd-CeO2-0.03C, which may be explain the fact that introducing moderate AR14 in the precursor can increase the number of carbon bonds and thus improve the photocatalytic efficiency of the resulted sample.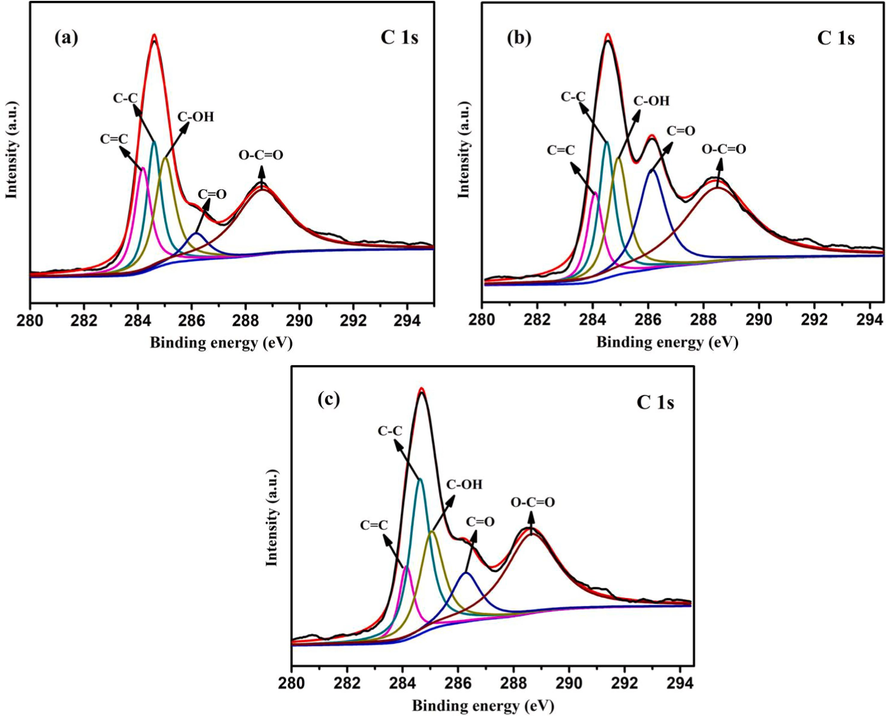
C 1 s XPS spectra of (a) 0.5%Cd-CeO2-0.01C, (b) 0.5%Cd-CeO2-0.02C, (c) 0.5%Cd-CeO2-0.03C.
Peak Type
C–C
C = C
C-OH
C = O
O-C = O
Total area
Sample
0.5%Cd-CeO2-0.01C
3677.49
3933.81
4506.54
1412.46
7504.21
21034.51
0.5%Cd-CeO2-0.02C
2585.99
4093.24
4257.85
5170.67
9356.37
25464.12
0.5%Cd-CeO2-0.03C
1492.26
4247.15
3194.82
1941.13
5709.20
16584.56
Fig. 10 shows the Ce 3d XPS spectra of different samples. The spectra have been deconvoluted into a total of 10 peaks. In order to determine the specific valence of Ce (Ce3+ and Ce4+), the multiple state splitting of the spin orbitals of Ce 3d3/2 and Ce 3d5/2 were labeled as U and V. It is reported that the peaks marked V0, V', U0, U' belong to Ce3+, and the peaks marked U, V, U'', V'', U''', V''' belong to Ce4+ (Zarkov et al., 2017). According to the fitting results, such peaks appear in the Ce 3d XPS spectra of all samples, revealing that Ce3+ and Ce4+ are always present. It is reported that the presence of Ce3+ can produce charge imbalance, vacancy and unsaturated chemical bands on the catalyst surface, resulting in the change of O (1 s) chemical state and the increase of oxygen chemisorption, that leads to the formation of active species to degrade organic pollutants (Gao et al., 2010, Yang et al., 2006). Therefore, the higher the proportion of Ce3+ in the sample, the better the photocatalytic activity. The peak area and content of Ce3+ in different photocatalysts are presented in Table 2. It can be seen from Table 2 that the Ce3+ content of 0.5%Cd-CeO2-0.02C is the highest, leading to the highest oxygen vacancy concentration and thus the highest photocatalytic efficiency. According to the data in Table 2, the order of Ce3+ content in each catalyst is consistent with its photocatalytic efficiency, which further proves the important role of Ce3+ in photocatalytic efficiency. Ce3+ content is calculated by the following formula (where Ui and Vi represent the relevant peak area):
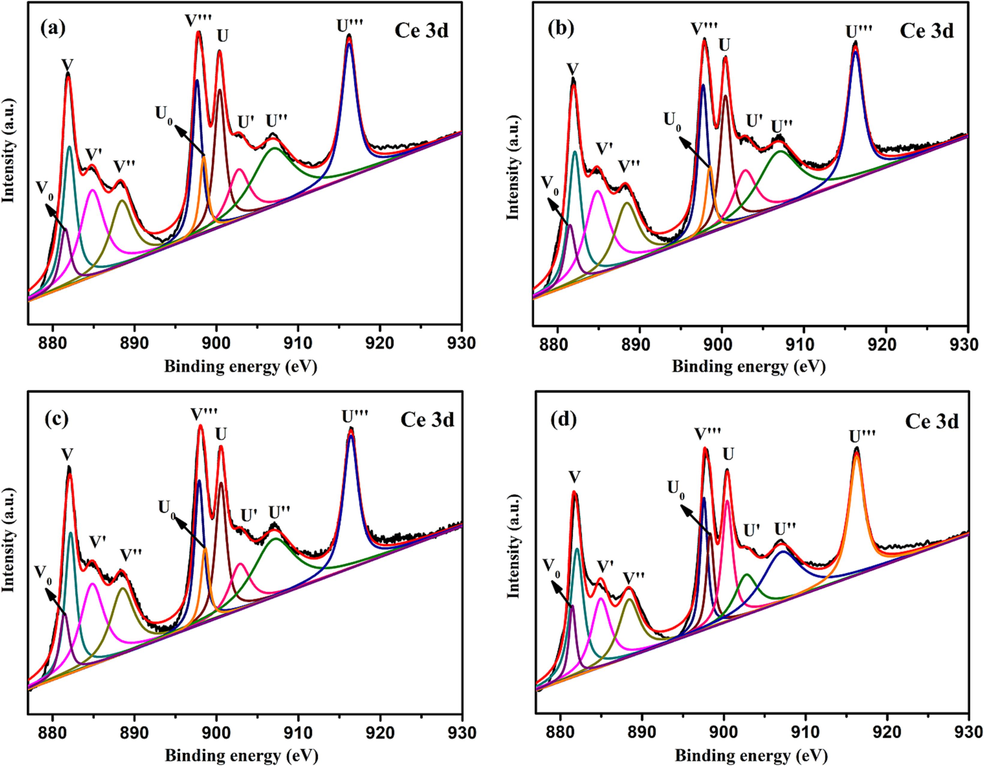
Ce 3d XPS spectra of (a) 0.5%Cd-CeO2-0.01C, (b) 0.5%Cd-CeO2-0.02C, (c) 0.5%Cd-CeO2-0.03C and (d) 0.5%Cd-CeO2.
Peak Type
V0
V'
U0H
U'
Total area
Content of
Ce3+
Sample
0.5%Cd-CeO2-0.01C
33858.1
117362.1
34279.8
60815.0
851060.9
28.9%
0.5%Cd-CeO2-0.02C
37087.1
118703.6
31799.2
65960.0
861913.7
29.4%
0.5%Cd-CeO2-0.03C
30137.1
96580.0
30412.4
47264.7
716229.5
28.5%
0.5%Cd-CeO2
20222.1
52259.6
29335.9
36983.7
504964.7
27.5%
Fig. 11 shows the O1s XPS spectra of different photocatalysts. All samples have peaks at binding energies of about 529, 531 and 533 eV, which can be attributed to lattice oxygen (OI), surface hydroxyl oxygen (OII) and bridging oxygen (OIII) in metal oxides (Qian et al., 2017, Jilani et al., 2021). According to the peak area ratio of the three oxygen species, the relative percentages of the three oxygen species can be quantified, which is shown in Table 3. From the data in Table 3, it can be found that the proportion of lattice oxygen decreases, while the proportion of hydroxyl oxygen and bridging oxygen increases after introduction of carbon. The increase of hydroxyl oxygen content leads to the improvement of the adsorption efficiency of photocatalyst for organic pollutants, resulting in the improvement of photocatalysis efficiency. It can be concluded from the values in Table 3 that the hydroxyl oxygen content of each sample is related to its photocatalytic efficiency. The hydroxyl oxygen content of sample 0.5%Cd-CeO2-0.02C is the highest, confirming once again its role in the photocatalysis process.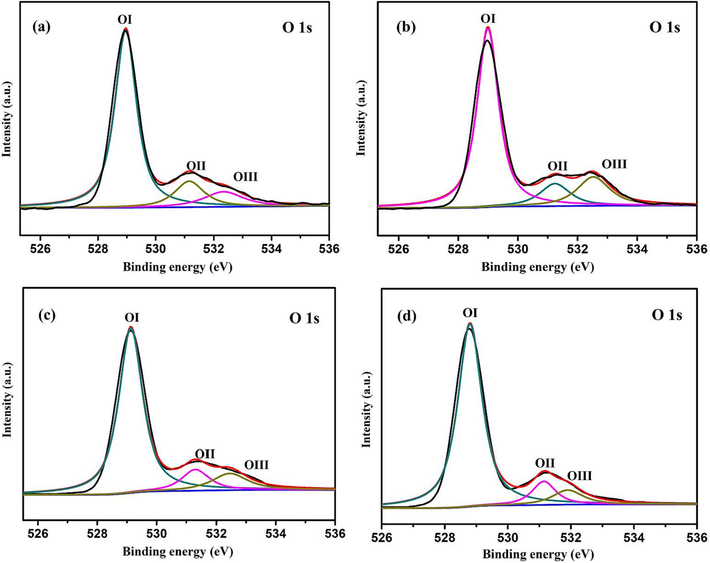
O 1 s XPS spectra of (a) 0.5%Cd-CeO2-0.01C, (b) 0.5%Cd-CeO2-0.02C, (c) 0.5%Cd-CeO2-0.03C and (d) 0.5%Cd-CeO2.
Peak Type
OI
OII
OIII
Sample
0.5%Cd-CeO2-0.01C
74.71%
12.66%
12.63%
0.5%Cd-CeO2-0.02C
69.40%
14.86%
15.74%
0.5%Cd-CeO2-0.03C
76.91%
11.41%
11.68%
0.5%Cd-CeO2
81.46%
10.35%
8.20%
From the results of Fig. S5 and S6, it can be concluded that hydroxyl radical is mainly responsible for the degradation of AR14. Based on the above experimental results and analysis, the photocatalytic degradation mechanism of AR14 over Cd-CeO2@C is illustrated and presented in Fig. S7.
4 Conclusion
In this study, Cd2+, Ce3+ and AR14 were used as raw materials to synthesize Cd-Ce(OH)4@AR14 precursor by a coprecipitation method, and Cd-CeO2@C was obtained via the calcination of the precursor in inert atmosphere. The results of photocatalysis tests showed that Cd-CeO2@C with a proper amount of Cd and C has a high photocatalytic efficiency, and the main reasons are presented as follows. First, doping with Cd2+ can effectively reduce the band gap of CeO2 and improve the utilization efficiency of light radiation. Second, the formation of carbon bonds can promote the separation of photogenerated electron-hole pairs. Third, the introduction of carbon and Cd2+ is helpful for the reduction of Ce4+ to Ce3+ and thus the formation of oxygen vacancies.
Acknowledgements
The financial support by the National Natural Science Foundation of China (21876158) is gratefully acknowledged.
Declaration of Competing Interest
The authors declare that they have no known competing financial interests or personal relationships that could have appeared to influence the work reported in this paper.
References
- Synthesis of Cd doped ZnO/CNT nanocomposite by using microwave method: Photocatalytic behavior, adsorption and kinetic study. Results. Phys.. 2017;7:1106-1114.
- [Google Scholar]
- Dye adsorption using biomass wastes and natural adsorbents: overview and future prospects. Desalin. Water. Treat.. 2015;53:1292-1315.
- [Google Scholar]
- Comparison between industrial and simulated textile wastewater treatment by AOPs-Biodegradability, toxicity and cost assessment. Chem. Eng. J.. 2016;306:550-559.
- [Google Scholar]
- Anisotropic Au-ZnO photocatalyst for the visible-light expanded oxidation of n-hexane. Catal. Today.. 2021;362:97-103.
- [Google Scholar]
- Template-free and surfactant-free synthesis of CeO2 nanodiscs with enhanced photocatalytic activity. Appl. Surf. Sci.. 2020;503:144102
- [Google Scholar]
- A Rajasekar, Enhanced biodegradation of hydrophobic organic pollutants by the bacterial consortium: Impact of enzymes and biosurfactants. Environ. Pollut.. 2021;289:117956
- [Google Scholar]
- Facile synthesis of CeO2 hollow structures with controllable morphology by template-engaged etching of Cu2O and their visible light photocatalytic performance. Appl. Catal. B-Environ.. 2015;179:458-467.
- [Google Scholar]
- The activity and characterization of CeO2-TiO2 catalysts prepared by the sol–gel method for selective catalytic reduction of NO with NH3. J. Hazard. Mater.. 2010;174:734-739.
- [Google Scholar]
- Facile sol-gel preparation of Cd-doped cerium oxide (CeO2) nanoparticles and their photocatalytic activities. J. Alloy. Compd.. 2018;735:1854-1862.
- [Google Scholar]
- Amino-functionalized ceria with enhanced daylight photocatalytic efficiency. Ceram. Int.. 2016;42:7440-7446.
- [Google Scholar]
- Facile synthesis of silver decorated reduced graphene oxide@zinc oxide as ternary nanocomposite: an efficient photocatalyst for the enhanced degradation of organic dye under UV-visible light. J. Mater. Sci.. 2021;56:7434-7450.
- [Google Scholar]
- Novel visible-light-driven photocatalyst of NiO/Cd/g-C3N4 for enhanced degradation of methylene blue. Arab. J. Chem.. 2020;13:5810-5820.
- [Google Scholar]
- Low-temperature synthesis of cadmium-doped zinc oxide nanosheets for enhanced sensing and environmental remediation applications. J. Alloy. Compd.. 2021;863:158649
- [Google Scholar]
- Ma R., Zhang S., Wen T., Gu P.C., Li L., Zhao G.X., Niu F.L., Huang Q.F., Tang Z.W., Wang X.K. 2019. A critical review on visible-light-response CeO2-based photocatalysts with enhanced photooxidation of organic pollutants. Catal. Today. 335, 20-30.
- Origin of enhanced photocatalytic activity of F-doped CeO2 nanocubes. Appl. Surf. Sci.. 2016;370:427-432.
- [Google Scholar]
- Synthesis of CeO2/reduced graphene oxide nanocomposite for electrochemical determination of ascorbic acid and dopamine and for photocatalytic applications. Mater. Today. Chem.. 2019;12:222-232.
- [Google Scholar]
- Selective metal ions doped CeO2 nanoparticles for excellent photocatalytic activity under sun light and supercapacitor application. Inorg. Chem. Commun.. 2019;109:107577
- [Google Scholar]
- Surface chemistry of TiO2-ZnO thin films doped with Ag. Its role on the photocatalytic degradation of methylene blue. Catal. Today.. 2021;360:129-137.
- [Google Scholar]
- Photocatalysis of Cd-doped ZnO synthesized with precipitation method. Rare Metals.. 2021;40:537-546.
- [Google Scholar]
- Controllable synthesis of transition metal ion-doped CeO2 micro/nanostructures for improving photocatalytic performance. J. Alloy. Compd.. 2019;782:780-878.
- [Google Scholar]
- Biomimetic synthesis of cerium oxide nanosquares on RGO and their enhanced photocatalytic activities. Dalton T.. 2017;46:547.
- [Google Scholar]
- Enhanced photocatalytic H2 production on three-dimensional porous CeO2/Carbon nanostructure. ACS. Sustain. Chem. Eng.. 2018;6:9691-9698.
- [Google Scholar]
- Synthetic reactive dye wastewater treatment by using nano-membrane filtration. Desalin. Water. Treat.. 2015;55:86-95.
- [Google Scholar]
- Highly efficient visible light photocatalytic and antibacterial performance of PVP capped Cd:Ag: ZnO photocatalyst nanocomposites. Appl. Surf. Sci.. 2019;479:914-929.
- [Google Scholar]
- Influence of transition metals co-doping on CeO2 magnetic and photocatalytic activities. Ceram. Int.. 2020;46:5086-5097.
- [Google Scholar]
- High performance nanohybrid CeO2@2D CdO plates with suppressed charge recombination: Insights of photoluminescence, visible-light photocatalysis, intrinsic mechanism and antibacterial activity. Opt. Mater.. 2021;121:111510
- [Google Scholar]
- Enhanced photocatalytic performance of CdO-WO3 composite for hydrogen production. Int. J. Hydrongen Energ.. 2019;44:24690-24697.
- [Google Scholar]
- A review on heavy metal ions and containing dyes removal through graphene oxide-based adsorption strategies for textile wastewater treatment. Chem. Rec.. 2021;21:1570-1610.
- [Google Scholar]
- Remarkably enhanced catalytic performance in CoOx/Bi4Ti3O12 heterostructures for methyl orange degradation via piezocatalysis and piezo-photocatalysis. Ultrason Sonochem.. 2023;100:106616
- [Google Scholar]
- Novel construction of carbon bonds in CeO2@C with efficiently photocatalytic activity. Dyes. Pigments.. 2020;182:108669
- [Google Scholar]
- Fe doped CeO2 nanosheets for catalytic oxidation of 1, 2-dichloroethane: Effect of preparation method. Chem. Eng. J.. 2017;307:1037-1046.
- [Google Scholar]
- Facile one-pot synthesis of carbon self-doped graphitic carbon nitride loaded with ultra-low ceric dioxide for high-efficiency environmental photocatalysis: Organic pollutants degradation and hexavalent chromium reduction. J. Colloid. Interf. Sci.. 2021;601:196-208.
- [Google Scholar]
- Pegylated deep eutectic solvent-assisted synthesis of CdS@CeO2 composites with enhanced visible light photocatalytic ability. Chem. Eng. J.. 2020;380:123135
- [Google Scholar]
- The surface properties and the activities in catalytic wet air oxidation over CeO2-TiO2 catalysts. Appl. Surf. Sci.. 2006;252:8499-8505.
- [Google Scholar]
- Fe Co, Ni nanocrystals encapsulated in nitrogen-doped carbon nanotubes as Fenton-like catalysts for organic pollutant removal. J. Hazard. Mater.. 2016;314:129-139.
- [Google Scholar]
- Fabrication of high-quality ZnCdO epilayers and ZnO/ZnCdO heterojunction on sapphire substrates by pulsed laser deposition. Appl. Surf. Sci.. 2015;326:271-275.
- [Google Scholar]
- An ultrathin carbon layer activated CeO2 heterojunction nanorods for photocatalytic degradation of organic pollutants. Appl. Catal. B-Environ.. 2019;259:118085
- [Google Scholar]
- Chemical solution deposition of pure and Gd-doped ceria thin films: Structural, morphological and optical properties. Ceram. Int.. 2017;43:4280-4287.
- [Google Scholar]
- Synergetic effect between photocatalysis on TiO2 and thermocatalysis on CeO2 for gas-phase oxidation of benzene on TiO2/CeO2 nanocomposites. ACS Cataly.. 2015;5:3278-3286.
- [Google Scholar]
- Thiophene insertion and lanthanum molybdate modification of g-C3N4 for enhanced visible-light-driven photoactivity in tetracycline degradation. Appl. Surf. Sci.. 2022;592:153337
- [Google Scholar]
- Catalytic oxidation of soot on mesoporous ceria-based mixed oxides with cetyltrimethyl ammonium bromide (CTAB)-assisted synthesis. J. Colloid. Interf. Sci.. 2017;508:1-13.
- [Google Scholar]
- New insight into binary TiO2@C nanocomposites: the crucial effect of an interfacial microstructure. Phys. Chem. Chem. Phys.. 2017;19:9519.
- [Google Scholar]
Appendix A
Supplementary data
Supplementary data to this article can be found online at https://doi.org/10.1016/j.arabjc.2023.105496.
Appendix A
Supplementary data
The following are the Supplementary data to this article:Supplementary data 1
Supplementary data 1


