

Translate this page into:
Enhancing thermal performance of cylindrical Li-ion battery packs: A 3D simulation with strategic phase change material integration and airflow control
⁎Corresponding authors at: Mechanical Engineering Department, College of Engineering, Najran University, Najran, Saudi Arabia (J. Mustafa); Department of Mechanical Engineering, Eastern Mediterranean University, Famagusta, TRNC, via Mersin 10, Turkey (H.Ş. Aybar). jmmustafa@nu.edu.sa (Jawed Mustafa), hikmet.aybar@emu.edu.tr (Hikmet Ş. Aybar)
-
Received: ,
Accepted: ,
This article was originally published by Elsevier and was migrated to Scientific Scholar after the change of Publisher.
Abstract

Abstract
This study conducts a three-dimensional simulation of the temperature of a cylindrical Li-ion battery (LIB) pack with nine cells. The cells are arranged in the pack in square and diamond configurations, and the pack is filled with phase-change materials (PCMs). The airflow enters the channel from two inlets at 90° with respect to the pack and is guided by two blades at the sides of the inlet toward the pack. Arc-shaped and linear blades were used for this study, which was carried out for 2500 s. The results indicate that the square arrangement of batteries, combined with the use of curved blades, has been more effective in reducing temperature. In this configuration, a more uniform distribution of air flow and better efficiency of the PCM in absorbing heat were observed, leading to a significant decrease in the overall temperature of the battery pack. Specifically, compared to the diamond arrangement, the temperature of the batteries in the square arrangement was up to 10 °C lower. This reduction in temperature plays an important role in enhancing the lifespan and safety of the batteries. By using machine learning and providing the optimal model for the maximum temperature of the battery surface, it was shown that this parameter was designed with the model and comparing it with the numerical results had an error of 2.01 %.
Keywords
Guide blades
Lithium-ion
Machine learning
Optimization
Hybrid system

Nomenclature
- A
-
Mushy constant
-
Heat capacity
- F
-
Faraday’s constant
-
Volume fraction of the liquid
- k
-
Thermal conductivity
- LIB
-
Li-ion battery
- H
-
Enthalpy
- p
-
Static pressure
- Q
-
heat generated
-
Source term
- t
-
time
- T
-
Temperature
- TMG
-
thermal management
- u, v, w
-
Velocity
- x, y,z
-
Coordinate
- β
-
Volume expansion coefficient
-
Delta
- μ
-
Viscosity
-
Density
Greeks
- b
-
Battery
- eff
-
Effective
- gen
-
Generation
- L
-
Liquid
- S
-
Solid
Subscribe
1 Introduction
The incorrect and harmful use of natural resources has led to an increase in emission. These gases enter the atmosphere in various ways. Greenhouse gas emissions results in the entrapment of solar heat in the atmosphere (Forner-Escrig et al., 2020; Dulin et al., 2022). Scientists have predicted global warming to increase significantly by the end of the 21st century. Therefore, mankind must use various means to prevent the rise in greenhouse gas emission and the adverse consequences of global warming. Cutting the use of cooling equipment and using advanced cooling technologies are considered important methods of reducing energy consumption (Xiong et al., 2021). When it comes to lowering greenhouse gas emissions and environmental pollutants, modern automobiles offer a bright future. Because of its high energy density and extended lifespan, Li-ion batteries are the preferred energy source for electric cars (Choi and Kang, 2014; Keshavarzi et al., 2022). The temperature has a big impact on how well these batteries work. The battery thermal management (TMG) system, which is responsible for keeping the battery pack's temperature within an acceptable range, has an impact on the battery pack's performance as well as its stability and safety (Chen et al., 2022; Chen et al., 2023). Hence, numerous studies were conducted by various researchers in this field (Cao, 2014; Chen et al., 2022). In fact, active and passive heat transfer methods used for the TMG of batteries are plenty, with a recent interest being shown in hybrid methods (Kausthubharam and Koorata, 2023). The following presents a number of research done on battery heat control (Gungor et al., 2022).
Olabi et al. (2022) reported the progress and the challenges involved in the battery TMG system. They examined the application of air, liquids, nanofluid, phase-change materials (PCMs), heat pipes, and a combination of these techniques to the TMG of batteries. Moreover, they summarized the research on improving the innovation in safe thermal design and collaborative optimization for meeting the commercialization needs of vehicles via green energy. Finally, they showed that each system has unique properties and that the battery TMG system is necessary to extend the life of the batteriesLin et al. (2021) studied the challenges and the role played by battery TMG. They investigated LIB TMG models presented in the literature and predicted the thermal behavior of a battery. This study showed that the use of TMG in batteries in hybrid vehicles can considerably influence the power management of the vehicle; thus, they proposed a suitable method in their study. Rao et al. (2013) experimentally investigate the effect of using heat pipes in the TMG of a LIB. They showed that the battery temperature may be lowered to sub 50 °C using this approach. On the other hand, when the heat production is under 30 W, the temperature difference is optimal. In the end, they demonstrated that an effective way to reduce energy consumption in electric cars is to use TMG of a LIB based on heat pipes. Wang et al. (2018) evaluation of safety practices for TMG of a LIB and the most important safety measures for cooling Li-ion batteries. They demonstrated that a combination of the TMG of a LIB system with emergency coolers, fire extinguishers, and thermal barriers can guarantee the optimal temperature range and prevent excess release of heat. On the other hand, they presented a review of high-safety TMG of a LIB systems aimed at promoting the application of batteries with high energy densities, safety, and stability of the cycle used to generate electricity and smartify vehicles.
Du et al. (2021) analyzed the thermal performance of lithium-ion battery packs consisting of several battery cells. Due to the complexities associated with heat transfer in these systems, significant safety risks are raised. To simulate these processes more accurately, multi-scale modeling was used, which includes a quasi-two-dimensional model for analyzing individual cells and a three-dimensional computational fluid dynamics model for examining the entire battery pack. This study explored the impact of battery cell arrangements on the overall thermal performance and analyzed four different configurations including square, staggered, and two trapezoidal states. The results showed that the square arrangement performs better in terms of air cooling, especially when the cold air inlet is placed at the top of the battery pack. These findings can serve as theoretical guidance for designing thermal management systems in lithium-ion battery packs.
Rao and Wang (2011) reviewed the influence of TMG of a LIB on electric vehicles and their power output. Through an examination of past studies, they showed that the use of electric and hybrid vehicles contributes to greenhouse gas mitigation, indicating that the introduction of a TMG method can considerably affect their efficiency. Daneh-Dezfuli and Pordanjani (2022) used passive methods to simulate the battery. In fact, by reducing noise and cost, the passive method has proved to be a suitable method for the TMG of batteries and has attracted researchers’ attention. An et al. (2017) investigated the impact of the material used in the LIB on heat generation. They demonstrated that fluid-cooled techniques are the best way of thermally managing batteries of large volume, especially at higher charging rates. Jaguemont and Van Mierlo (2020) conducted a review study of novel methods in TMG of a LIB. Afzal et al. (2021) studied the TMG of batteries in electric vehicles. To this end, they examined a modern system and showed that parameters such as conduction, convection, and the Reynolds number (Re) play a significant role in heat generation inside the battery. On the other hand, they showed that the aspect ratio only slightly affects the TMG and overall temperature of the battery (Rajalingam and Chakraborty, 2021). A liquid-cooled TMG system for Li-ion batteries was examined by Liu et al. (2020). They carried out an experimental analysis to determine the impact of a liquid-based BTMS's heat capacity, hot source characteristics, ambient temperature, and charging rate ratio on its thermal performance. Their findings show that the heat produced within the battery may be utilized to warm the battery itself, and the active technique is suitable for TMG of a LIB. They also showed that at higher temperatures, temperature homogeneity was better. The cell also generates a lot of heat while charging and at the conclusion of discharging. In this scenario, the coolant must be held for at least five minutes after charging and the cooling improvement should be enhanced.
Nowadays, many researchers are interested in the cooling of battery pack systems due to the rise in the application of batteries in various devices (Väyrynen and Salminen, 2012; Lisbona and Snee, 2011; Mahamud and Park, 2011). The attention paid by researchers to cooling and heat transfer in different devices in recent decades is owing to the wide application of these studies in industry (Joshi et al., 2024; Subhedar et al., 2023). PCMs are an important solution employed by researchers for the TMG of various devices (Bais et al., 2023; Yang et al., 2024). In the present paper, the impact of two different arrangements of battery cells in a battery pack is studied numerically by placing the battery pack in a container filled with PCM. Air flows around the PCM and cools down the PCM and the batteries. Moreover, two different arc-shaped and linear blades were used to guide the flow. Finally, the transient temperature of the battery cells and the PCM was studied. Finally, an optimization is conducted on the battery parameters to determine the best temperature for the battery. The innovation of this paper can be attributed to the three-dimensional analysis of the battery pack with airflow and phase change material, incorporating two types of flow guide blades, curved and linear, and the use of machine learning for better analysis of the results.
2 Problem statement
The geometry under study consists of diamond and square configurations of battery cells inside a pack placed within an air duct. Air with constant Reynolds (Re = 200) as laminar flow from two inlets into the duct and comes into contact with the battery pack after colliding with arc-shaped and linear guide blades. The temperature of the incoming air was also constant at 293 K, equivalent to the ambient temperature, and the pressure at the outlet of the channel was the same as the room pressure. A schematic of the battery arrangements and the guide blades is displayed in Fig. 1. PCM was used around the batteries for better temperature uniformity. Fig. 1 also depicts other details of the geometry under study.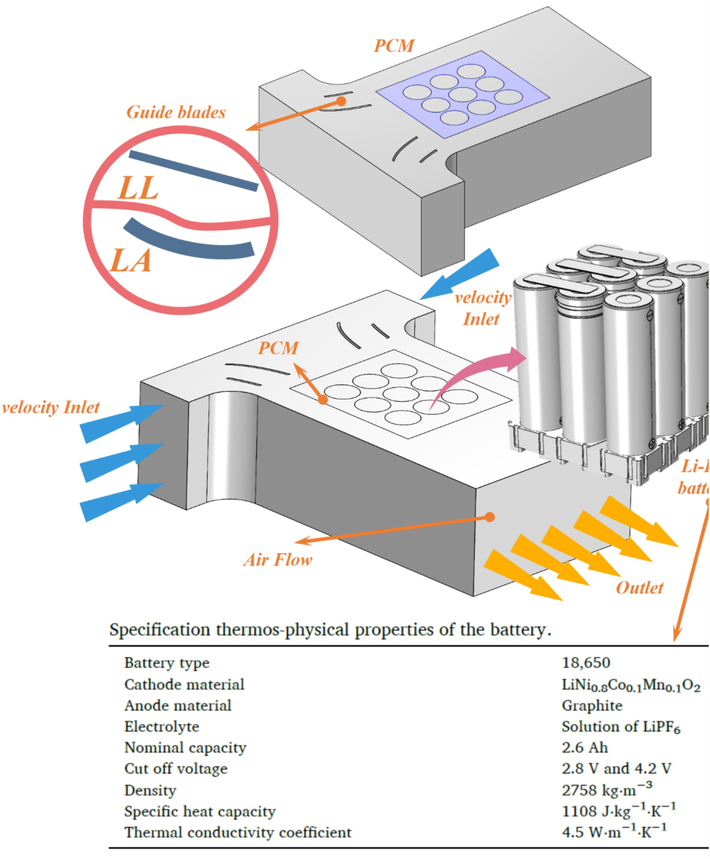
Schematic of the problem consists of nine cylindrical LIBs and a hybrid cooling system of batteries (Yang et al., 2021), phase change materials and air.
3 Governing equations
The effective heat capacity approach was used in this work to mimic the non-isothermal phase shift. The PCM's latent heat is determined using the change in its specific heat during phase shift using the effective heat capacity technique. Using the Boussinesq approximation, natural convection was simulated. The PCM's density was thought to equal the sum of the densities of its solid and liquid phases. For the purpose of building a latent heat storage system, this estimate is precise enough. The battery and PCM models' governing equations are as follows:
The following is the expression for the momentum, continuity, and energy equations:
Here ρ,
, and k represent the density, specific heat, and thermal conductivity of the PCM, respectively. The Darcy momentum source term (S→) of the momentum equation is defined as below:
where
is the volume fraction of the liquid (or average melt fraction) obtained from the equations.
The surface forces in the momentum equations are expressed as follows:
The specific heat of the PCM is written as follows:
Here,
,
,
,
, and ΔH are the solid specific heat, liquid specific heat, solid temperature, liquid temperature, and latent heat of the PCM. In the present study, the dynamic viscosity of solid PCM and the mushy zone are taken to be 104 Pa.s and 106 kg/m3.s, respectively. The properties of the materials used are displayed in Table 1. Moreover, the properties of the battery frame, which is made of aluminum, are shown in the table.
Property
RT35HC
Aluminum
Melting temperature range (K)
307–309
−
Latent heat(Kj/kg)
240
−
Density(kg/m3)
880(S)
2700
770(L)
Specific heat (J/kg-K)
2000
903
Thermal conductivity (W/m −k)
0.2
200
Volume expansion coefficient (1/K)
0.000865
−
Dynamic viscosity (Pa s)
104 (S)
−
0.0044(L)
Thermal diffusivity (m2/s)
1.21 × 10⁻⁷
8.2 × 10⁻⁵
The equations governing the air are expressed as follows (Jilte et al., 2021; Khan et al., 2022; Kizilel et al., 2009):
The heat generated in the battery consists of three contributions. One part is due to the chemical reaction, one part is the polarization heat due to the excess potential and transfer current, and the last part is caused by a change in entropy due to Joule or ohmic heating. The model used for the energy equation of the battery obeys Faraday’s law, which is expressed as follows (Tran et al., 2019):
4 Solution method
After the geometry was created and meshed, the appropriate model to solve the problem was selected, and the physical properties and boundary conditions were specified. Ultimately, the solution method was determined, the equations were separated, and the solution process was initiated. The model in this problem was created in two steps. First, the fluid flow was expressed via an operator differential equation in terms of the velocity and pressure fields, and the boundary conditions of the solution domain were specified. The aim of this step is to determine the velocity field that is required to solve the heat transfer differential equation. In the second step, the heat transfer equation was defined along with the heat generated in the LIB and solved by substituting the velocity field from the previous step. The main aim of this research is to determine the temperature distribution over the batteries. If the average temperature on the batteries agrees with empirical results, the velocity field and pressure distribution are indirectly verified since the heat transfer equation is solved using the velocity field. Therefore, the solution will be carried out according to Fig. 2.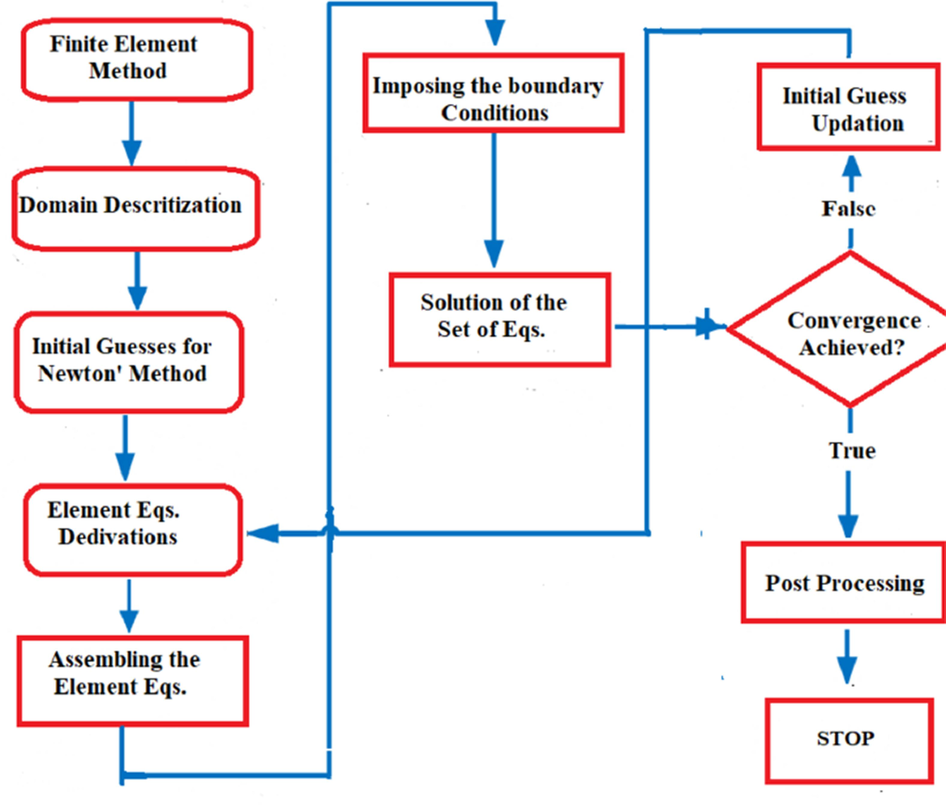
Solution method and numerical solution algorithm. Solution steps in the form of a flowchart in the finite element method.
The simulation was performed using COMSOL Multiphysics 5.5 software. COMSOL is a multiphysics simulation platform that allows for modeling, simulation, and analysis of the most complex physical and engineering problems. This software uses the Finite Element Method (FEM) to enable users to work on issues related to fluid dynamics, heat transfer, electromagnetism, and other physical phenomena. COMSOL features graphical user interfaces and parametric modeling-based interfaces that simplify the interaction and manipulation of models.
5 Mesh-independence of the solution and validation
It is important to utilize a suitable mesh in numerical computations. There are various ways of meshing including using triangular, square, etc. elements. The mesh is considered uniform in this work. Reducing the computational cost by finding the appropriate mesh and ensuring the mesh-independence of the results must always be taken into consideration. After various examinations on the method and quality of meshing, the finer mesh quality was ultimately selected as the mesh quality. The study then proceeded by varying the minimum and maximum dimensions of the elements to analyze the results. As the dimensions of the elements changed, the number of elements used in the meshing also varied. The meshing was performed in three dimensions using hexahedral elements. Hence, the mesh-independence of the results must be verified before examining the results. This study uses unstructured meshes for the geometry. For this purpose, the average temperature of the battery and the PCM and the temperature of the fluid exiting the battery pack is shown in Table 2. According to this table, the results are almost the same for Meshes 4 and 5. Thus, 1,437,000 elements were generated over the solution domain and used for the computations.
Grid
Grid 1
Grid 2
Grid 3
Grid 4
Grid 5
Grid 4
Number of elements
862,000
1,012,000
1,217,000
1,437,000
1,643,000
1,437,000
Average temperature
298.56
298.11
297.98
297.92
297.91
297.92
PCM Average temperature
298.34
298.03
297.83
297.72
297.71
297.72
Outlet temperature
298.33
297.68
297.38
297.23
297.21
297.23
To validate the calculations and ensure the appropriate performance of the computer program, the results obtained from the computer program were compared to the numerical results of previous works. To this end, the validation was carried out for the coupled battery and airflow equations. The work by Yang et al. (2021) was used for the validation. They investigated a LIB and employed a novel system to cool it. They simultaneously used a microchannel and PCMs to cool the Li-ion batteries. Their work demonstrated that a hybrid system can be a suitable method for cooling batteries. In this investigation, the average temperature of the battery and the dynamic voltage of the battery were investigated with the results obtained in the work of Yang et al. (2021) As seen in Fig. 3, merely a slight difference is observed in the results. Hence, the model used in the software is highly accurate. The comparison showed that in all assessments, the overall maximum error between the work presented and the article used for validation was less than 5 %. This indicates that the simulation conducted in this paper is reliable.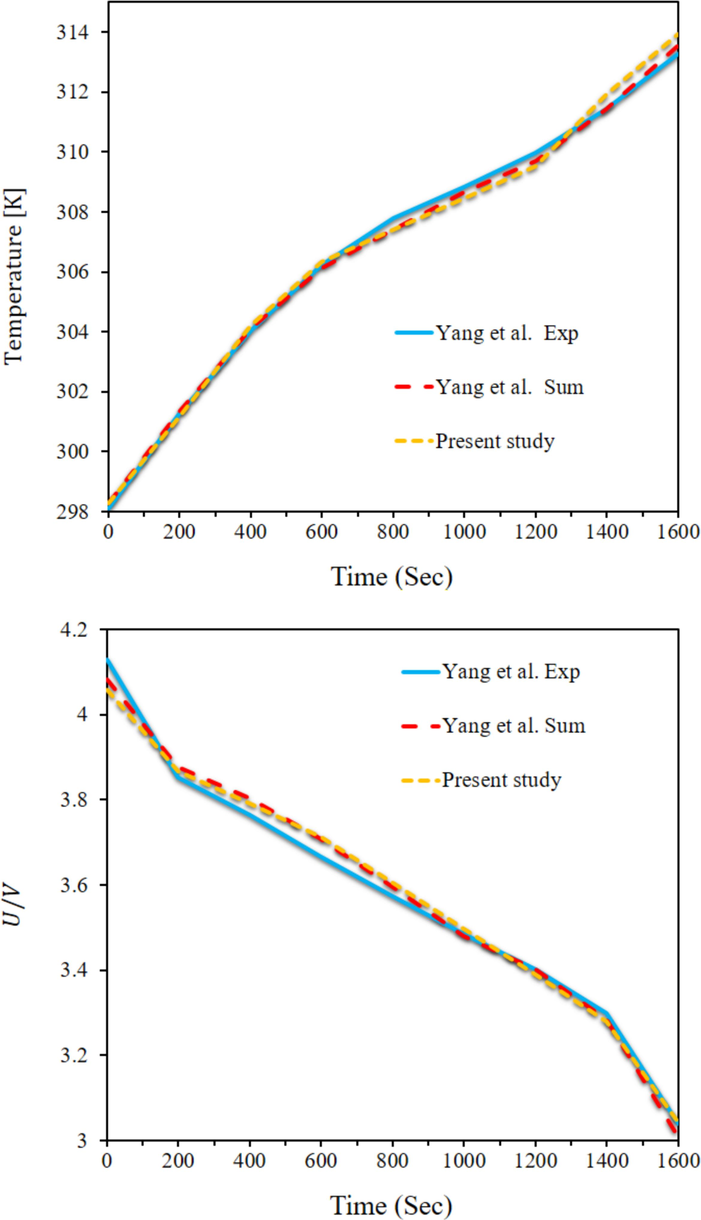
A comparison between the results of the present solution and those by Yang et al. (2021). (Comparing the maximum temperature of the battery surface and the output voltage from the batteries.).
6 Results and discussion
In the results section, thermal analyses of the battery components, airflow, and phase change material have been conducted for two different arrangements, square and diamond, of the battery cells in the battery pack. In these sections, temperature and velocity contours for two configurations of flow guide blades, linear and curved, have been examined at various times. In the third part of the results, a comparison between these two different battery cell arrangements in the battery pack has been made at different times for both types of flow guide blades, linear and curved. The findings from this section have been used for the optimization section.
6.1 Diamond arrangement
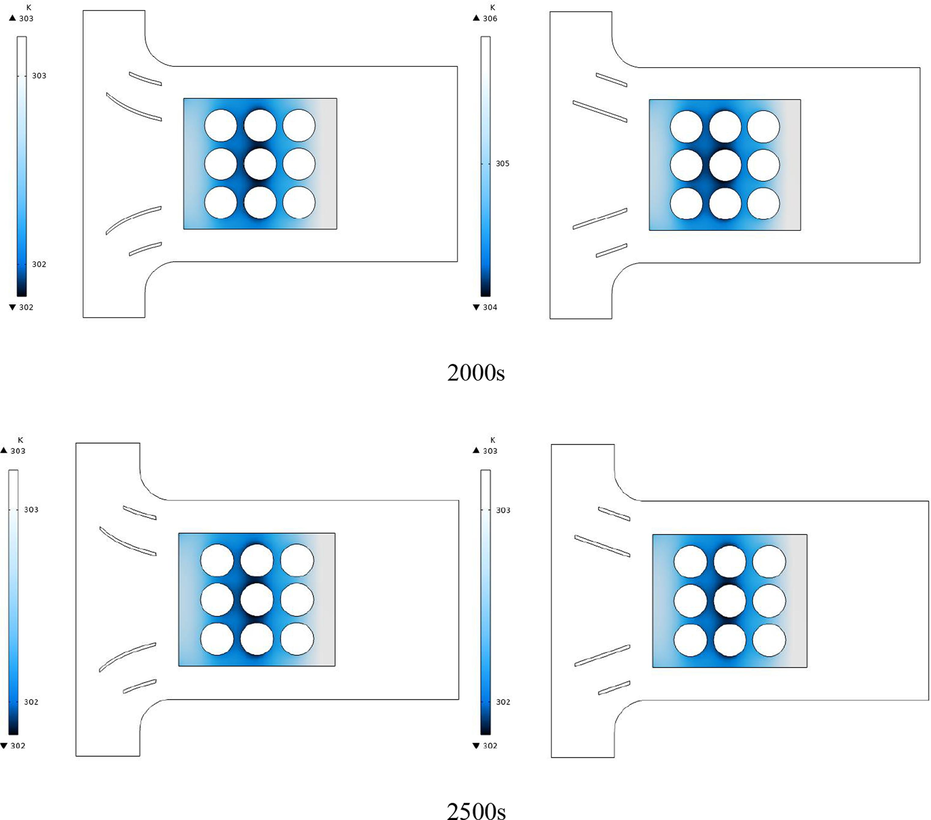
Fig. 4 depicts the battery temperature contours and the air streamlines for different times corresponding to the diamond arrangement of the batteries and arc-shaped and linear guide blades. The temperature of the battery cells is different in different parts of the pack. Even every battery at a different location has a different temperature. However, good temperature uniformity is observed in each battery cell and even in the battery pack owing to the presence of the PCM. The PCM absorbs the heat generated by the batteries and prevents a sudden rise in temperature in a part of the batteries. Moreover, the airflow cooling the batteries causes the PCM to melt over a longer period of time. The batteries at locations in more contact with the air are at a lower temperature, while those in the middle parts are at a higher temperature. Due to the presence of the guide blades of both shapes, a considerable amount of air collides with the end of the PCM, reducing the battery cell temperature in this region. The airflow passes over the guide blades toward the front and sides of the PCM and cools these regions down. Nevertheless, the air itself experiences an increase in temperature in these regions, and warmer air exits the channel.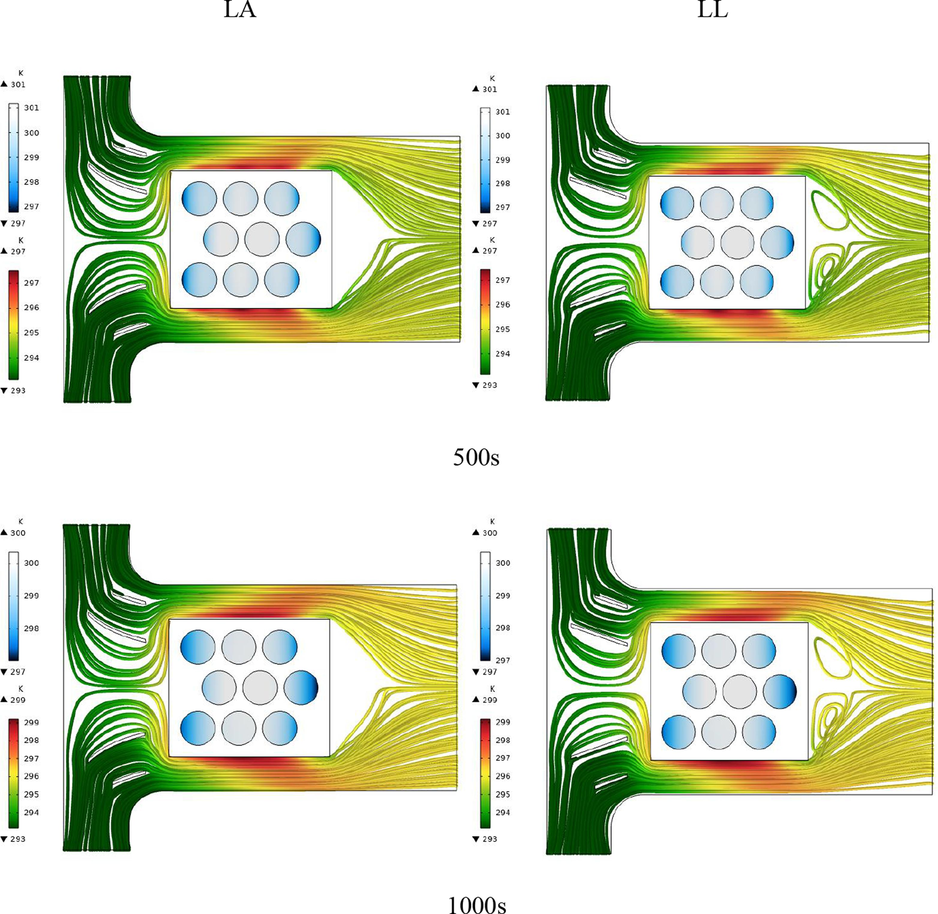
Temperature contour of the batteries and lines showing the air flow path for different times for the rhombus arrangement of the batteries and the two arched and linear air flow guiding blades.
Temperature contour of the batteries and lines showing the air flow path for different times for the rhombus arrangement of the batteries and the two arched and linear air flow guiding blades.
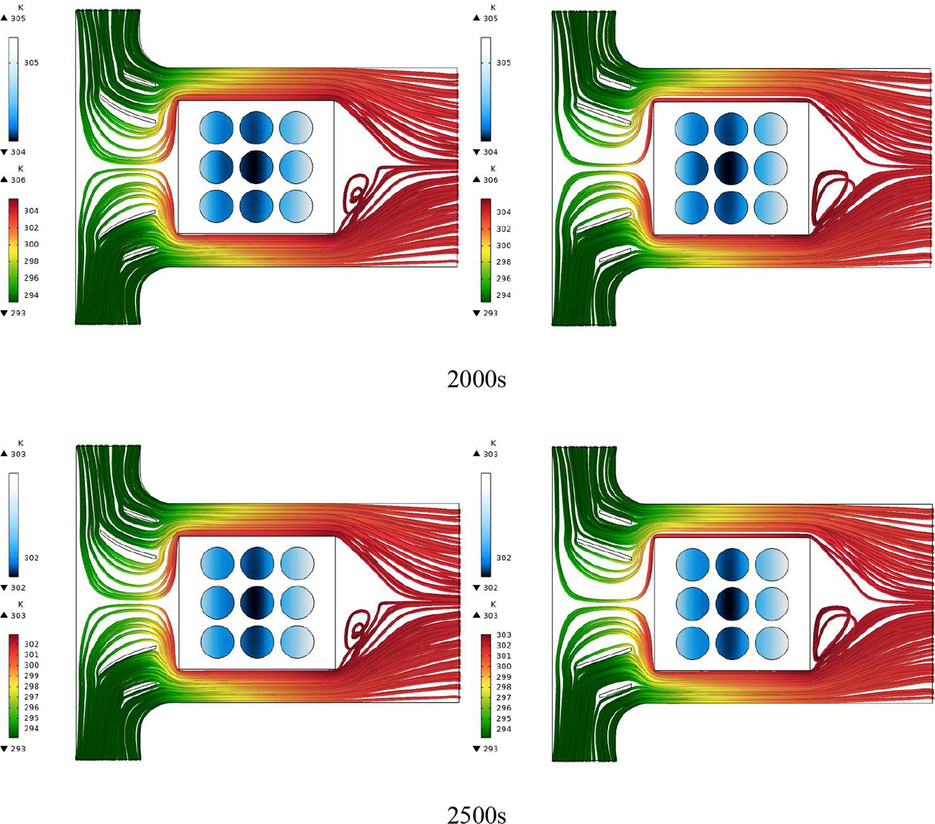
Fig. 5 displays the battery temperature contours for different times corresponding to the diamond configuration and arc-shaped and linear guide blades. According to the figure, the battery temperature increased up to 1000 s and decreased thereafter. The middle batteries had the highest temperature at different times in this configuration. The last battery in the region near fresh air had the lowest temperature among the batteries. In addition, the front batteries are at a lower temperature compared to the other batteries. The temperature of the batteries is similar for the arc-shaped and linear guide blades. At 500 s, the temperature of the sides of the front and rear batteries was lower than the other parts. However, this temperature increased over time and became more uniform except for the temperature of the last battery.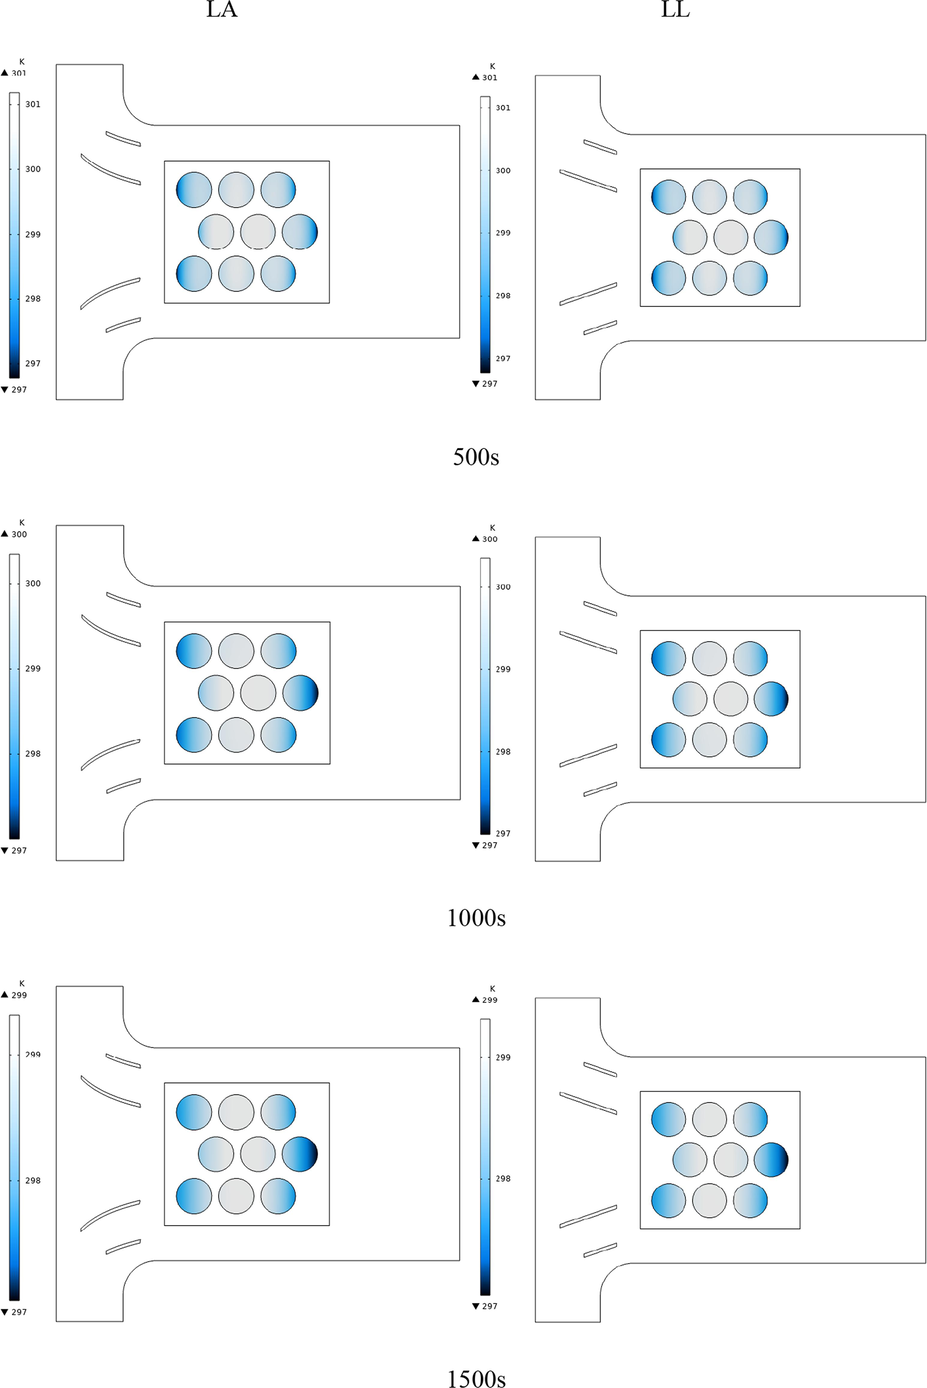
Battery temperature contours for different times up to 2500 s for a diamond arrangement and arc-shaped and linear guide blades.
Battery temperature contours for different times up to 2500 s for a diamond arrangement and arc-shaped and linear guide blades.
Fig. 6 displays the PCM temperature contours for different times up to 2500 s corresponding to the diamond configuration and arc-shaped and linear guide blades. Due to the presence of the guide blades, large amounts of air were guided toward the sides of the PCM, and small amounts collided with the front. For this reason, the temperature at the corners of the PCM container toward the outlet was small at different times since these areas came into contact with large amounts of cold air. Thus, they always remain in the form of solid PCM. This is because they came into contact with cold air and were also far from the batteries. The hottest part of the PCM container was around the middle batteries since the PCM melted earlier in these parts due to the presence of warmer batteries, and hence the PCM temperature increased. The shape of the guide blades had a small effect on the PCM temperature. The use of arc-shaped blades have further reduced the PCM temperature.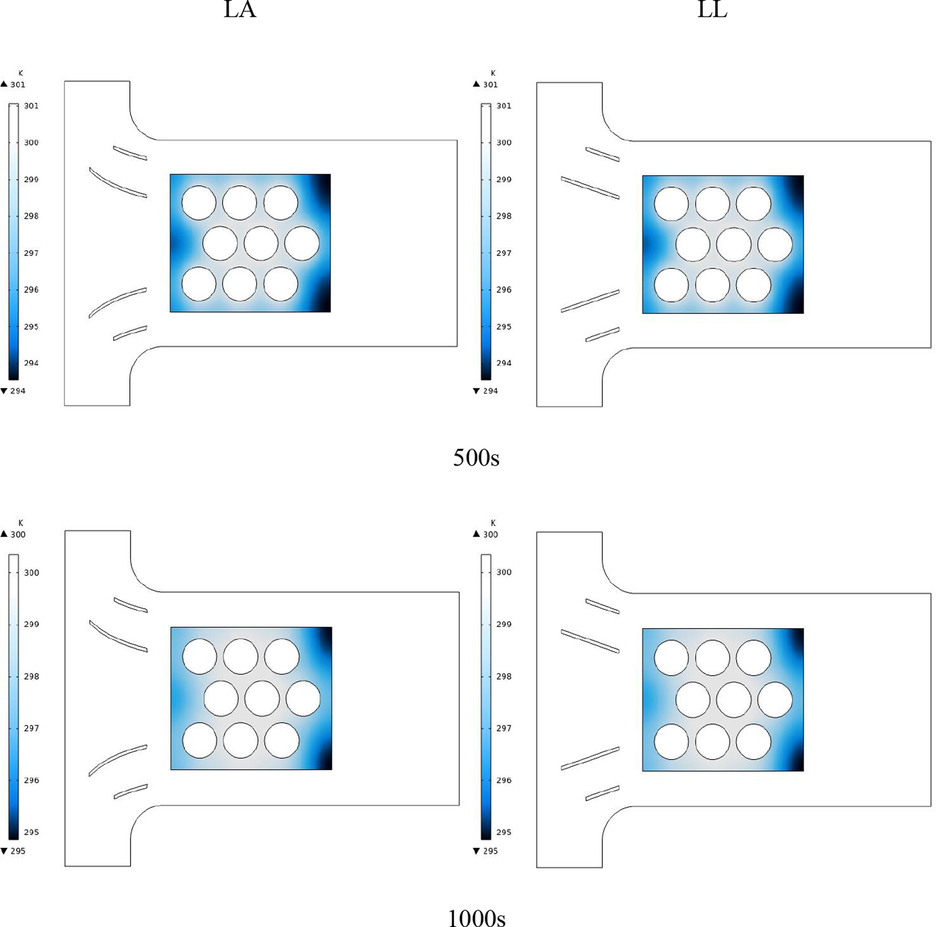
Temperature contours of the PCM around the batteries for different times up to 2500 s for a diamond arrangement and arc-shaped and linear guide blades.
Temperature contours of the PCM around the batteries for different times up to 2500 s for a diamond arrangement and arc-shaped and linear guide blades.
Fig. 7 displays the air velocity vectors representing the temperature and velocity of air at different times up to 2500 s corresponding to the diamond configuration and arc-shaped and linear guide blades. Cold air at a constant velocity entered the duct via two inlets. As the air reached the guide blades, its velocity and direction changed. A smaller portion of air at a lower velocity moved toward the front of the PCM pack, and a larger portion at a higher velocity moved toward the sides. In this part, the temperature of the air increased due to its contact with the PCM, and thus it collided with the front parts of the PCM at a higher temperature. In addition, the air passing over the front of the battery pack was added to the air at the sides of the PCM, and, as such, all of the air passed over the side of the PCM pack. The temperature of the air increased up to a time of 1000 s but decreased after this time under the effect of the battery temperature.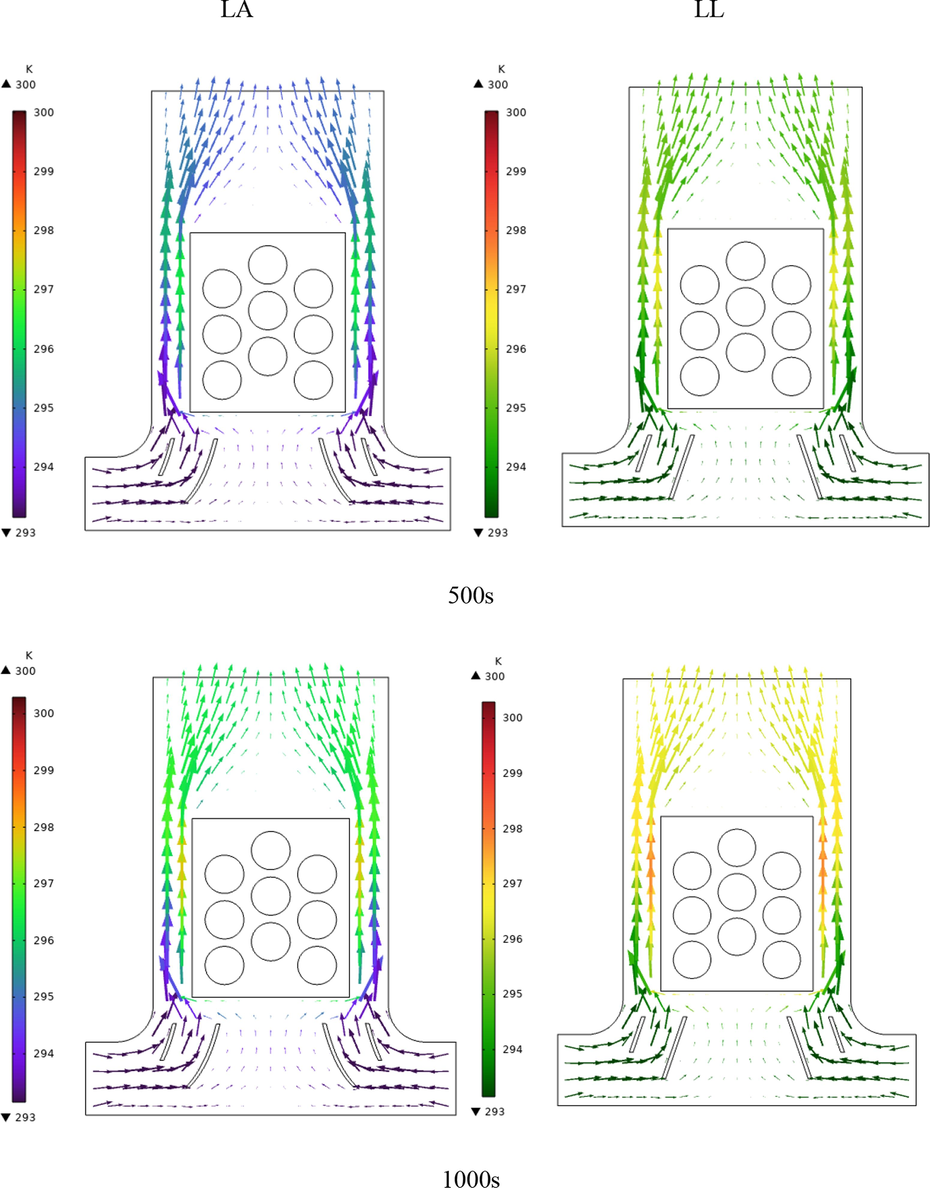
Air velocity vectors representing the temperature and velocity of the air for different times up to 2500 s for a diamond arrangement and arc-shaped and linear guide blades.
Air velocity vectors representing the temperature and velocity of the air for different times up to 2500 s for a diamond arrangement and arc-shaped and linear guide blades.
Air velocity vectors representing the temperature and velocity of the air for different times up to 2500 s for a diamond arrangement and arc-shaped and linear guide blades.
Fig. 8 displays the airflow streamlines representing the velocity at different times up to 2500 s corresponding to the diamond arrangement and arc-shaped and linear guide blades. As shown in the figure, only a small portion of the inlet air collided with the front of the battery pack, and the majority of the air was guided to the sides of the pack. This portion of the air comes into contact with the battery pack and reaches the temperature of the back rows, which are at a higher temperature. This change in the velocity of the air at the sides of the pack was caused by the use of the guide blades. The arc-shaped blades were better at guiding the air toward the battery pack than the linear ones. The highest air velocity was observed at the sides of the battery pack since there is little space in this part and all of the air entering the duct must pass through it.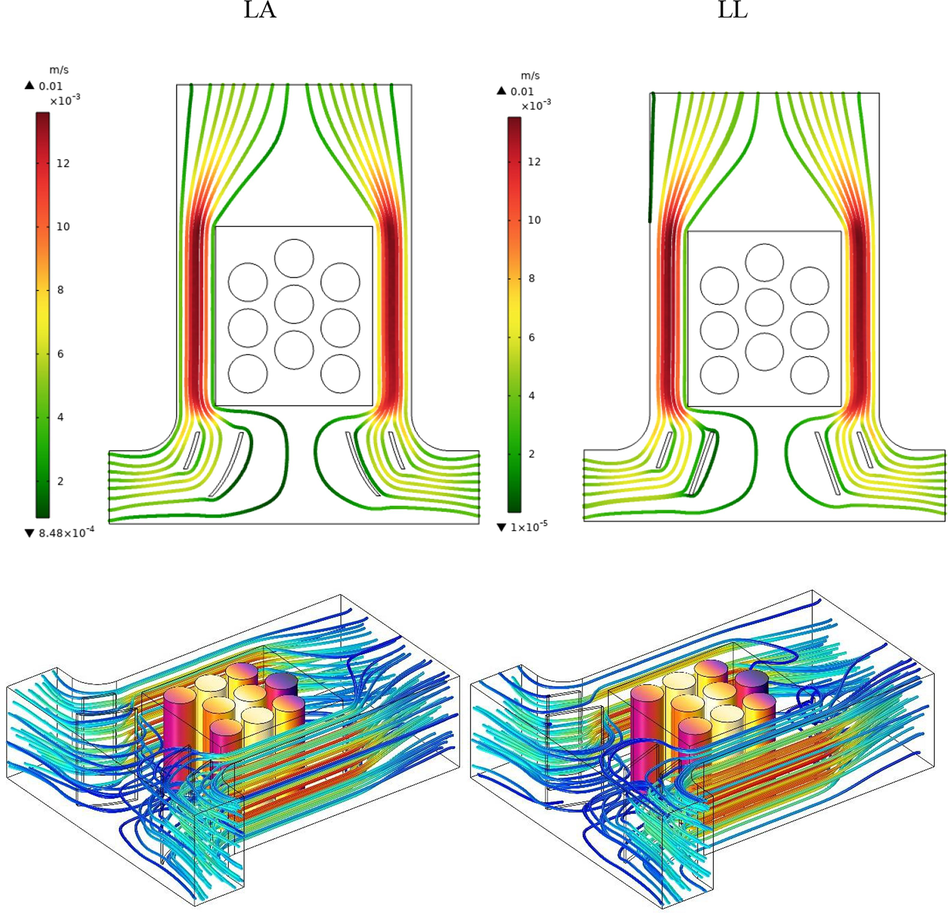
Airflow streamlines representing velocity for different times up to 2500 s corresponding to the diamond configuration and arc-shaped and linear guide blades.
6.2 Square arrangement
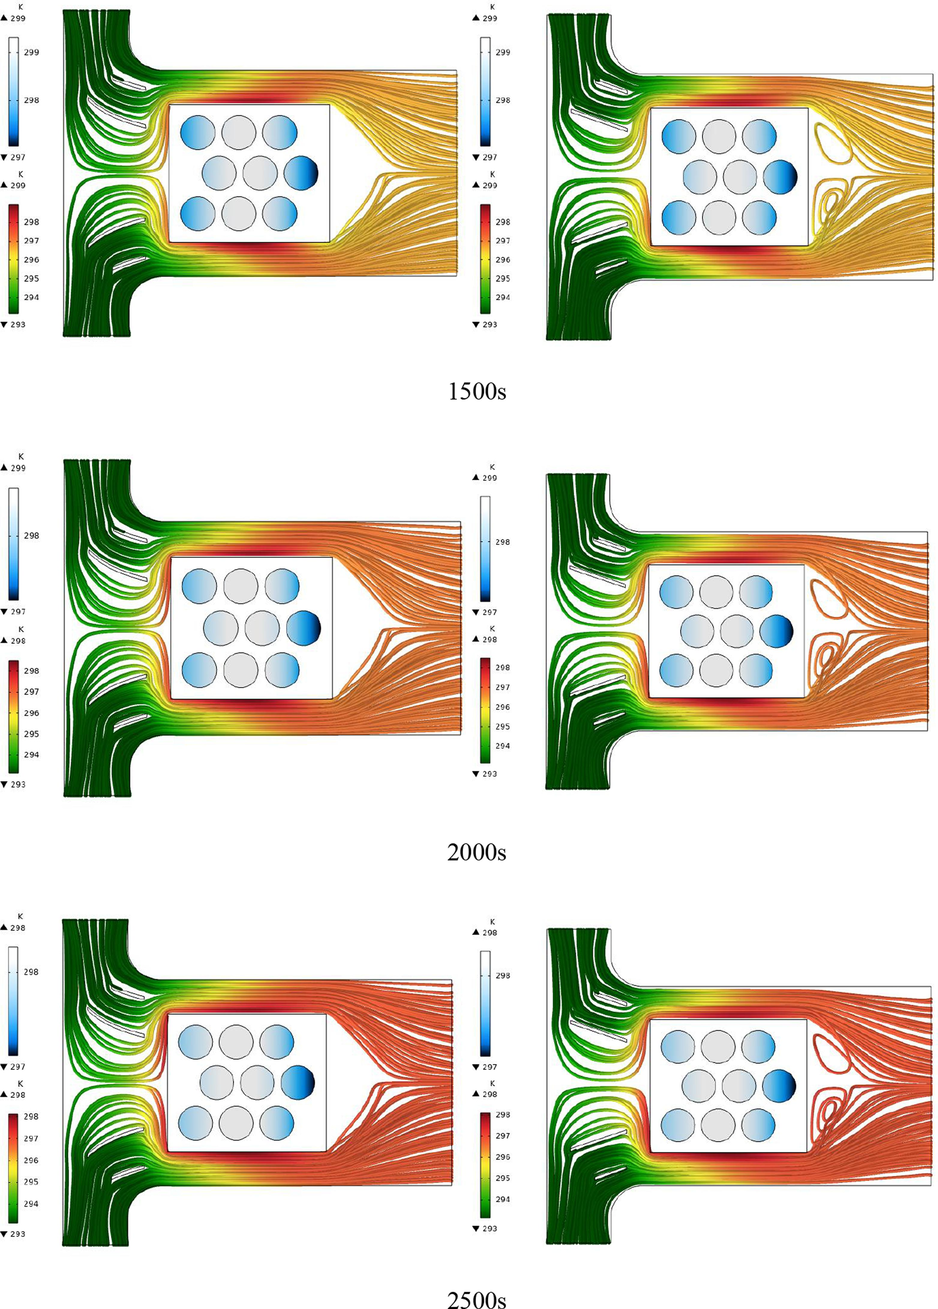
Fig. 9 depicts the battery temperature contours and the air streamlines for different times corresponding to a square arrangement of the batteries and arc-shaped and linear guide blades. The airflow from the inlet is guided toward the PCM via the blades. The presence of these blades moves the air toward the sides of the PCM, and hence the batteries in this area come into contact with cold air at a high flow rate. It is observed that one row of the batteries is at a higher temperature than the other rows at different times. Up to 1000 s, the temperature of the batteries in the middle row is higher than those of other batteries. At 1500 s, the temperatures of the middle and end rows are similar although that of the front row is lower than those of the other rows. At 2000 s and 2500 s, the temperature of the middle row is smaller than those of the other rows, while that of the last row is the highest. Using curved guide blades reduced the battery temperature more.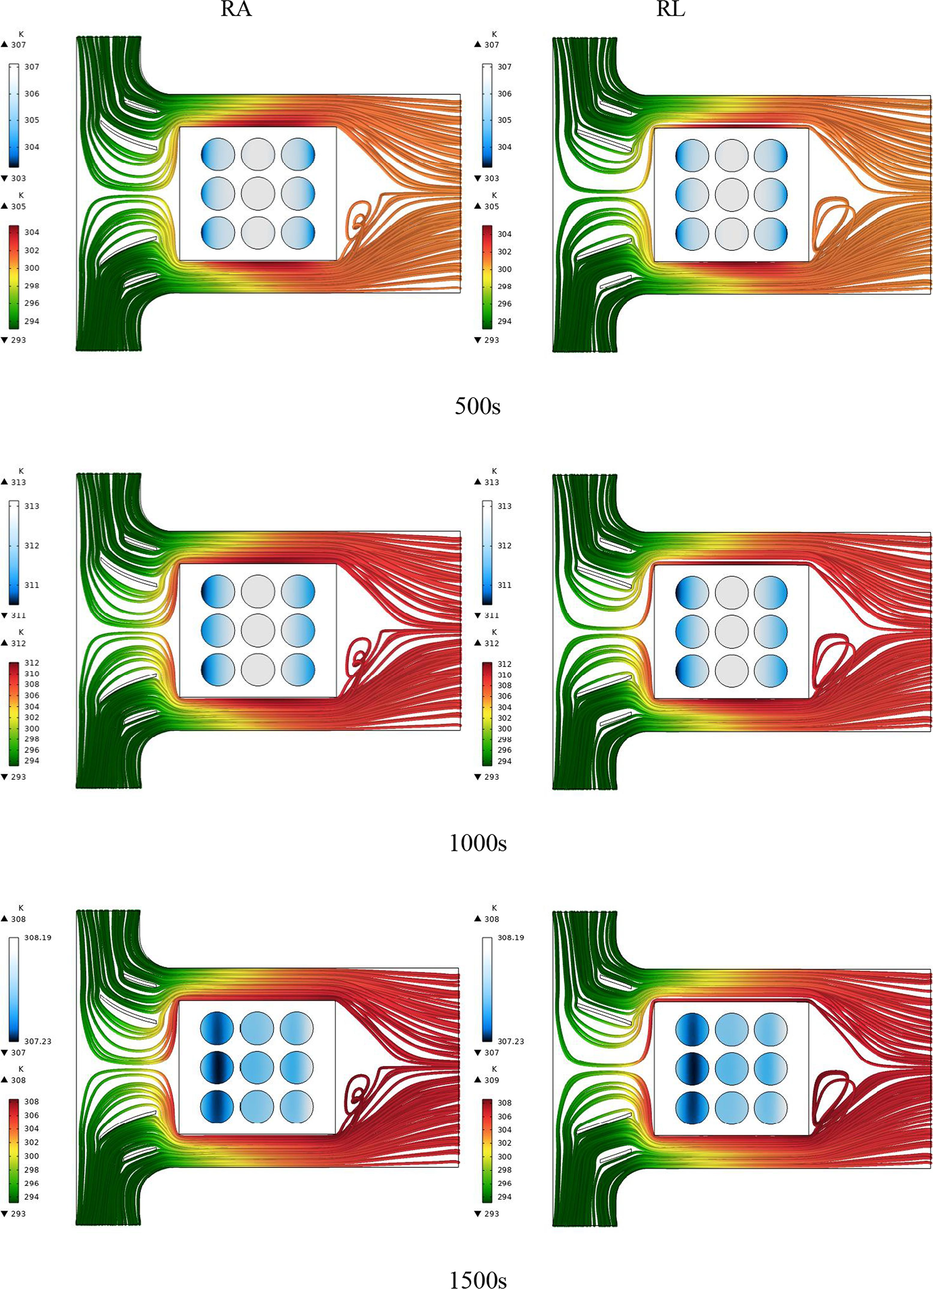
The battery temperature contours and the air streamlines for different times corresponding to the square arrangement of the batteries and arc-shaped and linear guide blades.
The battery temperature contours and the air streamlines for different times corresponding to the square arrangement of the batteries and arc-shaped and linear guide blades.
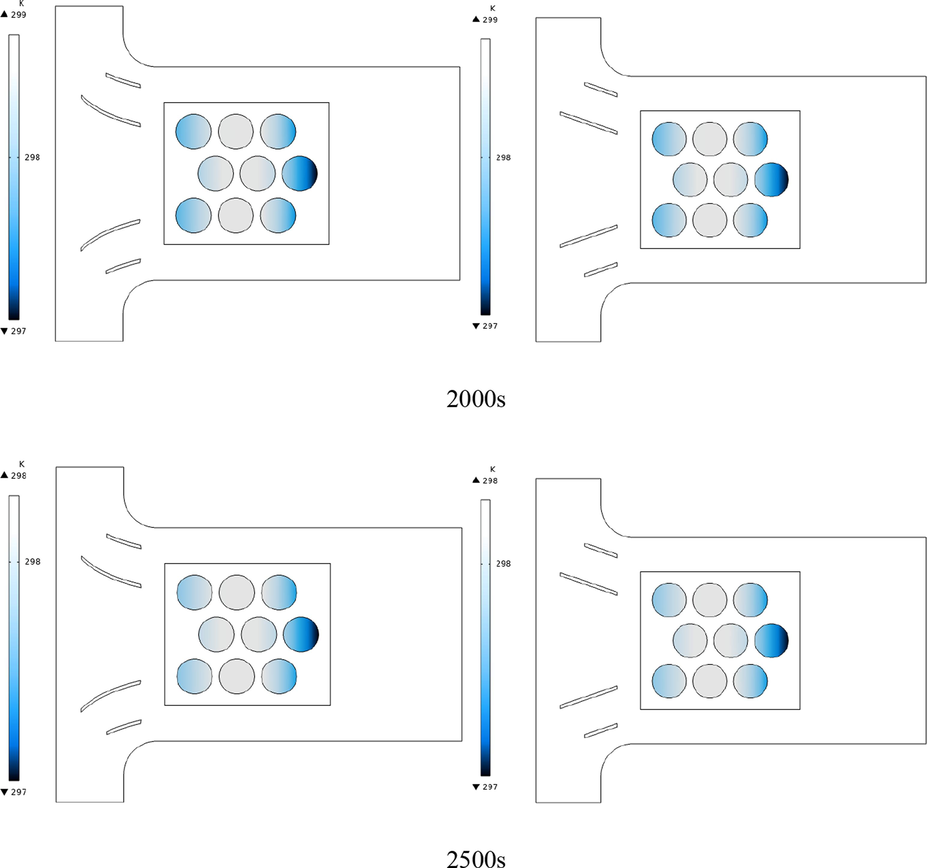
Fig. 10 displays the battery temperature contours for different times corresponding to a square configuration and arc-shaped and linear guide blades. Temperature variations are observed over the batteries due to the presence of guide blades on the one hand and the PCM on the other hand. The heat generated by the batteries led to an increasing trend in the battery temperature. Due to the manner of contact between the air and the PCM at various times, one of the battery rows was at a higher temperature each time. In the beginning, the middle row was at a high temperature; however, later, this row had the lowest temperature. The maximum battery temperature increased up to 1000 s although it decreased afterward. The presence of the PCM contributed to the uniformity of the battery temperature and caused a smaller temperature variation to be observed over the battery cells in different regions. The arc-shaped blades led to a higher reduction of the battery temperature compared to the linear ones. The arch shape of the blades better guided the air toward the warmer parts of the PCM, decreasing the temperature of the battery and the PCM.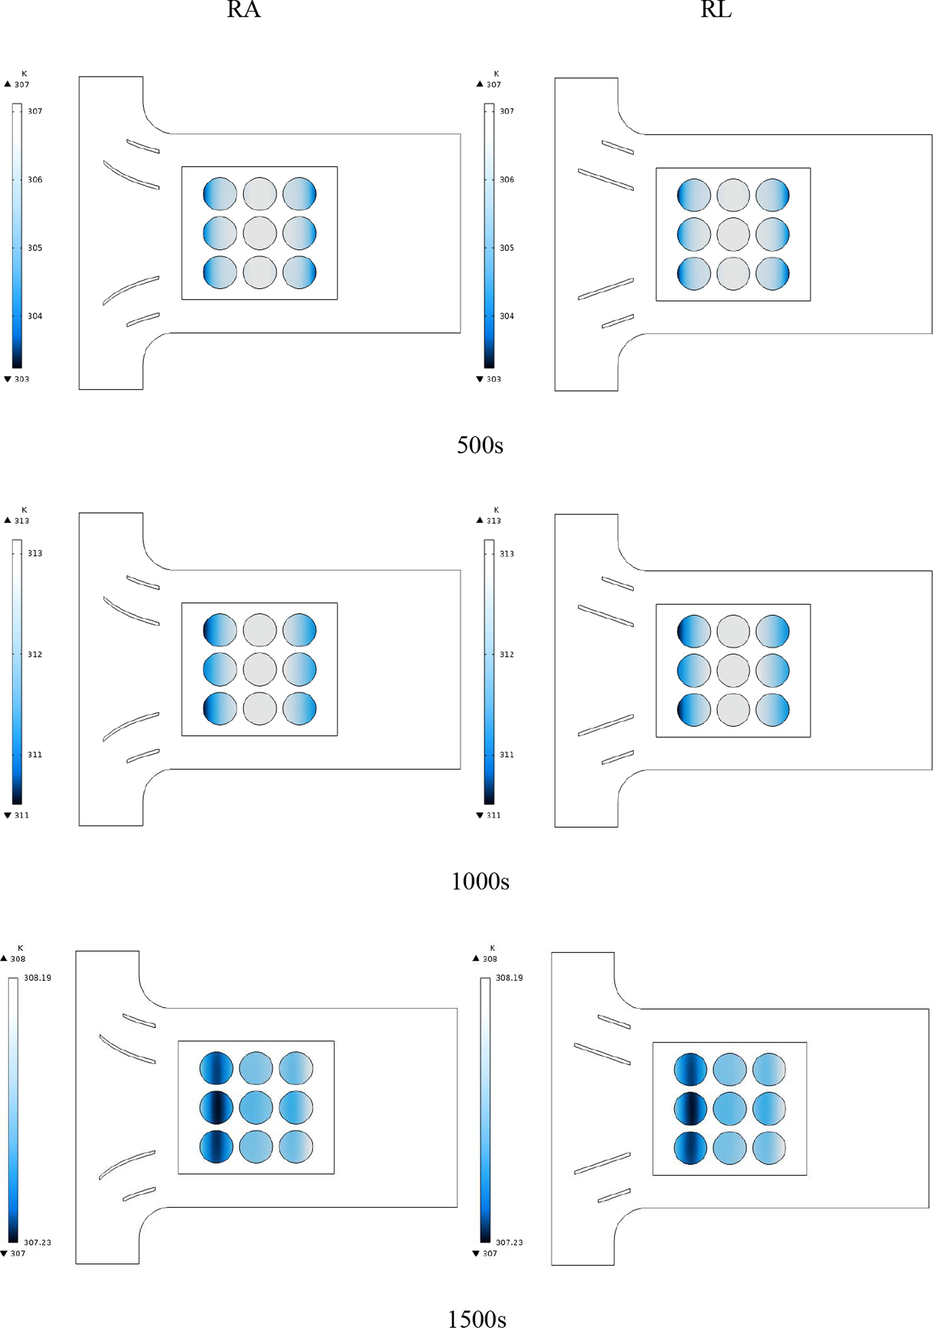
Battery temperature contours for different times up to 2500 s for a square arrangement and arc-shaped and linear guide blades.
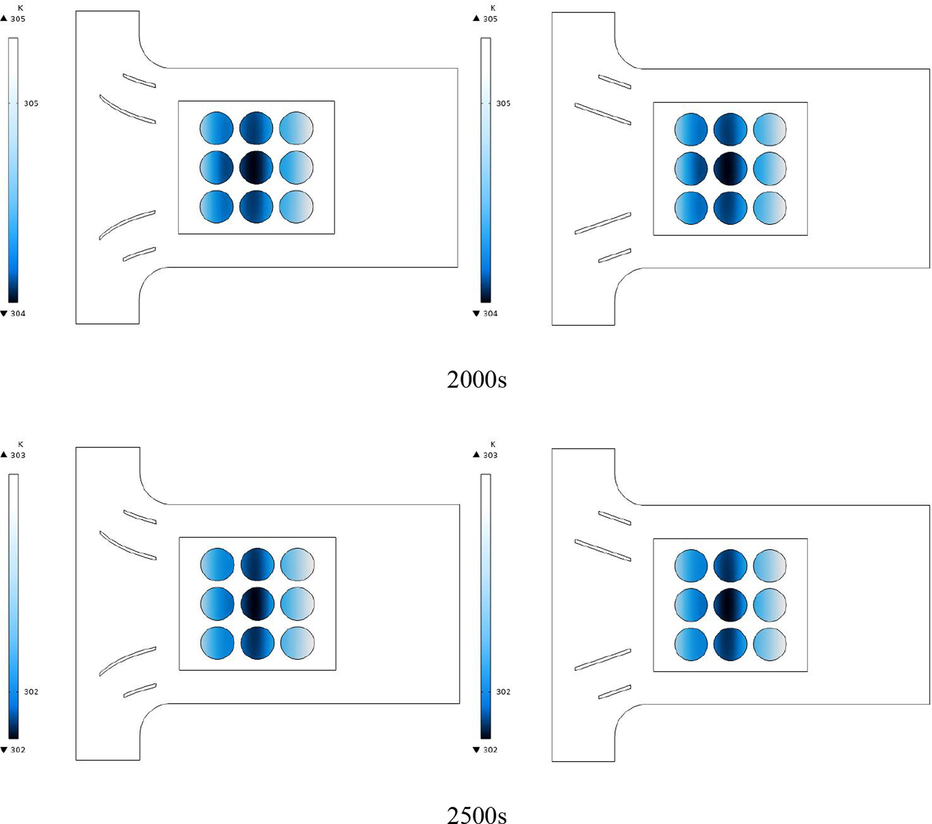
Battery temperature contours for different times up to 2500 s for a square arrangement and arc-shaped and linear guide blades.
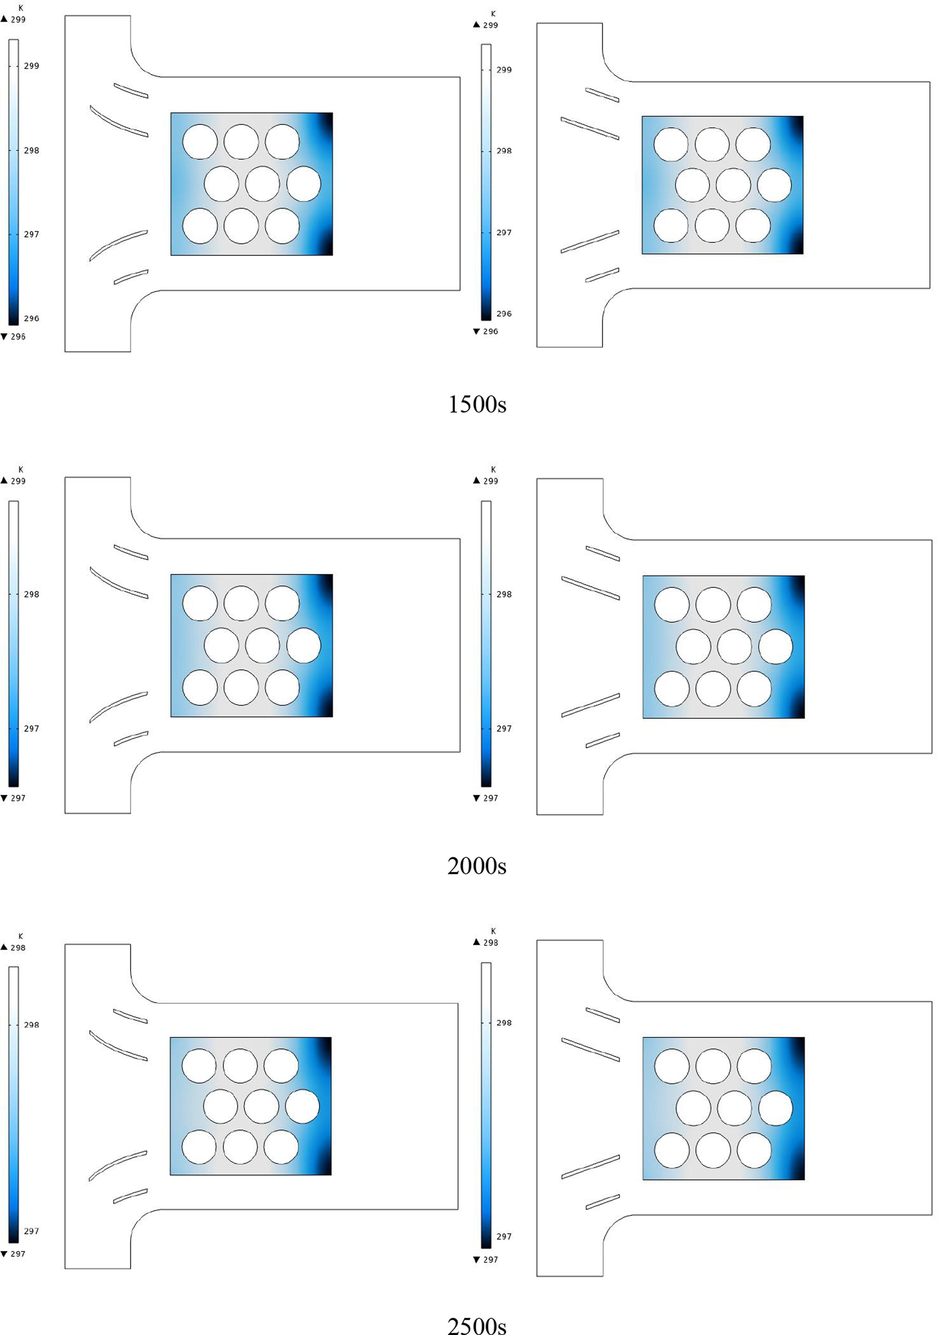
Fig. 11 displays the PCM temperature contours for different times up to 2500 s corresponding to a square configuration and arc-shaped and linear guide blades. The temperatures of the PCM and the battery are strongly inter-dependent, and temperature variations in each affect the temperature of the other one. Initially, the temperature of the PCM in the front and rear of the container was low, and the highest temperature belonged to the middle of the container. However, over time, the temperature of the middle section decreased, while that of the rear part increased. The collision between cold air and the middle part caused the PCM container to cool down from this part. Using the guide blades, the flow was adjusted so that proper amounts of air reached all the region of the PCM container; hence, the temperature changes in the PCM and the battery was low. the arc-shaped guide blades performed slightly better here and reduced the PCM temperature by a larger value.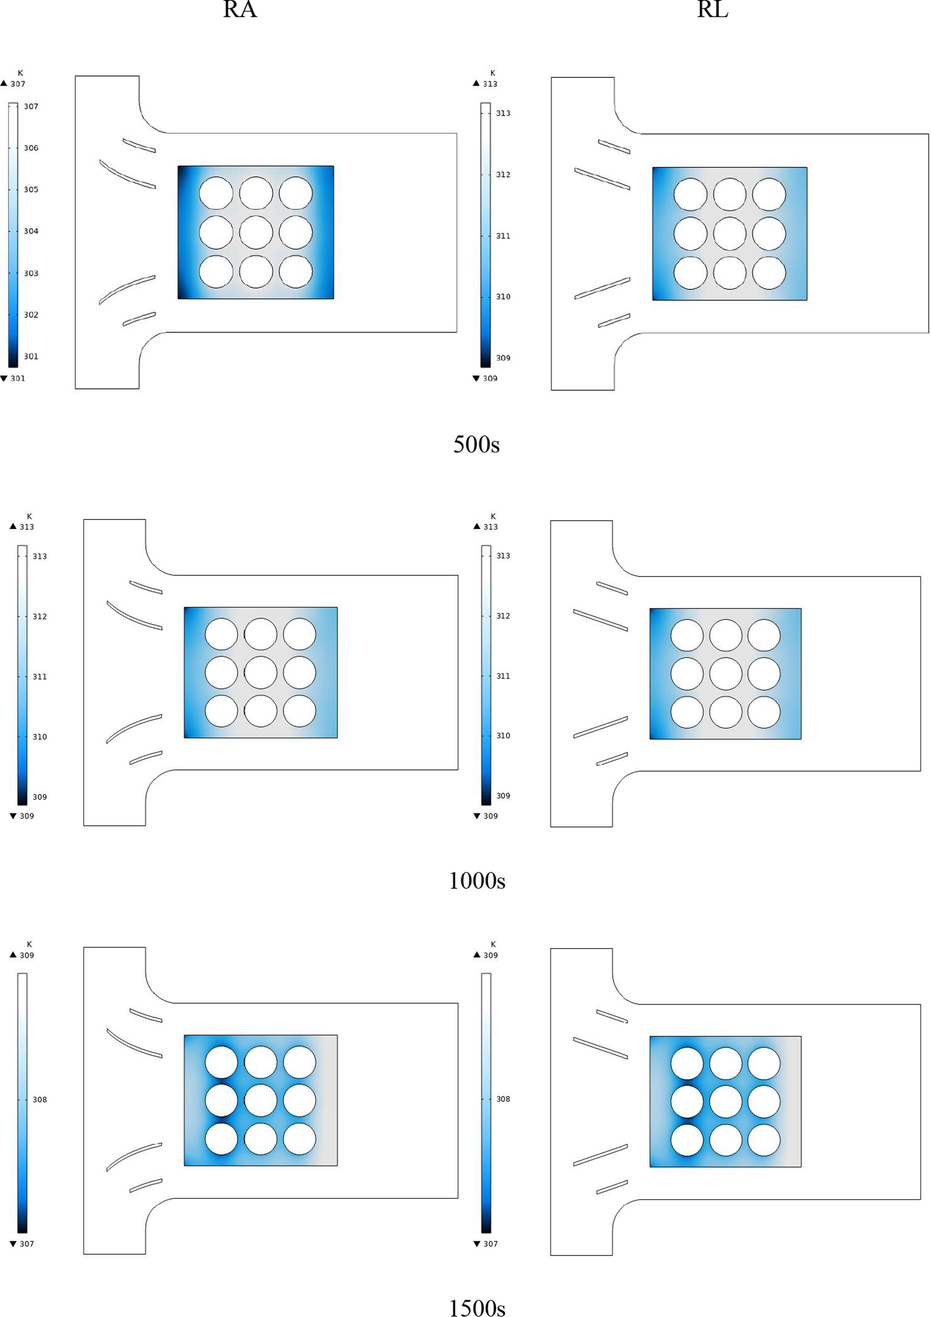
Temperature contours of the PCM around the batteries for different times up to 2500 s for a square arrangement and arc-shaped and linear guide blades.
Temperature contours of the PCM around the batteries for different times up to 2500 s for a square arrangement and arc-shaped and linear guide blades.
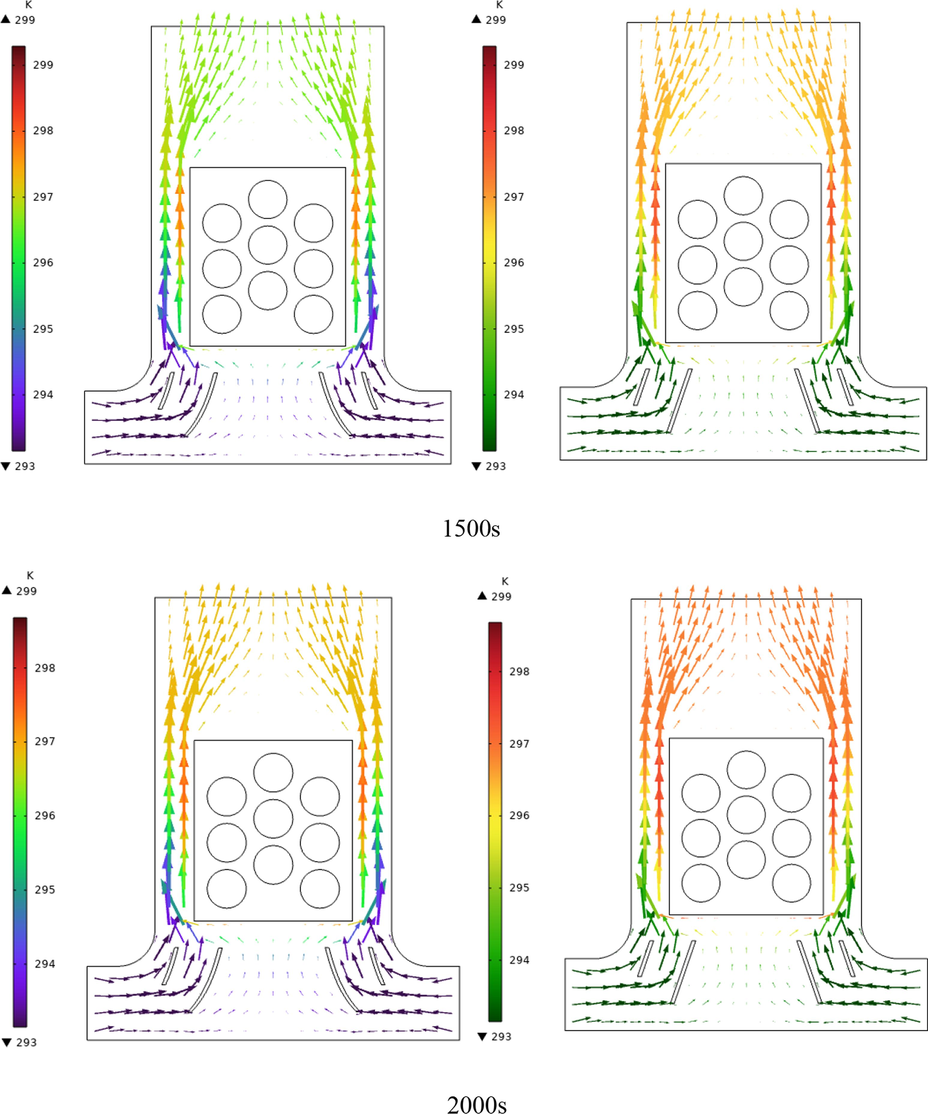
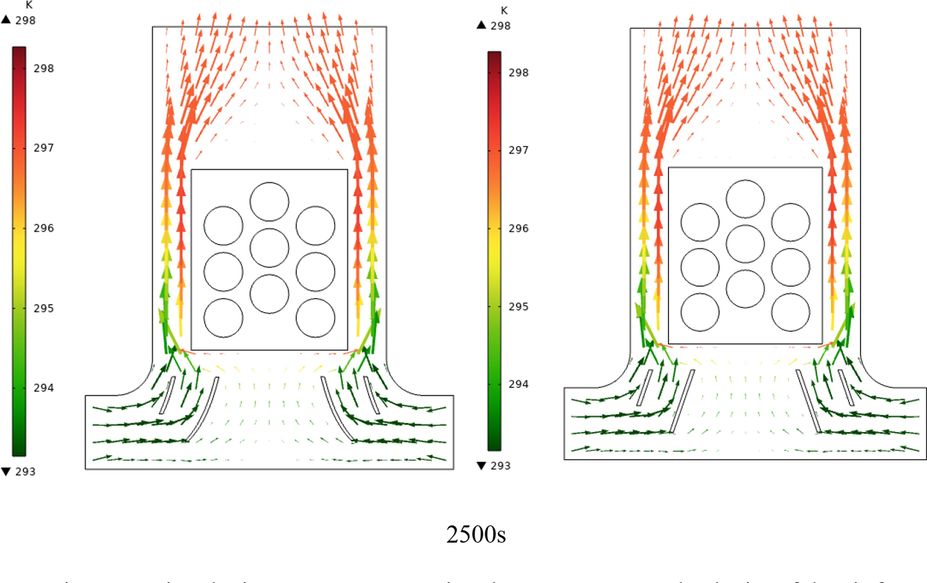
Fig. 12 displays the air velocity vectors representing the temperature and velocity of air at different times up to 2500 s corresponding to the square and arc-shaped and linear guide blades. The changes in the air temperature inside the duct are due to the heat generated in the batteries and the energy stored in the PCM. The energy stored in the PCM increased the air temperature upon the impact of the weather has caused when the batteries did not produce heat. Up to 1000 s, the air temperature increased due to the heat generation in the batteries although, after this time, the air temperature changed owing to the energy stored in the PCM. The air passing beside the PCM container collided with the PCM, taking its heat and warming up at every section. A low-velocity air region is observed in the front and back of the PCM container. A very small amount of air passes through this region, and heat transfer is very low here. Hence, the PCM was cooled less through this region. On the other hand, considerable PCM cooling occurred through the sides of the container due to the high speed of air.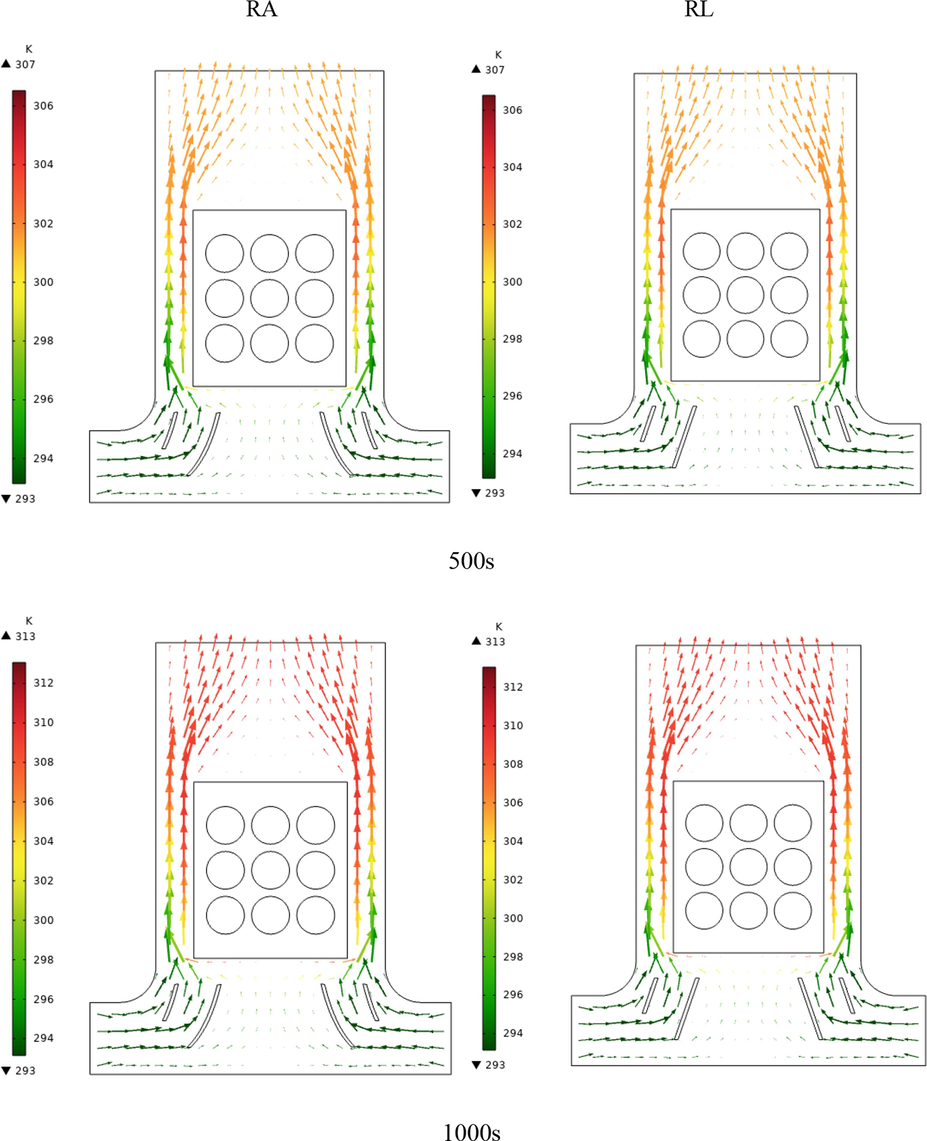
Air velocity vectors representing the temperature and velocity of the air for different times up to 2500 s for a square arrangement and arc-shaped and linear guide blades.
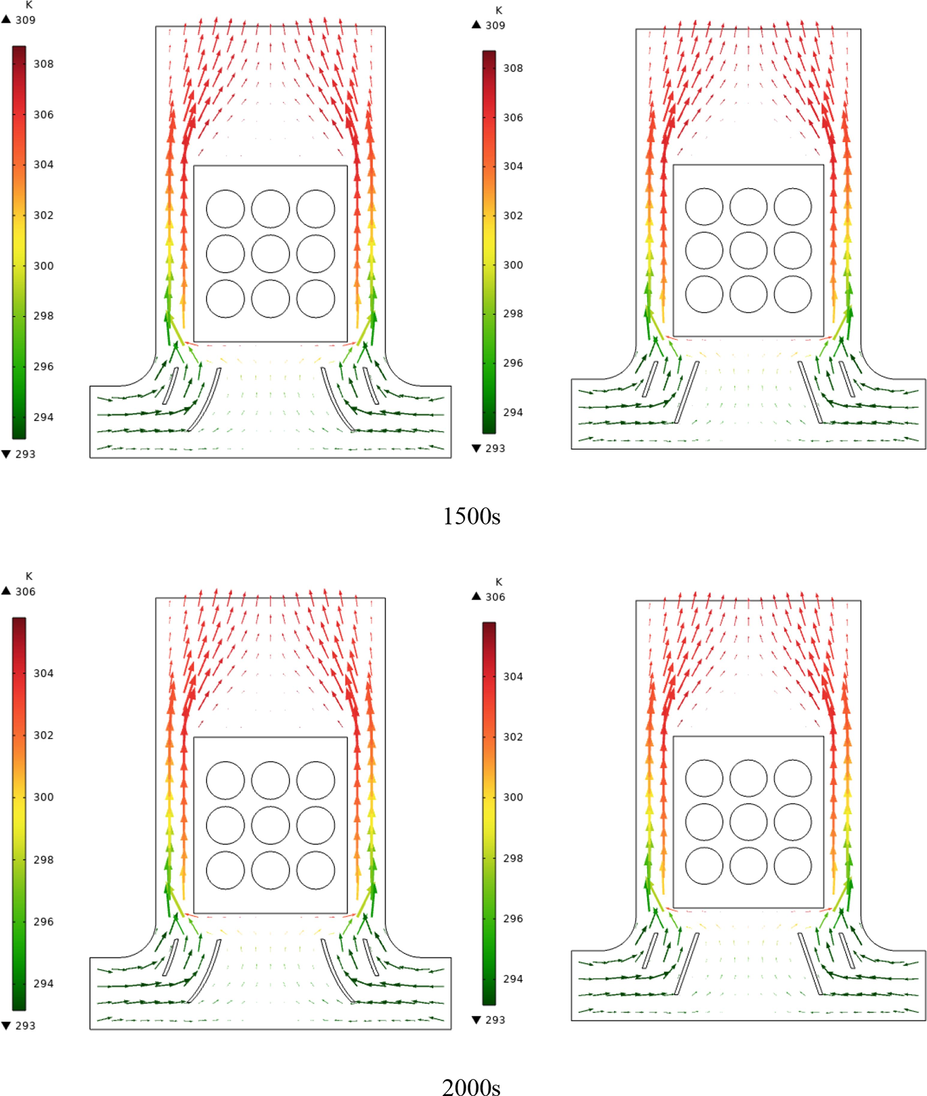
Air velocity vectors representing the temperature and velocity of the air for different times up to 2500 s for a square arrangement and arc-shaped and linear guide blades.
Air velocity vectors representing the temperature and velocity of the air for different times up to 2500 s for a square arrangement and arc-shaped and linear guide blades.
6.3 Comparison between different models
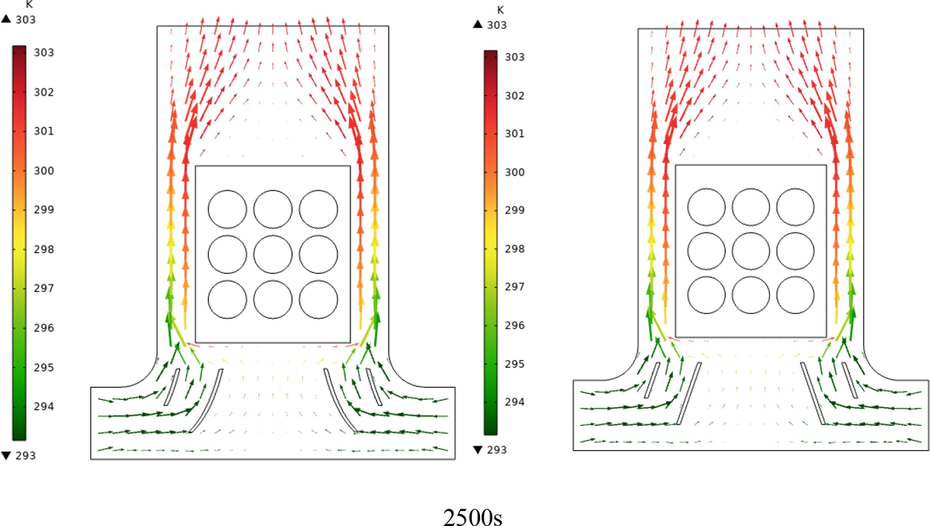
Fig. 13 displays the average battery temperature for different times up to 2500 s corresponding to the diamond and square configurations and arc-shaped and linear guide blades. The battery arrangement in the pack significantly affects the battery temperature: the square arrangement causes a lower temperature over the batteries compared to the diamond arrangement. A square battery configuration results in batteries being arranged in identical rows and the temperatures of the battery cells being closer. The temperature of the middle batteries considerably affects the average pack temperature. The outer sides of batteries toward the outside of the battery pack were at a lower temperature, while their inner sides were at a higher temperature. In the diamond arrangement, the middle batteries were at a higher temperature and increased the temperature of the pack. Moreover, the arched-shaped blades caused a lower battery pack temperature in both arrangements. Better flow guidance toward the warmer parts of the battery pack caused by the arched-shaped blades led to a lower pack temperature compared to linear blades.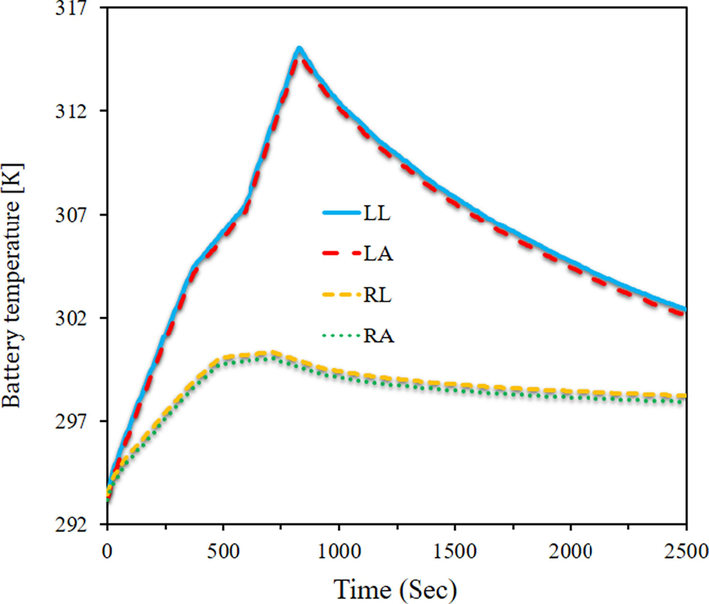
Average battery temperature for different times up to 2500 s for the diamond and square arrangements and arc-shaped and linear guide blades.
Fig. 14 displays the average temperature of the PCM around the battery for different times up to 2500 s corresponding to the diamond and square configurations and arc-shaped and linear guide blades. The battery configuration affected the temperature of the PCM. The square arrangement reduced the PCM temperature more than the diamond arrangement. The impact of the battery configuration on the temperatures of the batteries and the surrounding PCM was more tangible when a significant rise occurred in the battery temperature. Using the PCM contributed to the temperature uniformity of the battery and the reduction in temperature jumps. The square arrangement increased the PCM effect, such that no significant increase in the PCM temperature was observed at different times. In addition, the arc-shaped blades reduced the PCM temperature more than the linear ones. Better guidance of the flow toward the warmer PCM areas led to the higher reduction in the PCM temperature by the arc-shaped blades.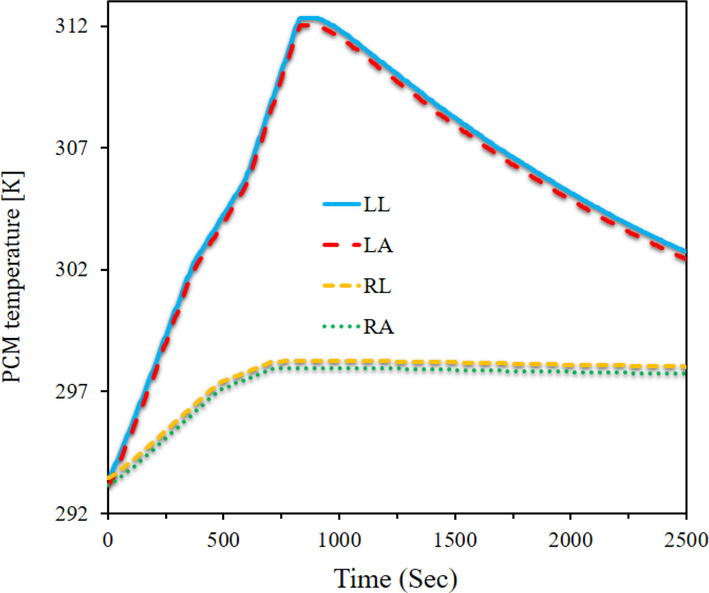
The average temperature of the PCM around the battery for different times up to 2500 s for the diamond and square arrangements and arc-shaped and linear guide blades.
Fig. 15 displays the outlet air temperature at different times up to 2500 s corresponding to the diamond and square configurations and arc-shaped and linear guide blades. The outlet air temperature also depends on the battery and PCM temperatures, and the increase or decrease in the temperature of these two regions affects the air temperature. The air temperature experienced a large increase at about 1000 s in the diamond battery arrangement due to the large increase in the battery temperature. This rise in the outlet air temperature is not seen in the square arrangement, and therefore the battery temperature did not increase in this arrangement. Furthermore, the arc-shaped blades caused the outlet air temperature to be higher compared to linear blades in both the diamond and square configurations. In the diamond configuration, the air temperature first increased and then decreased, while in the square configuration, the air temperature continually increased although at a small slope.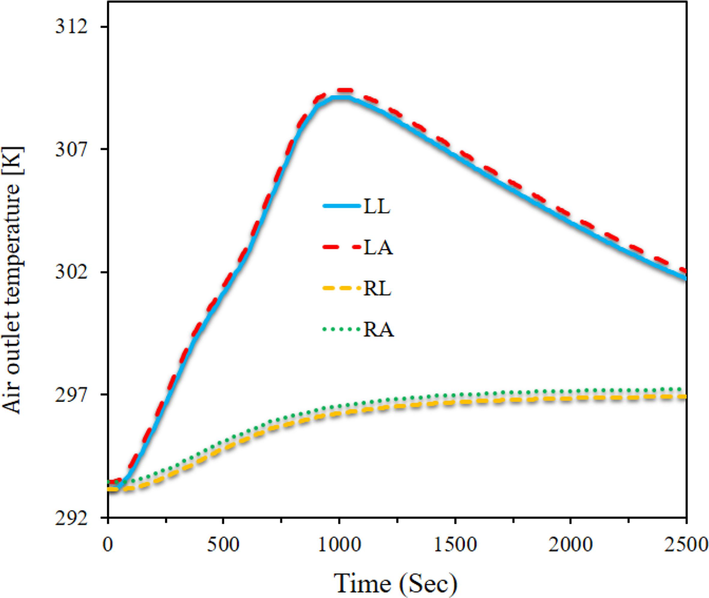
Outlet air temperature at different times up to 2500 s for the diamond and square arrangements and arc-shaped and linear guide blades.
7 Optimization
Most optimization problems in engineering are more complicated than that to be solved by conventional optimization methods like mathematical programming and similar ones. The optimization aims to find the best acceptable solution regarding the problem constraints and requirements. In this study, the goal is to minimize the maximize temperature. Artificial neural networks (ANNs) are a class of mathematical techniques that display a mapping from input space (input layer) to output space (output layer) while identifying correlations between data (Fig. 16).
General schematic of an ANN.
Several predetermined indices, including as mean square error (MSE), mean absolute error (MAE), sum square error (SSE), and correlation coefficient, are used to assess the trained network's performance. These indexes are computed using the formulas below:
The layers-and-error procedure used to determine the neural network's ideal structure for predicting Tmax is displayed in the above table. In this Table 3, NA1 is the correlation coefficient between the model output and training data, NA2 is the correlation coefficient between the model output and validation data, and NA3 is the correlation coefficient between the model output and test data. Also, NA4 reflects the correlation coefficient between the model output and all experimental data. MSE and correlation coefficient are calculated and compared for different numbers of neurons.
Number of hidden layers
Number of neurons in each hidden layer
Average squares error
NA1
NA2
NA3
NA4
1
2
2.705509
0.9928
0.9916
0.9908
0.9922
1
3
0.856914
0.9982
0.9986
0.9975
0.9979
1
4
0.472451
0.9986
0.9996
0.9983
0.9987
1
5
0.155402
0.9996
0.9999
0.9995
0.9995
1
6
0.224469
0.9994
0.9997
0.9998
0.9996
2
2
1.73287
0.9948
0.9971
0.994
0.9951
2
3
0.249084
0.9989
0.999
0.9981
0.9988
2
4
0.34699
0.9986
0.9991
0.997
0.9986
2
5
0.291761
0.9996
0.9991
0.9986
0.9992
2
6
0.059516
0.9998
0.9997
0.9959
0.9998
As a result, a multi-layer perceptron network is taken into account that has two hidden layers and six neurons in each hidden layer. The MSE for the chosen number of neurons is 0.0972, and the correlation coefficient is very close to 1, as shown in the above table, demonstrating the neural network's excellent performance. The generated heat flux in the battery reaches its maximum when the battery temperature reaches its maximum, according to the results of the neural network algorithm. On the other hand, further melting of phase change materials causes the battery surface temperature to be increased when the airflow velocity around the batteries and phase change materials is high. Therefore, if the aim is the minimization of the battery surface temperature, comparing this parameter between the proposed and numerical models shows a 2.01 % error.
8 Conclusion
In this paper, the performance of a nine-cell battery pack was investigated using numerical methods. Temperature control of the batteries was managed through airflow and PCM that surrounded the batteries. Curved and linear guide blades at the air inlet were used to direct the airflow towards the PCM. This research was conducted using two arrangements, square and diamond, for positioning the batteries within the PCM, and the results are summarized as follows:
-
The square arrangement led to a reduction in the temperature of both the PCM and the batteries compared to the diamond arrangement. This reduction was significant at some times.
-
In the square arrangement, the temperature of the outgoing air showed a gradual increasing trend; whereas in the diamond arrangement, the outgoing air temperature initially increased sharply and then decreased.
-
The diamond arrangement resulted in higher outgoing air temperatures compared to the square arrangement.
-
Curved blades were more effective in reducing the temperature of the batteries and PCM than linear blades, with reductions close to half a degree at some times.
-
Curved blades resulted in lower outgoing air temperatures compared to linear blades.
-
In the diamond arrangement, the central batteries were consistently the warmest, while in the square arrangement, these batteries were the warmest up to 1000 s and subsequently the coolest in the battery pack.
CRediT authorship contribution statement
Saeed Alqaed: Investigation, Methodology, Project administration, Writing – original draft, Writing – review & editing. Jawed Mustafa: Data curation, Investigation, Writing – review & editing. S. Mohammad Sajadi: Methodology, Project administration, Writing – review & editing. Salem Ali Hamdan Alajmi: Data curation. Mohammed Saleh Alsnan: Data curation. Hikmet Ş. Aybar: Methodology, Writing – original draft, Writing – review & editing.
Acknowledgements
The authors are thankful to the Deanship of Scientific Research at Najran University for funding this work under the Future Funding program grant code (NU/SRP/SERC/12/19).
Declaration of competing interest
The authors declare that they have no known competing financial interests or personal relationships that could have appeared to influence the work reported in this paper.
References
- Thermal management of modern electric vehicle battery systems (MEVBS) J. Therm. Anal. Calorim.. 2021;144:1271-1285.
- [Google Scholar]
- A review on lithium-ion power battery thermal management technologies and thermal safety. J. Therm. Sci.. 2017;26:391-412.
- [Google Scholar]
- Bais, A., Subhedar, D., Panchal, S. 2023. Experimental investigation of longevity and temperature of a lithium-ion battery cell using phase change material based battery thermal management system, Mater. Today: Proc.
- Cao, M. 2014. Thermal and cooling systems modeling of powertrain for a plug-in parallel-through-the-road hybrid electric vehicle.
- Investigation of the use of extended surfaces in paraffin wax phase change material in thermal management of a cylindrical lithium-ion battery: Applicable in the aerospace industry. J. Storage Mater.. 2022;45:103685
- [Google Scholar]
- A convolutional neural network for estimation of lithium-ion battery state-of-health during constant current operation. IEEE Transportation Electrification Conference & Expo (ITEC). 2023;2023:1-6.
- [Google Scholar]
- A hybrid thermal management system with liquid cooling and composite phase change materials containing various expanded graphite contents for cylindrical lithium-ion batteries. Appl. Therm. Eng.. 2022;200:117702
- [Google Scholar]
- Prediction of thermal behaviors of an air-cooled lithium-ion battery system for hybrid electric vehicles. J. Power Sources. 2014;270:273-280.
- [Google Scholar]
- Investigation of passive method in thermal management of lithium-ion batteries at different discharge rates by changing the number of cavities containing phase change materials. J. Storage Mater.. 2022;52:104758
- [Google Scholar]
- Thermal management of air-cooling lithium-ion battery pack. Chin. Phys. Lett.. 2021;38:118201
- [Google Scholar]
- Improving the performance of a two-sided vibro-impact energy harvester with asymmetric restitution coefficients. Int. J. Mech. Sci.. 2022;217:106983
- [Google Scholar]
- Non-linear finite element modelling of light-to-heat energy conversion applied to solar nanofluids. Int. J. Mech. Sci.. 2020;188:105952
- [Google Scholar]
- Canopy-to-canopy liquid cooling for the thermal management of lithium-ion batteries, a constructal approach. Int. J. Heat Mass Transf.. 2022;182:121918
- [Google Scholar]
- A comprehensive review of future thermal management systems for battery-electrified vehicles. J. Storage Mater.. 2020;31:101551
- [Google Scholar]
- Hybrid cooling of cylindrical battery with liquid channels in phase change material. Int. J. Energy Res.. 2021;45:11065-11083.
- [Google Scholar]
- Computational analysis of preheating cylindrical lithium-ion batteries with fin-assisted phase change material. Int. J. Modern Phys. C. 2024;35:1-16.
- [Google Scholar]
- Panchal, Thermal management of large-sized LiFePO4 pouch cell using simplified mini-channel cold plates. Appl. Therm. Eng.. 2023;234:121286
- [Google Scholar]
- Characterization of in-situ material properties of pouch lithium-ion batteries in tension from three-point bending tests. Int. J. Mech. Sci.. 2022;219:107090
- [Google Scholar]
- Air cooled lithium-ion battery with cylindrical cell in phase change material filled cavity of different shapes. J. Storage Mater.. 2022;50:104573
- [Google Scholar]
- An alternative cooling system to enhance the safety of Li-ion battery packs. J. Power Sources. 2009;194:1105-1112.
- [Google Scholar]
- A review on recent progress, challenges and perspective of battery thermal management system. Int. J. Heat Mass Transf.. 2021;167:120834
- [Google Scholar]
- A review of hazards associated with primary lithium and lithium-ion batteries. Process Saf. Environ. Prot.. 2011;89:434-442.
- [Google Scholar]
- Thermal characteristics of power battery pack with liquid-based thermal management. Appl. Therm. Eng.. 2020;164:114421
- [Google Scholar]
- Reciprocating air flow for Li-ion battery thermal management to improve temperature uniformity. J. Power Sources. 2011;196:5685-5696.
- [Google Scholar]
- Battery thermal management systems: Recent progress and challenges. Int. J. Thermofluids. 2022;15:100171
- [Google Scholar]
- Effect of shape and arrangement of micro-structures in a microchannel heat sink on the thermo-hydraulic performance. Appl. Therm. Eng.. 2021;190:116755
- [Google Scholar]
- A review of power battery thermal energy management. Renew. Sustain. Energy Rev.. 2011;15:4554-4571.
- [Google Scholar]
- Experimental investigation on thermal management of electric vehicle battery with heat pipe. Energ. Conver. Manage.. 2013;65:92-97.
- [Google Scholar]
- Subhedar, D., Chauhan, K.V., Panchal, S., Bais, A. 2023. Numerical investigation of performance for liquid-cooled cylindrical electrical vehicle battery pack using Al2O3/EG-water nano coolant. Mater. Today: Proc.
- Numerical investigation on conventional and PCM heat sinks under constant and variable heat flux conditions. Clean Techn. Environ. Policy. 2021;23:1105-1120.
- [Google Scholar]
- A computationally efficient coupled electrochemical-thermal model for large format cylindrical lithium ion batteries. J. Electrochem. Soc.. 2019;166 A30-59A3071
- [Google Scholar]
- A review on research status and key technologies of battery thermal management and its enhanced safety. Int. J. Energy Res.. 2018;42:4008-4033.
- [Google Scholar]
- A comprehensive review on the application of hybrid nanofluids in solar energy collectors. Sustainable Energy Technol. Assess.. 2021;47:101341
- [Google Scholar]
- Comparative study on the thermal characteristics of solid-state lithium-ion batteries. IEEE Trans. Transp. Electrif.. 2024;10:1541-1557.
- [Google Scholar]
- Thermal performance of honeycomb-like battery thermal management system with bionic liquid mini-channel and phase change materials for cylindrical lithium-ion battery. Appl. Therm. Eng.. 2021;188:116649
- [Google Scholar]


