

Translate this page into:
Design, synthesis, and biological evaluation of (E)-3-(3-methoxy-4-substituted phenyl)-acrylic acid derivatives: Role of compound S17 in regulating lipid accumulation via AMPK activation
⁎Corresponding authors. 20070945@jxutcm.edu.cn (Yanfei Xie), qianyuqing@jxutcm.edu.cn (Yuqing Qian), zhousiyu@jxutcm.edu.cn (Siyu Zhou)
-
Received: ,
Accepted: ,
This article was originally published by Elsevier and was migrated to Scientific Scholar after the change of Publisher.
Abstract
Non-alcoholic fatty liver disease (NAFLD) is increasingly recognized as a global public health concern characterized by excessive lipid accumulation in the liver. Ferulic acid (FA), a common foodborne phenolic acid, has been shown to reduce lipid accumulation by activating adenosine monophosphate-activated protein kinase (AMPK) and suppressing the expression of sterol regulatory element-binding protein-1 (SREBP-1). In this study, we synthesized a new class of (E)-3-(3-methoxy-4-substituted phenyl)-acrylic acid derivatives as AMPK activators. Among these derivatives, compound S17 demonstrated a more potent inhibitory effect on lipid accumulation compared to its counterparts. Specifically, S17 notably diminished intracellular triglyceride (TG) levels and the activities of alanine aminotransferase (ALT) and aspartate aminotransferase (AST), which are indicators of liver function. In addition, S17 curtailed intracellular lipid accumulation by activating the AMPK signaling pathway and down-regulating the protein expression of SREBP-1 in free fatty acid (FFA)-induced HepG2 cells. Therefore, findings from this study strongly suggest that compound S17 may serve as a promising therapeutic candidate for the treatment of NAFLD.
Keywords
Nonalcoholic fatty liver disease
Ferulic acid
Lipid accumulation
AMPK activator

1 Introduction
Non-alcoholic fatty liver disease (NAFLD) is a leading cause of chronic liver diseases and poses a significant global public health challenge (Ludwig et al., 1980, Mehta et al., 2002). NAFLD represents a spectrum of liver conditions ranging from simple fat accumulation to nonalcoholic steatohepatitis (NASH). These conditions can further progress to severe stages, including hepatocyte injury, fibrosis, cirrhosis, and even hepatocellular carcinoma (Wong et al., 2015, Sheka et al., 2020). The irreversible liver damage and the high mortality rates associated with NAFLD underscore the urgent need for effective treatments (Cohen et al., 2011). Currently, the primary approach to managing NAFLD involves lifestyle modifications to achieve weight loss, with few drugs officially approved for treatment (Schuppan et al., 2010, Lazarus et al., 2022). Therefore, developing novel and efficacious treatment methods for NAFLD is urgently needed.
Ferulic acid (FA), a foodborne phenolic acid, is widely found in various foods, including vegetables, grains, fruits, and other dietary sources (Mathew and Abraham, 2006). It is also a key active ingredient in several Chinese herbs, such as Ferula asafoetida, Angelica sinensis, sour jujube kernels, Actaea cimicifuga L., and Ligusticum wallichii (Ji et al., 1999, Bunel et al., 2015). Extensive research has highlighted that the diverse pharmacological effects of FA (Mancuso and Santangelo, 2014), including anti-inflammatory (Ronchetti et al., 2006), antithrombotic (Hong et al., 2016), anticancer (Muthusamy et al., 2016), antidiabetic (Narasimhan et al., 2015), anti-atherogenic (Sri Balasubashini et al., 2003), lung-protective (Sudheer et al., 2005), and antidepressant activities (Zeni et al., 2012). Moreover, FA has been documented to repress lipogenesis by enhancing the phosphorylation of AMP-activated protein kinase (AMPK) in vitro and in vivo. This evidence supports the potential of FA as a therapeutic agent for the treatment of NAFLD (Ilavenil et al., 2017, Cui et al., 2022). AMPK is a critical regulator of hepatic lipid metabolism and a potential therapeutic target in NAFLD. Its phosphorylation leads to the activation of acetyl-CoA carboxylase 1 (ACC1) and a reduction in the expression of SREBP-1 (Kim et al., 2011, Hardy et al., 2015, Carling, 2017). Nevertheless, the application of FA in NAFLD treatment is limited due to its low activity and suboptimal efficacy. Hence, the development of small synthetic molecules derived from FA becomes a promising strategy for treating NFALD diseases.
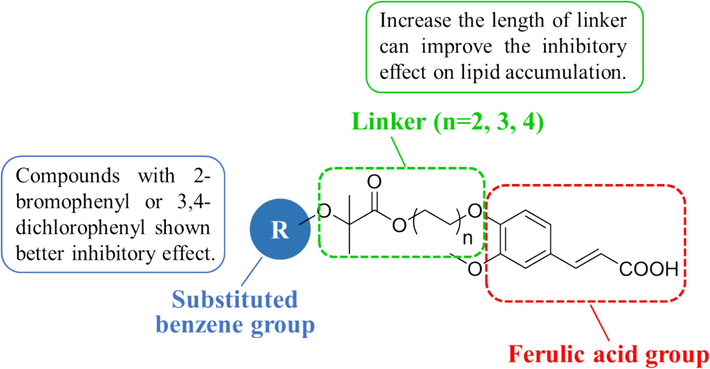
In response to these limitations, our study focuses on the design, synthesis, and evaluation of a series of (E)-3-(3-methoxy-4-substituted phenyl)-acrylic acid derivatives derived from FA to activate AMPK against NAFLD. These molecules were designed as hetero-bifunctional chimeric molecules, incorporating a FA structure, a substituted benzene group as a target protein ligand, and a linker to enhance lipid accumulation inhibition (Fig. 1). We also conducted a structure–activity relationship (SAR) analysis to clarify the impact of the substituted benzene group and linker length on lipid accumulation in HepG2 cells. Accordingly, compounds S10 and S17 were identified as notable candidates based on cell viability assays and Oil Red O staining. Subsequent biological mechanism studies revealed that S17 up-regulated AMPK phosphorylation, stimulated ACC1 phosphorylation, and diminished SREBP-1 expression, thereby contributing to the suppression of lipid accumulation in the HepG2 cell line.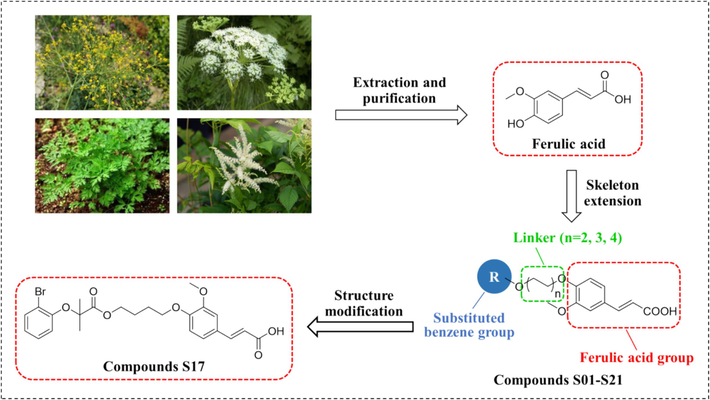
Schematic representation of the design and structural modification strategy for target compounds.
2 Materials and methods
2.1 Chemistry
Chemicals and reagents commonly utilized in this study were acquired from Energy Chemical and Sigma-Aldrich and used as received without further purification. Reaction progress was monitored using thin-layer chromatography (TLC) on silica gel HSGF254 plates from Marine Chemical Inc. (Qingdao, China), with UV light visualization at 254 nm and 365 nm. Nuclear magnetic resonance (NMR) spectra were recorded on a Bruker Avance III 600 MHz spectrometer, with tetramethylsilane as an internal reference, at the Analysis and Measurement Center, Jiangxi University of Chinese Medicine (Nanchang, China). Solvents used for NMR included DMSO‑d6/CDCl3/CD3OD. Coupling constants (J) were estimated in Hertz (Hz), and splitting patterns were denoted as s (singlet), br s (broad singlet), d (doublet), t (triplet), q (quartet), dd (doublet of doublets), and m (multiplet). High-resolution electrospray ionization mass spectrometry (HR ESI-MS) was carried out using a Thermo Q-Exactive Mass spectrometer. Melting points were determined using an SGW X-4 micro-melting point spectrometer at the same center.
2.1.1 General procedure for the synthesis of compounds 2a-2i
To a stirred solution of substituted phenol 1a-1i (50.0 mmol) in acetone (30 mL), sodium hydroxide (10.00 g, 250.0 mmol) was added at room temperature. The reaction mixture was stirred under refluxing for 0.5 h, added chloroform (3.4 mL, 100.0 mmol) dropwise and refluxing for 3 h. Concentrate the resulting solution subsequently under vacuum, and the mixture was diluted with water (100 mL). The pH of mixture was adjusted to around 2 with 1 N HCl and then filtered. The filted cake was purified by silica gel column chromatography (petroleum ether:ethyl acetate = 5:2, v/v) to obtain compounds 2a-2i. Their spectral data were provided in Supplementary Material.
2.1.2 General procedure for the synthesis of compounds 4a-4c
Vanillin 3 (3.05 g, 20.0 mmol), halohydrin (50.1 mmol), K2CO3 (5.54 g, 40.1 mmol), TBAI (1.48 g, 4.0 mmol), DMF (10 mL) were added into a dry 100 mL round bottom flask and heated to 50 °C under stirring for 5 h. After the reaction was completed, the mixture was poured into water (50 mL) and extracted with EtOAc (30 mL × 3). The combined organic phase was washed with saturated brine, dried over anhydrous MgSO4, filtered and evaporated. The given residues were purified by silica gel column chromatography (petroleum ether:ethyl acetate = 3:1, v/v) to obtain the compounds 4a-4c. Their spectral data were provided in Supplementary Material.
2.1.3 General procedure for the synthesis of compounds 5a-5u
To a solution of substituted phenyloxyisobutyric acid 2a-2i (2.5 mmol) in anhydrous dichloromethane (6 mL) was subsequently added 4a-4c (3.8 mmol), 1-ethyl-3-(3-dimethylaminopropyl)carbodiimide (957 mg, 5.0 mmol), 4-dimethylaminopyridine (30 mg, 0.2 mmol) and triethylamine (0.9 mL, 6.2 mmol). The reaction mixture was stirred at room temperature for 5 h. Upon completion, the mixture was then poured into ice-water, extracted with dichloromethane (40 mL × 3). The combined extracts were then washed with saturated brine, dried over anhydrous MgSO4 and concentrated. The crude products were purified by silica gel column chromatography (petroleum ether:ethyl acetate = 5:1, v/v) to obtain the compounds 5a-5u. Their spectral data were provided in Supplementary Material.
2.1.4 General synthesis procedure for compounds S01-S21
A mixture of 5a-5u (2.0 mmol), malonic acid (416 mg, 4.0 mmol), piperidine (catalytic amount) and pyridine (5 mL) was added into a dry 25 mL round bottom flask. The reaction was heated to 90 °C under stirred for 8 h. The reaction solution was cooled to room temperature and poured into 20 mL of ice water. Then, the pH of mixture was adjusted to around 2 with 1 N HCl and extracted with CH2Cl2 (30 mL × 3). The combined organic layer was washed with water, saturated brine, dried over anhydrous MgSO4 and evaporated to obtain a residue purified by silica gel column chromatography (CH2Cl2: Methanol = 20:1, v/v) to obtain the compounds S01-S21.
2.1.4.1 (E)-3-(3-methoxy-4-(2-((2-methyl-2-(p-tolyloxy)propanoyl)oxy)ethoxy)phenyl)acrylic acid (S01)
Yield: 56 %, white solid; 1H NMR (600 MHz, CDCl3) δ 7.72 (d, J = 15.6 Hz, 1H), 7.10–––7.05 (m, 2H), 6.98 – 6.93 (m, 2H), 6.84 (d, J = 7.8 Hz, 1H), 6.78–––6.73 (m, 2H), 6.33 (d, J = 16.2 Hz, 1H), 4.57 (t, J = 4.8 Hz, 2H), 4.25 (t, J = 4.8 Hz, 2H), 3.86 (s, 3H), 2.23 (s, 3H), 1.58 (s, 6H); 13C NMR (150 MHz, CDCl3) δ 174.4, 172.6, 153.1, 150.5, 149.9, 147.0, 131.9, 129.7, 127.9, 123.0, 119.6, 115.3, 113.5, 110.7, 79.3, 66.8, 63.4, 56.1, 25.5, 20.7; HRMS (ESI) m/z calculated for C23H27O7 [M + H]+: 415.1751; found: 415.1752.
2.1.4.2 (E)-3-(3-methoxy-4-(2-((2-(4-methoxyphenoxy)-2-methylpropanoyl)oxy)ethoxy)phenyl)acrylic acid (S02)
Yield: 62 %, white solid; 1H NMR (600 MHz, CDCl3) δ 7.73 (d, J = 15.6 Hz, 1H), 7.13–––7.07 (m, 2H), 6.91–––6.84 (m, 3H), 6.73–––6.66 (m, 2H), 6.33 (d, J = 16.2 Hz, 1H), 4.63–––4.55 (m, 2H), 4.37–––4.26 (m, 2H), 3.87 (s, 3H), 3.71 (s, 3H), 1.55 (s, 6H); 13C NMR (150 MHz, CDCl3) δ 174.4, 172.4, 155.4, 150.5, 149.9, 148.9, 146.9, 127.9, 123.0, 121.9, 115.4, 114.2, 113.5, 110.7, 79.9, 66.8, 63.4, 56.1, 55.6, 25.4; HRMS (ESI) m/z calculated for C23H26O8K [M + K]+: 469.1259; found: 469.1247.
2.1.4.3 (E)-3-(4-(2-((2-(4-ethoxyphenoxy)-2-methylpropanoyl)oxy)ethoxy)-3-methoxyphenyl)acrylic acid (S03)
Yield: 66 %, white solid; 1H NMR (600 MHz, CDCl3) δ 7.69 (d, J = 15.6 Hz, 1H), 7.09–––7.02 (m, 2H), 6.84 (d, J = 8.4 Hz, 1H), 6.83–––6.78 (m, 2H), 6.69–––6.62 (m, 2H), 6.30 (d, J = 16.2 Hz, 1H), 4.55 (t, J = 4.8 Hz, 2H), 4.26 (t, J = 4.8 Hz, 2H), 3.88 (q, J = 7.2 Hz, 2H), 3.85 (s, 3H), 1.52 (s, 6H), 1.34 (t, J = 6.6 Hz, 3H);13C NMR (150 MHz, CDCl3) δ 174.4, 154.8, 150.5, 150.0, 148.8, 146.9, 128.0, 122.9, 121.9, 115.2, 114.8, 113.6, 110.8, 79.9, 66.9, 63.8, 63.4, 56.1, 25.5, 15.0; HRMS (ESI) m/z calculated for C24H29O8 [M + H]+: 445.1857; found: 445.1856.
2.1.4.4 (E)-3-(4-(2-((2-(2-bromophenoxy)-2-methylpropanoyl)oxy)ethoxy)-3-methoxyphenyl)acrylic acid (S04)
Yield: 58 %, white solid; 1H NMR (600 MHz, CDCl3) δ 7.72 (d, J = 16.2 Hz, 1H), 7.51 (dd, J = 7.8, 1.8 Hz, 1H), 7.09 (dd, J = 8.4, 1.8 Hz, 1H), 7.06 (d, J = 1.8 Hz, 1H), 7.03 (ddd, J = 9.0, 7.8, 1.8 Hz, 1H), 6.89 (dd, J = 7.8, 1.2 Hz, 1H), 6.85 (d, J = 8.4 Hz, 1H), 6.82 (td, J = 7.2, 1.2 Hz, 1H), 6.33 (d, J = 16.2 Hz, 1H), 4.60 (t, J = 4.8 Hz, 2H), 4.27 (t, J = 4.8 Hz, 2H), 3.86 (s, 3H), 1.63 (s, 6H); 13C NMR (150 MHz, CDCl3) δ 174.0, 171.7, 152.4, 150.3, 149.8, 146.7, 133.4, 127.9, 123.6, 122.8, 119.6, 116.2, 115.2, 113.5, 110.6, 80.8, 66.7, 63.4, 55.9, 25.2; HRMS (ESI) m/z calculated for C22H24BrO7 [M + H]+: 479.0700; found: 479.0687.
2.1.4.5 (E)-3-(4-(2-((2-(3,5-dimethoxyphenoxy)-2-methylpropanoyl)oxy)ethoxy)-3-methoxyphenyl)acrylic acid (S05)
Yield: 57 %, white solid; 1H NMR (600 MHz, CDCl3) δ 7.71 (d, J = 15.6 Hz, 1H), 7.09–––7.03 (m, 2H), 6.83 (d, J = 8.4 Hz, 1H), 6.32 (d, J = 15.6 Hz, 1H), 6.05 (t, J = 2.4 Hz, 1H), 6.00 (d, J = 2.4 Hz, 2H), 4.56 (dd, J = 6.0, 4.8 Hz, 2H), 4.23 (t, J = 4.8 Hz, 2H), 3.85 (s, 3H), 3.68 (s, 6H), 1.61 (s, 6H).; 13C NMR (150 MHz, CDCl3) δ 174.2, 172.7, 161.2, 157.2, 150.5, 149.9, 146.9, 127.9, 122.9, 115.4, 113.6, 110.7, 97.5, 94.3, 79.2, 66.7, 63.4, 56.0, 55.3, 25.5; HRMS (ESI) m/z calculated for C24H29O9 [M + H]+: 461.1806; found: 461.1792.
2.1.4.6 (E)-3-(4-(2-((2-(3,5-dichlorophenoxy)-2-methylpropanoyl)oxy)ethoxy)-3-methoxyphenyl)acrylic acid (S06)
Yield: 52 %, white solid; 1H NMR (600 MHz, CDCl3) δ 7.72 (d, J = 15.6 Hz, 1H), 7.08 (dd, J = 8.4, 2.4 Hz, 1H), 7.05 (d, J = 2.4 Hz, 1H), 6.89 (t, J = 1.8 Hz, 1H), 6.83 (d, J = 8.4 Hz, 1H), 6.72 (d, J = 1.8 Hz, 2H), 6.33 (d, J = 15.6 Hz, 1H), 4.58 (t, J = 4.8 Hz, 2H), 4.24 (t, J = 4.8 Hz, 2H), 3.86 (s, 3H), 1.61 (s, 6H); 13C NMR (150 MHz, CDCl3) δ 173.5, 156.6, 150.3, 149.9, 146.8, 135.1, 128.1, 122.9, 122.5, 117.7, 115.4, 113.6, 110.6, 80.1, 66.7, 63.7, 56.0, 25.4; HRMS (ESI) m/z calculated for C22H23Cl2O7 [M + H]+: 469.0815; found: 469.0817.
2.1.4.7 (E)-3-(3-methoxy-4-(3-((2-methyl-2-(p-tolyloxy)propanoyl)oxy)propoxy)phenyl)acrylic acid (S07)
Yield: 57 %, white solid; 1H NMR (600 MHz, CDCl3) δ 7.64 (d, J = 15.6 Hz, 1H), 7.00 (d, J = 9.0 Hz, 2H), 6.95 (d, J = 8.4 Hz, 2H), 6.69 (d, J = 8.4 Hz, 3H), 6.61 (d, J = 8.4 Hz, 1H), 6.31 (d, J = 15.6 Hz, 1H), 4.35 (t, J = 6.0 Hz, 2H), 3.87 (t, J = 6.0 Hz, 1H), 3.84 (s, 3H), 2.20 (s, 3H), 2.15 (p, J = 6.6 Hz, 2H), 1.57 (s, 6H).; 13C NMR (150 MHz, CDCl3) δ 174.5, 153.1, 150.4, 149.4, 145.8, 131.4, 129.7, 127.4, 122.7, 118.6, 112.4, 110.1, 78.9, 65.1, 62.0, 55.9, 28.3, 25.3, 20.5; HRMS (ESI) m/z calculated for C24H29O7 [M + H]+: 429.1908; found: 429.1901.
2.1.4.8 (E)-3-(3-methoxy-4-(3-((2-(4-methoxyphenoxy)-2-methylpropanoyl)oxy)propoxy)phenyl)acrylic acid (S08)
Yield: 58 %, white solid; 1H NMR (600 MHz, CDCl3) δ 7.72 (d, J = 16.2 Hz, 1H), 7.07 (d, J = 8.4 Hz, 2H), 6.83–––6.76 (m, 2H), 6.74–––6.68 (m, 3H), 6.32 (d, J = 15.6 Hz, 1H), 4.38 (t, J = 6.0 Hz, 2H), 3.98 (t, J = 6.0 Hz, 2H), 3.89 (s, 3H), 3.70 (s, 3H), 2.20 (p, J = 6.0 Hz, 2H), 1.54 (s, 6H); 13C NMR (150 MHz, CDCl3) δ 174.5, 172.6, 155.1, 150.8, 149.6, 149.0, 147.1, 127.3, 123.1, 120.9, 115.0, 114.3, 112.5, 110.3, 79.6, 65.2, 62.1, 56.1, 55.6, 28.4, 25.4; HRMS (ESI) m/z calculated for C24H29O8 [M + H]+: 445.1857; found: 445.1852.
2.1.4.9 (E)-3-(4-(3-((2-(4-ethoxyphenoxy)-2-methylpropanoyl)oxy)propoxy)-3-methoxyphenyl)acrylic acid (S09)
Yield: 63 %, white solid; 1H NMR (600 MHz, CDCl3) δ 7.72 (d, J = 15.6 Hz, 1H), 7.07 (d, J = 8.4 Hz, 2H), 6.80 – 6.75 (m, 2H), 6.73 (d, J = 7.8 Hz, 1H), 6.71 – 6.66 (m, 2H), 6.32 (d, J = 15.6 Hz, 1H), 4.37 (t, J = 6.0 Hz, 2H), 3.99 (t, J = 6.6 Hz, 2H), 3.89 (d, J = 7.2 Hz, 5H), 2.19 (p, J = 6.0 Hz, 2H), 1.54 (s, 6H), 1.36 (t, J = 6.6 Hz, 3H); 13C NMR (150 MHz, CDCl3) δ 174.5, 172.5, 154.6, 150.8, 149.7, 148.9, 147.0, 127.4, 123.1, 121.0, 114.9, 112.7, 110.4, 79.6, 65.3, 63.8, 62.1, 56.1, 28.5, 25.4, 15.0; HRMS (ESI) m/z calculated for C25H31O8 [M + H]+: 459.2013; found: 459.2011.
2.1.4.10 (E)-3-(4-(3-((2-(2-bromophenoxy)-2-methylpropanoyl)oxy)propoxy)-3-methoxyphenyl)acrylic acid (S10)
Yield: 65 %, white solid; 1H NMR (600 MHz, CDCl3) δ 7.73 (d, J = 15.6 Hz, 1H), 7.51 (dd, J = 7.8, 1.7 Hz, 1H), 7.10–––7.02 (m, 3H), 6.82–––6.76 (m, 2H), 6.73 (d, J = 8.4 Hz, 1H), 6.32 (d, J = 15.6 Hz, 1H), 4.39 (t, J = 6.0 Hz, 2H), 3.97 (t, J = 6.0 Hz, 2H), 3.89 (s, 3H), 2.17 (p, J = 6.0 Hz, 2H), 1.64 (s, 6H).; 13C NMR (150 MHz, CDCl3) δ 174.0, 172.2, 152.5, 150.7, 149.6, 146.9, 133.6, 127.9, 127.3, 123.4, 123.0, 118.5, 115.7, 114.9, 112.6, 110.3, 80.7, 65.1, 62.2, 56.0, 28.3, 25.3; HRMS (ESI) m/z calculated for C23H26BrO7 [M + H]+: 493.0856; found: 493.0853.
2.1.4.11 (E)-3-(4-(3-((2-(3,5-dimethoxyphenoxy)-2-methylpropanoyl)oxy)propoxy)-3-methoxyphenyl)acrylic acid (S11)
Yield: 54 %, white solid; 1H NMR (600 MHz, CDCl3) δ 7.72 (d, J = 15.6 Hz, 1H), 7.09–––7.03 (m, 2H), 6.66 (dd, J = 9.0, 6.6 Hz, 1H), 6.32 (d, J = 16.2 Hz, 1H), 6.03 (t, J = 2.4 Hz, 1H), 5.97 (d, J = 1.8 Hz, 2H), 4.36 (t, J = 6.0 Hz, 2H), 3.90 – 3.84 (m, 5H), 3.68 (s, 6H), 2.16 (p, J = 6.0 Hz, 2H), 1.62 (s, 6H).; 13C NMR (150 MHz, CDCl3) δ 174.2, 161.2, 157.3, 150.8, 149.5, 146.9, 127.1, 123.0, 114.7, 112.4, 110.2, 96.6, 94.0, 79.0, 65.1, 62.1, 55.9, 55.3, 28.4, 25.5; HRMS (ESI) m/z calculated for C25H31O9 [M + H]+: 475.1963; found: 475.1949.
2.1.4.12 (E)-3-(4-(3-((2-(4-chloro-3-methylphenoxy)-2-methylpropanoyl)oxy)propoxy)-3-methoxyphenyl)acrylic acid (S12)
Yield: 55 %, white solid; 1H NMR (600 MHz, CDCl3) δ 7.72 (d, J = 15.6 Hz, 1H), 7.13–––7.05 (m, 3H), 6.69 (d, J = 3.0 Hz, 1H), 6.64 (d, J = 8.4 Hz, 1H), 6.54 (dd, J = 8.4, 3.0 Hz, 1H), 6.32 (d, J = 16.2 Hz, 1H), 4.37 (t, J = 6.0 Hz, 2H), 3.88 (d, J = 2.4 Hz, 5H), 2.23 (s, 3H), 2.17 (p, J = 6.0 Hz, 2H), 1.58 (s, 6H); 13C NMR (150 MHz, CDCl3) δ 174.3, 172.0, 154.0, 150.7, 149.5, 147.1, 137.1, 129.5, 127.3, 123.2, 121.2, 116.8, 114.9, 112.3, 110.2, 79.2, 65.1, 62.3, 56.0, 28.4, 25.5, 20.4; HRMS (ESI) m/z calculated for C24H28ClO7 [M + H]+: 463.1518; found: 463.1507.
2.1.4.13 (E)-3-(4-(3-((2-(3,5-dichlorophenoxy)-2-methylpropanoyl)oxy)propoxy)-3-methoxyphenyl)acrylic acid (S13)
Yield: 61 %, white solid; 1H NMR (600 MHz, CDCl3) δ 7.73 (d, J = 15.6 Hz, 1H), 7.09 (d, J = 8.4 Hz, 1H), 7.06 (s, 1H), 6.85 (d, J = 1.8 Hz, 1H), 6.71–––6.64 (m, 3H), 6.33 (d, J = 15.6 Hz, 1H), 4.39 (t, J = 6.0 Hz, 2H), 3.94–––3.83 (m, 5H), 2.17 (p, J = 6.0 Hz, 2H), 1.61 (s, 6H); 13C NMR (150 MHz, CDCl3) δ 173.5, 172.5, 156.7, 150.7, 149.5, 147.0, 135.2, 127.3, 123.1, 122.1, 116.9, 115.1, 112.2, 110.1, 79.9, 64.9, 62.5, 56.0, 28.3, 25.4; HRMS (ESI) m/z calculated for C23H25Cl2O7 [M + H]+: 483.0972; found: 483.0986.
2.1.4.14 (E)-3-(3-methoxy-4-(4-((2-(4-methoxyphenoxy)-2-methylpropanoyl)oxy)butoxy)phenyl)acrylic acid (S14)
Yield: 65 %, white solid; 1H NMR (600 MHz, CDCl3) δ 7.69 (d, J = 15.6 Hz, 1H), 7.09–––7.03 (m, 2H), 6.83–––6.80 (m, 3H), 6.77–––6.73 (m, 2H), 6.31 (d, J = 15.6 Hz, 1H), 4.24 (q, J = 4.2, 3.0 Hz, 2H), 4.02 (q, J = 5.4, 4.2 Hz, 2H), 3.87 (s, 3H), 3.73 (s, 3H), 1.85 (p, J = 3.0 Hz, 4H), 1.53 (s, 6H).; 13C NMR (150 MHz, CDCl3) δ 174.3, 171.7, 155.2, 150.7, 149.6, 148.9, 146.2, 127.3, 122.8, 121.4, 115.5, 114.2, 112.5, 110.3, 79.7, 68.3, 64.9, 55.9, 55.5, 44.9, 33.8, 25.3; HRMS (ESI) m/z calculated for C25H31O8 [M + H]+: 459.2013; found: 459.2019.
2.1.4.15 (E)-3-(4-(4-((2-(4-ethoxyphenoxy)-2-methylpropanoyl)oxy)butoxy)-3-methoxyphenyl)acrylic acid (S15)
Yield: 64 %, white solid; 1H NMR (600 MHz, CDCl3) δ 7.72 (d, J = 15.6 Hz, 1H), 7.12–––7.04 (m, 2H), 6.86–––6.79 (m, 3H), 6.78–––6.72 (m, 2H), 6.32 (d, J = 15.6 Hz, 1H), 4.25 (q, J = 4.2 Hz, 2H), 4.02 (q, J = 4.2 Hz, 2H), 3.94 (qd, J = 6.6, 1.2 Hz, 2H), 3.89 (s, 3H), 1.91–––1.82 (m, 4H), 1.53 (s, 6H), 1.37 (td, J = 7.2, 1.8 Hz, 3H); 13C NMR (150 MHz, CDCl3) δ 174.4, 172.5, 154.5, 150.8, 149.5, 148.8, 146.9, 127.0, 123.1, 121.4, 114.8, 112.25, 110., 79.6, 68.2, 65.0, 63.7, 55.9, 25.6, 25.3, 25.2, 15.0; HRMS (ESI) m/z calculated for C26H33O8 [M + H]+: 473.2170; found: 473.2162.
2.1.4.16 (E)-3-(4-(4-((2-(4-fluorophenoxy)-2-methylpropanoyl)oxy)butoxy)-3-methoxyphenyl)acrylic acid (S16)
Yield: 68 %, white solid; 1H NMR (600 MHz, CDCl3) δ 7.72 (d, J = 15.6 Hz, 1H), 7.10 (dd, J = 8.4, 1.8 Hz, 1H), 7.07 (d, J = 1.8 Hz, 1H), 6.91 (t, J = 8.4 Hz, 2H), 6.82 (td, J = 6.6, 3.0 Hz, 3H), 6.32 (d, J = 15.6 Hz, 1H), 4.25 (q, J = 4.2, 3.0 Hz, 2H), 4.02 (d, J = 5.4 Hz, 2H), 3.89 (s, 3H), 1.84 (q, J = 3.0 Hz, 4H), 1.56 (s, 6H); 13C NMR (150 MHz, CDCl3) δ 174.3, 171.9, 159.2 (d, J = 239.1 Hz, 1C), 151.4 (d, J = 2.1 Hz, 1C), 150.9, 149.6, 147.0, 127.2, 123.1, 121.1 (d, J = 8.1 Hz, 2C), 115.8 (d, J = 22.6 Hz, 2C), 114.9, 112.4, 110.2, 79.8, 68.3, 65.2, 56.0, 25.7, 25.4 (2C); HRMS (ESI) m/z calculated for C24H27FO7K [M + K]+: 485.1372; found: 485.1379.
2.1.4.17 (E)-3-(4-(4-((2-(2-bromophenoxy)-2-methylpropanoyl)oxy)butoxy)-3-methoxyphenyl)acrylic acid (S17)
Yield: 61 %, white solid; 1H NMR (600 MHz, CDCl3) δ 7.72 (d, J = 15.6 Hz, 1H), 7.53 (dd, J = 7.8, 1.6 Hz, 1H), 7.17–––7.13 (m, 1H), 7.10 (dd, J = 8.4, 1.8 Hz, 1H), 7.06 (d, J = 1.8 Hz, 1H), 6.89–––6.80 (m, 3H), 6.32 (d, J = 15.6 Hz, 1H), 4.28–––4.24 (m, 2H), 4.02 (q, J = 3.6, 3.0 Hz, 2H), 3.89 (s, 3H), 1.84 (p, J = 3.0 Hz, 4H), 1.63 (s, 6H); 13C NMR (150 MHz, CDCl3) δ 174.2, 172.5, 152.7, 151.0, 149.7, 147.1, 133.7, 128.1, 127.2, 123.6, 123.2, 119.2, 116.1, 115.0, 112.6, 110.4, 80.9, 68.4, 65.3, 56.1, 25.7, 25.4 (2C); HRMS (ESI) m/z calculated for C24H28BrO7 [M + H]+: 507.1013; found: 507.1008.
2.1.4.18 (E)-3-(4-(4-((2-([1,1′-biphenyl]-4-yloxy)-2-methylpropanoyl)oxy)butoxy)-3-methoxyphenyl)acrylic acid (S18)
Yield: 64 %, white solid; 1H NMR (600 MHz, CDCl3) δ 7.71 (d, J = 15.6 Hz, 1H), 7.55–––7.50 (m, 2H), 7.49–––7.44 (m, 2H), 7.40 (t, J = 7.8 Hz, 2H), 7.33–––7.28 (m, 1H), 7.06–––7.01 (m, 2H), 6.93–––6.88 (m, 2H), 6.74 (d, J = 8.4 Hz, 1H), 6.30 (d, J = 15.6 Hz, 1H), 4.26 (t, J = 6.0 Hz, 2H), 3.95 (t, J = 6.0 Hz, 2H), 3.86 (s, 3H), 1.85 – 1.75 (m, 4H), 1.65 (s, 6H); 13C NMR (150 MHz, CDCl3) δ 174.5, 172.5, 155.2, 150.9, 149.6, 147.0, 140.6, 135.0, 128.9, 127.9, 127.1, 127.0, 126.8, 123.1, 118.9, 115.0, 112.4, 110.3, 79.3, 68.2, 65.2, 56.0, 25.6 (2C), 25.3; HRMS (ESI) m/z calculated for C30H33O7 [M + H]+: 505.2221; found: 505.2209.
2.1.4.19 (E)-3-(4-(4-((2-(3,5-dimethoxyphenoxy)-2-methylpropanoyl)oxy)butoxy)-3-methoxyphenyl)acrylic acid (S19)
Yield: 51 %, white solid; 1H NMR (600 MHz, CDCl3) δ 7.71 (d, J = 15.6 Hz, 1H), 7.09 (d, J = 8.4 Hz, 1H), 7.06 (s, 1H), 6.81 (dd, J = 8.4, 1.6 Hz, 1H), 6.32 (d, J = 15.6 Hz, 1H), 6.09 (d, J = 1.8 Hz, 1H), 6.00 (d, J = 1.8 Hz, 2H), 4.27–––4.22 (m, 2H), 4.01–––3.96 (m, 2H), 3.88 (s, 3H), 3.71 (s, 6H), 1.82 (hept, J = 2.4 Hz, 4H), 1.61 (s, 6H); 13C NMR (150 MHz, CDCl3) δ 174.4, 172.6, 161.2, 157.3, 150.9, 149.5, 147.0, 127.1, 123.1, 115.0, 112.3, 110.1, 97.1, 94.1, 79.2, 68.1, 65.1, 56.0, 55.4, 25.6, 25.5, 25.2; HRMS (ESI) m/z calculated for C26H33O9 [M + H]+: 489.2119; found: 489.2104.
2.1.4.20 (E)-3-(4-(4-((2-(4-chloro-3-methylphenoxy)-2-methylpropanoyl)oxy)butoxy)-3-methoxyphenyl)acrylic acid (S20)
Yield: 57 %, white solid; 1H NMR (600 MHz, CDCl3) δ 7.71 (d, J = 15.6 Hz, 1H), 7.16 (d, J = 8.4 Hz, 1H), 7.10 (dd, J = 8.4, 1.9 Hz, 1H), 7.06 (d, J = 1.8 Hz, 1H), 6.82 (d, J = 8.4 Hz, 1H), 6.73 (d, J = 3.0 Hz, 1H), 6.59 (dd, J = 9.0, 3.0 Hz, 1H), 6.32 (d, J = 15.6 Hz, 1H), 4.26–––4.22 (m, 2H), 4.02–––3.97 (m, 2H), 3.89 (s, 3H), 2.28 (s, 3H), 1.82 (h, J = 4.2, 3.6 Hz, 4H), 1.58 (s, 6H); 13C NMR (150 MHz, CDCl3) δ 174.3, 171.6, 154.0, 150.9, 149.6, 147.0, 137.0, 129.4, 127.5, 127.2, 123.2, 121.7, 117.4, 114.8, 112.4, 110.2, 79.4, 68.2, 65.2, 56.0, 25.6, 25.5, 25.3, 20.4; HRMS (ESI) m/z calculated for C25H30ClO7 [M + H]+: 477.1675; found: 477.1671.
2.1.4.21 (E)-3-(4-(4-((2-(3,5-dichlorophenoxy)-2-methylpropanoyl)oxy)butoxy)-3-methoxyphenyl)acrylic acid (S21)
Yield: 66 %, white solid; 1H NMR (600 MHz, CDCl3) δ 7.71 (d, J = 15.6 Hz, 1H), 7.10 (d, J = 8.4 Hz, 1H), 7.06 (t, J = 1.8 Hz, 1H), 6.96 (d, J = 1.8 Hz, 1H), 6.85–––6.80 (m, 1H), 6.72 (t, J = 1.8 Hz, 2H), 6.32 (d, J = 15.6 Hz, 1H), 4.26 (t, J = 5.4 Hz, 2H), 4.01 (t, J = 5.4 Hz, 2H), 3.88 (s, 3H), 1.87–––1.77 (m, 4H), 1.60 (s, 6H); 13C NMR (150 MHz, CDCl3) δ 173.5, 172.5, 156.7, 150.8, 149.5, 146.9, 135.1, 127.2, 123.1, 122.3, 117.5, 115.2, 112.3, 110.1, 80.1, 68.1, 65.5, 56.0, 25.6, 25.4, 25.3; HRMS (ESI) m/z calculated for C24H27Cl2O7 [M + H]+: 497.1128; found: 497.1139.
2.2 Biological evaluation
2.2.1 Cell line culture
HepG2 cells were maintained in DMEM (C11995500BT, Thermo Fisher) supplemented with 10 % FBS, 100 U/mL penicillin, and 100 µg/mL streptomycin. The cell culture was conducted at 37 °C in a humidified atmosphere with 5 % CO2.
2.2.2 Antibodies and reagents
Ferulic acid (FA), 5-aminoimidazole-4-carboxamide-1-β-ribofuranoside (AICAR), and 3-(4,5-dimethylthiazol-2-yl)-2,5-diphenyltetrazolium bromide (MTT) were acquired from MedChem Express (MCE). The BCA Protein Assay Kit (C503051-0500) and Oil Red O (A100684-0050) were obtained from Sangon Biotech Co., Ltd (Shanghai, China). Kits for the assays of triglyceride (TG, E1013-50), alanine aminotransferase (ALT, E2022-105), and aspartate aminotransferase (AST, E2024-105) were sourced from Pulilai Gene Technology Co., Ltd. (Beijing, China).
The following antibodies (at a dilution of 1:1000) were used: anti-β-actin (AC026) and anti-phospho ACC1 (AP0298) from ABclonal; anti-SREBP-1 (sc-13551) from Santa; anti-ACC1 (67373–1-Ig) and anti-AMPK (66536–1-Ig) from Proteintech; anti-phospho AMPKα (2535) from Cell Signaling Technology.
2.2.3 In vitro cytotoxicity assay
The cytotoxic effects of the compounds were evaluated in vitro using the MTT assay. HepG2 cells were enzymatically detached, resuspended, and plated in 96-well plates (2 × 10³ cells per well), followed by overnight incubation. The cells were subjected to the treatment of compounds under investigation, with O-methylferulic acid and AICAR serving as positive controls and DMSO as the negative control. After a 72 h incubation period, MTT reagent (5 mg/mL) was added to each well, and the plates were incubated for an additional 3 h. The optical density (OD) of the resulting formazan product was quantified at 490 nm (OD490).
2.2.4 Preparation of free fatty acid (FFA) solutions
-
Oleic acid (OA) and palmitic acid (PA) solutions (0.1 mol/L)
Sodium oleate (141 mg) and sodium palmitate (128 mg) were weighed and placed into separate 15 mL centrifuge tubes. Each tube received 10 mL of PBS solution. The tubes were mixed and then heated at 80 °C until the fatty acids were completely dissolved.
-
Bovine serum albumin (BSA) solution (5 % w/v)
BSA (0.7 g) was weighed and added to a 50 mL centrifuge tube containing 14 mL of PBS. This mixture was heated at 80 °C while stirring until the BSA was fully dissolved.
-
OA and PA stock solutions (10 mmol/L)
For the OA stock solution, 1 mL of the 0.1 M OA solution was quickly transferred to a new 15 mL centrifuge tube containing 9 mL of the 5 % BSA solution and mixed well. Similarly, to prepare the PA stock solution, 0.5 mL of the 0.1 M PA solution was combined with 4.5 mL of the 5 % BSA solution.
-
Combined FFA solution (OA: PA = 2:1) at different concentrations
For experimental use, 2 mL of OA stock solution, 1 mL of PA stock solution, and 3 mL of DMEM with 20 % FBS were mixed to prepare a 5 mmol/L combined FFA solution (OA: PA = 2:1). The final concentration can be adjusted as required by diluting with DMEM containing 10 % FBS. FFA solutions should be freshly prepared prior to each experiment.
2.2.5 Development of an adipose accumulation model in HepG2 cells
HepG2 cells were plated in 6-well plates (1 × 10⁶/well) and cultured in DMEM (10 % FBS, 100 U/mL penicillin, and 100 µg/mL streptomycin) at 37 °C in a 5 % CO2 humidified atmosphere. To establish a model of fat accumulation, the cells were grown to 75 % confluence and then switched to serum-free DMEM overnight. Subsequently, they were treated with various concentrations of the target compounds dissolved in DMEM containing an FFA mixture (OA: PA = 2:1) for 24 h.
2.2.6 Oil Red O staining
After treatment with 1 mM FFAs and respective compounds or positive controls for 24 h, the HepG2 cells were prepared for lipid droplet visualization. Cells were washed twice with cold PBS and fixed with 10 % formaldehyde for 30 min. Following fixation, cells were washed thrice with water and stained with 0.5 % Oil Red O in a 60 % isopropanol solution for 20 min at room temperature. The stained cells were observed and imaged using an optical microscope (DMi1, Leica Microsystems Wetzlar GmbH) with a digital camera at 40 × magnification. Subsequently, the Oil Red O staining intensity was quantitatively analyzed at OD490.
2.2.7 Measurement of intracellular TG levels
In vitro TG assays were conducted using the TG Assay Kit (E1013-50). The experimental procedures were carried out in accordance with the manufacturer's protocol, detailed information of which can be found at https://www.applygen.com/upload/download/20210713/20210713024524908.pdf.
HepG2 cells, treated with 1 mM FFAs along with the designated target compounds or positive controls for 24 h, were washed thrice with PBS. The cells were then lysed in lysis buffer for 30 min. Subsequently, the TG levels were determined following the protocols of the kit. Concurrently, protein concentrations were quantified using the BCA Protein Assay Kit (C503051-0500), adhering to the manufacturer's guidelines.
2.2.8 ALT and AST measurements
ALT and AST levels were measured in vitro using the ALT Assay Kit (E2022-105) and AST Assay Kit (E2024-105). The protocols followed were per the manufacturer's instructions, with more comprehensive details available at: https://www.applygen.com/upload/download/20220114/20220114102112664.pdf, and https://www.applygen.com/upload/download/20220114/20220114093422869.pdf.
Following 24 h exposure of HepG2 cells to 1 mM FFAs with the specified target compounds or positive controls, the cells were washed three times with PBS. A lysis buffer was used to lyse the cells for 30 min. The activities of ALT and AST were then assayed as per the instructions provided by the manufacturer. Protein levels were quantified concurrently using the BCA Protein Assay Kit (C503051-0500), following the manufacturer's protocol.
2.2.9 Western blot analysis
HepG2 cells (1 × 10⁶/well) were plated in 6-well plates. Following a 16-h incubation, the culture medium was replaced with fresh media containing varying concentrations of the target compounds or a control agent for a period of 24 h. For cell lysis, RIPA lysis buffer from Sangon Biotech, supplemented with a protease inhibitor cocktail from MCE, was employed for 30 min at ice-cold temperatures. Protein concentrations were determined using the BCA method. Equal amounts of proteins were resolved on 10 % SDS-PAGE and subsequently transferred onto polyvinylidene difluoride membranes. The membranes were then blocked with 5 % milk for 1–2 h. Primary antibodies were applied at a 1:1000 dilution, followed by incubation with HRP-conjugated secondary antibodies. Visualization of protein bands was conducted using ECL reagents from Bio-Rad (Hercules, CA). Quantification of the protein bands was achieved using ImageJ software, following normalization against the solvent control.
2.2.10 Statistical analysis
The data acquired from the experiments are expressed as the mean ± standard deviation (SD). To ensure the reliability of the results, each experimental assay was conducted at least thrice independently. For statistical analysis, GraphPad Prism 8 software (GraphPad Software Inc., San Diego, CA) was utilized. Tukey's post-test and student's t-test were utilized for multiple or single comparisons. The determination of statistical significance was conducted via t-tests and nonparametric tests, with p-value thresholds set at *P < 0.05, **P < 0.01, ***P < 0.001, ****p < 0.0001.
3 Result and discussion
3.1 Synthesis of target compounds
The target compounds S01-S21 were synthesized according to the route outlined in Scheme 1. Firstly, substituted phenol 1a-1i were treated with sodium hydroxide in acetone and then chloroform was added to afford substituted phenyloxyisobutyric acid 2a-2i (Wang et al., 2012). Meanwhile, 4-(3-substituted)-3-methoxybenzaldehyde 4a-4c were synthesized by alkylation of vanillin 3 with halohydrin using K2CO3/DMF at 50 °C (Sirichaiwat et al., 2004). Compounds 4a-4c could be coupled to substituted phenyloxyisobutyric acid 2a-2i in the presence of EDC·HCl at room temperature afforded intermediates 5a-5u (Hellberg et al., 1999). Finally, target compounds S01-S21 were prepared via Knoevenagel condensation reaction between intermediates 5a-5u and malonic acid in the present of pyridine (Li et al., 2015).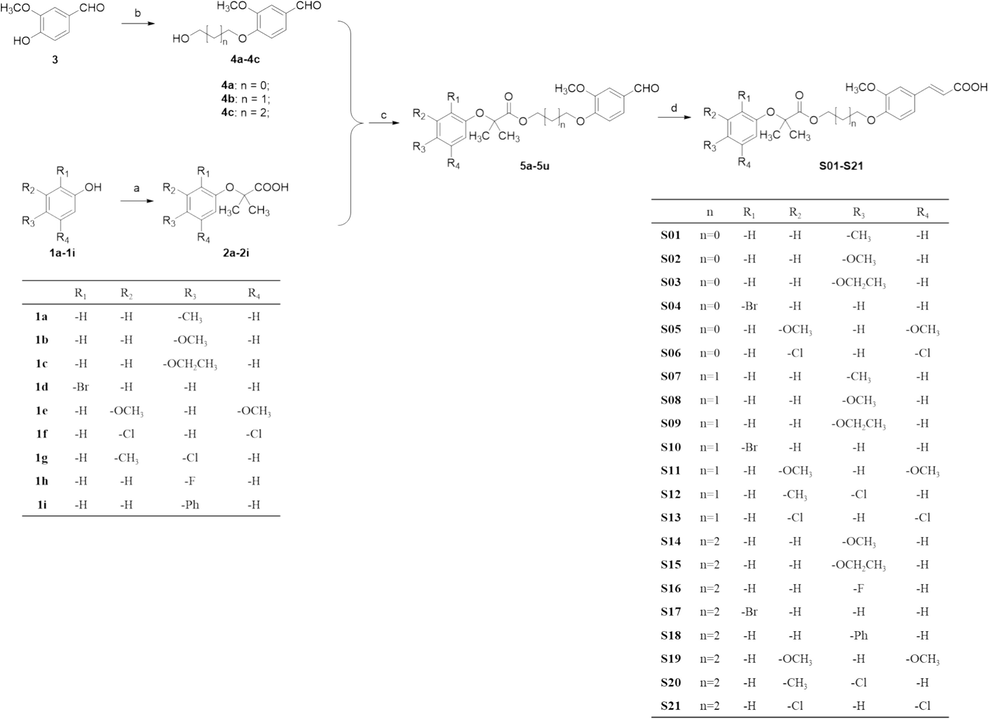
Preparation of the target compounds S01-S21, with the following reaction conditions: (a) NaOH, CHCl3, acetone, under reflux for 3 h; (b) Halohydrin, K2CO3, TBAI, DMF at 50 °C for 5 h; (c) EDCI, 4-dimethylaminopyridine, Et3N, DCM at room temperature for 5 h; (d) Malonic acid, piperidine, pyridine at 90 °C for 8 h.
The chemical structures of synthesized compounds were characterized by HRMS, 1H NMR and 13C NMR, and all the spectral data were in agreement with the proposed structures.
3.2 Biological evaluation
3.2.1 Establishment of FFA-induced HepG2 cell model for steatosis
NAFLD is tightly associated with the hepatic manifestation of metabolic syndrome. In vitro models using FFA-challenged HepG2 cells are commonly employed to study NAFLD (Errafii et al., 2022, Guo et al., 2022, Ramos et al., 2022). Extensive research has highlighted that exposing HepG2 cells to 0.5–1 mM of FFA for 24 h results in significant lipid accumulation (Hassan et al., 2014, Tan et al., 2022, Yan et al., 2022).
In this study, we evaluated the impact of FFA at varying concentrations of FFA to identify the optimal concentration for inducing steatosis. MTT assay results (Fig. 2A) uncovered that FFA treatment up to 1 mM for 24 h did not render cytotoxic effects on HepG2 cells. The lipid droplet accumulation was assessed by Oil Red O staining, TG assay and ALT/AST enzyme assay. The result of Oil Red O staining unveiled that the number of lipid droplets correlated with the intense of Oil Red O in cells, which found to be concentration-responsive in FFA-treated cells (Fig. 2B&2F). The result of TG assay and ALT/AST assays also displayed a concentration-responsive increase in TG content and ALT/AST enzyme activities response to FFA treatment (Fig. 2C-2E).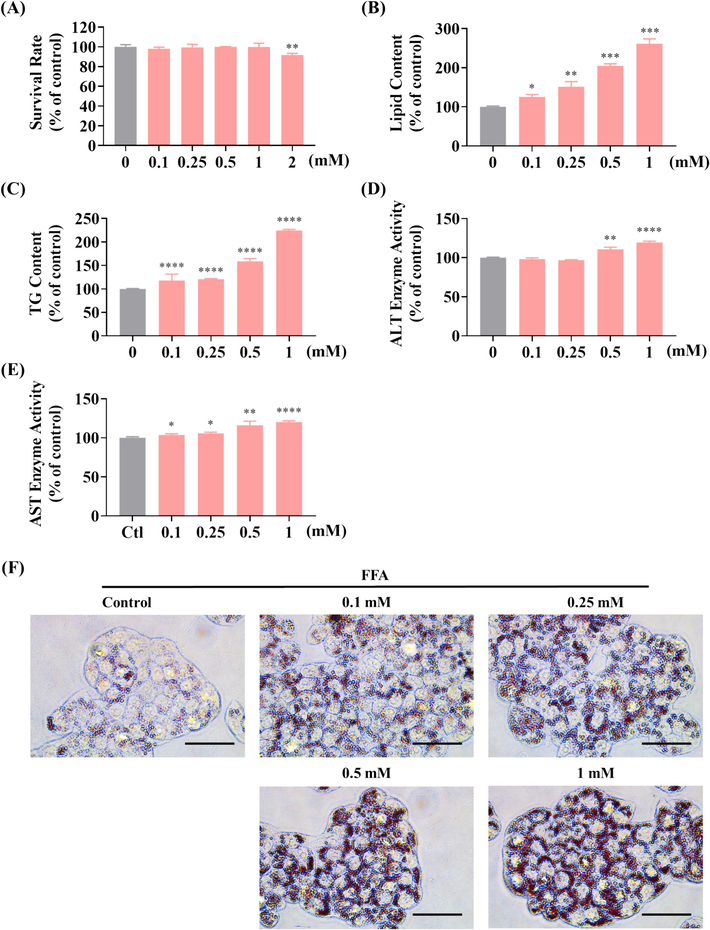
Effect of FFA on cell viability and lipid accumulation in HepG2 cells. (A) Cell viability under varying FFA concentrations assessed by MTT assay. (B) Lipid droplet accumulation induced by FFA, as quantified by fluorescence absorption detection at OD500 following Oil Red O staining. (C) Influence of different FFA concentrations on TG content in HepG2 cells post 24 h of treatment. (D, E) Effects of FFA at different concentrations on ALT (D) and AST (E) enzyme activity in HepG2 cells after 24 h of treatment. (F) Visualization of lipid droplet accumulation in HepG2 cells at different FFA concentrations (scale bar 50 μm, 40 × ); * P < 0.05, ** P < 0.01, *** P < 0.001, **** P < 0.0001 versus the control group. (For interpretation of the references to colour in this figure legend, the reader is referred to the web version of this article.)
According to the MTT assay, the usage concentration of is in the range of 0.1 mM to 1 mM. Compared to 0.1 mM or 0.25 mM, the result of 0.5 mM or 1 mM shown more remarkable difference in above experiments, especially in Oil Red O staining and TG assay (Fig. 2B&2C). In ALT/AST assays, the result of 0.1 mM and 0.25 mM shown no remarkable difference (P > 0.05) or low remarkable difference (P < 0.05), but the result of 0.5 mM and 1 mM shown higher remarkable difference (P < 0.001, or P < 0.0001) (Fig. 2D&2E). Therefore, these results suggest that FFA concentrations of either 0.5 mM or 1 mM are optimal for establishing in vitro steatosis models in HepG2 cells.
3.2.2 Effects of target compounds on HepG2 cell proliferation
The influence of the target compounds on the viability of HepG2 cells was assessed using the MTT assay. To establish a reference for comparison, AICAR, an established AMPK activator that effectively augments AMPK phosphorylation in FFA-stimulated HepG2 cells, served as a positive control (Sanchez et al., 2013). The cell viability results, summarized in Table 1, were obtained from a 24 h exposure to the compounds using the MTT assay. These findings indicate that the viability of HepG2 cells was largely unaffected by the treatment with most of the compounds at concentrations up to 400 μM. Hence, the concentration of 400 μM for the target compounds was selected for subsequent experiments. Note: FA, ferulic acid; AICAR, 5-aminoimidazole-4-carboxamide-1-β-ribofuranoside. Data are means ± SD of triplicate experiments (n = 3).
Compounds
Concentration (μM)
500
400
300
200
100
50
S01
82.2 ± 3.7
90.0 ± 6.7
95.5 ± 11.8
100.8 ± 6.7
84.4 ± 0.8
90.4 ± 2.6
S02
87.1 ± 7.6
96.8 ± 4.3
103.2 ± 7.8
103.3 ± 3.5
93.6 ± 2.8
102.5 ± 5.30
S03
69.5 ± 2.2
89.3 ± 4.9
90.6 ± 4.7
94.6 ± 6.8
89.0 ± 0.8
90.5 ± 3.8
S04
80.0 ± 7.2
94.2 ± 2.3
92.4 ± 8.6
90.5 ± 2.7
91.0 ± 3.0
92.8 ± 1.0
S05
72.7 ± 4.9
100.8 ± 2.7
89.9 ± 5.3
95.7 ± 1.6
100.4 ± 3.7
98.6 ± 4.2
S06
79.6 ± 7.5
94.3 ± 3.4
92.4 ± 5.0
92.9 ± 2.8
95.7 ± 3.7
95.2 ± 4.1
S07
92.2 ± 11.6
98.7 ± 3.4
87.1 ± 4.1
91.2 ± 4.2
92.4 ± 5.0
89.8 ± 3.8
S08
84.2 ± 13.0
101.7 ± 10.6
92.6 ± 8.0
97.1 ± 3.5
98.8 ± 3.8
92.1 ± 4.5
S09
85.3 ± 7.6
93.0 ± 11.4
84.4 ± 6.3
94.7 ± 8.4
91.8 ± 0.7
92.5 ± 0.6
S10
87.1 ± 7.3
95.0 ± 2.1
100.2 ± 8.8
100.6 ± 5.2
94.9 ± 3.7
100.7 ± 0.7
S11
80.7 ± 10.3
87.2 ± 10.2
86.9 ± 1.1
94.9 ± 1.7
89.1 ± 0.6
91.1 ± 1.4
S12
83.6 ± 6.8
95.0 ± 10.7
89.3 ± 7.2
93.0 ± 3.3
90.0 ± 1.7
95.5 ± 2.1
S13
88.2 ± 4.4
88.0 ± 3.7
91.8 ± 6.3
99.6 ± 11.4
95.1 ± 0.8
92.8 ± 1.9
S14
77.7 ± 8.6
87.3 ± 5.7
90.5 ± 3.8
104.3 ± 14.5
98.1 ± 2.2
98.7 ± 0.4
S15
97.6 ± 8.4
104.9 ± 7.2
92.5 ± 2.7
104.7 ± 6.9
104.9 ± 4.5
94.8 ± 3.5
S16
77.0 ± 8.4
89.4 ± 8.3
93.2 ± 9.3
106.1 ± 7.1
92.9 ± 2.6
95.2 ± 0.7
S17
94.7 ± 6.2
97.4 ± 5.0
94.1 ± 5.9
104.3 ± 12.1
91.3 ± 2.0
93.7 ± 1.3
S18
92.9 ± 10.3
98.0 ± 4.7
94.8 ± 1.3
108.0 ± 1.7
98.8 ± 1.0
98.9 ± 1.3
S19
81.7 ± 2.7
100.4 ± 5.0
102.4 ± 2.1
98.2 ± 2.9
92.5 ± 3.8
95.8 ± 0.5
S20
93.1 ± 10.5
100.0 ± 7.1
100.3 ± 4.1
96.4 ± 8.6
94.4 ± 4.0
91.8 ± 3.0
S21
99.5 ± 5.4
93.1 ± 8.7
99.2 ± 5.5
92.1 ± 10.6
92.5 ± 2.5
99.6 ± 1.7
FA
89.8 ± 3.9
100.4 ± 5.2
94.9 ± 6.8
98.9 ± 1.8
100.7 ± 6.8
104.1 ± 4.5
AICAR
99.0 ± 10.4
93.1 ± 8.4
98.1 ± 3.9
90.0 ± 2.4
99.8 ± 10.2
104.0 ± 3.6
3.2.3 Screening of target compounds on lipid accumulation in FFA-induced HepG2 cells
The extent of cellular lipid accumulation was assessed using Oil Red O staining. This method was instrumental in clarifying the effects of target compounds on the FFA-induced steatosis model in HepG2 cells (Hassan et al., 2014, Tan et al., 2022, Yan et al., 2022). Notably, FFA treatment led to an increase in both the size and intensity of intracellular lipid droplets. As demonstrated in Fig. 3A, the lipid content in FFA (1 mM)-challenged cells escalated to 228.8 % compared to the control group. At a concentration of 100 μM, most compounds did not significantly diminish lipid droplet accumulation in FFA-challenged cells. However, two exceptions, compounds S10 and S17, noticeably reduced the intracellular lipid content to 178.4 % and 170.7 %. Further investigations, as indicated in Fig. 3B and Fig. S1, revealed that at the concentration of 400 μM, the majority of the target compounds prominently impeded lipid accumulation. Among these compounds, S10 and S17 were efficacious in reducing the size and number of intracellular lipid droplets (Fig. 3B&3C). The summary of the structure–activity relationship (SAR) of the synthesized compounds was depicted in Fig. 4.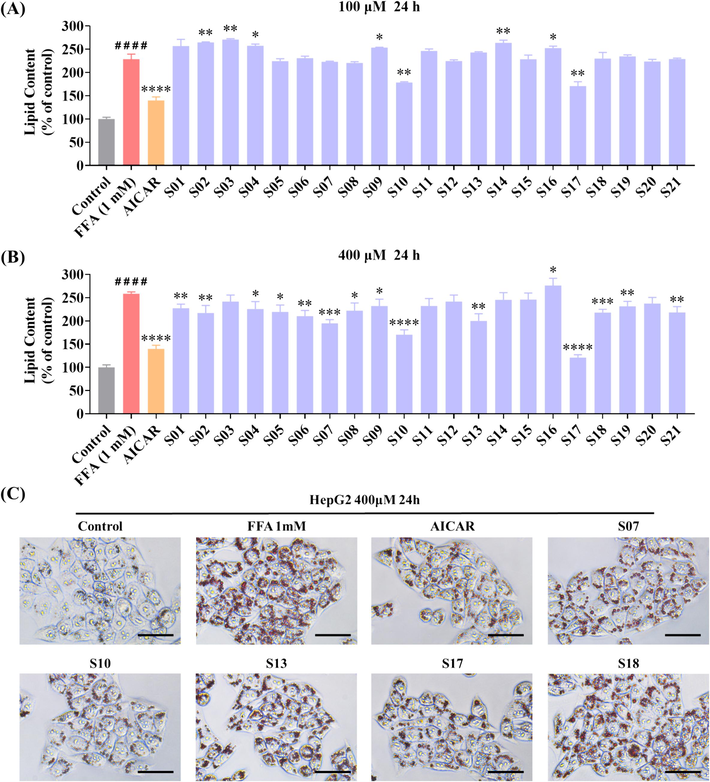
Influence of compounds S01-S21 on lipid accumulation in FFA-challenged HepG2 cells. (A, B) Detection of lipid droplet accumulation via fluorescence absorption. The model group received 1 mM FFA (OA: PA = 2:1) and DEME for 24 h. The control group and various sample groups were subjected to treatment with or without 1 mM FFA (OA: PA = 2:1), DEME, and 500 μM of AICAR or the respective target compounds. Following Oil Red O staining, fluorescence absorption was measured at an OD of 500 nm. (C) Extent of lipid droplet accumulation in response to the target compounds in the absence or presence of FFA (1 mM) for 24 h (scale bar 50 μm, 40 × ). The data, derived from three independent experiments, are presented as mean ± SD. #### P < 0.0001 versus the control group. * P < 0.05, ** P < 0.01, *** P < 0.001, **** P < 0.0001 versus the FFA (1 mM) group. (For interpretation of the references to colour in this figure legend, the reader is referred to the web version of this article.)
Summary of the structure–activity relationships (SAR) in the target compounds.
We conducted a SAR analysis for compounds S01-S21 to evaluate their inhibitory effect on lipid accumulation in FFA-challenged HepG2 cells. As depicted in Fig. 3, a notable observation was made regarding the influence of the linker length and the nature of substitution on the phenyl group. For compounds S01-S06, with R of a mono- or di-substituted phenyl group and a linker length of two carbon units (n = 2), compound S06 (R = 3,4-dichlorophenyl) demonstrated the most potent suppressive effect on lipid accumulation. Similarly, among the compounds S07-S13 (linker, n = 3) and S14-S21 (linker, n = 4), certain compounds, specifically S10 (R = 2-bromophenyl, n = 3), S13 (R = 3,4-dichlorophenyl, n = 3), S17 (R = 2-bromophenyl, n = 4), and S21 (R = 3,4-dichlorophenyl, n = 4), exhibited more potent inhibitory effects compared to their counterparts with different substituents on the phenyl ring. This pattern suggests a preference for electron-withdrawing groups (EWGs) on the benzene ring in enhancing the effect of the compound. In addition, among all compounds, those with a four-carbon linker (S14-S21) displayed a more pronounced inhibitory effect on lipid accumulation compared to those with shorter linkers (S01-S06, n = 2; and S07-S13, n = 3), especially compound S17. This observation implies that increasing the linker length enhances the ability of these compounds to curb lipid accumulation in FFA-treated HepG2 cells. Collectively, these results reveal that compounds S10 and S17 shown better activity than other compounds, and we choose the two compounds for the molecular biological experiments.
3.2.4 Impact of compounds S10 and S17 on HepG2 cell proliferation under FFA treatment
The effect of S10 and S17 treatments on the proliferation of HepG2 cells subjected to FFA was evaluated using the MTT assay. As presented in Table 1, cell viability remained unaffected at concentrations up to 400 μM for FA, AICAR, S10, and S17 under identical treatment conditions. In addition, the MTT assay was utilized to measure cell viability following 24 h of exposure to 1 mM FFA in conjunction with FA, AICAR, S10, or S17 (Fig. 5). It was noted that the co-treatment of FFAs and these compounds did not adversely affect the viability of HepG2 cells at the concentrations tested. Specifically, the proliferation rates (%) of HepG2 cells treated with S10 at 100, 200, 300, and 400 μM in the presence of 1 mM FFA were 99.44 %, 93.15 %, 95.75 %, and 90.61 %, respectively (Fig. 5C). Similarly, for S17 at the same concentrations, the proliferation rates were 98.25 %, 99.72 %, 97.25 %, and 92.45 % (Fig. 5D). Therefore, compounds S10 and S17 shown low cell cytotoxicity at the range of 100 μM to 400 μM on HepG2 cells, even in the presence of 1 mM FFA.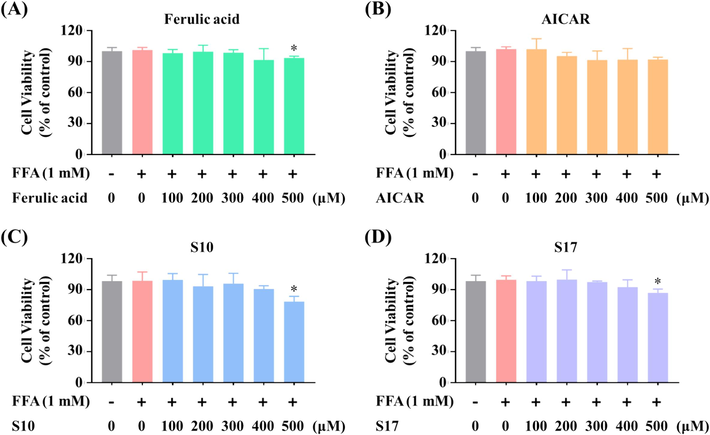
Effects of S10 and S17 on viability of FFA-stimulated HepG2 cells. Cells were exposed to FA with the indicated concentrations (A), AICAR (B), S10 (C), and S17 (D) in the absence or presence of FFA (1 mM, OA: PA = 2:1) for 24 h. Cell viability was assessed through the MTT assay. The data, derived from three independent experiments, are presented as mean ± SD. * P < 0.05 versus the control group.
3.2.5 Suppressive effects of S10 and S17 on FFA-induced lipid accumulation in HepG2 cells
It was reported that FA inhibited adipogenesis and lipid accumulation in 3 T3-L1 cells, but lipid accumulation in cells declined after the treatment of 0.25 mM or 0.5 mM FA for 10 days (Ilavenil et al., 2017). To illustrating the impact of compounds S10 and S17 on FFA-induced lipid accumulation. HepG2 cells were exposed to these compounds alongside FFA, followed by analysis using Oil Red O staining to visualize lipid accumulation. Additionally, the intracellular TG levels were evaluated. The OD value of each well was determined to corroborate the microscopic observations. As displayed in Fig. 6A&6C, compounds S10 and S17 notably thwarted lipid accumulation and exhibited a more potent inhibitory effect than the positive control FA. Furthermore, the TG assay revealed that both S10 and S17 decreased intracellular TG content in a concentration-responsive manner (Fig. 6B). These results suggested that S10 and S17 exerted potent effect to reduced the intracellular lipid accumulation.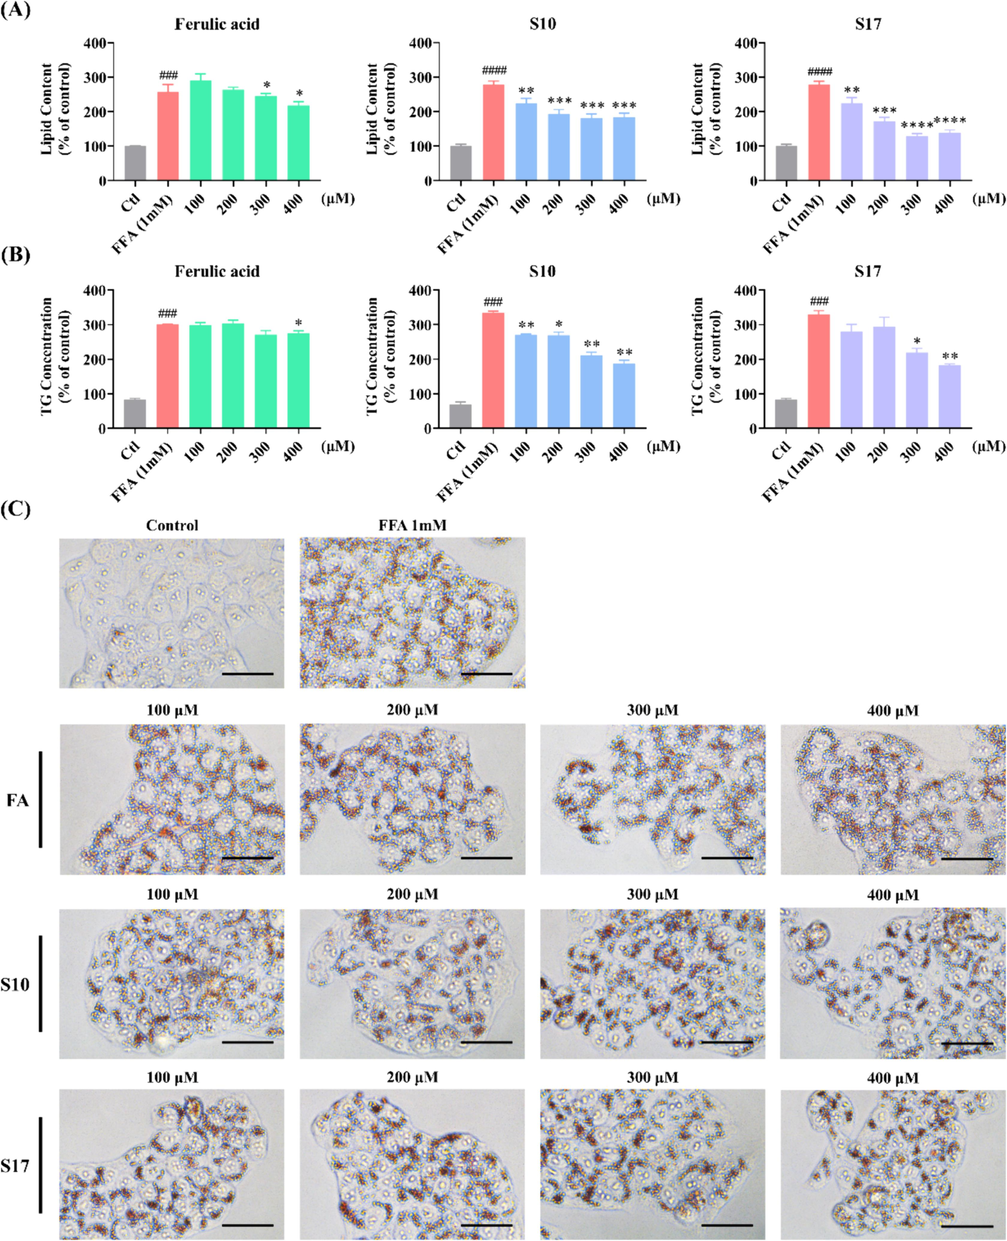
Impact of compounds S10 and S17 on lipid accumulation in HepG2 cells. (A) Detection of lipid droplet accumulation via fluorescence absorption. Cells were treated with specified concentrations of S10 or S17 in the absence or presence of FFA for 24 h. Following Oil Red O staining, fluorescence absorption was determined at an OD of 500 nm. (B) Quantification of intracellular TG levels was performed using the TG Assay Kit. (C) Visualization of the effects of S17 on lipid droplet accumulation in the absence or presence of FFA (1 mM) for 24 h (scale bar 50 μm, 40 × ). The data, derived from three independent experiments, are presented as mean ± SD. #### P < 0.0001 versus the control group. * P < 0.05, ** P < 0.01, *** P < 0.001, **** P < 0.0001 versus the FFA (1 mM) group. (For interpretation of the references to colour in this figure legend, the reader is referred to the web version of this article.)
3.2.6 Suppressive effects of S10 and S17 on ALT and AST activities in FFA-challenged HepG2 cells
The enzyme activity of ALT and AST are key markers of NAFLD to indicate liver damage (Wang et al., 2012). Study has shown that the activity of ALT and AST in hepatic cells will significantly increased after treated by FFA or high fat diet, and it also can be reduced by nature products (Chen et al., 2012, Lee et al., 2015). As demonstrated in Fig. 2D&2E, FFA treatment at the concentrations of 0.5 mM and 1 mM resulted in increased ALT and AST activities.
In this study, we tested the ALT and AST activity in both culture medium and cell lysis to validate the inhibitory effect of S10 and S17 on lipid accumulation. The result of ALT and AST activity in culture medium revealed that comparison to the positive control FA, both S10 and S17 have significant effect on the enzyme activity (Fig. 7A & 7B). The assays in cell lysis perform approximately identically, S10 and S17 attenuated the FFA-induced increase in ALT and AST activities in HepG2 cells (Fig. S2). As a result, S10 and S17 showed pronounced capabilities in restricting the activities of ALT and AST in cell lysis.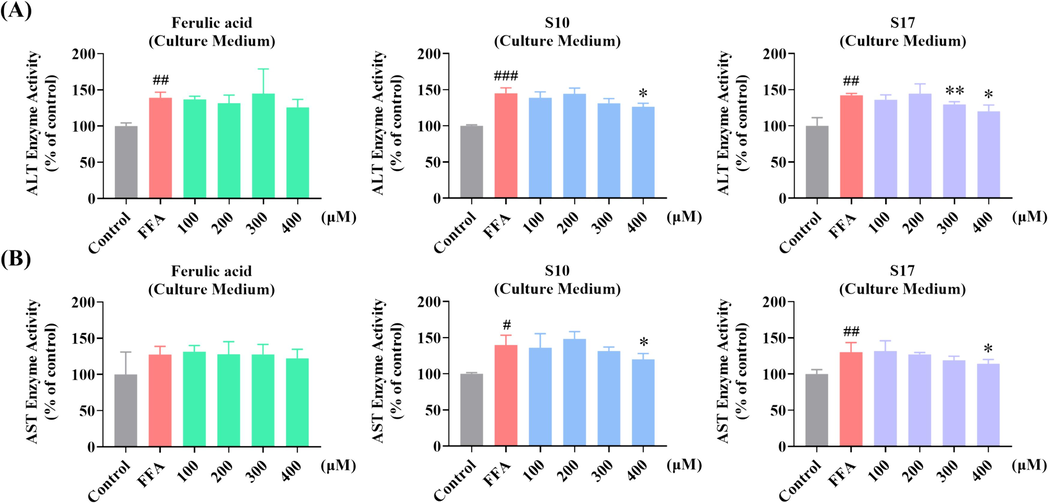
Impact of S10 and S17 on FFA-Induced ALT and AST activity in HepG2 cells. (A) Measurement of ALT activity in culture medium via fluorescence absorption following treatment with designated concentrations of S10 or S17 in the absence or presence of 1 mM FFA for 24 h, with FA serving as a control. (B) Measurement of AST activity in culture medium via fluorescence absorption following treatment with designated concentrations of S10 or S17 in the absence or presence of 1 mM FFA for 24 h, with FA serving as a control. The data, derived from three independent experiments, are presented as mean ± SD. # P < 0.05, ## P < 0.01, ### P < 0.001versus the control group. * P < 0.05, ** P < 0.01 versus the FFA (1 mM) group.
3.2.7 S17 activates AMPK/p-AMPK and represses the expression of SREBP-1 and its downstream proteins in HepG2 cells
SREBP-1 is a crucial transcription factor in lipid metabolism regulation, the hepatic intracellular lipid accumulation is mediated by the expression of the fatty-acid synthesis protein regulated by SREBP-1, like ACC1 (Flowers and Ntambi, 2008, An et al., 2020). In this study, we first measured two key regulators of hepatic lipogenesis SREBP-1 and ACC1, including the protein expression of SREBP-1 and ACC1, and the phosphorylated form of ACC1. Western blot assays were utilized to explore the mechanism of S17 about the lipid-lowering effects in FFA-treated cells.
As shown in Fig. 8A&8B, treatment of S17 (100, 200, 300, and 400 μM) in HepG2 cells for 24 h resulted in a dose-responsive decrease in SREBP-1 protein expression. The change was also observed in parallel assays using AICAR as a positive control. In addition, S17 downregulated the level of ACC1 and ACC1 phosphorylation, but the relative proportion of p-ACC1/ACC1 shown a corresponding increase (Fig. 8C). Hence, it is evident that S17 constrained the expression of SREBP-1 and its downstream proteins.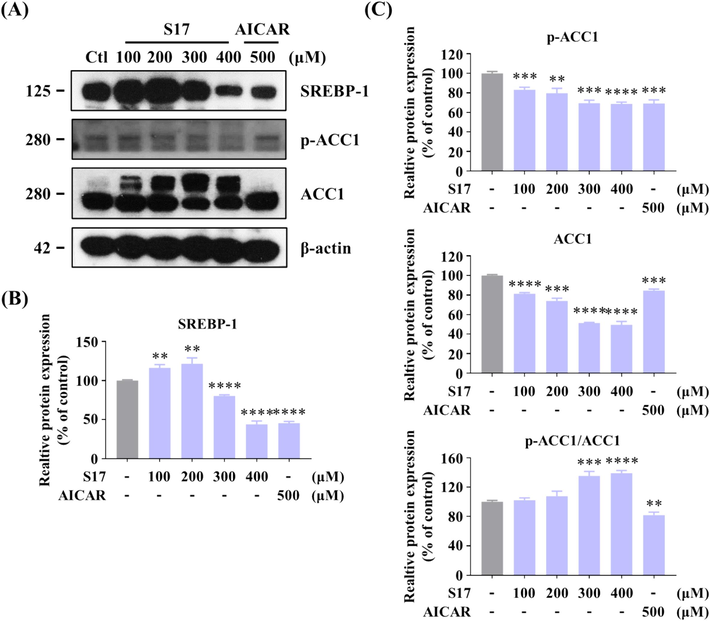
Inhibitory Effects of compound S17 on SREBP-1 in HepG2 cells. (A) Influence of varying concentrations of S17 on the protein levels of SREBP-1 and ACC1, as well as the phosphorylation level of ACC1. HepG2 cells were treated with or without S17 for 24 h. (B, C) Grayscale analysis of the Western Blot data of Figure A. The results were showed as means ± SD (n = 3) of at least three independent experiments. * P < 0.05, ** P < 0.01, *** P < 0.001, **** P < 0.0001 compared with control group.
Adenosine 5′-monophosphate (AMP)-activated protein kinase (AMPK) plays an important role in regulating hepatic lipid metabolism, study has demonstrated that AMPK represses the gene expression of SREBP-1, which in turn leads to a reduction in hepatic lipid accumulation (Li et al., 2011, Attal et al., 2022, Fang et al., 2022). Moreover, AMPK guide phosphorylation of ACC, blocking the synthesis of malonyl-CoA. Inhibition the expression or acticity of AMPK activited SREBP-1, then induced its downstream lipogenic proteins including ACC1.
As illustrated in Fig. 9A, treatment of HepG2 cells with S17 (100, 200, and 300 μM) in the presence of FFAs for 12 h notably enhanced the phosphorylation of AMPK and ACC1 in a dose-responsive manner, while concurrently reducing SREBP-1 protein levels. The grayscale analysis (Fig. 9B-9D) revealed that S17 decrease expression of SREBP-1, and activated the phosphorylation of ACC1. However, compared to AICAR, S17 prominently upregulated the protein level of AMPK (346.8 % of contrl), and the relative proportion of p-AMPK/AMPK was obviously lower than AICAR. Therefore, S17 regulating hepatic lipid accumulation by activating both AMPK and phosphorylation of AMPK.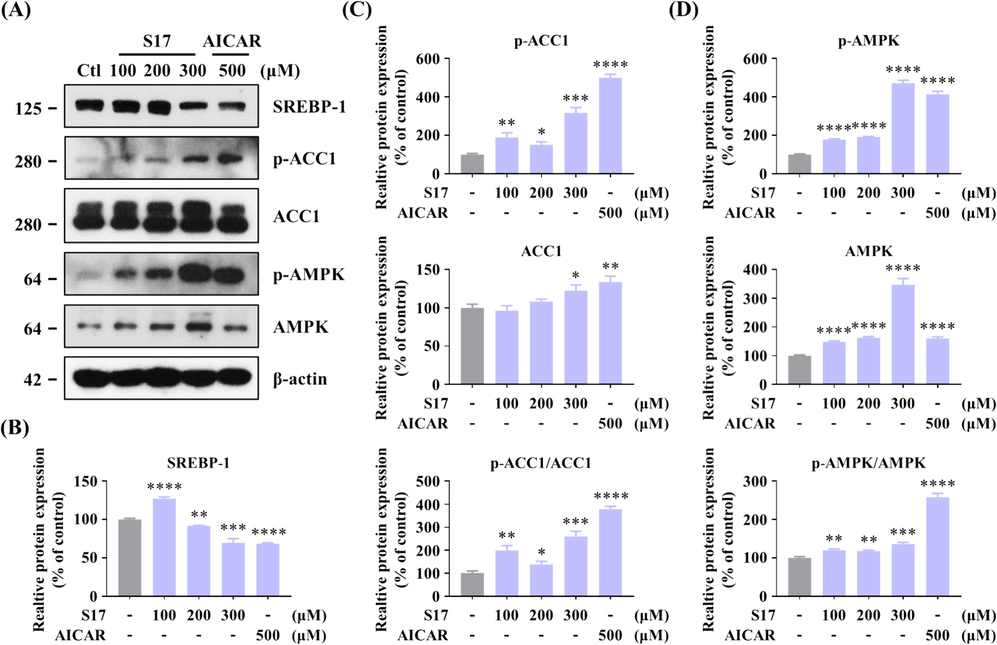
Inhibitory Effects of compound S17 on SREBP-1 in HepG2 cells. (A) Influence of varying concentrations of S17 on the protein levels of AMPK, SREBP-1, and ACC1, along with the phosphorylation levels of AMPK and ACC1. HepG2 cells were treated with designated concentrations of S17 for 12 h. AICAR served as the positive control, and β-actin was used as a loading control. (B-D) Grayscale analysis of Western Blot of SREBP-1 (B), p-ACC1/ACC1 (C), and p-AMPK/AMPK (D) in Figure A. The results were showed as means ± SD (n = 3) of at least three independent experiments. * P < 0.05, ** P < 0.01, *** P < 0.001, **** P < 0.0001 compared with control group.
To further confirm that S17-induced decline in lipid accumulation is mediated through the AMPK signaling pathway, HepG2 cells were pre-treated with the AMPK inhibitor, compound C, prior to S17 treatment. Results from Oil Red O staining, presented in Fig. 10A&10B, compound C partially reversed the effect of S17, demonstrate that the lipid accumulation suppressive effect of S17 is dependent on AMPK signaling pathway and other factors. To evaluate the inhibitory effect of S17 in FFA-induced cells, western blots was used to measure the expression of APMK and other lipogenic proteins. The results shown that when cells incubated with S17 in the presence of FFAs for 12 h, S17 activated AMPK expression and ACC1 phosphorylation to impede lipid accumulation (Fig. 10C-10E), but the pretein level of SREBP-1 increased. Additionally, the phosphorylation level of AMPK exhibited no significant differences, which may according to the introduction of FFA. As a result, these compounds needs further modification to enhancing their activity on the inhibitory effect of lipid accumulation.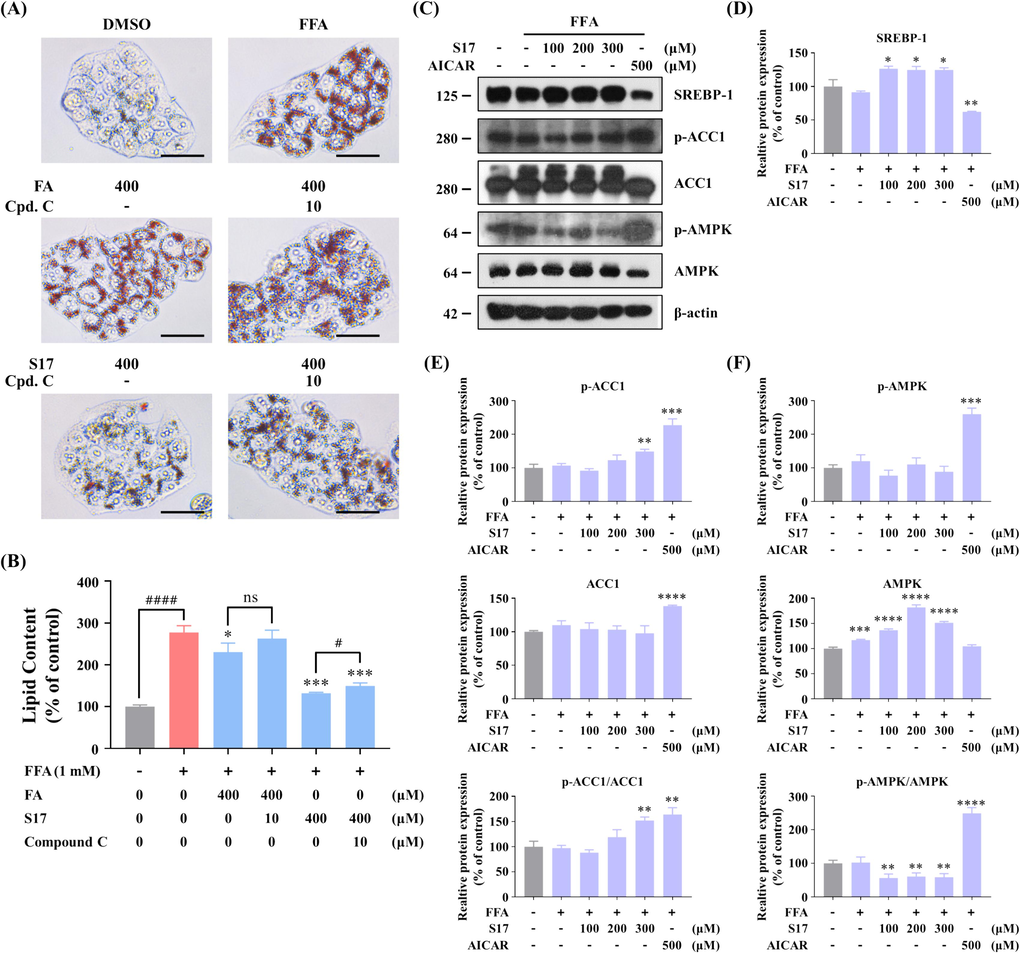
Effects of compound S17 on the AMPK pathway in FFA-stimulated HepG2 cells. (A) Measurement of lipid droplet accumulation using fluorescence absorption. Cells were treated with or without indicated concentrations of ferulic acid (FA), S17 or compound C in the absence or presence of FFA for 24 h. After staining with Oil Red O, fluorescence absorption was determined at an OD of 500 nm. (B) Visualization of lipid droplet accumulation influenced by ferulic acid (FA) and S17 in the absence or presence of FFA (1 mM) and compound C for 24 h (scale bar 50 μm, 40 × ). The results were showed as means ± SD (n = 3) of at least three independent experiments. # P < 0.05, ## P < 0.01, ### P < 0.001, #### P < 0.0001 versus the linked group. * P < 0.05, ** P < 0.01, *** P < 0.001, versus the FFA (1 mM) group. (C) Influence of S17 on protein levels of AMPK, SREBP-1, and ACC1, as well as the phosphorylation levels of AMPK and ACC1. HepG2 cells were treated with or without S17 in the absence or presence of FFA (1 mM) for 12 h. AICAR served as a positive control, with β-actin as a loading control. (D-F) Grayscale analysis of Western Blot of SREBP-1 (D), p-ACC1/ACC1 (E), and p-AMPK/AMPK (F) in Figure C. The results were showed as means ± SD (n = 3) of at least three independent experiments. * P < 0.05, ** P < 0.01, *** P < 0.001, **** P < 0.0001 versus the control group. (For interpretation of the references to colour in this figure legend, the reader is referred to the web version of this article.)
4 Conclusion
In this study, we synthesis, SAR studies, and biological evaluation of twenty-one new (E)-3-(3-methoxy-4-substituted phenyl)-acrylic acid derivatives. The MTT assay shown that most of the compounds have no significant cytotoxic effect at concentrations up to 400 μM. The effect of lipid accumulation inhibition was assessed using the Oil Red O assay in HepG2 cells, which revealed that fourteen compounds impeded lipid accumulation. Among the synthesized derivatives, compound S10 and S17 demonstrated notable inhibitory effects on lipid accumulation at 400 μM, without exhibiting cytotoxicity to HepG2 cells at the same concentration. The results of TG assay and AST/ALT assay suggested that S10 and S17 reduced the intracellular lipid accumulation, and surpressed the activity of ALT and AST in HepG2 cells. Western blots results indicated that S17 attenuated lipid accumulation in HepG2 cells through activation of AMPK-mediated signaling pathway, such as suppressed the SREBP-1 expression or activated the phosphorylation of ACC1. Significantly, S17 shown insufficient inhibitive effect to SREBP-1 in FFA-induced HepG2 cells. Therefore, S17 may serve as a promising therapeutic candidate for the treatment of NAFLD, and needs further modification to strengthen their activity.
CRediT authorship contribution statement
Mingdong Li: Funding acquisition, Project administration, Resources, Supervision, Formal analysis, Investigation. Jiahao Liu: Investigation. Yingying Liu: Validation, Data curation. Aoxuan Zhang: Resources, Visualization. Chaoyu Sun: Data curation, Validation. Kang Li: Data curation. Yizhao Liu: Investigation. Shutong Dai: Data curation. Mingyuan Ma: Software. Xinru Li: Formal analysis. Qipan Fan: Data curation. Huanwen Chen: Funding acquisition. Yanfei Xie: Resources, Software, Validation. Yuqing Qian: Conceptualization, Formal analysis, Methodology, Validation, Writing – original draft, Writing – review & editing. Siyu Zhou: Data curation, Formal analysis, Resources, Validation, Writing – original draft, Writing – review & editing.
Acknowledgments
This research was funded by grants from the Jiangxi University of Chinese Medicine of Science and Technology Doctoral Startup Fund Project (No. 5252300311/2004, 5152300310/2004, 5152000102/2004) , and the Jiangxi University of Chinese Medicine School-level Science and Technology Innovation Team Development Program (No. CXTD22005). The authors extend their sincere gratitude to Zhihong Yan, Zhangyang Shen, Genlin Sun and En Yuan from the Analysis and Measurement Center, School of Pharmaceutical Sciences, Jiangxi University of Chinese Medicine, for their invaluable assistance with NMR testing and HR-MS assay. Additionally, special thanks are extended to Xuan Liu and Shanshan Li from the Laboratory Animal Science and Technology Center, Jiangxi University of Chinese Medicine, for their crucial support in this research.
Declaration of Competing Interest
The authors declare that they have no known competing financial interests or personal relationships that could have appeared to influence the work reported in this paper.
References
- Beneficial effects of SREBP decoy oligodeoxynucleotide in an animal model of hyperlipidemia. Int. J. Mol. Sci.. 2020;21 ARTN 552
- [CrossRef] [Google Scholar]
- Role of AMPK-SREBP signaling in regulating fatty acid binding-4 (FABP4) expression following ethanol metabolism. Biology-Basel.. 2022;11 ARTN 1613
- [CrossRef] [Google Scholar]
- Nephroprotective effects of ferulic acid, Z-ligustilide and E-ligustilide isolated from Angelica sinensis against cisplatin toxicity in vitro. Toxicol. In Vitro. 2015;29:458-467.
- [CrossRef] [Google Scholar]
- AMPK signalling in health and disease. Curr. Opin. Cell Biol.. 2017;45:31-37.
- [CrossRef] [Google Scholar]
- Study on effects of Zhi Zi (Fructus gardeniae) on non-alcoholic fatty liver disease in the rat. J. Tradit. Chin. Med.. 2012;32:82-86.
- [CrossRef] [Google Scholar]
- Human fatty liver disease: old questions and new insights. Science. 2011;332:1519-1523.
- [CrossRef] [Google Scholar]
- Ferulic Acid and P-Coumaric Acid Synergistically Attenuate Non-Alcoholic Fatty Liver Disease through HDAC1/PPARG-Mediated Free Fatty Acid Uptake. Int. J. Mol. Sci.. 2022;23
- [CrossRef] [Google Scholar]
- Comparative Transcriptome Analysis Reveals That Exendin-4 Improves Steatosis in HepG2 Cells by Modulating Signaling Pathways Related to Lipid Metabolism. Biomedicines.. 2022;10
- [CrossRef] [Google Scholar]
- The AMPK pathway in fatty liver disease. Front. Physiol.. 2022;13 ARTN 966632
- [CrossRef] [Google Scholar]
- Role of stearoyl-coenzyme A desaturase in regulating lipid metabolism. Curr. Opin. Lipidol.. 2008;19:248-256.
- [CrossRef] [Google Scholar]
- Non-Alcoholic Fatty Liver Disease (NAFLD) Pathogenesis and Natural Products for Prevention and Treatment. Int. J. Mol. Sci.. 2022;23
- [CrossRef] [Google Scholar]
- Nonalcoholic fatty liver disease: new treatments. Curr. Opin. Gastroenterol.. 2015;31:175-183.
- [CrossRef] [Google Scholar]
- Reduced oxidative stress contributes to the lipid lowering effects of isoquercitrin in free fatty acids induced hepatocytes. Oxid. Med. Cell. Longev.. 2014;2014:313602
- [CrossRef] [Google Scholar]
- Novel esters and amides of nonsteroidal antiinflammatory carboxylic acids as antioxidants and antiproliferative agents. J. Med. Chem.. 1999;42:267-276.
- [CrossRef] [Google Scholar]
- Antithrombotic activities of ferulic acid via intracellular cyclic nucleotide signaling. Eur. J. Pharmacol.. 2016;777:1-8.
- [CrossRef] [Google Scholar]
- Ferulic acid in Lolium multiflorum inhibits adipogenesis in 3T3-L1 cells and reduced high-fat-diet-induced obesity in Swiss albino mice via regulating p38MAPK and p44/42 signal pathways. J. Funct. Foods. 2017;37:293-302.
- [CrossRef] [Google Scholar]
- Determination of ferulic acid in Angelica sinensis and Chuanxiong by capillary zone electrophoresis. Biomed. Chromatogr.. 1999;13:333-334.
- [CrossRef] [Google Scholar]
- AMPK and mTOR regulate autophagy through direct phosphorylation of Ulk1. Nat. Cell Biol.. 2011;13:132-U171.
- [CrossRef] [Google Scholar]
- The global NAFLD policy review and preparedness index: Are countries ready to address this silent public health challenge? J. Hepatol.. 2022;76:771-780.
- [CrossRef] [Google Scholar]
- Krill oil and xanthigen separately inhibit high fat diet induced obesity and hepatic triacylglycerol accumulation in mice. J. Funct. Foods. 2015;19:913-921.
- [CrossRef] [Google Scholar]
- Design, synthesis and antibacterial activity of cinnamaldehyde derivatives as inhibitors of the bacterial cell division protein FtsZ. Eur. J. Med. Chem.. 2015;97:32-41.
- [CrossRef] [Google Scholar]
- AMPK phosphorylates and inhibits SREBP activity to attenuate hepatic steatosis and atherosclerosis in diet-induced insulin-resistant mice. Cell Metab.. 2011;13:376-388.
- [CrossRef] [Google Scholar]
- Nonalcoholic steatohepatitis: Mayo Clinic experiences with a hitherto unnamed disease. Mayo Clin. Proc.. 1980;55:434-438.
- [Google Scholar]
- Ferulic acid: pharmacological and toxicological aspects. Food Chem. Toxicol.. 2014;65:185-195.
- [CrossRef] [Google Scholar]
- Bioconversions of ferulic acid, an hydroxycinnamic acid. Crit. Rev. Microbiol.. 2006;32:115-125.
- [CrossRef] [Google Scholar]
- Nonalcoholic fatty liver disease: pathogenesis and the role of antioxidants. Nutr. Rev.. 2002;60:289-293.
- [CrossRef] [Google Scholar]
- Ferulic acid reverses ABCB1-mediated paclitaxel resistance in MDR cell lines. Eur. J. Pharmacol.. 2016;786:194-203.
- [CrossRef] [Google Scholar]
- Ferulic acid regulates hepatic GLUT2 gene expression in high fat and fructose-induced type-2 diabetic adult male rat. Eur. J. Pharmacol.. 2015;761:391-397.
- [CrossRef] [Google Scholar]
- In vitro models for non-alcoholic fatty liver disease: Emerging platforms and their applications. iScience.. 2022;25:103549
- [CrossRef] [Google Scholar]
- Modulation of iNOS expression by a nitric oxide-releasing derivative of the natural antioxidant ferulic acid in activated RAW 264.7 macrophages. Eur. J. Pharmacol.. 2006;532:162-169.
- [CrossRef] [Google Scholar]
- Free fatty acid effects on myokine production in combination with exercise mimetics. Mol. Nutr. Food Res.. 2013;57:1456-1467.
- [CrossRef] [Google Scholar]
- The challenge of developing novel pharmacological therapies for non-alcoholic steatohepatitis. Liver Int.. 2010;30:795-808.
- [CrossRef] [Google Scholar]
- Nonalcoholic Steatohepatitis: A Review. J. Am. Med. Assoc.. 2020;323:1175-1183.
- [CrossRef] [Google Scholar]
- Target guided synthesis of 5-benzyl-2,4-diamonopyrimidines: their antimalarial activities and binding affinities to wild type and mutant dihydrofolate reductases from Plasmodium falciparum. J. Med. Chem.. 2004;47:345-354.
- [CrossRef] [Google Scholar]
- Protective effects of ferulic acid on hyperlipidemic diabetic rats. Acta Diabetol.. 2003;40:118-122.
- [CrossRef] [Google Scholar]
- Ferulic Acid modulates altered lipid profiles and prooxidant/antioxidant status in circulation during nicotine-induced toxicity: a dose-dependent study. Toxicol. Mech. Methods. 2005;15:375-381.
- [CrossRef] [Google Scholar]
- CSAD Ameliorates Lipid Accumulation in High-Fat Diet-Fed Mice. Int. J. Mol. Sci.. 2022;23
- [CrossRef] [Google Scholar]
- Nonalcoholic steatohepatitis is the second leading etiology of liver disease among adults awaiting liver transplantation in the United States. Gastroenterology. 2015;148:547-555.
- [CrossRef] [Google Scholar]
- Schisandrin B mitigates hepatic steatosis and promotes fatty acid oxidation by inducing autophagy through AMPK/mTOR signaling pathway. Metabolism. 2022;131:155200
- [CrossRef] [Google Scholar]
- Ferulic acid exerts antidepressant-like effect in the tail suspension test in mice: evidence for the involvement of the serotonergic system. Eur. J. Pharmacol.. 2012;679:68-74.
- [CrossRef] [Google Scholar]
Appendix A
Supplementary data
Supplementary data to this article can be found online at https://doi.org/10.1016/j.arabjc.2024.105859.
Appendix A
Supplementary data
The following are the Supplementary data to this article:Supplementary Data 1
Supplementary Data 1


