

Translate this page into:
A comparative UPLC-MS-based metabolomics approach for distinguishing four different cultivars of Qiai (Artemisia argyi Lévl. et Van.)
⁎Corresponding author at: School of Pharmaceutical Sciences, South-Central Minzu University, Minzu Avenue, Hongshan, Wuhan 430074, China. xzyang@mail.scuec.edu.cn (Xinzhou Yang)
-
Received: ,
Accepted: ,
This article was originally published by Elsevier and was migrated to Scientific Scholar after the change of Publisher.
Abstract
The Artemisia argyi Lévl. et Van. (A. argyi) from Qichun County, Hubei Province, China, also known as Qiai, is the most important crop in the region. The quality of Qiai can be influenced by the cultivar, which is highly associated with its metabolite components. In this study, 63 batches of Qiai samples from four cultivars, Xiangai (XA), Wujian (WJ), Qijian (QJ), and Baiai (BA), were investigated using untargeted ultra-performance liquid chromatography–mass spectrometry (UPLC-MS) and chemometrics. In total, 44 metabolites were tentatively identified by combining ultra-performance liquid chromatography time-of-flight mass spectrometry (UPLC-Q-TOF/MS) data with the UNIFI platform and its embedded Traditional Medicine Library. Combining principal component analysis (PCA), partial least squares discriminant analysis (PLS-DA), and orthogonal partial least squares discriminant analysis (OPLS-DA), twelve chemical markers were found to distinguish the four cultivars, showing a high degree of cultivar variability. Five of these compounds were quantified by ultra-performance liquid chromatography triple-quadrupole mass spectrometry (UPLC-TQ-MS/MS) to obtain more accurate content information. This comprehensive study constitutes a valuable reference for distinguishing the four Qiai cultivars, as well as other cultivars, and has implications for Qiai breeding.
Keywords
Artemisia Argyi Lévl. et Van.
Qiai
UPLC-MS
Metabolomics
Processing
Cultivar

1 Introduction
Artemisia argyi Lévl. et Van. is one of the most prestigious plants in the Artemisia family; since ancient times to the present, it has been widely used in food manufacturing and traditional Chinese medicine. Due to their special aroma and palatable bitterness, A. argyi leaves are often used as bittering agents, as natural coloring, and flavor enhancers in the food industry, such as in green dumplings, a traditional Chinese snack (Wang, 2022). Another more important use of A. argyi is medicinal, especially in Chinese, Japanese, and Korean traditional medicine (Zhang et al., 2021; Kim et al., 2019; Shimono et al., 2013). A. argyi has been shown to improve the inflammatory response in patients with rheumatoid arthritis (Chen et al., 2022). Another use is in moxibustion, a traditional Chinese medicine treatment whereby plant materials are incinerated over acupuncture points (Schlaeger et al., 2018).
The A. argyi from Qichun County, Hubei Province, China, is known as Qiai. Because of its high quality, Qiai has become a local geographical indication product. The active components in Qiai include phenolic acids, terpenoids, polysaccharides, flavonoids, and essential oils (Guo et al., 2019; Wang et al., 2019; Liu et al., 2021; Xiao et al., 2019). Recent studies have shown that Qiai contains high amounts of essential oil, tannins, and flavonoids, compared to varieties of the plant from other production areas (Hu et al., 2019; Chen et al., 2021; Wang et al., 2018; Li et al., 2019). In 2021, the Qiai planting area reached 15,600 hm2, with an industrial output value of USD 1.16 billion (Wang et al., 2022).
After more than a decade of breeding, local growers have generated Qiai cultivars by intensively breeding plants with different genetically stable morphological characteristics, which can be distinguished based on leaf phenotypic characteristics and other indicators. During the long-term natural evolution of the plant, cultivated and wild species have continuously interbred, bringing about germplasm resources with rich variation. However, this has also led to the issue of mixed varieties in the artificial cultivation of Qiai. Since Qichun County is a suitable growing area for A. argyi, the Qiai produced here is always in short supply. However, the selection of Qiai cultivars started late and the origin is limited; moreover, the long term asexual propagation of Qiai leads to the degradation of Qiai germplasm resources and frequent occurrence of diseases and damage by insects. As such, systematic research on germplasm resources is needed to facilitate the screening of good varieties and the development of sexual propagation of Qiai to maximize the use of resources.
UPLC-Q-TOF/MS is widely used as an analytical method for the analysis of complex metabolites; it possesses high column separation efficiency, high resolution, and high sensitivity. The combination of UPLC-Q-TOF/MS with the UNIFI platform enables the rapid and automatic characterization of chemical constituents in plants; it has the advantages of high sensitivity, good selectivity, and ease of operation (Anand et al., 2021). In recent years, untargeted metabolomics approaches performed on UPLC-MS combined with chemometric methods have shown promise in plant metabolomics (Pan et al., 2022; Guo et al., 2019; Zhou et al., 2020).
Considering that biochemical indicators of crops can provide more accurate and reliable information than purely agricultural parameters and visual assessments, this study distinguished four Qiai cultivars (XA, BA, WJ, and QJ) based on their chemical compositions. An accurate and rapid methodology using UPLC-Q-TOF/MS combined with the UNIFI platform was established to explore and characterize the differences in the metabolic compositions of XA, WJ, QJ, and BA, and to accurately quantify the chemical markers.
2 Materials and methods
2.1 Chemicals
4-Dicaffeoylquinic acid was purchased from Weikeqi (Chengdu, China), schaftoside, 3,4-di-O-caffeoylquinic acid, and hispidulin, were purchased from Alfa (Chengdu, China), and hyperoside was purchased from Yuanye (Shanghai, China). HPLC-grade formic acid and acetonitrile were purchased from Sigma (St Louis, America). Methanol was acquired from Chron Chemicals (Chengdu, China). A Milli-Q purification system (Millipore, France) was used to create ultra-pure water.
2.2 Plant material
A total of 63 batches of fresh Qiai leaves of 4 species (Xiangai, n = 12; Baiai, n = 15; Wujian, n = 18; and Qijian, n = 18) were collected from Qichun County, Huanggang City, Hubei Province, China. The time of harvest was June 4, 2021. The collected plant leaves were dried for a week in the dark and then pulverized with an electric grinder to produce mugwort leaf powder.
2.3 Preparation of extract
For each batch of the four cultivars, 5.0 g of mugwort powder was weighted for extraction. Then, 70 % methanol was added to the powder at a ratio of 1: 20 (w/v) and macerated for 3 h at room temperature. It was then heated and refluxed 3 times (2.5 h each) in an 85 ℃ water bath, and combined with the filtrate. The corresponding solvent was used to make up the weight lost during the heating reflux process. The sample solution was centrifuged with a centrifuge (Eppendorf 5810R) at 10,000 r/min for 10 min, and the supernatant was used for the test. The quality control (QC) sample consisted of 50 µL of 63 samples. It was then completely vortexed and mixed, and transferred to a sample bottle for analysis.
2.4 UPLC-Q-TOF/MS analysis
Chromatographic analysis was performed on an ultra-performance liquid chromatography (UPLC) system equipped with a four-element pump, an online degassing machine, an automatic sampler, and a thermostatically controlled column chamber. The separation was performed on an ACQUITY UPLC HSS T3 column (100 × 2.1 mm, 1.8 µm). The gradient proceeded as follows: 0–1.0 min, 2–5 % B; 1.0–7.0 min, 5–20 % B; 7.0–9.0 min, 20 % B; 9.0–12.5 min, 20–28 % B; 12.5–18.0 min, 28–40 % B; 18.0–22.0 min, 40–98 % B, 22.0–25.0 min, 98 % B. The column and autosampler were kept at 45 and 4℃, respectively. MS detection was carried out using a Synapt-G2-SI MS system. The high collision energy ranged from 15 to 25 eV, whereas the low collision energy was fixed at 6 eV, and the ionization mode was set as electron spray ionization (ESI). The mass ranged from 50 to 1200 Da. The cone voltage was 40 V, and the capillary voltage was 3.00 kV in the negative mode and 2.59 kV in the positive mode. The desolvation temperature was fixed at 500 ℃, while the ion source temperature remained at 150 ℃. Desolvation gas (N2) flowed at 800 L/h, while the cone gas (N2) flowed at 50 L/h. One injection of the QC sample was initially performed to equilibrate the column prior to the injection of the 63 samples, and it was run after every 9 injections of the samples.
2.5 UPLC-TQ-MS/MS analysis
A mixed standard stock solution containing hyperoside, schaftoside, 3,4-di-O-caffeoylquinic acid, hispidulin, and 4-dicaffeoylquinic acid was prepared in methanol: water (1: 1, v/v). To prepare working standard solutions for plotting the calibration curve, mixed standards were diluted with methanol within the ranges from 3.2 to 1000 ng/mL. The Xevo TQ-S MS/MS system was used to perform the mass spectrometry detection. The quantitative data acquisition mode was set to multiple reaction monitoring (MRM), the ionization mode was set to ESI-, and the other analysis conditions were consistent with 2.4. Each analyte's collision energy and particular fragmentor voltages were tuned in order to produce the strongest quantitative change.
2.6 Data processing and statistical analysis
UPLC-Q-TOF/MS data acquisition was performed using MassLynx 4.1 (Waters, America) mass spectrometry software. For the metabolite characterization of UNIFI, MS data were obtained in Continnum format without real-time correction. Progenesis QI 3.0 (Waters, USA) was used for the preprocessing and multivariate statistical analysis of the UPLC-TQ-MS/MS data, and a data matrix consisting of retention time, the mass-to-charge ratio, and the peak area was obtained by peak alignment, peak extraction, and deconvolution. The raw data matrix of the pre-processed 2D peaks from 1964 ion features was imported into SIMCA 14.0 (Umetrics, Sweden) and GraphPad Prism 8 (Dotmatics, England) software for normalization.
The use of Simca unsupervised principal component analysis (PCA) gave us a general idea of the relationships that existed between the data matrices of the four cultivars, while partial least squares discriminant analysis (PLS-DA) was used to determine the relationships between the samples with known sample groupings. In order to find the differential metabolites more accurately, orthogonal partial least squares discrimination (OPLS-DA) was performed for XA, WJ, QJ, and BA with three other species, respectively. PLS-DA and OPLS-DA allow for better access to information on differences between the groups, and also allow for the prediction of the grouping of samples, which PCA cannot achieve.
Screening of the potential marker compounds was undertaken using a combination of calculated VIP (variable importance for the projection) values and an S-plot. In order to measure the strength and explanation of the effect of differences in the accumulation of each metabolite on the categorical discrimination of each group of samples, VIP values were calculated for each metabolite, which assisted in the screening of marker metabolites (usually, VIP values > 1.0 were used as screening criteria). An additional criterion for the inclusion of metabolites was that p-value < 0.001 (independent-samples T test). To clarify the potential marker components of the four cultivars, an S-plot was produced. The horizontal coordinates of the S-plot represent the covariance (p) between the principal components and the metabolites, and the vertical coordinates represent the correlation coefficient (p(corr)) between the principal components and the metabolites. The closer the metabolites are to the two corners, the more important they are. In metabolomics studies, screening criteria of |p|≥0.05 and |p(corr)|≥0.5 are commonly used in order to make a metabolite or a combination of metabolites relevant. Heat map analysis of the screened metabolites was performed using Heatmapper (https://www.heatmapper.ca) to visualize the variation in the metabolite content of different cohorts of samples.
2.7 Metabolite identification
SciFinder, PubMed, PubChem, and Reaxys are among the internet databases that were used to compile a list of the compounds mentioned in the literature from QA. The search term “Artemisia argyi” was used to search the literature published up to August 2022. The process of identifying chemical structures in complex natural products can be streamlined by combining UPLC-Q-TOF/MS data with the UNIFI information management platform and its embedded Traditional Medicine Library. Metabolites were characterized by combining accurate masses, MS/MS fragment cleavage patterns, UNIFI platform matching results, and literature references. The mass spectra of each metabolite were manually checked to verify that the molecular fragments predicted by the software were from a single compound.
3 Results and discussion
3.1 Morphological descriptions of four cultivars
Four local Qiai cultivars (XA, WJ, QJ, and BA) were selected for this study. In Xiangai (Fig. 1A), the leaf blade is compactly arranged, the middle of the stem node spacing 1.3 ∼ 3 cm; the leaf blade is broad-ovate or rhombic-ovate, 6 ∼ 11 cm long, 5 ∼ 10 cm wide, and 1-pinnately parted. Each of the two side lobes is 1 ∼ 2.1 cm wide, with 1 ∼ 3 lobes in total. The apical lobe often has three to several lobes or teeth, and the petiole is 1.2 ∼ 1.5 cm long. Usually, the base does not have pseudo-stipules; its fragrance is the strongest among the four cultivars. In Wujian (Fig. 1B), the middle nodes of the stem are spaced 2.5 ∼ 3 cm apart, the leaf blade is rhombic broad-ovate or rhombic-ovate, 8 ∼ 12 cm long, 6.5 ∼ 11.5 cm wide, and 1-pinnately parted. There are two narrowly extended lobes on each side, narrowly elliptic or lanceolate, 1 ∼ 1.8 cm wide. The lateral lobes are either whole or have 1 ∼ 3 teeth clefts. The distance between the lobes is larger; the apical lobes are often three-lobed or have three-lobed teeth. The petiole is 1 ∼ 1.5 cm long, with pseudo-stipules at the base. In Qijian (Fig. 1C), the leaf blade is broad-ovate, 8–11.5 cm long, and 5–9.5 cm wide. It is 1-pinnately parted. There are 3 lobes per side, which are 1.2–1.9 cm wide, with 1 to several narrowly toothed lobes and 3(∼5) finer toothed lobes in the apical lobe. The lateral lobes of all the leaves overlap or are adjacent to each other. The petiole is 0.7 ∼ 1.5 cm long, and the base usually has pseudo-stipules. In Baiai (Fig. 1D), the middle of the blade node spacing is 2 ∼ 3 cm, the leaf blade is broad-ovate, 9 ∼ 12 cm long, 7 ∼ 11 cm wide, and 1-pinnately parted. There are two lobes per side, the lateral lobes are almost whole, the petiole is 1.2 to 1.8 cm long, and the base usually has a pseudo-stipule.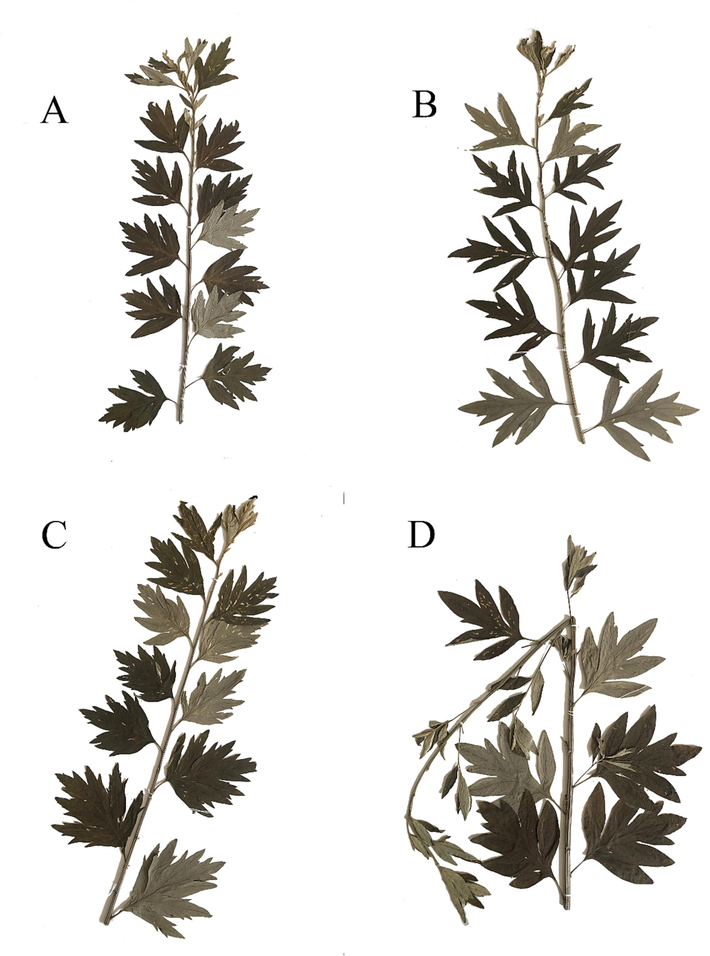
Pictures of specimens of XA,WJ,QJ, and BA (A, B, C, D).
3.2 Qualitative analysis of Qiai samples by UPLC-Q-TOF/MS
Based on the UPLC-Q-TOF/MS method, representative Qiai samples were separated and analyzed using an HSS T3 column for 25 min, and the detected metabolite ion profiles were applied to the statistical analysis detailed below. The structures of 208 compounds reported from A. argyi species were collected and saved in an.sdf file as a theoretical library. After rapidly matching the MS data of the sample and the UNIFI platform with the theoretical library, a total of 44 metabolites were identified by negative ion mode, including 18 flavonoids, 5 flavonoid glycosides, 5 chlorogenic acid derivatives, 11 sesquiterpenes, 2 lactones, 1 fatty acid, and 1 propiophenone. Detailed information on the metabolic compounds can be found in Table S1.
As the main components of A. argyi, chlorogenic acid derivatives are a significant class of bioactive polyphenols, which can regulate the metabolism and protect the liver (Naveed et al., 2018); moreover, the flavonoid components can promote the growth of intestinal probiotics (Ma et al., 2022). In addition, the flavonoid glycosides in A. argyi leaves have anticoagulant effects (Lv et al., 2018), and the sesquiterpenes have anti-cancer-cell proliferation properties (Ming et al., 2021).
3.3 The metabolome of different cultivars of Qiai
In total, 63 samples from 4 cultivars of Qiai (XA, WJ, QJ, and BA) were appraised using UPLC-TQ-MS/MS. The representative base peak ion chromatograms (BPI) in the negative ion of QA are shown in Fig. 2. PCA method was used to reduce the dimensionality of the pre-processed high-dimensional metabolite data, and to extract the main feature components of the data. In PCA score plot (Fig. 3A), the primary, secondary, and tertiary components explained 21.5 %, 17.7 %, and 13.6 % of the variation, respectively. QJ and BA partially overlap, and these two groups are not well separated, while XA is tightly clustered and completely separated from WJ, QJ, and BA. The loading plot of supervised PLS-DA was subsequently carried out to explore the most significant differential metabolites among the four Qiai cultivars (R2 = 0.942, and Q2 = 0.929) (Fig. 3B), demonstrating inter-cultivar differences in metabolites of Qiai. Although PLS-DA analysis can show group differences to a greater extent than PCA, the disadvantage of the supervised classification model is that overfitting may occur, so the reliability of the PLS-DA model needs to be verified. The PLS-DA model was tested for overfitting using the 200 permutation test (permutation test), and the intercepts of the R2 and Q2 regression lines with respect to the coordinate axes were 0.102 and −0.340, respectively (Fig. 3C), which indicates that the PLS-DA model is reliable. Finally, the points highlighted in the loading plot were the 364 metabolites screened for VIP > 1 (Fig. 3D). To identify the marker compounds responsible more accurately for differentiating the four cultivars, we compared each of the four cultivars with the sum of the other three cultivars, using the OPLS-DA method applied to make comparisons between the two groups (Fig. 4). The R2 of these four OPLS-DA models were 0.963, 0.968, 0.979, and 0.980, respectively, and the Q2 values were 0.953, 0.955, 0.966, and 0.968, respectively. Among the metabolites in the S-plot with p-values ≤ 0.05, the remaining metabolites were filtered out by |p|≥0.05 and |p(corr)|≥0.5.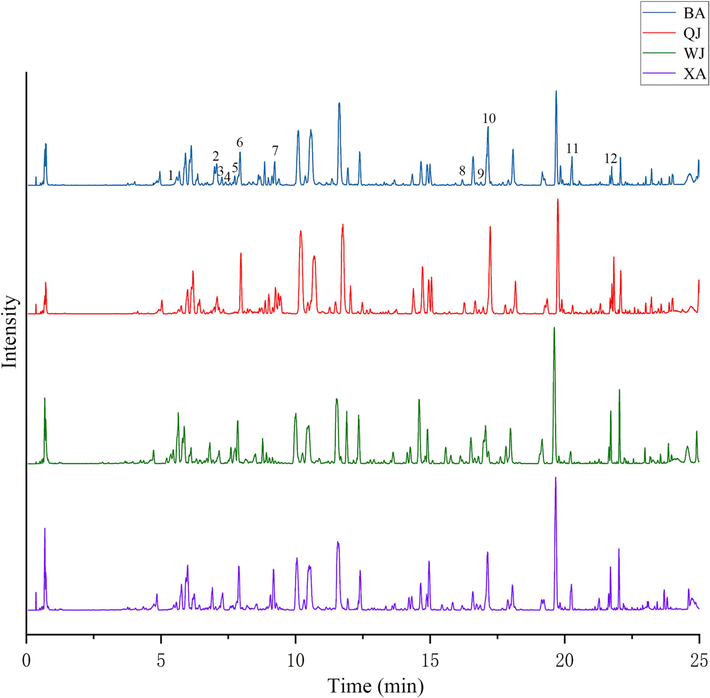
The representative base peak ion chromatograms (BPI) in negative ion of QA (Peaks 1–12 correspond to the 12 key metabolites in Table 1).
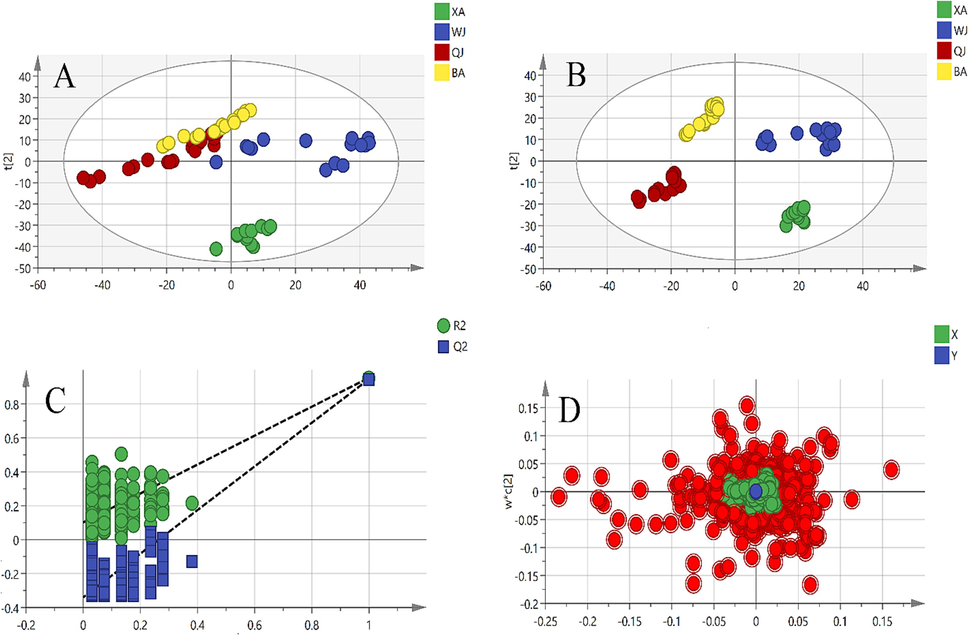
Multivariate statistical analyses of four different cultivar Qiai samples: (A) PCA score plot; (B) PLS-DA score plot; (C) cross-validation plot of the PLS-DA model with 200 permutation tests; (D) loading plot of PLS-DA (red dots represent the most differential compounds, VIP > 1).
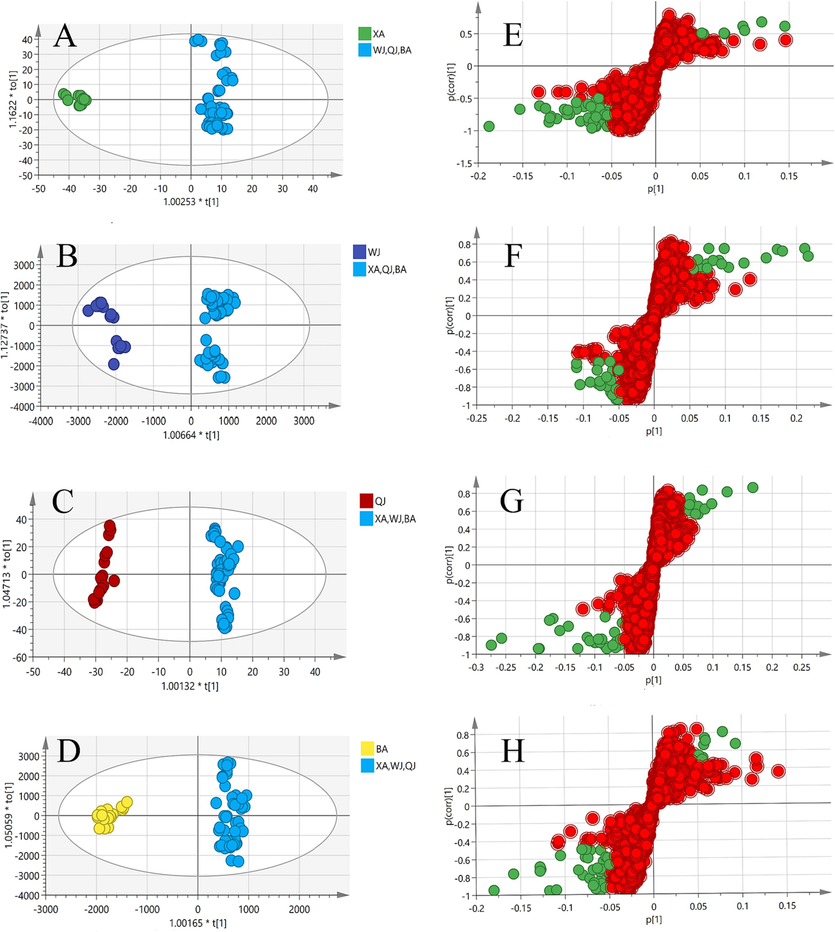
OPLS-DA score plot (A, B, C, D) and S-plot (E, F, G, H) along with selected candidate marker compounds (cut-off values of |p| ≥0.05 and |p (corr) | ≥ 0.5, green dots represent the most differential compounds, VIP > 1) between XA, WJ, QJ and BA vs. the other three cultivars, respectively.
Consequently, 12 marker components were selected and initially determined (Table 1). The structures of these 12 chemical markers are shown in Fig. 5. The metabolic markers among the four cultivars include hyperoside, apicin, 4-dicaffeoylquinic acid, schaftoside, argyin D, 3,4-O-dicaffeoylquinic acid, hispidulin, chrysoplenitin, artanomaloide A, argyinolide G, artemetin, and jaceidin. MW: Molecular weight; VIP: Variable importance for the projection; *p < 0.001, **p < 0.0001; a, b, c and d indicate the comparison of selected candidate marker compounds between XA, WJ, QJ and BA and other three cultivars, respectively.
No.
Compound Name
Formula
EM
MW
VIP
P-value
1
4-dicaffeoylquinic acid
C16H18O9
353.0877
354.0957
3.27b
**b
2
schaftoside
C26H28O14
563.1404
564.1494
6.95b, 6.37c
**b, **c
3
argyinolide G
C17H22O6
307.0849
308.1271
2.90d
**d
4
artemetin
C20H20O8
433.2065
388.1150
2.27d
**d
5
argyin D
C15H18O5
277.1077
278.1160
3.38b
**b
6
hyperoside
C21H20O12
463.0884
464.0971
6.80a, 7.61b
*a, *b
7
3,4-O-dicaffeoylquinic acid
C25H24O12
515.1196
516.1278
7.76c
**c
8
hispidulin
C16H12O6
299.0564
300.0640
4.35c
**c
9
jaceidin
C18H16O8
359.0778
360.0845
2.40d
**d
10
apicin
C18H16O8
359.0770
360.0851
3.42a
*a
11
chrysoplenitin
C19H18O8
373.0926
374.1009
3.80c
**c
12
artanomaloide A
C35H42O8
635.2834
590.2895
8.61c
**c
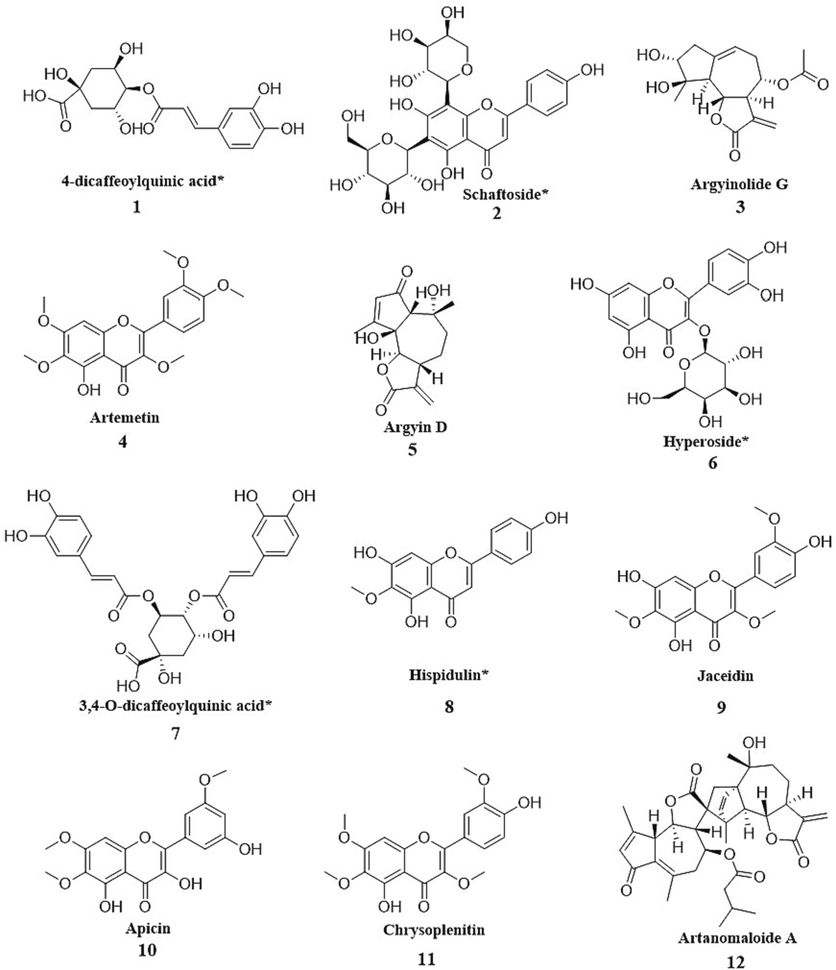
The structures of 12 chemical markers (* indicates that the compound has been quantified).
In an effort to present a more visual and contrasting picture of the differential compound content between the four Qiai cultivars, twelve markers were graphed in a heat map (Fig. 6). Each column represents a batch of Qiai samples, and each row represents a differential compound. Red and green colors designate lower and higher metabolite contents than the average, respectively. From the above information, we can conclude that, compared to the other three Qiai cultivars, XA had higher hyperoside content and lower apicin content, WJ had lower levels of 4-dicaffeoylquinic acid, schaftoside and hyperoside, and higher levels of argyin D. QJ was rich in schaftoside, 3,4-O-dicaffeoylquinic acid and artanomaloide A, and lacked hispidulin and chrysoplenitin. The levels of argyinolide G, artemetin and jaceidin in BA were significantly higher than in the other three cultivars.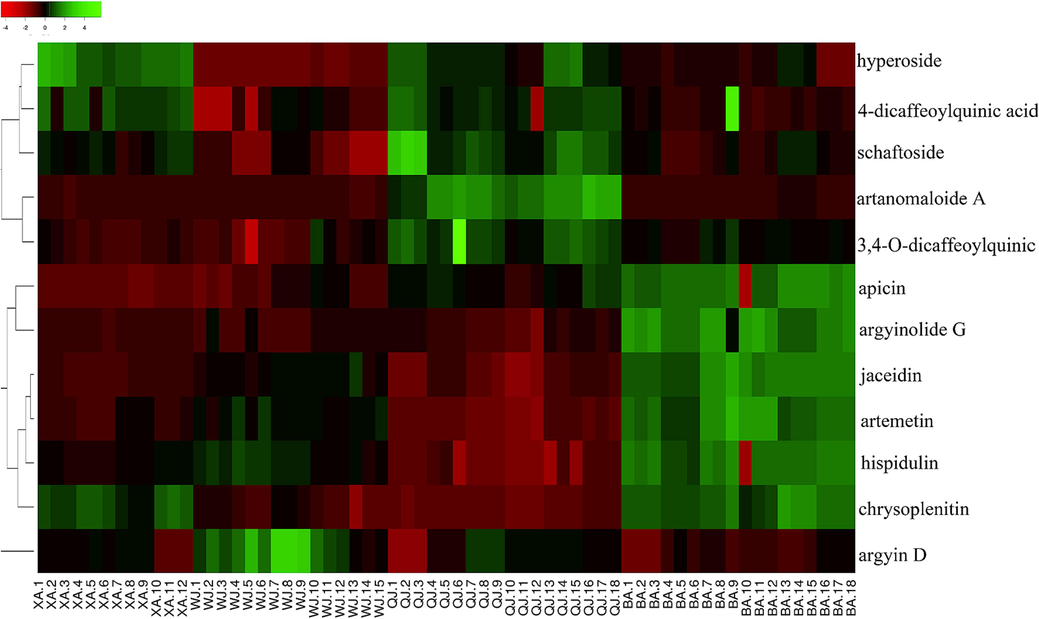
Heat-map of metabolite contents in four cultivars of Qiai.
Different cultivars have unique chemical profiles, which provide more options for growers and consumers seeking versatility. Moreover, the differential metabolic compounds identified in this study have the potential to be used to identify Qiai cultivars.
3.4 Quantitative analyses of chemical markers using UPLC-TQ-MS/MS
To obtain more accurate chemical marker levels, 4-dicaffeoylquinic acid, schaftoside, hyperoside, 3,4-di-O-caffeoylquinic acid, and hispidulin were selected from the differential compounds of the four cultivars for quantitative analysis by UPLC-TQ-MS/MS. The developed UPLC-TQ-MS/MS method was applied to quantify five chemical markers in leaves of A. argyi. The optimized conditions are presented in Table S2. and the results of the method validation are shown in Table S3. The method’s linearity, sensitivity, precision, and accuracy satisfy internal standards. The average contents of 4-dicaffeoylquinic acid, schaftoside, hyperoside, 3,4-di-O-caffeoylquinic acid, and hispidulin in the four cultivars were compared, and the results were expressed as the mass of the compound per gram of Qiai powder (mg/g). As shown in Table 2, the content levels of the quantitative analysis results were consistent with the color shades in the heat map. The accuracy of the qualitative analysis results was further verified. * 0.01 < p < 0.05, ** p < 0.001.
4-dicaffeoylquinic acid (mg/g)
Schaftoside (mg/g)
Hyperoside (mg/g)
3,4-O-dicaffeoylquinic acid (mg/g)
Hispidulin (mg/g)
XA
2.786 ± 0.002**
2.680 ± 0.001**
0.337 ± 0.001*
19.301 ± 0.006**
0.572 ± 0.001*
WJ
1.784 ± 0.001**
1.373 ± 0.002**
0.027 ± 0.001*
20.410 ± 0.018**
0.498 ± 0.001*
QJ
2.750 ± 0.001**
3.372 ± 0.003**
0.951 ± 0.001**
43.864 ± 0.026**
0.268 ± 0.001*
BA
1.419 ± 0.001**
1.864 ± 0.001*
0.064 ± 0.001*
12.627 ± 0.004**
0.920 ± 0.001**
4 Conclusion
The metabolomes of four different cultivars of Qiai were evaluated with the assistance of non-targeted metabolomics. Despite their similar growth environments, different cultivars can still affect the chemical composition of the noted pharmacological effects. The present study demonstrated that the contents of 4-dicaffeoylquinic acid, argyinolide G, artemetin, schaftoside, argyin D, hyperoside, 3,4-O-dicaffeoylquinic acid, hispidulin, jaceidin, apicin, chrysoplenitin, and artanomaloide A could be used to distinguish the four cultivars (XA, WJ, QJ, and BA). UPLC-MS-based untargeted metabolomics allows for detailed analysis and has robust data processing capabilities, so it could be used to evaluate the quality of Qiai products from diverse cultivars. Future studies may investigate the metabolite differences among different cultivars of A. argyi, as well as varieties with different origins or those that are subject to different processing methods. This study improves our understanding of the chemical diversity of Qiai, provides a more rigorous scientific method for distinguishing Qiai cultivars, provides a database for the selection and breeding of superior cultivars, and provides a theoretical basis for the application of non-targeted metabolomics to the origin tracing, species identification, and quality evaluation of other plants. To our knowledge, there are no reports on the metabolomic investigation of different Qiai cultivars; here, the non-targeted metabolomic methodology based on UPLC-MS is reported for Qiai for the first time.
Acknowledgments
We thank Fundamental Research Funds for the Central Universities, South-Central Minzu University, China (Grant Number CZZ22002; CZQ22003), and National Statistical Science Research Project, China (Grant Number 2022LY051) for financial support.
Declaration of competing interest
The authors declare that they have no known competing financial interests or personal relationships that could have appeared to influence the work reported in this paper.
References
- Anand, A., Komati, A., Katragunta, K., Shaik, H., Nagendla, N.K., Kuncha, M., Mudiam, M.K.R., Babu, K.S., Tiwari, A.K., 2021. Phytometabolomic analysis of boiled rhizome of Nymphaea nouchali (Burm. f.) using UPLC-Q-TOF-MSE, LC-QqQ-MS & GC-MS and evaluation of antihyperglycemic and antioxidant activities. Food Chem. 16; 342:128313. https://doi.org/10.1016/j.foodchem.2020.128313.
- Chen, J.K., Kuo, C.H., Kuo, W.W., Day, C.H., Wang, T.F., Ho, T.J., Lin, P.Y., Lin, S.Z., Shih, T.C., Shih, C.Y., Huang, C.Y., Lu, C.Y., 2022. Artemisia argyi extract ameliorates IL-17A-induced inflammatory response by regulation of NF-κB and Nrf2 expression in HIG-82 synoviocytes. Environ Toxicol. 2022 Nov;37(11):2793-2803. https://onlinelibrary.wiley.com/doi/10.1002/tox.23637.
- Analysis and evaluation of volatile oil content in leaves of different Artemisia argyi germplasm resources. Zhongguo Zhong Yao Za Zhi. 2021;46(15):3814-3823.
- [CrossRef] [Google Scholar]
- L. Guo D. Zhang L. Wang Z. Xue M. Guo L. Duan Y. Zheng Comparison and Discrimination of Artemisia argyi and Artemisia lavandulifolia by Gas Chromatography-Mass Spectrometry-Based Metabolomic Approach J AOAC Int. 102 6 2019 1814 1821 10.5740/jaoacint.19-0080.
- A new simple and fast approach to analyze chemical composition on white, red, and black ginseng. Food Chem.. 2019;134:185-194.
- [CrossRef] [Google Scholar]
- Quality evaluation and genuine regional analysis on Artemisia Argyi Folium from different places of China and Korean. China J. Trad. Chinese Med. Pharm.. 2019;34(02):553-556.
- [Google Scholar]
- Polyphenol mixture of a native Korean variety of Artemisia argyi H. (Seomae mugwort) and its anti–inflammatory effects. Int. J. Mol. Med.. 2019;44(5):1741-1752.
- [CrossRef] [Google Scholar]
- Li, M., Chai, X., Wang, L., Yang, J., Wang, Y., 2019. Study of the Variation of Phenolic Acid and Flavonoid Content from Fresh Artemisiae argyi Folium to Moxa Wool. Molecules. 16;24(24):4603. https://doi.org/10.3390/molecules24244603.
- Y. Liu Y. He F. Wang R. Xu M. Yang Z. Ci Z. Wu D. Zhang J. Lin From longevity grass to contemporary soft gold: Explore the chemical constituents, pharmacology, and toxicology of Artemisia argyi H.Lév. & vaniot essential oil J Ethnopharmacol. 279 2021 114404 https://doi.org/ 10.1016/j.jep.2021.114404.
- Two new flavonoids from Artemisia argyi with their anticoagulation activities. Nat. Prod. Res.. 2018;32(6):632-639.
- [CrossRef] [Google Scholar]
- An extract of Artemisia argyi leaves rich in organic acids and flavonoids promotes growth in BALB/c mice by regulating intestinal flora. Animals (Basel). 2022;12(12):1519.
- [CrossRef] [Google Scholar]
- Guaianolide Sesquiterpenes with Significant Antiproliferative Activities from the Leaves of Artemisia argyi. Front. Chem.. 2021;24(9):698700
- [CrossRef] [Google Scholar]
- Chlorogenic acid (CGA): A pharmacological review and call for further research. Biomed. Pharmacother.. 2018;97:67-74.
- [CrossRef] [Google Scholar]
- Untargeted metabolomic analysis of Chinese red wines for geographical origin traceability by UPLC-QTOF-MS coupled with chemometrics. Ind. Crop Prod.. 2022;394:133473
- [CrossRef] [Google Scholar]
- Schlaeger, J.M., Stoffel, C.L., Bussell, J.L., Cai, H.Y., Takayama, M., Yajima, H., Takakura, N., 2018. Moxibustion for Cephalic Version of Breech Presentation. J Midwifery Womens Health. 2018 May;63(3):309-322. https://doi.org/10.1111/jmwh.12752.
- Phylogeography of mugwort (Artemisia indica), a native pioneer herb in Japan. J. Heredity. 2013;104(6):830-841.
- [CrossRef] [Google Scholar]
- Identification and determination of phenolic acids and flavonoids in Artemisiae Argyi Folium by UPLC-DAD-MS. Zhongguo Zhong Yao Za Zhi. 2019;44(5):983-989.
- [CrossRef] [Google Scholar]
- Wang, M.H., Xia, Z.Z., Chen, S.H., Chen, C.J., Miao, Y.H., Zhang, J.X., Yu, Z.W., Guo, S.X., Liu, D.H., 2022. Research on industry development status of Qiai. 61(09),105-108. https://doi.org/10.14088/j.cnki.issn0439-8114.2022.09.020.
- Response of volatiles of Artemisiae Argyi Folium to climatic factors. Zhongguo Zhong Yao Za Zhi. 2018;43(15):3163-3170.
- [CrossRef] [Google Scholar]
- X.X. Wang Effects of Different Powder-material Ratios on Sensory Quality of Qingtuan China Food Safety Magazine. https:// 2022 doi.org/10.16043/j.cnki.cfs.2022.25.043.
- Bioactivity-based analysis and chemical characterization of hypoglycemic and antioxidant components from Artemisia argyi. Bioorg. Chem.. 2019;92:103268
- [CrossRef] [Google Scholar]
- Chemical constituents and biological activities of Artemisia argyi H.Lév. & vaniot. Nat. Prod. Res.. 2021;30:1-5.
- [CrossRef] [Google Scholar]
- Analysis of carotenoid content and diversity in apricots (Prunus armeniaca L.) grown in China. Food Chem.. 2020;330:127223
- [CrossRef] [Google Scholar]
Appendix A
Supplementary material
Supplementary data to this article can be found online at https://doi.org/10.1016/j.arabjc.2023.105452.
Appendix A
Supplementary material
The following are the Supplementary data to this article:Supplementary data 1
Supplementary data 1


