

Translate this page into:
A comprehensive strategy combined chemical spectrum with anti-inflammatory activity for screening combinatorial quality markers of Valeriana jatamansi Jones
⁎Corresponding authors at: State Key Laboratory of Component-based Chinese Medicine, Tianjin University of Traditional Chinese Medicine, China. Lijin@tjutcm.edu.cn (Jin Li), Tcmcyx@tjutcm.edu.cn (Yanxu Chang)
-
Received: ,
Accepted: ,
This article was originally published by Elsevier and was migrated to Scientific Scholar after the change of Publisher.
Abstract
Abstract
Valeriana jatamansi Jones (V. jatamansi) is an ethnomedicinal herb widely used worldwide for its excellent anti-inflammatory activity. However, the quality markers that were correlated with the anti-inflammatory activity in V. jatamansi remained unclear. This study aimed to identify combinatorial quality markers based on the anti-inflammatory effects of V. jatamansi for enhancing its quality control. The chemical constituents of V. jatamansi were identify by UPLC-Q-TOF-MS, and 36 compounds were identified. The anti-inflammatory mechanism was predicted by network pharmacology, STAT3 and JAK1 were selected as key targets. The anti-inflammatory activity and predicted targets were validated by using lipopolysaccharide (LPS)-stimulated RAW264.7 cells in vitro. A combination of bivariate correlation analysis (BCA) and grey correlation analysis (GCA) was applied to evaluate the correlation between the chemical spectrum and the anti-inflammatory activities. Hesperidin, acevaltrate and valtrate were screened as potential quality markers. These three compounds exhibited anti-inflammatory effects by inhibiting the production of inflammatory mediators (NO, IL-6, IL-1β and TNF-α) and suppressing the expression of the two key targets (JAK1 and STAT3). The quantitative analysis results showed that the contents of the combinatorial quality markers were positively correlated with the anti-inflammatory activity of V. jatamansi. The contribution rate of the combinatorial quality markers reached 45.0 %. This study provides a comprehensive strategy for the quality control of V. jatamansi based on combinatorial quality markers.
Keywords
Anti-inflammatory
Quality control
Spectrum-effect relationship
Valeriana jatamansi Jones

- BCA
-
bivariate correlation analysis
- CCK8
-
cell counting kit-8
- DMEM
-
dulbecco's modified eagle's medium
- DMSO
-
dimethyl sulfoxide
- EPC
-
edge percolated component
- FBS
-
fetal bovine serum
- GAPDH
-
glyceraldehyde-3-phosphate dehydrogenase
- GC-MS
-
gas chromatography-mass spectrometry
- GRA
-
grey relational analysis
- HPLC
-
high performance liquid chromatography
- JAK1
-
Janus kinase 1
- KEGG
-
kyoto encyclopedia of genes and genomes
- LOQ
-
limits of quantifications
- LPS
-
lipopolysaccharide
- MCC
-
maximal clique centrality
- MNC
-
maximum neighborhood component
- NO
-
nitrogen monoxide
- PPI
-
protein-protein interaction
- PVDF
-
performance of polyvinylidene fluoride
- Q-marker
-
quality marker
- QRT-PCR
-
quantitative real-time polymerase chain reaction
- RSD
-
relative standard deviation
- S/N
-
signal-to-noise
- SDS-PAGE
-
Sodium dodecyl sulfate polyacrylamide gel electrophoresis
- STAT3
-
signal transducer and activator of transcription 3
- TBST
-
tris buffered saline with Tween 20
- TCMs
-
traditional Chinese medicines
- TLC
-
thin-layer chromatography
- TPEB
-
total protein extraction buffer
- UPLC-Q/TOF-MS
-
ultra-high performance liquid chromatography-quadrupole time of flight mass spectrometry
Abbreviations
1 Introduction
Valeriana jatamansi Jones (V. jatamansi) is an ethnomedicinal herb widely used in China. It possessed strong therapeutic potential on gastrointestinal diseases, for example, ulcerative colitis (Wang et al., 2023a), diarrhea (Ma et al., 2022) and irritable bowel syndrome (Yan et al., 2011). The V. jatamansi has been shown to be effective anti-inflammatory by reducing carrageenan induced paw oedema (Subhan et al., 2007), and alleviating dextran sodium sulfate induced ulcerative colitis in mice (Wang et al., 2023a). V. jatamansi contained many chemical compositions, such as iridoids, flavones, phenolic acids and volatile oil (Maurya et al., 2022; Quan et al., 2022). Iridoid is an important class of bioactive compounds in V. jatamansi that inhibit influenza virus, anxiety and inflammation (Shi et al., 2023; Wang et al., 2021). Furthermore, valejatadoid E showed the significant inhibitory effects of NO production at IC50 = 3.99 μM (Liu et al., 2021). Flavones have also been reported to exhibit anti-oxidant, anti-inflammatory and anti-cancer effects (Li et al.; Zhen et al., 2017). In addition, linarin was reported to suppress glioma in vitro and in vivo (Zhen et al., 2017).
The current methods and standards for quality control of V. jatamansi are chemically oriented and various analytical methods have been applied to assess its quality. The total flavone contents were measured by UV spectrophotometry (Li et al., 2008); the hesperidin content was determined by TLC (Li et al., 2018); the volatile oil content was analyzed by GC–MS (Hao et al., 2022); the valtrate, acevaltrate, and baldrinal contents were quantified by HPLC (Di et al., 2007). The quality marker (Q-marker) provides a scientific model for establishing a quality control system for traditional Chinese medicines (TCMs) (Yang et al., 2017). Presently, several screening strategies such as bioactive-chemical quality marker (Zhuang et al., 2023), PK markers (Wang et al., 2023b) and combinatorial quality markers (Zhou, R. et al., 2023), were established to reveal Q-markers in TCMs, which offered new angles and references for the probing Q-markers. Combinatorial markers were able to reveal the synergistic effect of the different quality marker. The current quality control methods for V. jatamansi are based on the quantification of specific compounds, which neglects the evaluation of the activity-related constituents (Li et al., 2014; Shukla et al., 2021). Therefore, a comprehensive strategy for screening combinatorial quality markers with anti-inflammatory activity is a requisite.
Traditional methods for screening bioactive components of TCMs, such as extraction, purification and bioassays are tedious as well as inefficient. Spectrum-effect relationship has been used to identify active components by correlating the chemical fingerprint and the biopotency of the components using chemometric methods (An et al., 2022). UPLC-Q-TOF-MS, a fast, strong separation ability and high mass accuracy analysis technology, can be employed to identify chemical components of TCMs (Lv et al., 2023; Wang et al., 2023c). Chemometrics revealed the intrinsic connection between chemical composition and biological activity more scientifically and effectively by applying mathematical strategies and statistical methods, such as bivariate correlation analysis (BCA) and grey correlation analysis (GCA). (Du et al., 2022; Han et al., 2022; Liu et al., 2022). The network pharmacology is a comprehensive method to predict the action mechanism of complex TCMs, which needed pharmacological experiments to validate its predictions (Zong et al., 2023).
A comprehensive strategy has been proposed for the discovery of combinatorial quality markers of TCMs with anti-inflammatory activity. Chemical components were rapidly identified by UPLC-Q-TOF-MS, and the targets-pathways of the identified constituents alongside anti-inflammatory activity were predicted by network pharmacology. The potential activity markers were screened by BCA and GCA methods to correlate chemical fingerprints and anti-inflammatory activities. Then, the anti-inflammatory activities and the key targets for quality markers were further confirmed and validated. Conclusively, the contribution of the combinatorial quality markers to NO inhibition rate in V. jatamansi was evaluated. This strategy incorporates multiple approaches to enhance the correlation of chemical compounds with the bioactivity; and its contribution to discover the valid and reliable combinatorial quality markers. This comprehensive strategy successfully screen the combinatorial quality markers which was meaningful to improve the quality control of V. jatamansi and its clinical applications.
2 Materials and methods
2.1 Materials and chemicals
Acevaltrate, valtrate, and hesperidin, neochlorogenic acid, isochlorogenic acid B, linarin, baldrinal with 98 % purity were supplied by Chengdu Despite Bio Technology (Chengdu, Sichuan, China). HPLC grades of acetonitrile and methanol were supplied by Concord (Tianjin, China). Macrophage RAW264.7 cell was supplied by the Cell Bank of the Chinese Academy of Sciences (Shanghai, China). DMEM medium and fetal bovine serum were supplied by Zhongaobio (Tianjin, China). CCK-8 kit and NO kit were supplied by Beyotime (Shanghai, China). LPS was supplied by Sigma-Aldrich (St. Louis, MO, USA). TransZol Up Plus RNA Kit were supplied by transgen (Beijing, China). Antibodies of JAK1 and STAT3 were supplied by Cell Signaling Technologies (Danvers, MA, United States). Antibodies of β-actin were obtained from Abclonal (Wuhan, China).
A total of 24 samples of roots and rhizomes of V. jatamansi were collected from pharmacies in different regions. The cultivation area, harvesting time and source were shown in Table S1 in the Supplementary Material. They were identified by Prof. Yanxu Chang (Tianjin University of Traditional Chinese Medicine). V. jatamansi roots and rhizomes were ground using a grinder and sieved through 50 mesh to obtain V. jatamansi dried powder.
2.2 Preparation of sample solutions and standard solutions
The sample solution preparation method was adopted from previous studies (Wang et al., 2023a) 1.0 g of dried powder was accurately suspended in 20 mL methanol. The mixture was ultrasonic extracted for 30 min in water bath. The sample solution was centrifuged at 7000 rpm for 10 min. The supernatant was dried at stable nitrogen and rediscovered with 10 mL water. Afterwards, 10 mL ethyl acetate was added into the extraction and vortexed for 1 min. The ethyl acetate was dried and redissolved by 10 mL methanol. The sample solutions were stored at −20 °C until use. The ethyl acetate was dried and redissolved by 10 mL methanol for UPLC-Q-TOF-MS and HPLC analysis. The ethyl acetate was dried and redissolved by 1 mL DMSO for cell treated.
Appropriate acevaltrate, valtrate, hesperidin, neochlorogenic acid, isochlorogenic acid B, linarin, baldrinal were dissolved in methanol to prepare a standard solution of 1.00 mg/mL. All standard solutions were stored at −20 °C until use.
2.3 UHPLC-Q-TOF-MS conditions
The compound characterization of the medicinal material samples was collected at 1290 UHPLC system tandem 6520 Q-TOF system (Agilent, Santa Clara, CA, USA). Dubhe C18 (4.6 × 250 mm, 5 μm) column was used for gradient elution program. The mobile phase was consisted of acetonitrile (A) and water (B) with a gradient elution program: 0 ∼ 5 min, 5 % ∼ 23 % A; 5 ∼ 10 min, 23 % ∼ 27 % A; 10 ∼ 15 min, 27 % A; 15 ∼ 16 min, 27 %∼30 % A; 16 ∼ 24 min, 30 %∼30 % A; 24 ∼ 25 min, 30 % ∼ 51 % A; 25 ∼ 62 min, 51 % ∼ 52 % A; 62 ∼ 63 min, 52 % ∼ 65 % A; 63 ∼ 76 min, 65 % ∼ 65 % A; 76 ∼ 77 min, 65 % ∼ 70 % A; 77 ∼ 82 min, 70 % ∼ 70 % A. The column temperature was set as 30 °C, the flow rate was set as 1 mL/min, and the injection volume was set as 10 μL. The MS parameters in positive ionization mode were as follows: capillary voltage, 3000 V; collision energy (CE), 20 V; gas temperature, 350 °C; detection range, m/z 50–1700.
2.4 Network pharmacology analysis
2.4.1 Collection of inflammatory and V. Jatamansi related-targets
SwissTargetPrediction database (http://www.swisstargetprediction.ch/), TCMSP database (https://old.tcmsp-.com/tcmsp.php), TCMIP database (http://www.tcmip.cn/ETCM/index.php/Home/Index/index.html), Bionet database (https://bionet.ncpsb.org.cn/batman-tcm/) was used to predict the targets of compounds of V. jatamansi. GeneCards (https://www.genecards.org/) databases were searched for “inflammatory”. V. jatamansi predicted targets in common with inflammatory targets as potential targets.
2.4.2 Protein-protein interaction (PPI) analysis
The potential targets were imported into the online mapping platform (https://www.bioinformatics.com.cn/) to construct Venn diagrams. The intersection targets were uploaded to the STRING 11.5 platform (https://strin g-db.org/). Select the organism as Homo sapiens. The minimum score for interaction is 0.9.
The topological properties of the PPI network were analyzed using the CytoHubba plug in Cytoscape 3.7.2. CytoHubba analysis including degree, edge percolated component (EPC), maximal clique centrality (MCC), maximum neighborhood component (MNC) calculations.
2.4.3 Pathway analysis
The pathways of the potential targets were enriched and analyzed by the DAVID database (https://david.ncifcrf.gov/tools.jsp). The species was set as Homo sapiens. Signaling pathways were analyzed using Kyoto Encyclopedia of Genomes (KEGG) (p < 0.01). Enrichment dot bubble was plotted by https://www.bioinformatics.com.cn.
2.5 HPLC analysis
2.5.1 HPLC-DAD condition
HPLC analysis was performed on a Thermo Scientific™ Dionex™ UltiMate™ 3000 system (Thermo Fisher Scientific, Bremen, Germany). The chromatographic column, gradient elution program, flow rate and temperature conditions were same with 2.4. The detection wavelength was at 254 nm. The injection volume was set as 10 μL.
2.5.2 Method validation
Precision was verified by evaluating the same sample solution for six consecutive injections. Repeatability was evaluated by six sample solution. The stability of the same samples (0, 2, 4, 6, 8, 10, 12, 17, 19, 21, 24, 24 h) was analyzed by the above method. Relative standard deviation (RSD) was used to calculate the area of each characteristic peak with relative accuracy.
2.5.3 Establishment of fingerprints
The chromatographic fingerprints of 24 batches of V. jatamansi were imported into the Similarity Evaluation System (Version 2012A; Beijing, China) according to the literature (Li et al., 2021).
2.5.4 Quantitative analysis of bioactivity markers
The three markers quantification was conducted by a HPLC System. The chromatographic conditions were the same as in 2.5.1. The linearity, limit of quantitation, repeatability, precision, stability and recovery of the method were verified. The linearity of the method was calculated by plotting the peak area (y) against the concentration (x, μg /mL). The LOD (S/N = 3) and LOQ (S/N = 10) were calculated by the concentration of the mixed standard.
2.6 Cell viability assay
The cytotoxicity of different concentrations of sample solution was detected by CCK-8 method (Zhou, S. et al., 2023). RAW264.7 cells (2 × 10⁵ per well) were inoculated in 96-well microplates. After the cells adhered, the sample solution was intervened. After 24 h incubation at 37 °C in a 5 % CO2 incubator, 10 μL CCK-8 was added to each well and incubated in an incubator at 37 °C for 0.5 h. The absorbance (A450) was measured by microplate reader.
2.7 Nitric oxide assay
RAW264.7 cells (2 × 10⁵ per well) were cultured in 96-well microplates. After the cells adhered, the cells were treated with different concentrations of sample solution and 1 μg/mL LPS for 24 h. The model group was treated with equal volume of DMSO and LPS, and the control group was treated with equal volume of complete medium. According to the instructions, the NO concentration in the supernatant was analyzed by NO kit.
2.8 Quantitative real-time polymerase chain reaction (qRT-PCR) assay
Total RNA was extracted from each group of cells using a Trizol reagent. Total RNA was reverse transcribed into cDNA and then amplified by qRT-PCR. GAPDH was used as the internal reference gene to calculate the relative expression of the target gene. Primer sequences are shown in Table S2.
2.9 Western blotting assay
Cells were lysed by total protein extraction buffer with protease inhibitor. After incubation on ice for 30 min, the supernatant was centrifuged at 14,000 × g, 4 °C and 10 min. The proteins were separated by 10 % SDS-PAGE electrophoresis at constant voltage. Then, the proteins were transferred to PVDF membranes at a constant current. The PVDF membranes were treated with blocking buffer (5 % skim milk dissolved in TBST buffer) for 3 h at room temperature, and incubated with the relevant primary antibodies (JAK1, STAT3, β-actin) overnight at 4 °C. Afterwards, the PVDF membranes were incubated with secondary antibody for 2 h at room temperature.
2.10 Spectrum-effect relationship analysis
The spectrum-effect relationship between anti-inflammatory (NO Inhibition rate) and peak area of chromatography was established by gray relational analysis and bivariate correlation analysis.
2.10.1 Gray relational analysis (GRA)
The grey correlation theory was used to calculate the grey correlation coefficient and rank of each common peak of 24 samples. The specific operation was to use the IC50 value as the reference sequence and the peak area of the 17 common peaks as the comparison sequence.
2.10.2 Bivariate correlation analysis (BCA)
The Pearson model was used for bivariate correlation analysis (BCA) analysis. The independent variable was the common peak area, and the dependent variable was the IC50 value of the anti-inflammatory activity.
2.11 In silico ADME prediction
The physicochemical properties and pharmacokinetic profile of acevaltrate and valtrate were predicted by SwissADME tool (http://www.swissadme.ch/) (Daina et al., 2017).
2.12 Statistical analysis
All biological activity-related data were analyzed using Graph Pad Prism 8.0 software (Graph Pad Software, CA) and presented as the mean ±SD. Western blot densitometric analysis using ImageJ. One-way analysis of variance was carried out for multiple comparisons of the data with statistical significance set at P < 0.05. All relational analyses were performed using SPSS (version 26.0, IBM, USA).
3 Results
3.1 Identification of the chemical components
To identify possible combinatorial quality markers for anti-inflammatory effect, the basic chemical constituents of V. jatamansi were investigated. The total ion chromatogram of samples in positive ion mode was shown in Fig. 1A. 36 chemical components were identified (Table 1), including 32 iridoids, 2 flavones (P7, P8), 2 phenolic acids (P2, P6). For iridoids, the structure of the parent nucleus was mainly cyclopentane-[C]-pyran, which could be divided into three main types according to the number of double bonds, including monoene-type iridoids (P5, P12, P14, P17, P18, P20, P25-P27, P33, P35), diene-type iridoids (P13, P15, P16, P19, P21-P24, P28, P29, P32, P34, P36) and tetraterpene-type iridoids (P4, P9, P30). The structures of the compounds are shown in Fig. 1B. The chromatograms, mass spectra and mass fragmentation pathways of the standard compounds are shown in the supplementary material. ∗: comparing with the reference standards.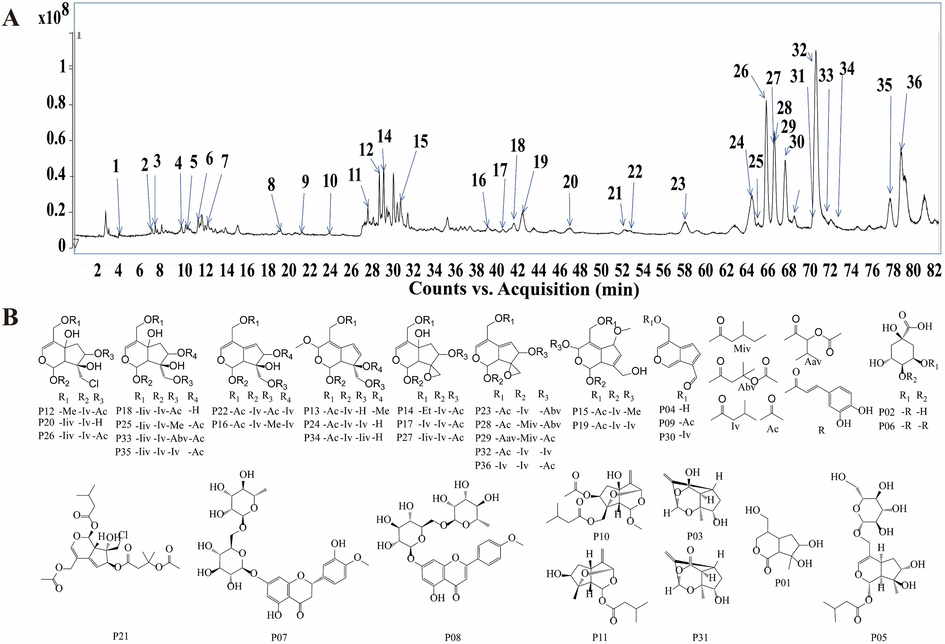
Identification of the chemical composition. (A) Total ion chromatogram of samples analysed by UPLC-QTOF-MS in positive ion mode. (B) Structures of the compounds from V. jatamansi samples.
Peaks
TR(min)
Molecular formula
Massnumber
Calculated mass(m/z)
Observed mass(m/z)
Ion Mode
Error (ppm)
ESI-MS/MS data
Peak identification
P01
4.516
C10H16O5
216.0998
217.1071
217.1064
[M + H] +
3.01
135.0805, 109.0638, 153.0902
Longiflorone
P02
7.335
C16H18O9
354.0951
355.1024
355.1026
[M + H] +
−0.68
193.0696, 181.0482, 163.0393
Neochlorogenic acid*
P03
7.604
C10H14O4
198.0892
199.0965
199.0967
[M + H] +
−1.08
177.07, 135.0796, 107.0855, 105.0697
JatamaninD
P04
10.289
C10H8O3
176.0473
177.0546
177.0551
[M + H] +
−2.72
159.0435, 148.0509, 121.061, 116.9301
Desacylbaldrinal
P05
10.910
C21H34O11
462.2101
485.1993
485.1997
[M + Na] +
−379
383.1303, 305.1341, 203.0609, 163.0747
Valerosidate
P06
11.430
C25H24O12
516.1268
517.1341
517.1346
[M + H] +
−1.06
499.1148, 355.1087, 337.0914, 319.0813, 163.0356
Isochlorogenic acid B*
P07
12.974
C28H34O15
610.1898
611.1970
611.1997
[M + H] +
0.08
465.1375, 303.0850
Hesperidin*
P08
20.023
C28H32O14
592.1792
593.1865
593.1892
[M + H] +
−0.03
447.1311,285.0770
Linarin*
P09
21.811
C12H10O4
218.0579
219.0652
219.0658
[M + H] +
−4.19
177.0550, 159.0431, 131.0480
Baldrinal*
P10
25.142
C18H26O8
370.1628
393.1520
393.1526
[M + Na] +
−1.65
260.1025, 177.0504
JatamaninU
P11
28.431
C15H22O5
282.1467
283.1540
283.1542
[M+H] +
−0.71
181.0865, 164.0775, 101.0668
RupesinE
P12
29.153
C18H27ClO8
406.1416
429.1287
429.1290
[M+Na] +
4.58
295.0349, 267.0327, 249.0299, 227.0487, 217.0456
ChlorovaltrateH
P13
29.757
C19H28O8
384.1784
407.1676
407.1698
[M+Na] +
−5.63
223.0965, 193.0861, 191.0703, 163.0751
Jatamanvaltrate N
P14
30.697
C19H28O8
384.1806
407.1676
407.1698
[M+Na] +
−5.63
245.0787, 224.1043, 193.0860
Jatamanvaltrate M
P15
31.385
C19H28O8
384.1784
407.1676
407.1698
[M+Na] +
−5.63
245.0825, 223.0978, 191.0712, 159.0442
JatairidoidA/Jatairidoid B
P16
39.424
C23H34O9
454.2203
477.2095
477.2115
[M+Na] +
−4.39
273.0741, 219.0627, 213.0535, 191.0713, 159.0463
ValeriandoidF
P17
40.851
C22H32O9
440.2046
463.1939
463.1964
[M+Na] +
−5.72
237.0784, 219.0639, 199.0362, 177.0580, 159.0429
5-Hydroxydidrovaltrate
P18
42.193
C27H42O12
558.2676
581.2568
581.2596
[M+Na] +
−4.93
480.1877, 463.1838
ValeriotriateB
P19
43.587
C23H34O9
454.2203
477.2095
477.2115
[M+Na] +
−4.39
375.1442, 293.1403, 273.0735, 261.1107, 251.0927, 159.0412
Jatadoid A
P20
47.373
C25H39ClO10
534.2232
552.2570
552.2574
[M+NH4]+
−0.01
457.1331, 357.0883, 273.0263
ChlorovaltrateE
P21
52.261
C24H33ClO10
516.1762
534.2101
534.2109
[M+NH4]+
0.09
277.0232
ChlorovaltrateM
P22
53.453
C24H34O10
482.2152
500.2490
500.2423
[M+NH4]+
−4.11
321.1392, 301.0737, 279.0839, 219.0674, 177.0539
10-Acetoxyvaltrathydrin
P23
58.738
C24H32O10
480.1995
503.1888
503.1884
[M+Na] +
0.77
503.1884, 321.1226, 219.0634, 159.0421
Acevaltrate*
P24
65.050
C23H34O9
454.22.03
472.2541
477.2561
[M+NH4]+
−4.39
273.0741, 251.0916, 219.0627, 201.0598, 159.0463
ValejatadoidE
P25
65.798
C28H44O12
572.2833
595.2725
595.2740
[M+Na] +
−2.62
494.2079, 293.0902
JatamanvaltrateE
P26
66.805
C27H41ClO11
576.2337
599.2230
599.2208
[M+Na] +
−5.1
498.162, 398.1055
VolvaltrateB
P27
67.187
C27H40O11
540.2571
558.2909
558.2895
[M+Na] +
−5.4
301.1017, 159.0462, 121.0607
IVHD-Valtrate
P28
67.900
C25H34O10
494.2152
517.2044
517.2065
[M+Na] +
−4.21
237.0679, 219.0653, 177.0504, 159.0449
1-Homoacevaltrate
P29
68.811
C25H34O10
494.2152
517.2044
517.2065
[M+Na] +
−4.21
297.1112, 219.0679, 159.0471
1-Homoisoacevaltrate
P30
69.002
C15H16O4
260.1649
261.1121
261.1136
[M+H] +
−5.63
159.0439, 131.0419, 101.062
Homobaldrinal
P31
70.831
C10H12O4
196.0736
219.0628
219.0614
[M+Na] +
7.04
159.0438, 131.0489, 121.0643
JatamaninB
P32
71.163
C22H30O8
422.1941
445.1833
445.1821
[M+Na] +
3.29
445.1819, 321.1324, 219.0640
Valtrate*
P33
72.643
C34H52O15
700.3331
723.3198
723.3240
[M+Na] +
−5.95
521.1982, 461.174, 419.1298, 133.0875
JatamanvaltrateA
P34
73.649
C28H42O11
554.2727
572.3065
572.3051
[M+NH4] +
2.59
462.1805,375.1431,339.12,260.0615
JatamanvaltrateO
P35
78.749
C32H50O13
642.3251
665.3144
665.3180
[M+Na] +
−5.66
464.1980,363.1321,339.1527
JatamanvaltrateB
P36
79.224
C22H30O8
422.1941
423.2013
423.2036
[M+H] +
−5.34
219.0651,177.0548,159.0427,149.0594
Isovaltrate
3.2 Network pharmacology analysis
3.2.1 PPI network construction analysis
A total of 36 compounds identified from V. jatamans and out of which 6 compounds could not be assessed from their targets database. 426 cross-targets that were obtained from 478 targets of 30 compounds and 13,697 anti-inflammation targets (Fig. 2A). The PPI network was constructed by uploading 426 targets to the string platform (Fig. 2B), which was then imported into cytoscape for further visualization. The degree value represents the number of connections of a node, it indicates the importance of a node in the network. The higher degree of nodes connected implies higher centrality and influence of a node. A total of 28 targets were considered potential targets with degree > 20 (Fig. 2D). In addition, the key targets were screened from the intersection of the top 20 targets of the four parameters, which are EPC, MCC, MNC and degree parameters in cytoHubba plug (Fig. 2C) as well as 13 key targets were identified from 28 targets based on EPC, MCC and MNC parameters (Table S3 in Supplementary materials). The results showed that 13 key targets screened from 28 potential targets were key targets for the anti-inflammatory activity of V. jatamansi, including STAT3, LCK, EGFR, JAK2, PTK2, PIK3CA, MAPK1, FYN, JAK1, MAPK14, PIK3R1, SRC, and HRAS (Fig. 2D).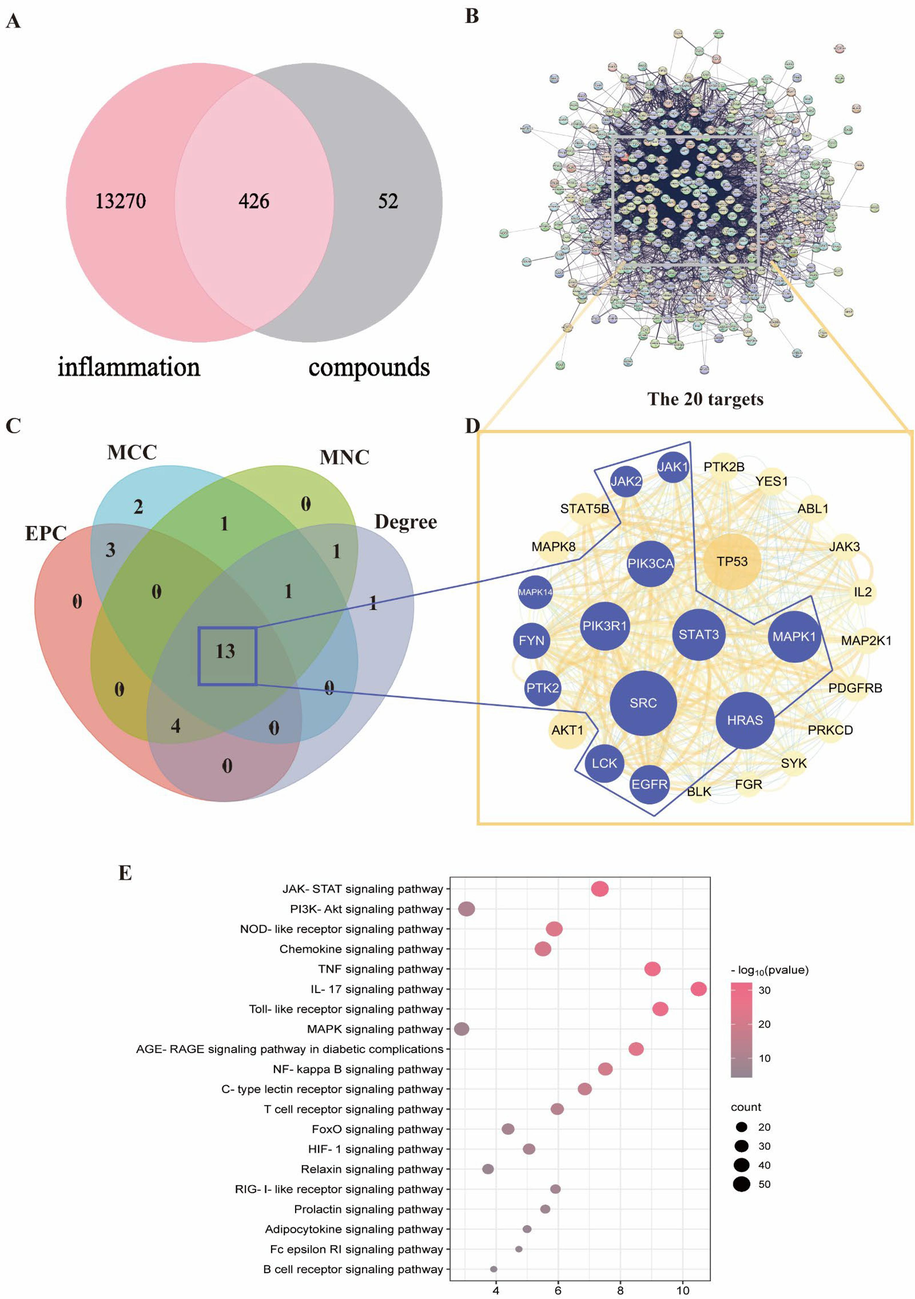
Network pharmacology analysis. (A) Veen diagram. (B) PPI network. (C) Four parameters (degree, EPC, MCC, MNC) were used to calculate the intersection analysis of the top 20 targets (D) Core target network. The size of a node in the network indicates how important the node is in the network. The yellow circles refer to the potential targets (degree>20), and the purple circles refer to the core targets (four parameter intersection targets). (E) KEGG pathway enrichment analysis.
3.2.2 Pathway enrichment analysis
To further explore the anti-inflammatory mechanisms of V. jatamansi, KEGG enrichment analysis of the potential targets were performed using the DAVID database. Based on “P<0.01”and “signaling pathway”, the top 20 pathways were screened (Fig. 2E). The name of the signaling pathway is displayed on the Y-axis, while the enrichment factor is displayed on the X-axis. The number of genes in each pathway is proportional to the bubble size, and the bubble color reflects how significant the gene enrichment in that pathway is. The results suggested that V. jatamansi may exert anti-inflammatory activity by modulating JAK-STAT signaling pathway, PI3K-Akt signaling pathway, NOD-like receptor signaling pathway, Chemokine signaling pathway, TNF signaling pathway, IL-17 signaling pathway, etc.
3.3 Inflammation inhibitory activity of V. Jatamansi
3.3.1 Cell cytotoxicity analysis
The cytotoxicity of V. jatamansi extract on RAW264.7 cells was measured by the CCK-8 assay (Fig. 3A). It showed that the cell survival rate was reduced significantly by higher concentrations of the extract, and the concentrations below 50 μg/mL had no cytotoxic effect.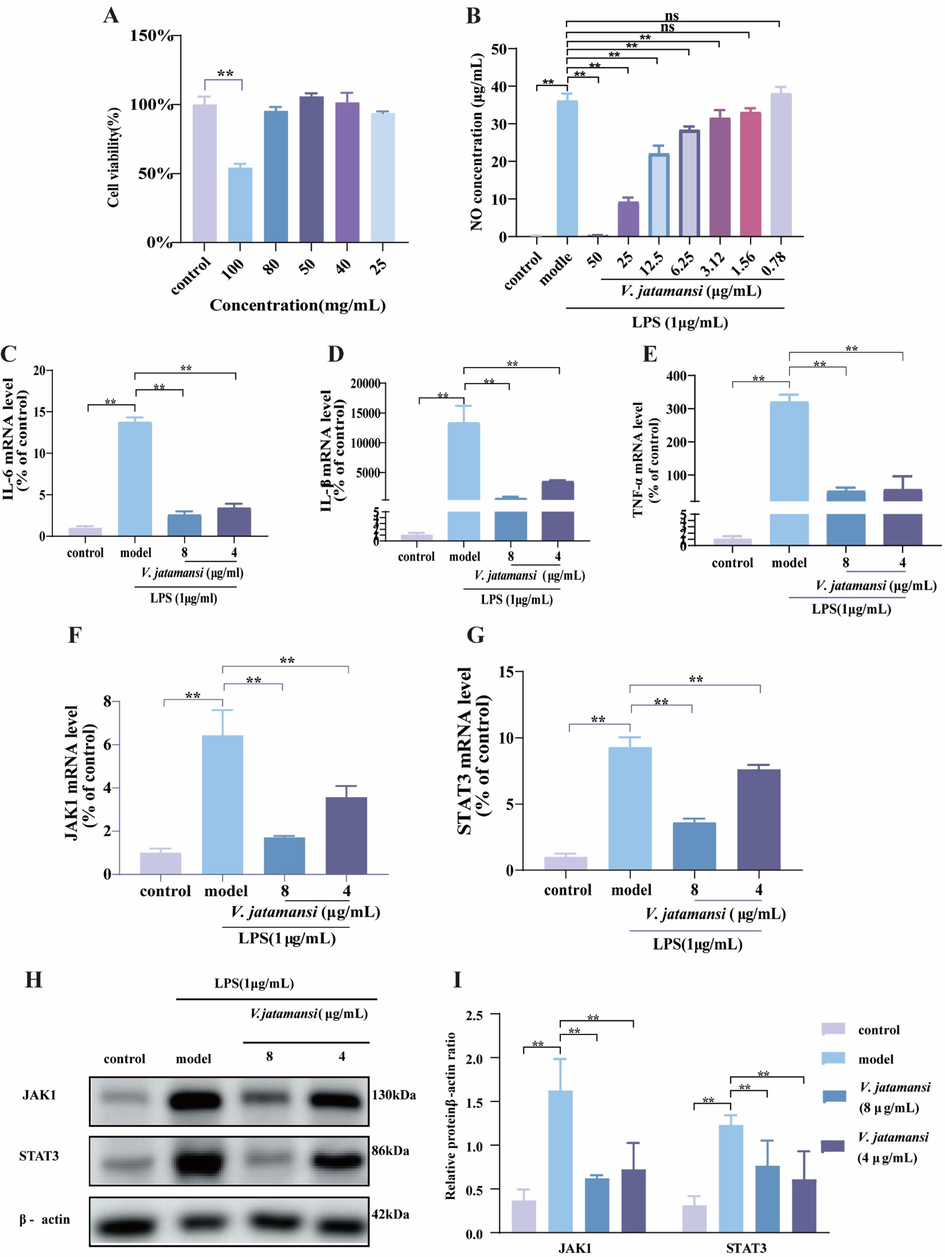
Anti-inflammatory effects of V. jatamansi against RAW264.7 cells. (A) RAW264.6 cells were treated with different concentrations of V. jatamansi for up to 24 h to examine the cell viability. (B) NO concentration in cell supernatant. (C-G) The mRNA levels of IL-6, IL-1β, TNF-α, JAK1, STAT3 in cells. (H-I) The protein expression of JAK1, STAT3 in cells; (H)Western blot image and (I) densitometric analysis. Data are shown as mean ± SD. *p < 0.05, **p < 0.01 and ns, no significant.
3.3.2 Anti-inflammatory effects of V. Jatamansi in vitro
To induce an inflammation model in macrophages, 1 μg/mL LPS was stimulated for 24 h (Cho et al., 2023). The nitric oxide (NO) levels were measured in the cell supernatant using Griess reagents. The results showed that LPS significantly enhanced the NO production (P < 0.01), indicating that the inflammation model was successfully established. In parallel, V. jatamansi (0.78 ∼ 50 μg/mL) decreased the level of NO production on LPS-induced RAW264.7 cells in a dose-dependent manner (Fig. 3B). In inflammatory diseases, pro-inflammatory factors were elevated, including IL-6, IL-1β, TNF-α (Jing et al., 2021). The mRNA expression of IL-6, IL-1β and TNF-α was examined. It was shown that the mRNA levels of IL-6, IL-1β and TNF-α were significantly increased by LPS than control group (P < 0.01), while V. jatamansi treatment significantly reversed the elevated expression levels caused by LPS. (P < 0.05) (Fig. 3C-E). This indicated that V. jatamansi extracts have good anti-inflammatory activity in our experiment.
3.3.3 V. Jatamansi regulate key targets in vitro
The anti-inflammatory activity of V. jatamansi may involve the JAK-STAT signaling pathway, according to the KEGG pathway enrichment analysis results. To measure the mRNA and protein levels of JAK1 and STAT3, two key targets of this pathway, qRT-PCR and western blotting analysis were performed. It was found that LPS-treated RAW264.7 cells had higher JAK1 and STAT3 expression than control group (P < 0.01). V. jatamansi reduced JAK1 and STAT3 expression compared with the model group (P < 0.05) (Fig. 3F-I). These results indicate that V. jatamansi may have anti-inflammatory activity by modulating JAK1 and STAT3 mRNA and protein expression.
3.4 Spectrum-effect relationship results
3.4.1 Similarity analysis
The HPLC fingerprint chromatogram similarity analysis was used to analyze the variability among different batches. Firstly, good precision and reproducibility of the HPLC instrument and stability of the sample solution within 24 h were shown by the method validation results (Table S5 in Supplementary materials). The fingerprint method was suitable for fingerprint analysis.
Then, the fingerprint chromatograms of different batches were established (Fig. 4). The common peaks with relatively high intensity that appeared in each sample were selected as the characteristic peaks of V. jatamansi. The 17 characteristic peaks were determined by peak alignment. The similarity values among the 24 batches varied from 0.705 to 0.997, suggesting that their chemical characteristics were highly similar and chemical fingerprints alone were insufficient to differentiate the quality (Table S6 in Supplementary materials).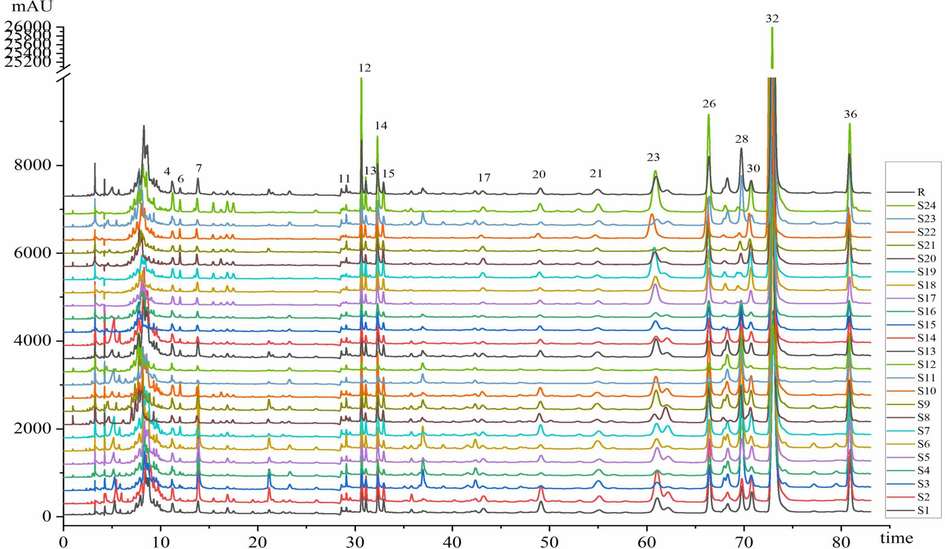
HPLC fingerprints of 24 batches of V. jatamansi extracts.
3.4.2 NO inhibitory activity of V. Jatamansi
NO inhibition rate and IC50 value were used to evaluate the anti-inflammatory activity of 24 batches of V. jatamansi. Celecoxib has the effect of inhibiting NO as a reference for this experiment (Bekkouch et al., 2023; Cui et al., 2023). In this work, 24 batches of V. jatamansi extracts showed good inhibition of NO production (IC50 = 5.57–60.19 μg/mL) (Table 2). Surprisingly, S18, S20-S22, S24 batches showed excellent inhibition (IC50 = 5.57–7.625 μg/mL) than the positive control celecoxib (IC50 = 20.9 μM = 7.97 μg/mL). The value of IC50 indicating that there were significant differences in activity among different batches.
Sample
IC50 (μg/mL)
Sample
IC50 (μg/mL)
S1
30.82
S14
40.33
S2
26.79
S15
15.92
S3
17.88
S16
11.70
S4
32.29
S17
48.13
S5
25.23
S18
7.625
S6
60.19
S19
8.686
S7
20.51
S20
7.321
S8
22.60
S21
6.888
S9
27.24
S22
7.226
S10
13.24
S23
24.32
S11
12.94
S24
5.572
S12
43.89
celecoxib
20.90 (μM)
S13
43.33
3.4.3 Bivariate correlation analysis
The area of 17 common peaks and the IC50 value of the anti-inflammatory activity were analyzed by BCA to determine their correlation degree and direction. The Pearson’s model correlation coefficient showed that 13 common peaks had a negative correlation with the IC50 value, indicating that the 13 common peaks may possess anti-inflammatory activity. As shown in Table 3, among 9 common peaks, P6, P7, P12, P14, P17, P23, P26, P30 and P32 were showed significant correlation between peaks area and IC50 value (P<0.05), suggesting that 9 compounds may have anti-inflammatory activity.
Peaks
Case
GRA
BCA
Correlations
Rank
Correlations
Significantly
P04
24
0.811
10
−0.383
0.065
P06
24
0.855
1
−0.524
0.009
P07
24
0.726
16
−0.475
0.019
P11
24
0.761
13
0.029
0.893
P12
24
0.838
3
−0.602
0.002
P13
24
0.824
7
−0.382
0.065
P14
24
0.847
2
−0.649
0.001
P15
24
0.753
14
0.008
0.970
P17
24
0.812
9
−0.554
0.005
P20
24
0.769
12
−0.095
0.659
P21
24
0.750
15
0.058
0.788
P23
24
0.832
5
−0.510
0.011
P26
24
0.833
4
−0.549
0.005
P28
24
0.688
17
0.349
0.095
P30
24
0.830
6
−0.537
0.007
P32
24
0.823
8
−0.473
0.020
P36
24
0.771
11
−0.055
0.798
3.4.4 Grey relational analysis
To screen the potential anti-inflammatory components, the spectrum-effect relationship between IC50 and the area value of 17 common peaks were studied by the GRA method. As can be seen from Table 3, the correlation values between 17 common peaks and inhibition of NO production were 0.6883 ∼ 0.8549. The results indicated that 16 common peaks may be highly correlated with anti-inflammatory activity (with GRA>0.7). To prevent bias caused by a single screening method, we combined the methods of GRA and BCA in a comprehensive analysis, and the results showed that P6, P7, P12, P14, P17, P23, P26, P30 and P32 were considered as potentially bioactive compounds with anti-inflammatory activity.
Based on principle of measurability, easily acquired standard and specificity, we predict that P6 (isochlorogenic acid B), P7 (hesperidin), P23 (acevaltrate) and P32 (valtrate) may be potential combinatorial quality markers for the anti-inflammatory activity of V. jatamansi.
3.5 The verification of the combinatorial quality markers
3.5.1 In silico ADME prediction
The pharmacokinetic parameters of the potential combinatorial quality markers were investigated to assess their bioavailability and absorption. Previous studies showed that hesperidin has good absorption properties in vivo (Li et al., 2023), but acevaltrate and valtrate have not been reported. The pharmacokinetic and physicochemical parameters of acevaltrate and valtrate were predicted using SwissADME website. The prediction results indicated that both compounds had favorable lipophilicity (WLogP = 2.35, 2.66) and water solubility (class: soluble) (Table S7 in Supplementary materials). According to different reporting filters provided, acevaltrate complied with the Lipinski, Egan and Muegge rules, while valtrate satisfied the Lipinski, Veber, Egan, and Muegge rules. The abbott bioavailability score for both compounds were 0.55, suggesting moderate bioavailability. Both compounds also exhibited high gastrointestinal absorption properties and good central nervous system safety profiles (no BBB permeability). Moreover, neither compound was predicted to be a substrate for CYP1A2, CYP2C19, CYP2C9 and CYP3A4, which could reduce the possibility of drug-drug interactions. The potential combinatorial quality markers exhibited favorable pharmacokinetic properties.
3.5.2 Anti-inflammatory effects of potential quality markers in vitro
CCK-8 assay was used to detect the cytotoxic effects of potential quality markers at different concentrations on RAW264.7 (Fig. 5A-C; Fig. S4 in Supplementary materials). The cell viability of 800 μM isochlorogenic acid B, 300 μM hesperidin, 6 μM valtrate, and 6 μM acevaltrate were used as experimental concentrations for subsequent experiments. NO, IL-6, IL-1β, and TNF-α are important inflammatory mediators involved in the inflammatory response. Firstly, the IC50 of hesperidin, acevaltrate, and valtrate were, 131.6 μM, 4.33 μM, and 2.58 μM, respectively (Fig. 5D-F). Unfortunately, isochlorogenic acid B with weak inhibition of NO production (IC50 = 637.9 μM) (Fig. S4 in Supplementary materials). A compound is considered weakly activity if its IC50 value is more than an order of magnitude higher than that of a positive control. Thus, isochlorogenic acid B was excluded as a quality marker. Subsequently, the mRNA expression of IL-6, IL-1β and TNF-α were decreased in three compounds treated with model group (P < 0.05) (Fig. 5G-O). In conclusion, these compounds may exert anti-inflammatory effects in LPS-stimulated macrophages by inhibiting NO, IL-6, IL-1β and TNF-α.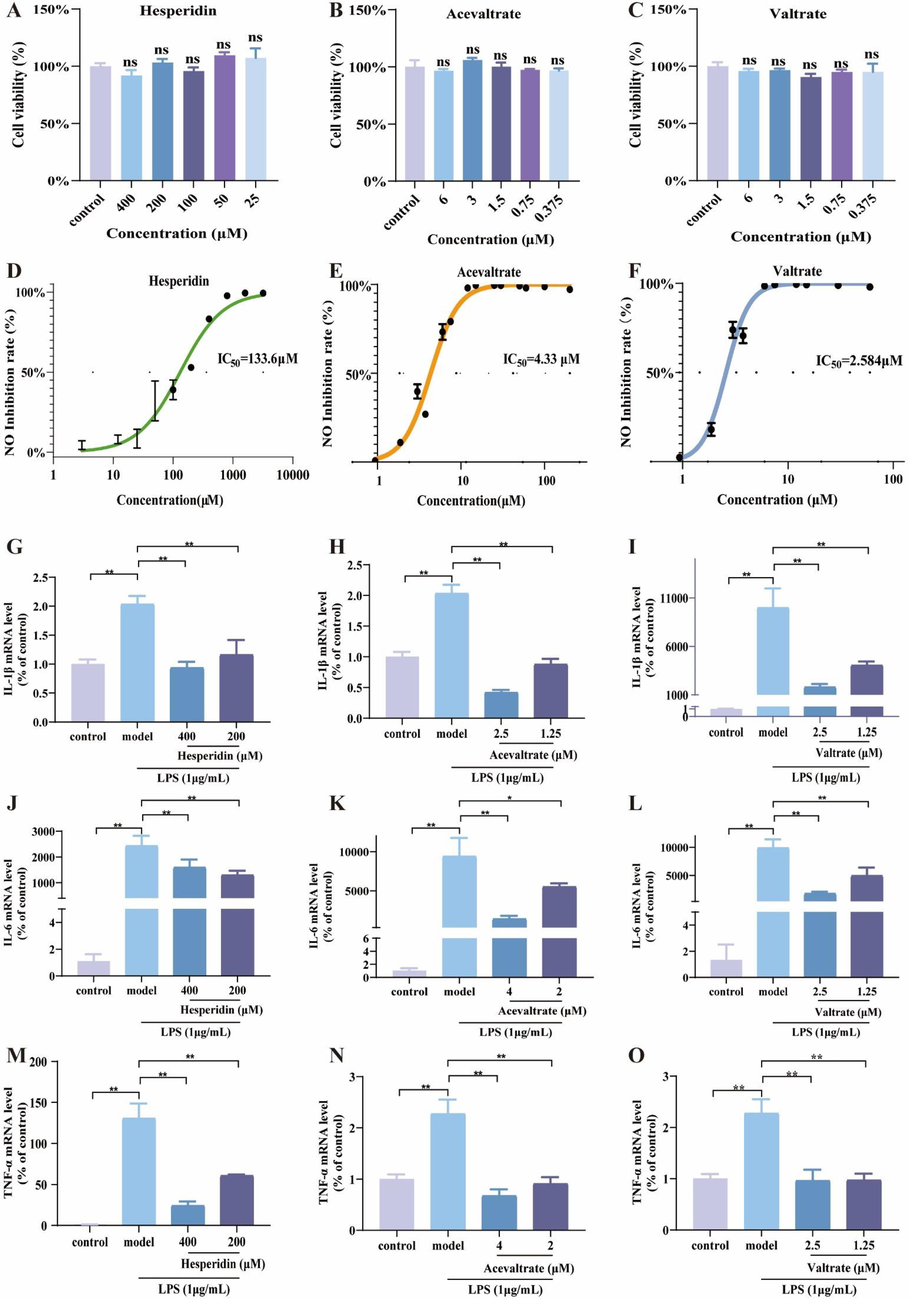
Anti-inflammatory effects of potential quality markers on RAW264.7 cells. (A-C) Cell viability of hesperidin, valtrate and acevaltrate. (D-F) NO concentration in cell supernatant. (G-O) The mRNA levels of IL-6, IL-1β and TNF-α in cells. Data are shown as mean ± SD. *p < 0.05, **p < 0.01 and ns, no significant.
3.5.3 Potential quality markers regulate key targets
Under inflammatory conditions, the inhibitory effects of the three compounds on JAK1 and STAT3 expression were equally intriguing. Surprisingly, compared with the model group, the three compounds were able to significantly reduce the mRNA level of JAK1 and STAT3 (P<0.05) (Fig. 6A-F), and also significantly reduce the protein expression levels of JAK1 and STAT3 (P<0.05) (Fig. 6G-L). It was further confirmed that the three compounds (hesperidin, acevaltrate and valtrate) were shown to modulate the same anti-inflammatory targets as V. jatamansi.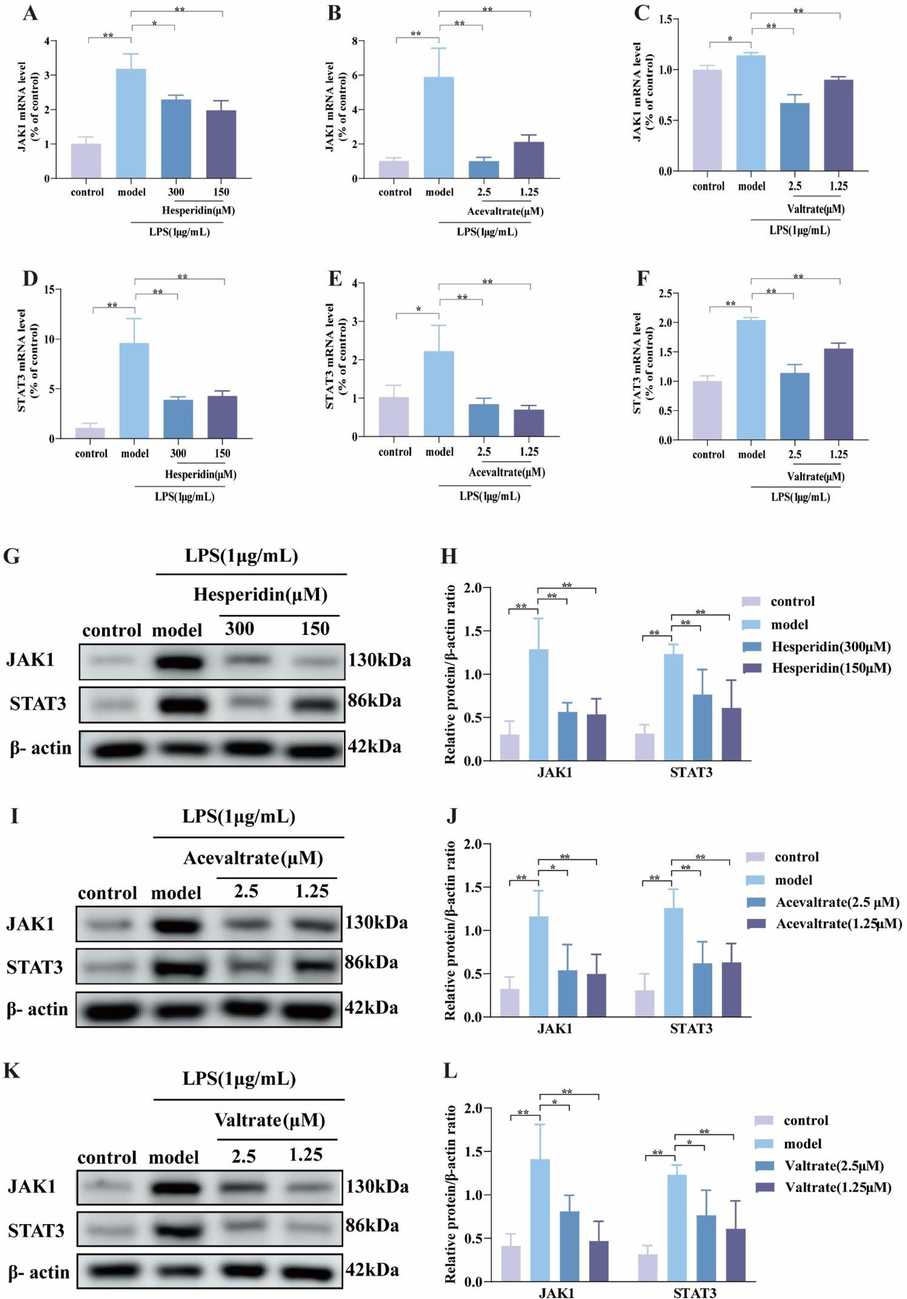
V. jatamansi potential quality markers regulate the key targets. (A-F) The mRNA levels of JAK1 and STAT3 in cells. (G-L) The protein expression of JAK1, STAT3 in cells; (G-I) Western blot image and (J-H) densitometric analysis. Data are shown as mean ± SD. *p < 0.05, **p < 0.01 and ns, no significant.
3.5.4 Quantitative analysis of potential quality markers
In order to verify the potential quality markers of V. jatamansi, these three compounds (hesperidin, acevaltrate and valtrate) were analyzed quantitatively. The HPLC results of V. jatamansi samples and the three compounds showed good separation (Fig. 7A and 7B). The verification method showed that the RSD of each compound precision, repeatability, 24 h stability, and recovery were all less than 3.84 %, indicating that the method was feasible. The linear results showed that the three compounds all met the expected linear requirements within the target concentration range (Table S8 for Supplementary materials). The results showed that the contents of the three potential quality markers in different batches were different (Table 4). There was a positive correlation between the total content of the three compounds in the batches and their anti-inflammatory activity as measured by the IC50 values, indicating that the batches with lower total concentration of the three compounds had lower potency in inhibiting inflammation. (Fig. 7C).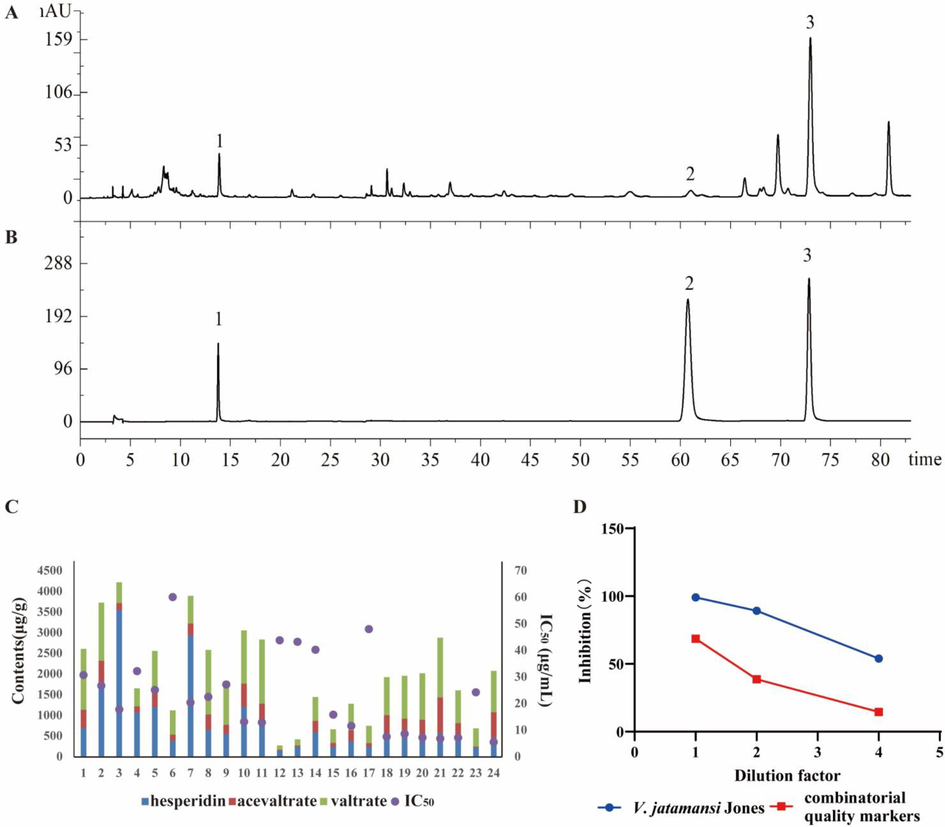
Quantitative analysis and contribution of V. jatamansi. (A) HPLC chromatogram of V. jatamansi. 1: hesperidin; 2: acevaltrate 3: valtrate. (B) HPLC of chromatogram mixed standard solution. 1: hesperidin; 2: acevaltrate 3: valtrate. (C) Correlation of anti-inflammatory activity and combinatorial quality markers content of different batches of V. jatamansi. (D) Inhibition rates of anti-inflammatory activity of V. jatamansi and combinatorial quality markers at different dilutions.
Sample
Hesperidin(μg/g)
Acevaltrate(μg/g)
Valtrate(μg/g)
S1
692.72 ± 1.83
448.07 ± 7.73
1470.72 ± 10.09
S2
1644.31 ± 2.86
680.93 ± 7.64
1406.20 ± 0.64
S3
3550.42 ± 25.3
172.36 ± 5.45
502.69 ± 3.35
S4
1073.98 ± 10.76
149.39 ± 7.48
433.76 ± 3.72
S5
1206.99 ± 34.07
377.28 ± 1.42
978.86 ± 3.76
S6
392.53 ± 7.35
146.46 ± 2.69
585.79 ± 4.16
S7
2940.91 ± 7.55
287.8 ± 12.75
669.19 ± 2.08
S8
658.95 ± 1.03
367.51 ± 4.95
1559.9 ± 17.82
S9
554.29 ± 3.73
223.79 ± 2.02
1060.35 ± 0.07
S10
1215.37 ± 12.78
556.95 ± 7.82
1286.13 ± 5.34
S11
733.97 ± 15.58
553.6 ± 2.71
1551.39 ± 3.92
S12
152.9 ± 7.60
20.19 ± 1.01
103.87 ± 1.45
S13
241.74 ± 1.93
36.29 ± 1.61
144.14 ± 2.71
S14
595.9 ± 5.36
276.32 ± 10.36
575.77 ± 3.54
S15
241.03 ± 11.95
95.16 ± 1.39
329.05 ± 3.80
S16
379.61 ± 5.72
264.91 ± 3.77
641.96 ± 1.27
S17
249.85 ± 2.88
91.30 ± 2.75
418.01 ± 2.91
S18
446.98 ± 1.39
562.79 ± 7.71
918.11 ± 5.65
S19
458.38 ± 13.94
466.66 ± 18.21
1037.94 ± 1.76
S20
364.75 ± 4.34
533.65 ± 22.31
1124.24 ± 4.94
S21
570.00 ± 0.96
868.66 ± 8.35
1444.40 ± 3.07
S22
516.82 ± 2.03
301.26 ± 9.35
792.25 ± 4.40
S23
230.94 ± 7.04
18.86 ± 0.91
438.16 ± 4.61
S24
474.65 ± 9.33
611.28 ± 6.88
1002.71 ± 1.42
3.5.5 Contribution of combinatorial quality markers
To evaluate the contribution rate of the combinatorial quality markers, we compared the NO inhibition rate of a certain batch of V. jatamansi extracts (S2) and a mixture of three combinatorial quality markers, with 1644.31 μg/g of hesperidin, 680.93 μg/g acevaltrate, and 1406.20 μg/g valtrate. Contribution rate = AUC combinatorial quality markers inhibition rate /AUC V. jatamansi extracts inhibition rate * 100 %. The results showed that the inhibition trend of the combinatorial quality markers and the V. jatamansi extracts was consistent at different dilution factors, and the contribution of the combinatorial quality markers reached 45.0 % of the V. jatamansi (Fig. 7D). This suggests that the combinatorial quality markers are important in evaluating the anti-inflammatory activity of V. jatamansi.
4 Discussion
V. jatamansi is a traditional Chinese medicine with good anti-inflammatory activity for soothing ulcerative colitis and diarrhea. In the 2020 edition of the Chinese Pharmacopoeia, it is recorded that acevaltrate and valtrate are used as the thin-layer identification items of V. jatamansi, and the quantitative analysis is lacking. Chen et al. proposed hesperidin as a marker for the HPLC quantification of V. jatamansi from different sources in Guizhou province (Chen et al., 2010). Li et al. selected 3-O-caffeoylquinic acid, hesperidin, and 4,5-O-dicaffeoylquinic acid as the quality markers for V. jatamansi, considering their high content, good stability and broad pharmacological effects (Li et al., 2014). These chemical compositions of quality markers cannot be directly related to their activities, which significantly reduces the value of quality control. Therefore, this study aimed to develop a comprehensive strategy for screening combinatorial quality markers in V. jatamansi based on their anti-inflammatory activity for quality control.
The identification of chemical components is a crucial step for the quality control of TCMs. Previous studies showed that the ethyl acetate fraction of V. jatamansi has a mitigating effect on ulcerative colitis (Wang et al., 2023a). Therefore, the sample solution preparation method was based on and enhanced from previous studies in this study. Afterwards, the chemical components of V. jatamansi Jones were analyzed by UHPLC-Q-TOF-MS, which offers high sensitivity, accuracy and mass resolution for the identification and quantification of compounds. This study identified 36 components from V. jatamansi Jones, including 32 iridoids, 2 flavones and 2 organic acids. It revealed the composition of V. jatamansi Jones and provided a basis for further screening of anti-inflammatory active ingredients.
M1-type macrophages, which differ from lipopolysaccharide (LPS)-stimulated macrophages, secrete pro-inflammatory cytokines and mediators, such as IL-6, IL-1β and TNF-α. The anti-inflammatory effect of V. jatamansi was verified using LPS-induced macrophage inflammation model. In this study, the anti-inflammatory effects exerted by V. jatamansi was found through down-regulation of NO, IL-6, IL-1β and TNF-α levels.
TCMs are characterized by multi-component, multi-target and synergistic effects. Thus, the emerging field of network pharmacology analysis is based on widely available databases, which allows preliminary prediction of bioactive components and action mechanisms of TCMs. The KEGG results showed that gene enrichment factors and gene number of JAK-STAT signaling pathway were significant, suggesting that V. jatamansi may exert anti-inflammatory effects through regulating these signaling pathways. The JAK-STAT signaling pathways transmit cytokine signals and regulates systemic inflammatory response (Lee et al., 2023) The network pharmacology analysis results were confirmed by experimentally testing two key targets (JAK1 and STAT3) that were highly related to V. jatamansi anti-inflammatory effect. The results showed that V. jatamansi and bioactivity quality markers inhibited JAK1 and STAT3 expression, which was consistent with the network pharmacology prediction. However, further validation of the anti-inflammatory effects of V. jatamansi and its active components using cellular and other animal models is needed for further studies.
The active compounds were initially explored using the spectrum-effect relationship combined with the chemometric strategy, based on the clarification of chemical compounds and anti-inflammatory activity. The correlation coefficients and significance of 17 common peaks in chemical fingerprint with the anti-inflammatory activity were obtained based on the application of the BCA mathematical model. The IC50 values were negatively correlated with 13 common peaks, suggesting that these compounds may enhance the anti-inflammatory activity of V. jatamansi with their increased content. Among them, 9 common peaks, including compounds P6 (isochlorogenic acid B), P7 (hesperidin), P12 (chlorovaltrateH), P14 (jatamanvaltrate M), P17 (5-hydroxydidrovaltrate), P23(acevaltrate), P26 (volvaltrateB), P30 (homobaldrinal) and P32 (valtrate), which had significant correlation by GCA analysis. According to the principle of measurability, easily acquired standard and specificity (Chu et al., 2022), four compounds were selected as potential quality markers, including P6 (isochlorogenic acid B), P7 (hesperidin), P23 (acevaltrate) and P32 (valtrate). Then the inhibitory ability of NO production of four compounds were evaluated, and three compounds (hesperidin, acevaltrate and valtrate) were finally considered as potential combinatorial quality markers exhibiting potential anti-inflammatory activity. Isochlorogenic acid B was excluded out from the quality marker with weak inhibition of NO production. While hesperidin has been reported to have good absorption properties in vivo (Li et al., 2023), the pharmacokinetic properties of acevaltrate and valtrate remains unknown. The quality markers (acevaltrate and valtrate) exhibited favorable pharmacokinetic properties, such as high lipophilicity, high gastrointestinal absorption and good central nervous system safety, and complied with several drug-likeness prediction models (e.g., Lipinski, Egan, and Muegge), which suggested their potential for absorption and efficacy in vivo.
The anti-inflammatory activity and molecular targets of combinatorial quality markers need to be validated in vitro. This is essential for the assessment of their reliability as quality markers of anti-inflammatory activity in V. jatamansi. These three compounds showed anti-inflammatory effects in RAW264.7 cells by inhibiting the production of inflammatory mediators (NO, IL-6, IL-1β and TNF-α) (Fig. 5G-O) and suppressing the expression of key targets (JAK1 and STAT3) (Fig. 6A-L). It was suggested that they play an important anti-inflammatory role. In order to investigate the composition of the combinatorial quality markers, the content of three compounds in 24 batches of V. jatamansi were analyzed using HPLC. HPLC has been widely used to determine the content of V. jatamansi with better analytical parameters, indicating the reliability of this method (Table S9 in Supplementary materials). However, Shukla et al. developed a method to measure the contents of nine compounds (quinic acid, protocatechuic acid, caffeic acid, orientin, kaempferol-3-O-rutinoside, luteolin, eugenol, isoeugenol and valerenic acid) in V. jatamansi without considering its activity. Therefore, activity-oriented methods were developed for the determination of combinatorial quality markers (hesperidin, acevaltrate and valtrate) with lower limits of quantification in the range of 0.80–2.00 μg/mL. Interestingly, the content of three compounds was positively correlated with anti-inflammatory activity (Fig. 7C), suggesting that three compounds have the potential to predict the quality marker of V. jatamansi. Furthermore, the contribution of the combinatorial quality markers was assessed, which accounted for 45.0 % of V. jatamansi. It was concluded that the combinatorial quality markers are critical in evaluating the anti-inflammatory activity. Thus, the combinatorial quality markers (hesperidin, acevaltrate and valtrate) that were selected have the following characteristics: 1) they are effortless to acquire and quantify; 2) they have anti-inflammatory activities; 3) they have good druglikeness and may suitable accumulation in the herb and absorption in body to take effect.
5 Conclusions
The activity-oriented combinatorial quality markers of V. jatamansi based on its anti-inflammatory effects were screened by an integrated process combining spectral-effect relationships and activity validation. Hesperidin, acevaltrate and valtrate could be considered as combinatorial quality markers which contributed 45.0 % for the quality control. The relationships between components and anti-inflammatory activity were revealed. Furthermore, this strategy is an effective approach to find Q-markers and provides a valuable perspective for quality control of herbal medicines. This strategy also offers a useful way to identify Q-markers and a valuable insight for quality control of TCMs.
Funding
This work was supported by National Natural Science Foundation of China (81973704), National Key R&D Program of China (2019YFC1711000) and Scientific research Project of Tianjin Education Commission (2019KJ078), Tianjin Graduate Research Innovation Project (2022BKY183), TUTCM Graduate Research Innovation Project (YJSKC-20221001).
CRediT authorship contribution statement
Chunxiao Liang: Methodology, Investigation, Writing – original draft. Kunze Du: Writing – review & editing. Shujing Chen: Software, Validation.Ye Shang: Formal analysis. Lirong Wang: Data curation. Shuangqi Wang: Data curation, Investigation. Omachi Daniel Ogaji: Writing - review & editing. Jin Li: Conceptualization, Resources, Supervision, Writing - original draft. Yanxu Chang: Conceptualization, Funding acquisition, Project administration, Writing – review & editing.
Declaration of Competing Interest
The authors declare that they have no known competing financial interests or personal relationships that could have appeared to influence the work reported in this paper.
References
- Validation of Sennae Folium specification grade classification based on UPLC-Q-TOF/MS spectrum-effect relationship. Arab. J. Chem.. 2022;15(11):104223
- [CrossRef] [Google Scholar]
- Anti-Inflammatory Study and Phytochemical Characterization of Zingiber officinale Roscoe and Citrus limon L. Juices and Their Formulation. ACS Omega. 2023;8(30):26715-26724.
- [CrossRef] [Google Scholar]
- Quality analysis for Valeriana jatamansi Jones from different habitats in Guizhou. China Mod Med.. 2010;17(13):46-47.
- [Google Scholar]
- Anti-inflammatory activity of Echinosophora koreensis nakai root extract in lipopolysaccharides-stimulated RAW 264.7 cells and carrageenan-induced mouse paw edema model. J. Ethnopharmacol.. 2023;302:115940
- [CrossRef] [Google Scholar]
- Identifying quality markers of Mailuoshutong pill against thromboangiitis obliterans based on chinmedomics strategy. Phytomedicine. 2022;104:154313
- [CrossRef] [Google Scholar]
- Discovery of Coixol Derivatives as Potent Anti-inflammatory Agents. J. Nat. Prod.. 2023;86(8):1950-1959.
- [CrossRef] [Google Scholar]
- SwissADME: a free web tool to evaluate pharmacokinetics, drug-likeness and medicinal chemistry friendliness of small molecules. Sci. Rep.. 2017;7(1):42717.
- [CrossRef] [Google Scholar]
- Di, H.Y., Shi, J.L., Yan, X.L., Zhao, R., Liu, Y., Xiao, P.G., 2007. Determination of valtrate, acevaltrate, and their degradation product-baldrinal in Valeriana walichi by HPLC analysis. Zhong Cao Yao(12), 1892-1894.
- An integration strategy combined progressive multivariate statistics with anticoagulant activity evaluation for screening anticoagulant quality markers in Chinese patent medicine. J. Ethnopharmacol.. 2022;114964
- [CrossRef] [Google Scholar]
- Qualitative and quantitative evaluation of Flos Puerariae by using chemical fingerprint in combination with chemometrics method. J. Pharm. Anal.. 2022;12(3):489-499.
- [CrossRef] [Google Scholar]
- Establishment of GC-MS fingerprint and quantitative analysis of multi-components of volatile oil from Compound Zhizhuxiang. Zhong Cao Yao. 2022;53(22):7048-7057.
- [Google Scholar]
- Berberine improves colitis by triggering AhR activation by microbial tryptophan catabolites. Pharmacol. Res.. 2021;164:105358
- [CrossRef] [Google Scholar]
- Anti-inflammatory effects of Allium cepa L. peel extracts via inhibition of JAK-STAT pathway in LPS-stimulated RAW264.7 cells. J. Ethnopharmacol.. 2023;317:116851
- [CrossRef] [Google Scholar]
- Quantitative Determination of Total flavones in Valeriana jatamansi Jones by UV Spectrophotometry. J. Liaoning Univ. Tradit. Chin. Med.. 2008;10(12):149-150.
- [CrossRef] [Google Scholar]
- TLC ldentification and HPLC Determination of Hesperidin in Valeriana Jatamansi Capsule. Prog Veterinary Med. 2018;39(12):96-99.
- [CrossRef] [Google Scholar]
- Simultaneous Determination of Three Components in Valeriana jatamansi by HPLC. Chin. Pharm. J.. 2014;49(20):1840-1844.
- [Google Scholar]
- Identification of chemical constituents of Qingjin Yiqi granules and comparative study on pharmacokinetics of 23 main bioactive components in normal and Lung-Qi deficiency rats by UPLC-MS/MS method. J. Chromatogr. B Anal. Technol. Biomed. Life Sci.. 2023;1226:123802
- [CrossRef] [Google Scholar]
- An ultra-robust fingerprinting method for quality assessment of traditional Chinese medicine using multiple reaction monitoring mass spectrometry. J. Pharm. Anal.. 2021;11(1):88-95.
- [CrossRef] [Google Scholar]
- Iridoids from Valeriana jatamansi with anti-inflammatory and antiproliferative properties. Phytochemistry. 2021;184:112681
- [CrossRef] [Google Scholar]
- Material basis elucidation and quantification of dandelion through spectrum-effect relationship study between UHPLC fingerprint and antioxidant activity via multivariate statistical analysis. Molecules. 2022;27(9):2632.
- [CrossRef] [Google Scholar]
- Exploring active ingredients of anti-osteoarthritis in raw and wine-processed Dipsaci Radix based on spectrum-effect relationship combined with chemometrics. J. Ethnopharmacol.. 2023;309:116281
- [CrossRef] [Google Scholar]
- Antidiarrheal activity of the extracts of Valeriana jatamansi Jones on castor oil-induced diarrhea mouse by regulating multiple signal pathways. J. Ethnopharmacol.. 2022;298:115560
- [CrossRef] [Google Scholar]
- New iridoids from the roots of Valeriana jatamansi Jones. Nat. Prod. Res.. 2022;36(13):3360-3367.
- [CrossRef] [Google Scholar]
- Valeridoids G - Q, eleven seco-iridoids from Valeriana jatamansi and their bioactivites. Chem. Biodivers.. 2022;19(9):e202200609.
- [Google Scholar]
- Iridoids and sesquiterpenoids from Valeriana officinalis and their bioactivities. Phytochemistry. 2023;205:113478
- [CrossRef] [Google Scholar]
- Shukla, V., Singh, P., kumar, D., Konwar, R., Singh, B., Kumar, B., 2021. Phytochemical analysis of high value medicinal plant Valeriana jatamansi using LC-MS and it's in-vitro anti-proliferative screening. Phytomed Plus 1(2), 100025. https://doi.org/10.1016/j.phyplu.2021.100025.
- Anti-Inflammatory Activity of Methanolic and Aqueous Extracts of Valeriana Wallichii DC Rhizome. Pak J Plant Sci. 2007;13:103-108.
- [Google Scholar]
- Development of a three-step-based novel strategy integrating DMPK with network pharmacology and bioactivity evaluation for the discovery of Q-markers of traditional Chinese medicine prescriptions: Danlou tablet as an example. Phytomedicine. 2023;108:154511
- [CrossRef] [Google Scholar]
- An integrated strategy of spectrum-effect relationship and near-infrared spectroscopy rapid evaluation based on back propagation neural network for quality control of Paeoniae Radix Alba. Anal. Sci.. 2023;39:1233-1247.
- [CrossRef] [Google Scholar]
- Discovery and proteomics analysis of effective compounds in Valeriana jatamansi jones for the treatment of anxiety. J. Ethnopharmacol.. 2021;265:113452
- [CrossRef] [Google Scholar]
- Therapeutic Effects of Valeriana jatamansi on Ulcerative Colitis: Insights into Mechanisms of Action through Metabolomics and Microbiome Analysis. J. Proteome Res.. 2023;22:2669-2682.
- [Google Scholar]
- Influence of iridoid from Valeriana jatamansi on 5-HT and 5-HIAA in rats with irritable bowel syndrome. Zhongguo Zhong yao za zhi = Zhongguo zhongyao zazhi =. China Journal of Chinese Materia Medica. 2011;36(9):1235-1238.
- [Google Scholar]
- Approaches to establish Q-markers for the quality standards of traditional Chinese medicines. Acta Pharm. Sin. B. 2017;7(4):439-446.
- [CrossRef] [Google Scholar]
- Linarin suppresses glioma through inhibition of NF-κB/p65 and up-regulating p53 expression in vitro and in vivo. Biomed. Pharmacother.. 2017;95:363-374.
- [CrossRef] [Google Scholar]
- In-capillary screening and quantifying the antioxidants of Yangxinshi Tablet using field-enhanced sample injection-micellar electrokinetic chromatography. J. Sep. Sci.. 2023;46(13):e2300054.
- [Google Scholar]
- KPNA2 promotes osteosarcoma growth and metastasis in a c-Myc-dependent manner via the hedgehog /GLI1 signaling pathway. Arab. J. Chem.. 2023;16(7):104805
- [CrossRef] [Google Scholar]
- Rapid screening of antioxidant from natural products by AAPH-Incubating HPLC-DAD-HR MS/MS method: A case study of Gardenia jasminoides fruit. Food Chem.. 2023;401:134091
- [CrossRef] [Google Scholar]
- Explorating the mechanism of Huangqin Tang against skin lipid accumulation through network pharmacology and experimental validation. J. Ethnopharmacol.. 2023;313:116581
- [CrossRef] [Google Scholar]
Appendix A
Supplementary data
Supplementary data to this article can be found online at https://doi.org/10.1016/j.arabjc.2023.105367.
Appendix A
Supplementary data
The following are the Supplementary data to this article:Supplementary data 1
Supplementary data 1


