

Translate this page into:
A comprehensive strategy integrating metabolomics with DNA barcoding for discovery of combinatorial discriminatory quality markers: A case of Cimicifuga foetida and Cimicifuga dahurica
⁎Corresponding authors at: State Key Laboratory of Component-based Chinese Medicine, Tianjin University of Traditional Chinese Medicine, Tianjin 301617, China. dkztcm@tjutcm.edu.cn (Kunze Du), Tcmcyx@tjutcm.edu.cn (Yanxu Chang)
-
Received: ,
Accepted: ,
This article was originally published by Elsevier and was migrated to Scientific Scholar after the change of Publisher.
Abstract
The multiple species characteristics of traditional Chinese medicines (TCMs) are crucial for expanding TCMs sources, meeting the needs of the pharmaceutical industry and ensuring clinical requirements. It’s also one of the significant factors affecting the quality control of TCMs. Systematic differential analysis of original species in TCMs is an important link in achieving comprehensive quality control, ensuring the effectiveness and safety of clinical medication. The study aims to establish a reliable and efficient approach to screen combinatorial discriminatory quality markers for rapid differentiation of original species by metabolomics coupled with DNA barcoding as a case of Cimicifugae Rhizoma. DNA barcoding is used to identify the origin of Cimicifugae Rhizoma. The data-dependent acquisition mode integrated with the computerized intelligent filtering system was established for in-depth characterization of metabolites from Cimicifugae Rhizoma using ultra-high performance liquid chromatography to quadrupole time-of-flight mass spectrometry (UHPLC-Q-TOF-MS). The untargeted metabolomics combined with multivariate statistical analysis was performed to screen and identify the potential combinatorial discriminatory quality markers. Finally, quantitative analysis and predictive model of these markers were employed to validate the feasibility of this strategy to distinguish the original species. Based on the scores of variable importance in projection greater than 1.0 and t-test (p < 0.05) in chemometric analysis, caffeic acid, cimifugin, ferulic acid and isoferulic acid were authenticated as combinatorial discriminatory quality markers for the two original species of Cimicifugae Rhizoma. In addition, the Fisher discriminant model successfully classified 56 batches of Cimicifugae Rhizoma with an accuracy of 94.4 %, showcased the practicality and scientific validity of this method. This study has provided a comprehensive strategy for efficient discrimination of multiple species of medicinal materials.
Keywords
Cimicifuga foetida
Cimicifuga dahurica
Data-dependent acquisition
Metabolomics
DNA barcoding

- AdaBoost
-
Adaptive boosting algorithm
- C. dahurica, XSM
-
Cimicifuga dahurica
- C. foetida, SM
-
Cimicifuga foetida
- CIF
-
computerized intelligent filtering
- CR
-
Cimicifugae Rhizoma
- DDA
-
data-dependent acquisition
- DIA
-
data-independent acquisition
- FA
-
formic acid
- HPLC-DAD
-
High Performance Liquid Chromatography with Diode-Array Detection
- KNN
-
K-Nearest Neighbor
- K2P
-
Kimura 2-parameter
- LC/MS
-
Liquid chromatography/mass spectrometry
- NJ
-
Neighbor-Joining
- PCA
-
Principal Component Analysis
- PILs
-
precursor ion lists
- OPLS-DA
-
Orthogonal Partial Least Squares-Discriminant Analysis
- RSDs
-
relative standard deviations
- TCMs
-
traditional Chinese medicines
- UHPLC-Q-TOF-MS
-
ultra-high performance liquid chromatography to quadrupole time-of-flight mass spectrometry
Abbreviations
1 Introduction
The application of traditional Chinese medicines (TCMs) in clinical practice is gradually expanding due to its abundant species resources, high efficacy, low cost and low toxicity (Wang et al., 2021). However, the quality control standards of TCMs have not been fully unified because of the differences in national, ministerial and local drug inspection standards. The plant species is an important influential factor of TCMs quality. Accurate identification of plant species of TCMs is the primary link in TCMs quality control. The quality can be evaluated to further ensure the efficacy and safety of clinical medication by clearly differentiating the plant species of TCMs (Zhang et al., 2022). Therefore, it is required to establish an efficient and practical approach for investigating the chemical differences of the plant species used as the same TCM.
Cimicifugae Rhizoma (CR), belonging to the Ranunculaceae family, is one of the widely used TCMs for relieving oral ulcers, herpes zoster, chronic pulmonary heart disease and menopause symptoms (Zheng et al., 2013, Zhang et al., 2014). Currently, the reported components of CR mainly include triterpenoid saponins (Pang et al., 2021), phenylpropanoids (Lu et al., 2019), chromones (Duan et al., 2021), alkaloids (Thao et al., 2017) and terpenoids (Ma et al., 2013). The CR cultivars are broadly distributed throughout China, encompassing Cimicifuga foetida L., Cimicifuga dahurica (Turcz.) Maxim. and Cimicifuga heracleifolia Kom. (Chinese Pharmacopoeia Commission, 2020). The use of multiple species of herbal medicines is convenient for accessing materials from local sources and addressing resource scarcity. The CR species have high similarity in appearance. However, the current method had rarely been reported according to morphological evaluation without objectivity and reliable methods for differentiating the species. In addition, the chemical compositions of CR often vary from varieties and they serve as the basis for its therapeutic effects in clinic. Therefore, it is imperative to develop a new method to investigate the accurate chemical differences of CR species.
DNA barcoding is an effective and accurate technique that identifies the plant species using one or several short DNA gene fragments. Due to the stability of DNA sequence, this technique remains unaffected by variables such as plant growth years, growth environment or plant parts. Therefore, it is widely recognized and applied for identifying the origin (Wang et al., 2021), adulteration (Shi et al., 2017) and authenticity of medicinal herbs (Guo et al., 2017). ITS2, as a non-coding nuclear DNA, can effectively distinguish species in close phylogenetic relationships with the characteristics of easy sequence amplification, high success rate and strong universality. Therefore, the ITS2 was used as the most suitable region for discriminating species. Based on this, a system for TCMs identification was established to facilitate rapid differentiation between the plant species (Gao et al., 2019).
Plant metabolomics is the qualitative and quantitative research of small molecules of secondary metabolites in different species, genotypes or ecological environment at growth stages (Li et al., 2021, Meng et al., 2023). Due to its high applicability and specificity, metabolomics had been employed extensively to quest for the species authentication (Bielecka et al., 2021), the quality evaluation (Yue et al., 2019), the analytical origins (Cao et al., 2021), the bioactivity screening (Qu et al., 2021) and research on mechanism (Fu et al., 2022, Wurihan et al., 2022) in TCMs. A comprehensive insight into the secondary metabolites of various species in TCMs is vital for further differential components analysis. Ultra-high performance liquid chromatography to quadrupole time-of-flight mass spectrometry (UHPLC-Q-TOF-MS) offers high sensitivity, high resolution and high accuracy, making it an increasingly important tool for characterizing complex components and uncovering unknown metabolites in TCMs (Li et al., 2020, Chen et al., 2022, Qu et al., 2023). Nowadays, the most commonly used method for untargeted metabolites characterization is Data Dependent Acquisition (DDA). The interference of unrelated ions is evidently reduced and high-quality fragments are obtained favoring the elucidation of structural information in DDA method (Rudt et al., 2023). Premised on this, a segmented collection mode with limited mass range was constructed and a computerized intelligent filtering (CIF) platform was established during the data processing stage to analyze and characterize the chemical components. Therefore, an in-depth metabolites characterization strategy was proposed based on DDA mode and CIF system in this study.
The strategy integrating metabolomics with DNA barcoding was applied to screen combinatorial discriminatory quality markers of Cimicifuga foetida (C. foetida) and Cimicifuga dahurica (C. dahurica) on the basis of the phylogenetic relationships and chemical constituents. Firstly, the ITS2 sequences were completely gained by DNA barcoding to distinguish the two species of CR. Secondly, the in-depth and global characterization of CR was conducted using a combination of DDA and CIF techniques by UHPLC-Q-TOF-MS. Thirdly, the combinatorial discriminatory quality markers were confirmed eventually using metabolomic combined with chemometric methods, including caffeic acid, cimifugin, ferulic acid and isoferulic acid. A comprehensive strategy combining metabolomics with DNA barcoding was applied for the first time in Cimicifugae Rhizoma to screen combinatorial discriminatory quality markers for rapid differentiation. The established strategy showed the ability to distinguish original plants and also provided significant guide for the quality control in TCMs. The schematic diagram illustrates the strategy of screening combinatorial discriminatory quality markers in CR (Fig. 1).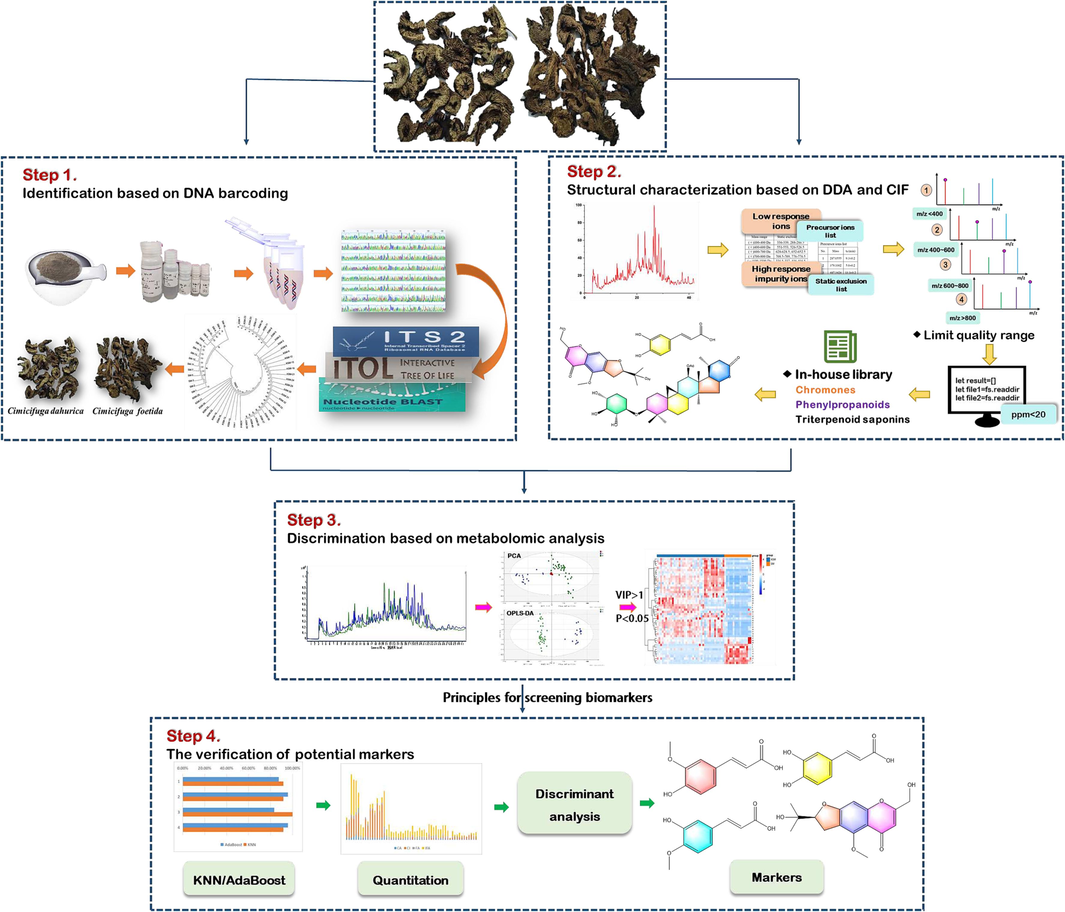
The schematic diagram of the strategy of discriminational investigation in CR.
2 Materials and methods
2.1 Plant material and pretreatment
A total of 56 batches of CR (Table S1 in Supplementary materials) were from two species, of which 44 batches were purchased from the markets and 12 batches were collected from wild plants. The purchased batches were mainly from Sichuan, Inner Mongolia and the three northeast provinces of China while the collected batches were obtained from Heilongjiang. All samples were identified by Prof Yanxu Chang (Tianjin University of Traditional Chinese Medicine) using morphological authentication. The voucher specimens were deposited in State Key Laboratory of Component-based Chinese Medicine (Tianjin, China). The CR samples were powdered with a pulverizer and filtered through a 50-mesh sieve. Each sample powder (0.100 g) was weighed accurately and extracted by an ultrasonator with 4.0 mL of 50 % methanol (v/v) for 40 min at 50 Hz. The extract was centrifuged at 7300 rpm for 10 min. All the supernatant were filtered through a 0.22 µm filter membrane before UHPLC analysis.
2.2 Chemicals and reagents
HPLC-grade methanol and acetonitrile (Fisher, Pittsburg, PA, USA), HPLC-grade formic acid (FA) (Anaqua™, Wilmington, DE, USA), and ultrapure water was prepared by Milli-Q academic ultra-pure water system (Millipore, Milford, MA, USA). Other reagents were analytical grade. Eleven reference standards, including caffeic acid, ferulic acid, isoferulic acid, cimifugin, cimicifugoside, cimifugin-4′-O-β-D-glucopyranoside, cimigenol xyloside, cimigenol-3-O-α-L-arabinoside, cimicidanol-3-O-α-L-arabinoside, acetylcimigenol-3-O-α-L-arabinopyranside, 26-deoxycimicifugoside were purchased from Chengdu Desite Bio-Technology Co., Ltd (Chengdu, China). 2 × Taq PCR Mix, Plant Genomic DNA kit, ddH2O were obtained from Tiangen Biochemical Technology Co., Ltd (Beijing, China). DNA marker, 6 × loading buffer and GoldView™ were supplied from Takara Biomedical Technology (Beijing) Co., Ltd. The primer was synthesized by Sangon Co., Ltd (Shanghai, China).
2.3 DNA barcoding analysis
Each sample was sprayed by 75 % ethanol solution and gently wiped with degreased cotton to remove impurities. Each sample (0.080 g) was powdered for 10 min at 70 Hz in a tissue grinder (Servicebio, China). After transferring the sample to a new centrifuge tube, the genomic DNA extraction was isolated by Tiangen Plant Genomic DNA kit (Tiangen Biotech, China) with minor modifications. The extracted samples were quantitatively analyzed by NanoDrop spectrometer (Thermo Fischer Scientific, USA) and stored at −20 °C for later use.
The ITS2 sequences were amplified from genomic DNA by polymerase chain reaction (PCR) using universal primers of ITS2F (5′-GCGATACTTGGTGTGAAT-3′) and ITS3R (5′-GACGCTTCTCCAGACTACAAT-3′) (Ren et al., 2014). The PCR was performed in a total volume of 50 μL, containing approximately 50–200 ng template DNA, forward primer (2.5 mM, 2 μL), reverse primer (2.5 mM, 2 μL), 2 × Taq PCR Mix (25 μL), ddH2O added to 50 μL. The PCR conditions were as follows: 94 °C for 5 min; 40 cycles at 94 °C for 30 s, 56 °C for 30 s and 72 °C for 45 s; 72 °C for 10 min. PCR products (5 μL of each) were detected by electrophoresis on 1.5 % agarose gel in 1 × TAE buffer for 40 min at 80 V. Purified PCR products were sequenced in both directions.
Sequences were assembled by Geneious 9.0.2. Then, the complete ITS2 sequences were annotated and cut based on the ITS2 Database (https://its2.bioapps.biozentrum.uni-wuerzburg.de/). After final alignment in MEGA 6.0, 56 ITS2 sequences were imported into NCBI (https://www.ncbi.nlm.nih.gov/) to preliminarily determine the species attribution. Genetic distance was calculated based on Kimura 2-parameter (K2P) model to evaluate intraspecific and interspecific variation. The phylogenetic tree was constructed by Neighbor-joining (NJ) method with 1000 bootstrap replications to summarize the genetic relationships.
2.4 UHPLC-Q-TOF-MS analysis
The metabolic characteristics and composition characterization of herbal samples were collected on a 1290 UHPLC system together with a 6520 Q-TOF mass spectrometer (Agilent, Santa Clara, CA, USA). The samples were separated on a ZORBAX Eclipse Plus C18 column (4.6 × 100 mm, 1.8 μm, Agilent Technologies, MD, USA) at 35 °C. The mobile phase consisted of solvent A (0.1 % FA-water) and solvent B (acetonitrile) with a gradient elution. The elution gradient of metabolomics was as follows: 0–8 min, 5 %–35 % B; 8–20 min, 35 %–57 % B; 20–40 min, 57 %–81 % B; 40–42 min, 81 %–90 % B. The flow rate was 0.3 mL/min and the injection volume was 3 μL. The other ion source parameters were set as follows: source temperature, 550 °C; drying gas temperature, 325 °C; skimmer voltage, 65 V; fragmentor voltage, 120 V; capillary voltage, 3.5 kV; ion spray voltage, −4.5 kV; collision energy (CE), 10, 35 and 40 V; nebulizer gas pressure, 40 psig; drying gas, N2; gas flow rate, 10 L/min; detection range, m/z 50–1500 in both positive and negative mode.
The DDA mode containing mass range, precursor ion lists (PILs) and static exclusion range lists were used for component characterization. The main different parameters were as follows. According to the organized compounds database, the mass range were set to 100–400 Da, 400–600 Da, 600–700 Da, 700–800 Da, 800–1200 Da in positive mode in order to acquire as much as possible mass spectrometric information, respectively. Furthermore, the molecular weight of the components in CR was mainly concentrated in the range of 400–800 Da, so 400–600 Da, 600–700 Da and 700–800 Da were set to obtain more compound information. The PILs mainly consist of those with low response and the static exclusion range lists were interfering ions (collected in Table S2). The optimal gradient including 0–15 min, 5 %–100 % B; 15–18 min, 100 % B was adopted for component characterization due to its good peak separation effect and more time-saving.
2.5 Quantitative analysis of chemical markers
The quantitative analysis of the herbal samples were acquired by an Ultimate 3000 High Performance Liquid Chromatography with Diode-Array Detection (HPLC-DAD) (Thermo Fisher Scientific, United States). An Agilent Ultimate AQ-C18 (4.6 × 250 mm, 5 μm, Agilent) was used for subsequent analysis. The mobile phase consisted of 0.1 % FA-water (A) and acetonitrile (B), and the optimal gradient conditions were as follows: 0–10 min, 5 %–20 % B; 10–18 min, 20 %–26 % B, 18–28 min, 26 %B; 28–29 min, 26 %–30 % B, 29–35 min, 30 %B; 35–45 min, 30 %–50 %B. The flow rate was set at 1.0 mL/min, the injection volume was 10.0 μL, the column temperature of 30 °C and the detection wavelength was 310 nm.
The quantification method of the potential markers was validated for linearity, precision, repeatability and recovery according to the guiding principle of the validation of analytical methods of Chinese Pharmacopoeia (Yan et al., 2022). The mixed standard solutions of different concentrations were adopted to gain the standard curves. The precision was evaluated by injecting six consecutive needles of the XSM-14 sample. The repeatability of the method was investigated by inspecting six duplicate samples of the XSM-14. The stability of the samples were computed within 24 h. Furthermore, the recovery was measured by adding half amount of the mixed standard solutions into the samples.
2.6 Multivariate statistical analysis
The multivariate statistical analysis mainly included Principal Component Analysis (PCA), Orthogonal Partial Least Squares-Discriminant Analysis (OPLS-DA), K-Nearest Neighbor (KNN), Adaptive boosting algorithm (AdaBoost) and Fisher discriminant analysis. Firstly, the data processing and analysis of UHPLC-Q-TOF-MS were carried out by the Agilent MassHunter software B.07.00. Agilent Mass Profinder software (version B.10.00) was applied to peak identify, peak match and then metabolomics variable information was obtained. Secondly, total metabolic variants were used for PCA and OPLS-DA analysis by SIMCA (14.1 version) to classify the 56 batches. Further screening the differential components between C. foetida and C. dahurica (Han et al., 2022). Thirdly, AdaBoost and KNN algorithms were served to calculate the grouping accuracy of the selected markers. Finally, these markers were performed by Fisher discriminant analysis using SPSS software. This model would be applied to distinguish and identify C. foetida and C. dahurica with unknown origin.
3 Results and discussion
3.1 Discrimination of C. foetida and C. dahurica using ITS2 barcoding
PCR amplification was performed after extracting DNA fragments. The PCR results showed that the ITS2 regions of 56 samples were successfully amplified by the universal primers ITS2F/ITS3R (Fig. S1) and high-quality bidirectional sequencing trace files were obtained. After removing the 5.8 s and 28 s rRNA gene sequences at both ends, a total of 56 ITS2 sequences were acquired. Among them, 16 of 56 batches of CR were identified as C. foetida and the rest were C. dahurica. All the sequences were 219 bp in length. According to the analysis of variable sites, C. foetida can be classified into four main haplotypes (F1 ∼ F4), while C. dahurica has three main haplotypes (D1 ∼ D3) (Table 1). The GC-content of C. foetida and C. dahurica were 51.8 %∼53.0 % and 50.2 %∼50.7 %, respectively (Table S3). Note: * it indicated the same base as the first row. Referring to Molecular identification of DNA barcoding in traditional Chinese medicine.
Latin name
Haplotype
variable sites/bp
3
17
32
70
97
105
117
131
146
162
171
175
210
/
Reference
C
T
G
C
G
C
C
T
G
C
A
C
T
C. foetida
F1
*
*
*
*
*
*
*
*
*
*
*
*
*
F2
*
*
*
*
*
*
*
*
*
*
*
T
*
F3
*
*
Y
*
A
*
*
*
*
*
*
*
*
F4
*
*
*
*
*
*
*
C
*
*
*
*
*
C.dahurica
D1
*
C
A
R
A
T
T
*
A
A
C
A
G
D2
T
C
A
*
A
T
T
*
A
A
C
A
G
D3
*
C
A
*
A
T
T
*
A
A
C
A
G
In order to construct a consensus phylogenic tree with bootstrap percentages, the Neighbor-Joining (NJ) algorithm was applied to the ITS2 regions using MEGA 6.0 software (Fig. S2). C. foetida and C. dahurica could be clearly distinguished into two groups. Meanwhile, K2P Genetic distance within and between species were calculated by this software. The intra specific distance of C. foetida and C. dahurica from different regions were 0 ∼ 0.0046 and 0 ∼ 0.0093, with an average intra specific distance of 0.0013 and 0.0021, respectively. It indicated that there was a little variation in the genetic process between different regions and also proved that ITS2 sequence, as a DNA barcoding of CR, exhibited good stability. The interspecific distance between the two cultivars of CR was 0.0485, which was far greater than the intraspecific difference (Table S3).
This study requires correct species identification of C. foetida and C. dahurica to ensure accurate elucidation of the chemical differences between the two plants and to discover the impact of species on the quality of medicinal materials. It is usually difficult for inexperienced researchers to employ morphological authentication methods to confirm the original plant species of CR. Recently, DNA barcoding was used to identify accurately the plant species unaffected by external conditions (Gao et al., 2019). Here, the ITS2 regions of 56 samples were successfully amplified and the sequences were obtained. The results showed that the ITS2 could authenticate the original plant species of CR with 100 % success rate. The ITS2 region had the potential to be a good DNA barcoding for identification of medicinal species of CR. It could not provide differences in composition and its content between the two species. Subsequently, the differential components were screened and verified to lay the foundation for further improvement on the quality evaluation of CR based on metabolomics and chemometrics.
3.2 Identification of chemical composition in CR
3.2.1 Strategy for the rapid discovery and identification of compounds
The integrated DDA method (limited mass range, PILs and static exclusion) with CIF system was applied to thoroughly characterize a variety of compounds from CR using UHPLC-Q-TOF-MS. Firstly, the database about the components of CR was established. This allows for the rapid filtration of potential compounds in CR due to the higher matching score between molecular ions and the database. Next, in order to obtain as much as possible mass spectrometric information on the CR, DDA method was conducted. Subsequently, an intelligent data matching platform was created through node server to achieve automatic output of target data. The obtained mass spectrum information were matched with the self-built database through the platform. Following this, the molecular ions were unequivocally screened using the error formula with ppm less than 20. Finally, the screening results were further validated and the structural characterization was accomplished by characteristic diagnostic ion and neutral loss comparing with in-house library (Huang et al., 2022). The total ion chromatograms (TIC) of CR were obtained both in positive and negative ion mode using UHPLC-Q-TOF-MS (Fig. S3). The information of compounds including accurate mass measurements, molecular ions, fragmentation behavior and retention time were shown in Table 2.
No.
Adduct
tR (min)
Formula
Mass
m/z
Error (ppm)
MS/MS Fragments
Identification
c1
[M−H]-
1.77
C11H12O8
272.0532
271.0459
5.66
253.0345,191.0341,179.0334,135.0426
Fukiic acid
c2
[M−H]-
2.23
C11H12O7
256.0583
255.051
3.23
255.0502,211.0620,193.0492,179.0337,165.0468
Piscidic acid
c3
[M + H]+
2.36
C32H42O16
682.2473
683.2546
8.01
682.2683,641.2519,524.2118
(+)-pinoresinol di-O-β-D-allopyranoside
c4
[M−H]-
2.38
C14H20O8
316.1158
315.1085
−4.93
315.1101,153.0543,123.0446
Cimidahurine
c5
[M−H]-
2.51
C14H20O8
316.1158
315.1085
0.45
315.1084,153.0210,123.0441
3,5-dihydroxy-2-[(4-hydroxy phenyl)methyl]butanedioic acid
c6
[M−H]-
2.52
C15H18O9
342.0951
341.0878
2.94
341.0868,179.0343,135.0433
Caffeic acid 4-O-β-D-glucopyranoside
c7
[M−H]-
2.59
C11H12O7
256.0583
255.051
0.49
225.0509,117.0344
(2R,3S)-2,3-dihydroxy-2-(4-hydroxybenzyl)succinic acid
c8
[M−H]-
2.97
C13H16O8
300.0845
299.0772
6.14
299.0654,137.0271
4-hydroxybenzoic acid 4-O-β-D-glucoside
c9
[M + H]+
3.35
C31H41NO15
667.2476
668.2549
−5.1
668.2583,506.2126,177.0543,163.0655
Aristomanoside
c10
[M−H]-
3.38
C16H20O9
356.1107
355.1035
8.58
355.1004,193.0455,149.0577
trans-isoferulic acid 3-O-β-D-allopyranoside
c11
[M−H]-
3.42
C8H8O4
168.0423
167.035
0.49
167.0349,139.8804,65.0400
2-methoxy-5-hydroxybenzoic acid
c12
[M + H]+
3.52
C24H29NO9
475.1842
476.1915
−0.82
476.1919,314.1280,177.0532
trans-feruloyl tyramine-4-O-β-D-glucopyranoside
c13
[M−H]-
3.53
C9H8O4
180.0423
179.035
4.35
179.0342,135.0428
Caffeic acid
c14
[M + H]+
3.62
C25H31NO10
505.1948
506.2021
1.33
506.2014,237.0759,177.0524,149.0623
Isocimicifugamide
c15
[M + H]+
3.66
C24H29NO10
491.1791
492.1864
−7.69
492.1902,330.1590,177.0542
Cimicifugamide A
c16
[M + Na]+
3.75
C14H20O8
316.1158
339.105
−8.1
339.1076,177.0551,149.0579
Cimidaurinine
c17
[M + H]+
3.87
C22H28O11
468.1632
469.1704
0.51
469.1072,307.1164,289.1061,261.1194,235.0616
Cimifugin-4′-O-β-D- glucopyranosude
c18
[M−H]-
3.89
C16H20O9
356.1107
355.1035
−1.81
355.1041,193.0507,147.0587
trans-isoferulic acid 3-O-β-D-glucopyranosude
c19
[M + H]+
3.96
C26H30O12
534.1737
535.181
−6.17
535.1843,517.2064,491.2913,163.0660
Cimicifugaside F
c20
[M−H]-
4.02
C27H30O15
594.1585
593.1512
6.55
593.1473,355.0981,193.0494,165.0538
Shomaside G
c21
[M−H]-
4.04
C34H46O18
742.2684
741.2611
5.04
741.2574,579.2155,417.1555
(-)-syringaresinol 4,4′-di-O-β-D-allopyranoside
c22
[M−H]-
4.12
C27H30O15
594.1585
593.1512
−4.22
593.1537,193.0476
Shomaside C
c23
[M + H]+
4.12
C24H29NO10
491.1791
492.1864
−0.77
492.1868,330.1425,177.0520,137.0643
Cimicifugamide B
c24
[M + H]+
4.19
C22 H28 O11
468.1632
469.1704
0.51
469.1702,307.1153,259.0920,235.0565
Cimicifugoside
c25
[M + Na]+
4.35
C32H38O17
694.2109
717.2001
−0.4
717.2004,555.1467,523.1406,699.2299,604.3766
Cimicifugaside A
c26
[M + H]+
4.36
C25H31NO10
505.1948
506.2021
−6.19
506.2052,344.1099,177.0519,145.0289
trans-Feruloyl-(3-O-methyl) dopamine-4-O-β-D allopyranoside
c27
[M−H]-
4.38
C27H30O15
594.1585
593.1512
5.88
593.1477,355.0967,237.0345,193.0502
Shomaside B
c28
[M + H]+
4.54
C20H20O7
372.1209
373.1282
−3.82
373.1296,355.2019,325.1049,293.0848,277.1420,265.0941,233.0808,201.0539
Cimicifugic acid
c29
[M + H]+
4.55
C24H29NO9
475.1842
476.1915
−5.67
476.1969,314.1358,177.0515,163.0391
trans-Feruloyl tyramine-4-O-β-D-allopyranoside
c30
[M + H]+
4.60
C16H18O6
306.1103
307.1176
1.68
307.1156,289.1059,259.0592,235.0587,221.0432,177.0531
Cimifugin
c31
[M + H]+
4.61
C25H31NO10
505.1948
506.2021
−8.37
506.2063,344.1337,177.0487,163.0329,145.0227
Cimicifugamide
c32
[M−H]-
4.65
C10H10O4
194.0579
193.0506
4.29
193.0491,178.0257,149.0604,134.0364
Ferulic acid
c33
[M−H]-
4.69
C10H10O4
194.0579
193.0506
8.93
193.0489,167.0357
methyl caffeate
c34
[M + H]+
4.69
C21H26O11
454.1475
455.1548
1.07
455.1543,293.1050,275.1577
prim-O-glucosylangelicain
c35
[M + H]+
4.71
C25H31NO10
505.1948
506.2021
0.34
506.2019,489.0139,344.1506,177.0545,163.0378
(2E)-3-[4-(β-D-allopyranosyl)-3-methoxy-phenyl]-N-[2-(4-hydroxy-3-methoxyphenyl) ethyl]-2-propenamide
c36
[M−H]-
4.72
C10H10O4
194.0579
193.0506
2.23
193.0502,178.0258,149.0610,134.0863
Isoferulic acid
c37
[M−H]-
4.87
C20H18O10
418.09
417.0827
−7.37
417.0858,237.0412,193.0492,165.0548,149.0615
Cimicifugic acid C
c38
[M−H]-
4.98
C20H18O10
418.09
417.0827
0.53
417.0825,237.0417,193.0490,165.0537,
Cimicifugic acid D
c39
[M−H]-
5.25
C21H20O11
448.1006
447.0933
1.31
447.0927,253.0352,235.0254,209.0442,191.0347,181.0497,165.0547
Cimicifugic acid A
c40
[M−H]-
5.33
C21H20O11
448.1006
447.0933
−2.27
447.0943,253.0355,235.0234,209.0455,191.0345,181.0502,165.0550
Cimicifugic acid B
c41
[M + H]+
5.44
C20H18O10
418.09
419.0973
−4.85
419.0993,401.0775,373.0912,329.0935,257.0742
2-caffeoyl piscidic acid
c42
[M + Na]+
5.57
C41H64O15
796.4245
819.4137
−0.57
819.4142,559.0613,503.3338
Heracleifolinoside C
c43
[M−H]-
5.59
C21H20O10
432.1056
431.0984
2.94
431.0971,237.0387,209.0438,193.0493,178.0257,165.0550,149.0597
Cimicifugic acid E
c44
[M + H]+
5.63
C15H16O6
292.0947
293.102
3.3
293.1010,275.0821,245.0328,233.0495,221.0452,219.0558,207.0241
Norcimifugin
c45
[M−H]-
5.66
C21H20O10
432.1056
431.0984
0.86
431.0980,237.0387,209.0441,193.0495,165.0551,149.0597
Cimicifugic acid F
c46
[M + Na]+
5.67
C35H54O11
650.3666
673.3558
4.97
673.3526,615.3017
15α-hydroxycimicidol-3-O-β-D-xyloside
c47
[M + H]+
5.72
C32H36O14
644.2105
645.2178
−7.32
645.2225,509.1534,469.1760,307.11122,177.0426
cimifugin-4′-O-[6″-feruloyl]-β-D-glucopyranoside
c48
[M + H]+
5.83
C21H20O10
432.1056
433.1129
−4.57
433.1149,389.1560,355.1377,177.0479
2-feruloyl piscidic acid
c49
[M−H]-
5.90
C27H30O16
610.1534
609.1461
6.08
609.1424,193.0474
Shomaside A
c50
[M + H]+
5.92
C18H19NO4
313.1314
314.1387
2.82
314.1378,177.0465,163.0222,149.0488,145.0189,117.0250
Ferulyltyramine
c51
[M + Na]+
5.98
C41H64O15
796.4245
819.4137
0.81
819.4131,559.1653,541.2964,467.2981
Heracleifolinoside A
c52
[M + H]+
6.05
C24H29NO8
459.1893
460.1966
3.47
460.1950,417.1166,298.1331,177.0596
Cimicifugamide D
c53
[M + H]+
6.37
C37H56O11
676.3823
677.3895
7.01
677.3848,467.3134,377.2423
Cimiracemoside A
c54
[M + H]±
6.42
C35H52O9
616.3611
617.3684
−1.44
617.3693,545.3123,467.3172,395.2528,251.1780
cimicidanol-3-O-α-L-arabinoside
c55
[M + H]+
6.45
C32H48O9
576.3298
577.3371
3.83
577.3349,559.3140,517.1793,445.2995, 427.2795
Cimicifugoside H-3
c56
[M−H]-
6.46
C22H22O10
446.1213
445.114
8.12
445.1104,207.0608,193.0439,165.0531,149.0622
Cimicifugic acid L
c57
[M−H]-
6.53
C18H16O7
344.0896
343.0823
2.69
343.0814,193.0496,178.0262,160.0136,149.0267134.0342
4′-Methoxyl-3′-hydroxy-carboxybenzoyl isoferulic acid anhydride
c58
[M + H]+
6.55
C32H48O9
576.3298
577.3371
2.1
577.3359,559.3140,541.2952,429.2795,517.1793,427.2939
Cimicifugoside H-4
c59
[M−H]-
6.55
C11H12O4
208.0736
207.0663
0.4
207.0662,163.1955
Methyl ferulate
c60
[M + H]+
6.56
C35H54O10
634.3717
635.379
1.38
635.3781,485.0014,467.3081,449.3117,377.2644
Cimicifugoside H-2
c61
[M + H]+
6.56
C30H42O5
482.3032
483.3105
8.09
483.3066,467.3124,449.3060,411.2396,395.2576,377.2521
(20R,24R)-24,25-epoxy-11β-hydroxy-7-en-9,19-cyclolanost-3,16,23-trione
c62
[M−H]-
6.59
C19H18O7
358.1053
357.098
5.24
357.0961,193.0462
Cimiracemate B
c63
[M−H]-
6.61
C19H18O7
358.1053
357.098
6.08
357.0958,193.0473
Cimiracemate A
c64
[M + H]+
6.71
C35H54O10
634.3717
635.379
−1.14
635.3797,485.3227,467.3017,395.2483
12β-hydroxy-7,8-didehydro-cimigenol 3-O-β-D-xylranoside
c65
[M + H]+
6.76
C35H54O9
618.3768
619.3841
1.23
619.3833,469.3291,451.3236,379.2673
(23R,24R)-16β,23;16α,24-diepoxy-cycloart-7-en-3β,11β,25-triol 3-O-β-D-xylranoside
c66
[M−H]-
7.02
C37H58O12
694.3928
693.3856
−0.79
693.3861,651.3833,633.3667
Cimidahuside C
c67
[M + H]+
7.03
C35H54O10
634.3717
635.379
0.59
635.3786,485.3494,467.3076
Tetrahydroxy-9,19-cycloart-7-en-16,23-dione 3-O-β-D-xylopyranoside
c68
[M + H]+
7.04
C37H56O11
676.3823
677.3895
0.35
677.3893,599.3612,581.3361,467.3121,449.3043,431.2786,421.2654
Actein
c69
[M + H]+
7.11
C35H54O10
634.3717
635.379
2.95
635.3771,599.3557,485.3288,467.3103,395.2479
12β-hydroxy-7,8-didehydrocimi-genol3-O-α-L-arabinopyranoside
c70
[M + H]+
7.25
C35H54O10
634.3717
635.379
−1.62
635.3800,485.3217,467.3205,395.0831
Cimiside A
c71
[M + Na]+
7.27
C37H58O12
694.3928
717.382
6.26
717.3823,587.3430,543.3204,483.3728
24-acetoxy-15,16-seco-cycloar-tane 3-O-xylopyranoside
c72
[M + H]+
7.45
C22H22O10
446.1213
447.1286
0.61
447.1283,429.1161,385.0902,349.0769,177.0519
2-feruloyl-piscidicacid-1-Methyl-ester
c73
[M + Na]+
7.47
C43H70O16
842.4664
865.4556
−1.65
865.4570,601.3193
3-arabinosyl-24-O-acetylhydroxyshengmanol-15-glucoside
c74
[M + H]+
7.48
C32H48O7
544.34
545.3473
5.48
545.3443,485.3156,467.3100,449.2808,413.2753,395.2456,335.0841
Acetylacteol
c75
[M + H]+
7.50
C37H56O11
676.3823
677.3895
0.8
677.3954,617.3755,599.3394,467.3147,449.3014
Cimiracemoside G
c76
[M + H]+
7.51
C37H56O11
676.3823
677.3895
−1.57
677.3906,659.3783,617.3655,599.3597,467.3135,449.3044
Acetylacteol 3-O-α-L-arabinopyranoside
c77
[M + Na]+
7.59
C37H60O11
680.4136
703.4028
1.3
703.4019,645.3986,513.3467,495.3471,435.3216,399.2261
24-epi-O-acetylhydro-shengmanol-3-O-α-L-arabinopyranoside
c78
[M + H]+
7.66
C37H56O10
660.3873
661.3946
0.19
661.3945,529.3335,469.3305,451.3191,397.2725,379.2655
23-O-aectyl-7,8-didehydroshengmanol 3-O-α-L-arabinopyranoside
c79
[M + Na]+
7.69
C43H68O16
840.4507
863.44
3.88
863.4367,803.4186,641.2327,623.3464
Cimdalglnoside E
c80
[M + Na]+
7.77
C41H64O14
780.4296
803.4188
0.42
803.4185,561.3389,543.3059
Heracleifolinoside B
c81
[M + Na]+
7.78
C37H60O12
696.4085
719.3977
−0.58
719.3981,643.3837,511.3358,493.3408,433.3139,397.2802,379.2629
24-epi-7β-hydroxy-24-O-acetylhydroshengmanol-3-O-xylopyranoside
c82
[M + Na]+
7.85
C43H70O16
842.4664
865.4556
2.5
865.4535,583.1544
3-xylosyl-24-O-acetylhydroxyshengmanol-15-glucoside
c83
[M + H]+
7.86
C39H58O11
702.3979
703.4052
−3.15
703.4074,643.3759,583.6599
15,23-O-diacetyl-7(8)-ene-shengmanol-3-O-α-L-arabinopyranoside
c84
[M + H]+
7.93
C35H54O9
618.3768
619.3841
1.71
619.3830,451.3103,379.2558
7,8-didehydroshengmanol 3-O-α-L-arabinopyranoside
c85
[M−H]-
7.93
C35H56O10
636.3873
635.3801
−1.46
635.381,577.3372
7β-hydroxycimigenol-3-O-β-D-xylopyranoside
c86
[M + Na]+
8.03
C30H48O6
504.3451
527.3343
9.14
527.3297,469.3289,451.3100
11β-hydroxy-24-epi-cimigenol
c87
[M + Na]+
8.05
C35H56O10
636.3873
659.3766
−3.82
659.3790,469.3275,451.3184,433.3022
(22R)-22β-hydroxycimigenol 3-O-β-D-xylopyranoside
c88
[M + Na]+
8.05
C43H70O16
842.4664
865.4556
2.26
865.4537,825.5850
Cimiside C
c89
[M + H]+
8.07
C39H58O11
702.3979
703.4052
0.27
703.4050,643.3757,451.3096,379.2580
Cimiricaside C
c90
[M + H]+
8.12
C37H56O10
660.3873
661.3946
0.79
661.3941,469.3013,451.3275,379.2492
Cimiricaside A
c91
[M + Na]+
8.13
C28H42O5
458.3032
481.2924
0.54
481.2953,399.1479,281.4802,363.1518
Cimilactone C
c92
[M + H]+
8.15
C30H42O6
498.2981
499.3054
−0.57
499.3057,483.3125,481.2667,465.2915,409.2915
1-en-cimigenol-3,11-dione
c93
[M + H]+
8.22
C35H54O9
618.3768
619.3841
0.42
619.3838,583.3763,451.3201,379.2619
7,8-didehydroshengmanol-3-O-β-D-xylranoside
c94
[M + Na]+
8.23
C35H56O10
636.3873
659.3766
−1.46
659.3775,601.3691,583.3649,451.3247,433.3106
12β-hydroxycimigenol 3-O-β-D-xylopyranoside
c95
[M + Na]+
8.25
C41H66O14
782.4453
805.4345
0.48
805.4341,487.3041,379.0277
Cimifoetiside A
c96
[M + Na]+
8.35
C41H66O14
782.4453
805.4345
−0.54
805.4349,729.7225
Cimifoetiside B
c97
[M + Na]+
8.36
C37H58O11
678.3979
701.3871
2.26
701.3856,643.3735,529.2819,397.2894
12β-Acetylcimigenol-3-O-β-D-xylopyranoside
c98
[M + H]+
8.39
C37H54O10
658.3717
659.379
0.87
659.3784,599.3584,467.3139
26-dedoxycimifugoside
c99
[M + Na]+
8.40
C43H68O16
840.4507
863.44
5.78
863.4351,643.2825,469.3335,451.3321
Heracleifolinoside F
c100
[M + H]+
8.41
C13H13NO
199.0997
200.107
7.99
200.1054,158.0579,130.0633
(E)/(Z)-3-(3′-methyl-2′-butenylidene)-2-indolinone
c101
[M + Na]+
8.43
C35H56O10
636.3873
659.3766
−4.76
659.3796,583.3684,451.3172,433.3026
12β-hydroxycimigenol 3-O-α-L-arabinopyranoside
c102
[M + Na]+
8.46
C41H66O14
782.4453
805.4345
6.36
805.4295,673.8314,511.3910
Cimifoetiside A
c103
[M + H]+
8.47
C38H58O11
690.3979
691.4052
−3.78
691.4078,659.4617,599.3723,559.8526,511.7646,163.1092
25-O-acetylcimigenol-galactopyranoside
c104
[M + H]+
8.52
C32H48O6
528.3451
529.3524
2.02
529.3513,511.3381,469.3312,493.3319,451.3220,397.2712
27-deoxyacetylacteol
c105
[M + H]+
8.62
C37H56O10
660.3873
661.3946
−0.87
661.3952,583.3620,529.3126,469.3300,451.3209
27-deoxyactein
c106
[M + Na]+
8.64
C35H56O9
620.3924
643.3817
1.54
643.3773,585.3712,453.3242,435.3182
Cimigenol-3-O-α-L-arabinoside
c107
[M + Na]+
8.65
C37H58O11
678.3979
701.3871
1.67
701.3875,433.3021
Cimiracemoside D
c108
[M + Na]+
8.72
C41H70O15
802.4715
825.4607
0.49
825.4603,663.4025,441.1997
Foetidinoside E
c109
[M + H]+
8.74
C37H54O9
642.3768
643.3841
−1
643.3847,583.3607,451.3196,73.0299
Asiaticoside B
c110
[M + H]+
8.81
C35H56O9
620.3924
621.3997
8.24
621.3946,603.3767,531.6037,399.7340
Cimidahuside G
c111
[M + Na]+
8.89
C35H56O9
620.3924
643.3817
−4.59
643.3845,511.3371,493.3290,433.3077
9,19-cyclolanostan-15-one,16,23-epoxy-24,25-dihydroxy-3-O-β-D-xylopyranosyloxy
c112
[M + Na]+
8.93
C30H46O6
502.3294
525.3187
−5.25
525.3213,467.3202,449.7901
12β-hydroxy-7(8)-ene-cimigenol
c113
[M + H]+
9.05
C37H56O11
676.3823
677.3895
2.72
677.3877,659.3754,467.3147,395.2513
(23R,24R)-16β;16α,24-diepoxy-3β,15α,24,25-tetrahydroxy-cycloart-7-en-16-one 3-O-β-D-xylranoside
c114
[M + Na]+
9.06
C38H62O12
710.4241
733.4133
0.63
733.4129,521.2268,274.0174
24-O-acetylhydroshengmanol-15-O-β-D-glucopyranoside
c115
[M + Na]+
9.23
C35H54O9
618.3768
641.366
−1.61
641.3670,583.3652,451.3157,433.3131
7,8-didehydrocimigenol-3-O-β-D-xyloside
c116
[M−H]-
9.31
C35H56O10
636.3873
635.3801
−0.52
635.3804,577.3451
7β-hydroxycimigenol-3-O-α-L-arabinopyranoside
c117
[M + Na]+
9.34
C35H54O9
618.3768
641.366
0.65
641.3656,583.3589,451.3095,433.1967
24-epi-7,8-didehydrocimigenol-3-O-β-D-xyloside
c118
[M + H]+
9.40
C35H54O8
602.3819
603.3891
2.07
603.3879,471.3451,453.3358
cimiside E
c119
[M + H]+
9.43
C37H58O10
662.403
663.4103
−1.4
663.4112,585.3743,453.3183,381.2805
25-O-acetylcimigenol-3-O-α-L-arabinoside
c120
[M + H]+
9.52
C35H54O9
618.3768
619.3841
−0.87
619.3846,583.3537,469.3257,451.3184,379.2622
24-epi-7,8-didehydroshengmanol 3-O-β-D-xylranoside
c121
[M + Na]+
9.56
C37H58O11
678.3979
701.3871
−2.01
701.3885,583.3498,451.3028
9,19-cyclocholest-7-en-16-one,23–(acetyloxy)-15,24,25-trihydroxy-4,4,14-trimethyl-3-(β-D-xylopyranoside)
c122
[M + H]+
9.58
C35H52O8
600.3662
601.3735
−0.67
601.3739,469.3987,451.3113
7,8-didehydro-25-anhydrocimigenol-3-O-β-D-xyloside
c123
[M + Na]+
9.61
C37H60O11
680.4136
703.4028
−0.91
703.4034,645.3696,471.7697
24-epi-O-acetylhydroshengmanol-3-O-β-D-xylopyranoside
c124
[M + H]+
9.62
C37H56O10
660.3873
661.3946
−2.54
661.3963,529.3515,397.2755,379.2629
23-O-aectyl-7,8-didehydroshengmanol 3-O-β-D-xylranoside
c125
[M + Na]+
9.64
C35H54O9
618.3768
641.366
1.79
641.3649,583.3639,451.3110,433.2977,361.2561
Cimiaceroside A
c126
[M + Na]+
9.64
C35H56O9
620.3924
643.3814
0.41
643.3773,585.3744,453.3264,435.3205
Cimigenol-3-O-β-D-xylopyranoside
c127
[M + Na]+
9.67
C30H48O5
488.3502
511.3394
−4.31
511.3415,453.3361,381.2701
Cimiacerin B
c128
[M + Na]+
9.80
C37H58O11
678.3979
701.3871
−3.49
701.3895,643.3696,625.3705,583.3683,469.2717,433.3019,397.2851
24-O-acetyl-7,8-didehydroshengmanol-3-O-β-D-xylopyranoside
c129
[M + H]+
9.83
C37H58O10
662.403
663.4103
−1.4
663.4112,435.3290
25-O-acetylcimigenol-3-O-β-D-xyloside
c130
[M + Na]+
9.98
C37H58O11
678.3979
701.3871
2.41
701.3855,643.3840,625.3740,583.3918,511.2949,451.3176,433.3107
24-epi-24-O-acetyl-7,8-didehydroshengmanol-3-O-β-D-xylopyranoside
c131
[M + H]+
9.99
C35H54O8
602.3819
603.3891
2.9
603.3874,471.3447,453.3337
25-anhydrocimigenol 3-O-α-L-arabinopyranoside
c132
[M + Na]+
9.99
C38H60O12
708.4085
731.3977
3.95
731.3949,671.3772,437.2936
Shengmaxinside C
c133
[M + H]+
10.10
C40H58O13
746.3877
747.395
0.69
747.3945,729.3976,663.6121,645.2409,585.1133,399.2086,459.1257
23-O-acetyl-7,8-didehydroshengmanol-3-O-(2′-O-malonyl)-xylopyranoside
c134
[M + Na]+
10.14
C37H60O11
680.4136
703.4028
1.89
703.4015,513.6137,453.3278,435.3353
24-O-acetylhydroshengmanol 3-O-β-D-xylranoside
c135
[M + Na]+
10.15
C37H58O10
662.403
685.3922
−3.14
685.3943,417.3166
23-O-aectylshengmanol 3-O-α-L-arabinopyranoside
c136
[M + H]+
10.17
C37H56O10
660.3873
661.3946
0.34
611.3944,511.3401,451.3112
25-O-aectyl-7,8-didehydroshengmanol 3-O-β-D-xylranoside
c137
[M + Na]+
10.22
C30H48O6
504.3451
527.3343
−0.77
527.3347,451.3041,379.2504
12β-hydroxycimigenol
c138
[M + Na]+
10.25
C30H46O6
502.3294
525.3187
−1.07
525.3192,509.2741,469.3266,451.3043,395.2541,377.2413
25-O-methylisodahurinol
c139
[M + Na]+
10.47
C37H58O10
662.403
685.3922
−0.42
685.3925,585.2524,453.0838,435.3009
23-O-aectylshengmanol 3-O-β-D-xylopyranoside
c140
[M + H]+
10.69
C39H60O11
704.4136
705.4208
0.91
705.4202,687.4135,672.9728,663.4734,654.9314,576.4683,175.0611,97.0278
Cimicifoetiside B
c141
[M + H]+
10.95
C30H46O5
486.3345
487.3418
−1.85
487.3427,451.3097
Acerinol
c142
[M + Na]+
10.98
C38H60O12
708.4085
731.3977
5.22
731.3940,709.3753,671.3772
24-epi-24-O-acetyl-7,8-didehydroshengmanol-3-O-β-D-galactopyranoside
c143
[M + Na]+
11.12
C30H46O5
486.3345
509.3237
4.41
509.3216,487.7508,451.3296
7,8-didehydrocimigenol
c144
[M + Na]+
11.32
C30H46O5
486.3345
509.3237
2.36
509.3226,451.3224,433.3098
24-epi-7,8-didehydrocimigenol
c145
[M + H]+
11.32
C37H56O10
660.3873
661.3946
2.01
661.3933,583.3693,511.3364,451.3220,397.2752,379.2606
25-O-aectyl-7,8-didehydroshengmanol 3-O-α-L-arabinopyranoside
c146
[M + Na]+
11.47
C30H48O5
488.3502
511.3394
4.5
511.3372,453.3105
Cimigenol
c147
[M + H]+
11.52
C30H46O4
470.3396
471.3469
4.65
471.3447,453.3372,435.3134,399.5863
25-dehydrocimigenol
c148
[M + H]+
11.55
C37H58O10
662.403
663.4103
−1.4
663.4112,585.3681,435.3177,399.2918,363.2552
23-O-acetylcimigenol-3-O-α-L-arabinoside
c149
[M + Na]+
11.57
C30H46O5
486.3345
487.3418
0.62
487.3415,433.2859
24-epi-acerinol
c150
[M + Na]+
11.60
C33H52O7
560.3713
583.3605
0.76
583.3601,565.3556,451.3165,433.3082,415.2965
24-O-acetyl-25-O-methyl-7,8-didehydrohydroshengmanol
c151
[M + H]+
11.87
C30H44O5
484.3189
485.3262
4.65
485.3239,467.3118,449.2977,431.2894,413.2660,395.2549
Cimicidanol
c152
[M + H]+
12.42
C32H48O6
528.3451
529.3524
0.88
529.3519,511.3238,451.3170,379.2641
24-O-acetylshengmanol-7(8)-en-isodahurinol
c153
[M + Na]+
12.77
C30H48O5
488.3502
511.3394
−1.85
511.3403,453.3288
24-epi-cimigenol
c154
[M + H]+
13.22
C30H46O5
486.3345
487.3418
−1.85
487.3427,451.3375,433.3026,379.2639,361.2381
Cimigenol-3-one
c155
[M + H]+
13.52
C32H48O6
528.3451
529.3524
−0.25
529.3525,511.4804,493.2909,469.3150,451.3273,379.2400
25-O-acetyl-7,8-didehydrocimigenol
c156
[M + Na]+
13.52
C32H50O7
546.3557
569.3449
0.69
569.3445,551.3723,491.4781
12β-acetoxycimigenol
c157
[M + Na]+
14.13
C32H50O6
530.3607
553.35
0.3
553.3481,493.3280,439.3307
25-O-acetylcimigenol
3.2.2 Identification of triterpenoid saponins
Triterpenoid saponins were the primary bioactive components of CR. Up to date, approximately 400 triterpenoid saponins (mostly 9,19-cycloartane type) had been discovered and characterized from the Cimicifuga genus. In our study, total 101 constituents had been identified by means of UHPLC-Q-TOF-MS based on the above approach. Most triterpenoid saponins were liable to form [M + H]+ ion and [M + Na]+ ion in positive mode. The main cleavage pathways of triterpenoid saponins were prone to lose water, acetyl groups, dimethylethylene oxide and the glycosyl groups, resulting in neutral losses of 18.01 Da, 60.02 Da, 72.01 Da, 132.05 Da, 162.05 Da. The following were examples of the conventional fragmentation pathways for triterpenoid saponins.
The main cleavage pathway of cimigenol-type of triterpenoid saponins was to lose water, the glycosyl groups and was prone to twist to form dimethylethylene oxide. Compound c106 cimigenol-3-O-α-L-arabinoside had a [M + Na]+ peak at m/z 643.38 (1.54 ppm). Then m/z 585.37 ([M + H − 2H2O]+) and m/z 453.32 ([M + H − 2H2O − Ara]+) were formed after successively removing two molecules of water (36.02 Da) and arabinose (132.05 Da). And m/z 435.31 ([M + H − 3H2O − Ara]+) was also detected after removing a molecule of water (Fig. 2). In the positive mode, the precursor ion of compound c126 cimigenol-3-O-β-D-xyloside was m/z 643.38 [M + Na]+, and the molecular formula was presumed to be C35H56O9. m/z 567.36, m/z 495.35, m/z 363.26 were generated successively with continuous water loss, dimethylethylene oxide and xylopyranose. Compound c69 12β-hydroxy-7,8-didehydrocimigenol 3-O-α-L-arabinopyranoside had a [M + H]+ at m/z 635.37 (2.95 ppm). In the secondary mass spectrometry, fragments of m/z 617.37 [M + H − H2O]+, m/z 599.36 [M + H − 2H2O]+, m/z 545.31 [M + H − H2O − C4H8O]+, m/z 467.31 m/z [M + H − 2H2O − Ara]+ and m/z 377.26 [M + H − 3H2O − Ara − C4H8O]+ were produced (Pang et al., 2021).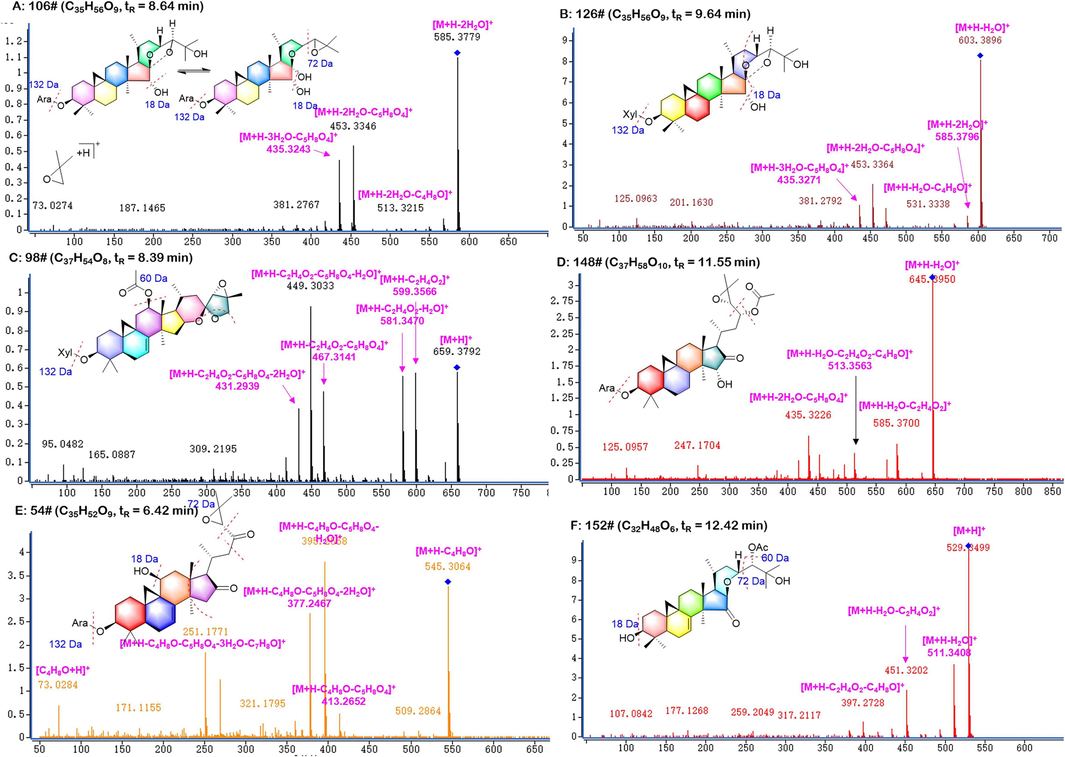
Illustration for the structural elucidation of triterpenoid saponins CR.
The main feature of 16,23-diketo-type is that the C-16 and C-23 positions both are oxidized to carbonyls, and partially dehydrated to form a ternary oxygen ring structure at C-24 and C-25 positions. Therefore, this type of compounds is extremely easy to remove dimethylethylene oxide and produce highly responsive m/z 73 [C4H8O + H]+. The [M + H]+ peak of compound c54 cimicidanol-3-O-α-L-arabinoside was at m/z 617.36 (−1.44 ppm). Aglycones were produced with dimethylethylene oxide, arabinose and continuous water losses to generate fragments of m/z 545.31 [M + H − C4H8O]+, m/z 467.31 [M + H − H2O − Ara]+, m/z 395.25 [M + H − H2O − C4H8O − Ara]+ and m/z 251.17 [M + H − 3H2O − C4H8O − Ara − C7H8O]+ (Fig. 2). From above, compound c151 was speculated as cimicidanol according to the fragments of m/z 485.32 [M + H]+, m/z 413.27 [M + H − C4H8O]+, m/z 395.25 [M + H − H2O − C4H8O]+. Compound c60 was identified as cimicifugoside H-2 (tR = 6.561, C35H54O10), as lost a xylopyranose (132.05 Da) and a molecule of dimethylethylene oxide (72.01 Da) and continuous water (n∙18.01 Da) at positive conditions (Cao et al., 2005, Li et al., 2007).
Shengmanol-type of Cimicifugae Rhizoma contains acetyl groups and dimethylethylene oxide at the end of carbon chain, which are easily lost in secondary mass spectrometry. The MS2 spectrum of 23-O-acetylcimigenol-3-O-α-L-arabinoside (consistent with peak 148, tR = 11.55 min) was showed the precursor ion at m/z 663.41 [M + H]+. The fragments at m/z 585.36 and 435.31 indicated the elimination of C2H4O2, Ara and three molecules of water. A serious of fragments at m/z 529.3, 469.3, 451.3, 397.2 were both found in peak 78 and 152, indicating that those two compounds had the same skeleton and highly similar in structures. Therefore, they were identified as 23-O-aectyl-7,8-didehydroshengmanol 3-O-α-L-arabinopyranoside and 24-O-acetylshengmanol-7(8)-en-isodahurinol, respectively.
3.2.3 Identified of phenylpropanoids
A total of 49 phenylpropanoids were tentatively identified in the positive and negative mode. The compound of c13, c32 and c36 were orderly identified as caffeic acid, ferulic acid and isoferulic acid by comparing the authentic standards, which cleavage pathways were specified in Fig. 3. The fragment of phenolic acids was characterized by neutral losses of 15.02 Da (–CH3), 18.01 Da (–H2O) and 44.01 Da (–CO2). Based on the same fragment ions m/z 179.03,135.04 as caffeic acid, peak 6 (tR = 2.518 min, C15H18O9) was characterized as caffeic acid 4-O-β-D-glucopyranoside.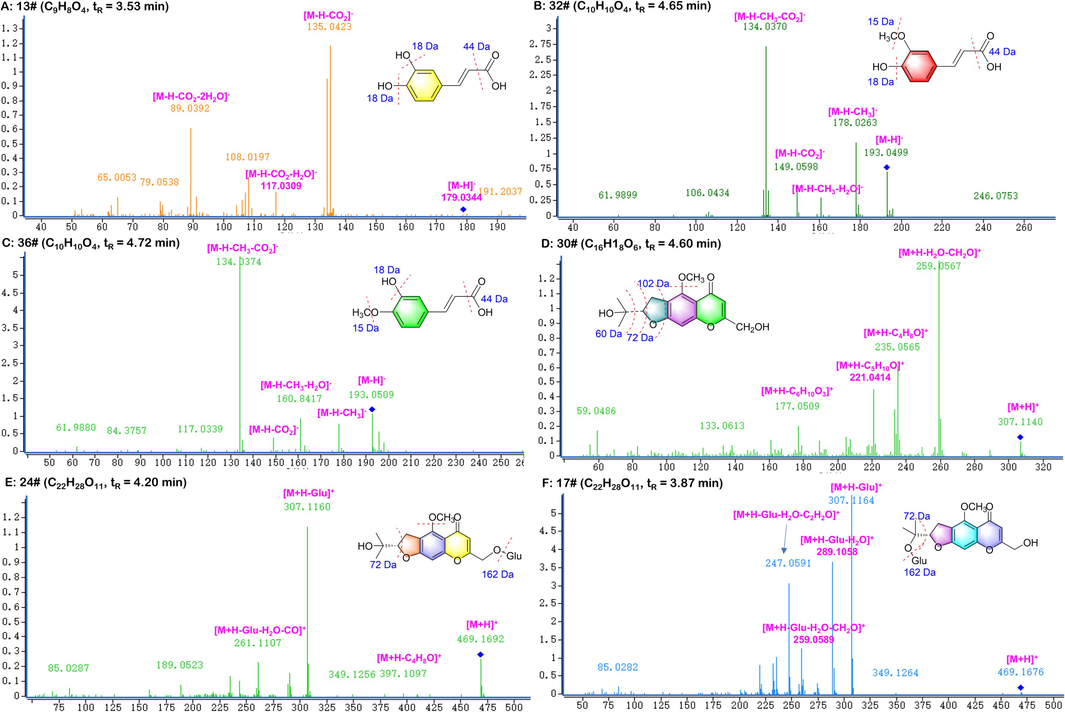
Illustration for the structural elucidation of phenylpropanoids and chromones from CR.
Cimicifugic acids mainly generate signal responses in positive ion mode and were prone to neutral losses such as CO2, CO, H2O, and CH3. Due to the carbon chains of these components contained hydroxyl and carboxyl groups, they were easy to fracture on the carboxyl group oxygen in collision energy spectra. A fragment response at m/z 177 was likely to occur when methoxy group was present on the benzene ring at the same time. Peak 19 (tR = 3.96, C26H30O12) was regarded as cimicifugaside F attributing to the fragment ions m/z 535.18, m/z 517.21, m/z 491.29 and m/z 163.07. According to the ions m/z 433.11, m/z 389.16, m/z 355.14, m/z 177.05, peak 48 (tR = 5.83, C21H20O10) was identified as 2-feruloyl piscidic acid. Compared with the literature, peaks 1, 2, 39 and 40 were successively identified as fukiic acid, piscidic acid, cimicifugic acid A and cimicifugic acid B (Werner and Petersen, 2019).
3.2.4 Identification of chromones
The primary type of chromones was furan chromones with methoxy, hydroxyl and glucose substituents. Compound c30 was regarded as cimifugin, displayed a precursor ion [M + H]+ at m/z 307.12; the main fragment ions were observed at m/z 289.11 [M + H − H2O]+, m/z 259.06 [M + H − H2O − 2CH3]+ and m/z 235.06 [M + H − C4H8O]+. The derivatives of cimifugin were liable to remove a molecule of sugar to produce m/z 307. According to the fragment ions m/z 307, m/z 289, m/z 259, m/z 235, peak 17 and 24 were identified as cimifugin-4′-O-β-D-glucose and cimicifugoside consistent with the standards’ ions. In the meantime, 14 Da difference was detected between cimifugin and peak 43 (C15H16O6). It was explicitly identified as norcimifugin with the same natural losses H2O, C3H6O, C2H2, CH2.
3.2.5 Identification of compounds in C. foetida and C. dahurica
The chemical compositions identification of C. foetida and C. dahurica was a basis for screening potential differential components. The TIC of the two species both in positive and negative modes were shown in Fig. 4. In this work, a total of 88 chemical components were ultimately authenticated in the methodology of metabolomics referring to the above qualitative analysis, including 65 from C. foetida and 75 from C. dahurica (Table S4). According to the constituents identified from the two species, there were significant differences in composition and content between them.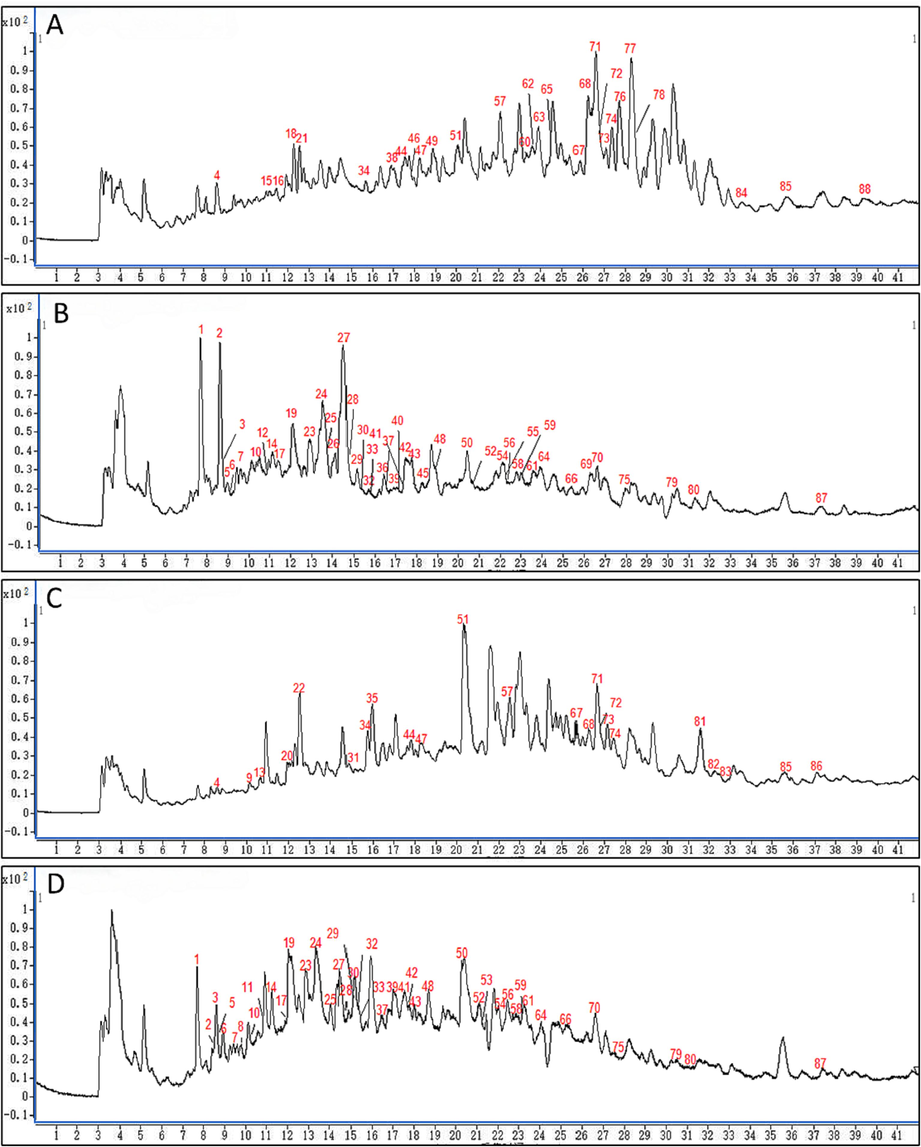
The total ion chromatograms (TIC) of the two species in positive and negative modes. (A) TIC of C. dahurica in positive MS mode; (B) TIC of C. dahurica in negative MS mode; (C) TIC of C. foetida in positive MS mode; and (D) TIC of C. foetida in negative MS mode.
A comprehensive insight into the secondary metabolites of various species in TCMs is vital for further metabolomics analysis. The DDA mode could maximize the MSn information collection, greatly reducing the difficulty of acquiring low abundant components (Zuo et al., 2019). And the CIF platform was established to rapidly analyze and match a compound from a large amount of MSn information during the data processing stage. Based on this, a total of 157 compounds were tentatively characterized in CR, including 101 triterpenoid saponins, 44 phenylpropanoids and 7 chromones. Compared with previous composition analysis methods, this strategy is more rapid, accurate and efficient, which could become the principal method to identify compounds soon. Furthermore, strengthening this method development and application to provide a practical strategy for characterizing non-targeted metabolites in TCMs.
3.3 Metabolomic analysis for discrimination of C. foetida and C. dahurica
The retention time and peak area of ten randomly selected ion pairs in QC samples were acquired to verify the UHPLC-Q-TOF-MS method. The relative standard deviations (RSDs) of them were less than 5.0 %, indicating the accuracy and reliability of this analytical method. All QC samples were closely clustered into a group in PCA, demonstrating the reproducibility of the analytical system (Fig. 5A and B).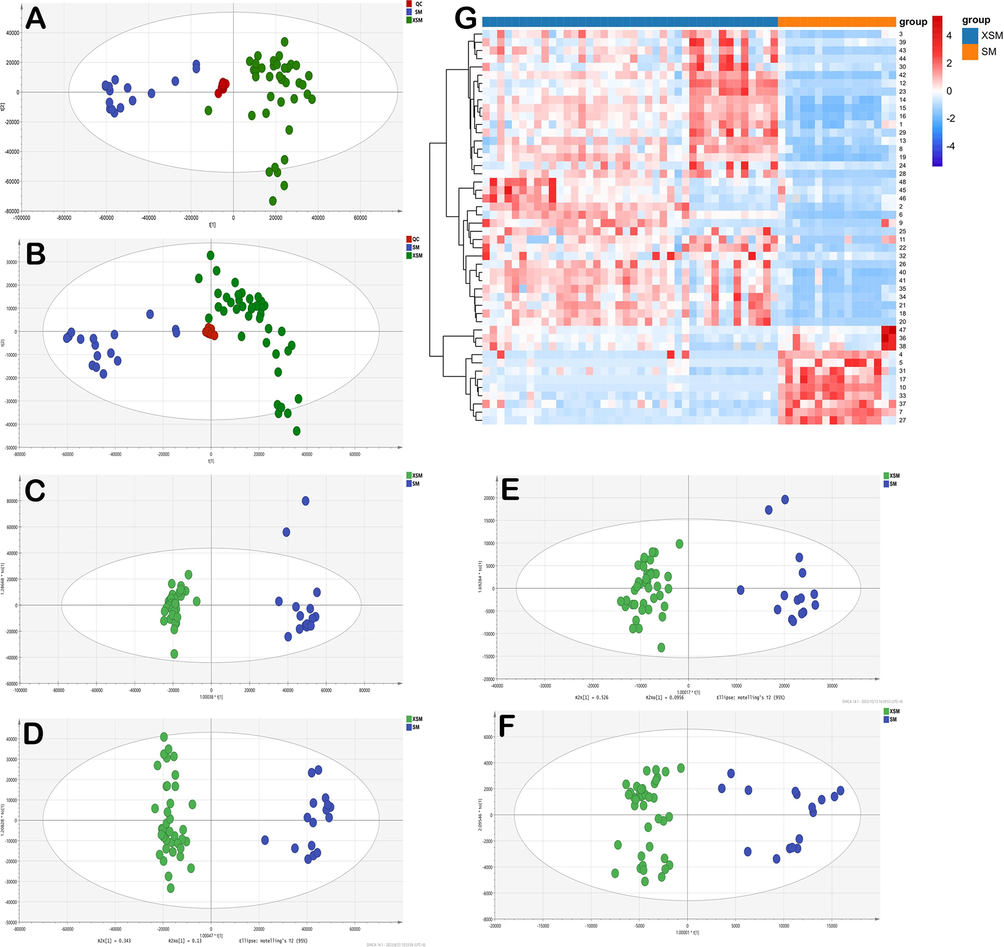
Multivariate statistical analyses of the two species: PCA score plot in positive mode (A); PCA score plot in negative mode (B); OPLS-DA score plot (C: 2955 ionic characteristic variables in positive mode, D: 2976 ionic characteristic variables in negative mode, E: 48 compounds characteristic variables, F: 4 combinatorial discriminatory quality markers); heat-map in two species(G).
Metabolomics analysis exhibited excellent properties on screening the differential components in natural products. Total 2955 and 2976 ionic characteristic variables were obtained in positive and negative mode, respectively. The unsupervised model PCA and supervised model OPLS-DA were performed to differentiate the two species in metabolite levels with high fitting and prediction degree. The results showed that the samples from the two species were successfully separated into two distinct clusters in PCA with high fitting and predictive abilities both in positive and negative mode (Fig. 5A and B). The 2955 metabolic variables in positive mode were evidently classified the samples into two groups with a goodness-of-fit R2Y = 0.983 and goodness-of-prediction Q2 = 0.95 (Fig. 5C). The 2976 metabolic variables in negative mode had the similar result with R2Y = 0.972 and Q2 = 0.935 (Fig. 5D). To better classify and account for the two species, variable importance in projection (VIP) combined with t-test were applied in OPLS-DA mode for significance testing. In this work, about 48 distinctive components were screened and identified between the two species based on analyzing the criteria of VIP > 1 and p < 0.05, including triterpenoid saponins, phenylpropanoids and chromones (Table 3). The 48 compounds characteristic variables could distinguish the samples into two groups in OPLS-DA model (Fig. 5E) and the results were visualized in the Heatmap (Fig. 5G). Among these compounds, the content of 12 components, such as cimifugin-4′-O-β-D-glucose (4), cimicifugoside (5), caffeic acid (7), cimifugin (10), norcimifugin (17) and 26-dedoxycimifugoside (31) were generally higher in C. foetida, while others were higher in C. dahurica. All of the above highlighted significant differences in composition and content between C. foetida and C. dahurica. In addition, relevant studies have shown that C. foetida has significant effects in antidiarrheal, anticomplementary and menopausal syndrome effects (Qiu et al., 2006, Zheng et al., 2013, Zhang et al., 2016), while C. dahurica has better antioxidant, neuroprotective and antibacterial effects (Qin et al., 2016, Lee et al., 2020, Li et al., 2023). Therefore, it is necessary to conduct differential analysis between the two species in order to apply it more clearly in clinical practice.
No.
Component
VIP
p values
1
Fukiic acid
5.36
2.35E-06
2
Methyl caffeate
1.11
1.97E-04
3
Shomaside A
1.47
2.70E-06
4
Cimifugin-4′-O-β-D-glucose
2.39
6.58E-07
5
Cimicifugoside
5.32
1.28E-07
6
Shomaside G
3.06
4.35E-11
7
Caffeic acid
3.08
4.91E-21
8
Isocimicifugamide
1.35
4.61E-10
9
Shomaside B
1.05
1.05E-03
10
Cimifugin
9.99
1.06E-14
11
Cimicifugic acid A/B
3.57
6.83E-03
12
2-feruloyl fukinolic acid-1-metyl ester
1.63
9.27E-06
13
Ferulic acid
3.49
8.31E-06
14
Isoferulic acid
4.03
1.57E-10
15
Cimicifugic acid E/F
7.70
8.67E-16
16
Cimicifugic acid E/F
2.70
1.76E-13
17
Norcimifugin
3.13
2.36E-11
18
12β-acetylcimigenol-3-O-β-D-xylopyranoside
2.18
3.01E-08
19
Cimicifugic acid L
2.28
4.62E-17
20
9,19-cyclocholest-7-en-16-one,23–(acetyloxy)-15,24,25-trihydroxy-4,4,14-trimethyl-3-(β-D-xylopyranoside)
2.04
7.58E-07
21
Cimicifugoside H-2
3.10
1.06E-08
22
23-O-aectyl-7,8-didehydroshengmanol 3-O-α-L-arabinopyranoside
1.67
4.18E-07
23
Actein
2.19
1.43E-07
24
Cimiracemoside A
1.26
1.87E-02
25
7β-hydroxycimigenol-3-O-β-D-xylopyranoside
5.34
2.21E-05
26
12β-hydroxycimigenol-3-O-β-D-xylopyranoside
5.96
8.52E-08
27
24-epi-24-O-acetyl-7,8-didehydroshengmanol-3-O-β-D-galactopyranoside
1.43
1.38E-13
28
7,8-didehydrocimigenol 3-O-β-D-xyloside
4.53
5.59E-09
29
7β-hydroxycimigenol-3-O-α-L-arabinopyranoside
2.60
1.65E-05
30
(22R)-22β-hydroxycimigenol 3-O-β-D-xylopyranoside
2.12
6.39E-03
31
26-dedoxycimifugoside
3.15
1.14E-08
32
7,8-didehydroshengmanol-3-O-β-D-xylranoside
1.09
1.56E-02
33
Cimiricaside A
5.43
1.26E-12
34
12β-hydroxycimigenol-3-O-α-L-arabinopyranoside
1.06
2.22E-06
35
asiaticoside B
6.55
8.90E-08
36
25-O-acetylcimigenol-3-O-β-D-xyloside
2.69
2.56E-02
37
25-O-acetylcimigenol-3-O-α-L-arabinoside
2.26
8.11E-08
38
Cimiside E
2.24
1.06E-02
39
7,8-didehydro-25-anhydrocimigenol-3-O-β-D-xyloside
5.18
2.00E-02
40
Cimiricaside C
1.78
2.93E-09
41
24-O-acetyl-7,8-didehydroshengmanol-3-O-β-D-xylopyranoside
4.72
2.59E-07
42
23-O-aectyl-7,8-didehydroshengmanol 3-O-β-D-xylranoside
1.27
1.06E-12
43
23-O-acetyl-7,8-didehydroshengmanol-3-O-(2′-O-malonyl)-xylopyranoside
6.43
1.19E-06
44
15,23-O-diacetyl-7(8)-ene-shengmanol-3-O-α-L-arabinopyranoside
2.25
1.55E-03
45
11β-hydroxy-24-epi-cimigenol
1.13
2.87E-02
46
24-O-acetylshengmanol-7(8)-en-isodahurinol
2.09
1.56E-02
47
25-O-acetylcimigenol
1.45
9.47E-03
48
12β-acetoxycimigenol
1.40
2.18E-03
Considering the above content differences and the screening principle of biomarkers: 1) the markers are convenient to obtain and quantify; 2) the markers can clearly distinguish between the two original CR; 3) the specific components in CR (Cui et al., 2022, Lu et al., 2022). Caffeic acid, cimifugin, ferulic acid and isoferulic acid were ultimately screened as potential combinatorial discriminatory quality markers. The two species were significantly divided into two groups by the four markers in OPLS-DA model with high fitting and predictive abilities (Fig. 5F). Furthermore, the grouping accuracy were verified based on AdaBoost and KNN algorithms by Matlab R2022A software. The sample SM-1, 4–14, XSM-1, 2, 7–25 were screened as the training set while others were the testing set at random. The accuracy of variables in different groups were above 83.3 %, which proved the correctness of OPLS-DA model grouping and verified the existence of differences between the two Cimicifuga species (Table 4).
Algorithms
Different amounts of variables
2955 (+)
2976 (−)
48
4
AdaBoost
87.5 %
95.8 %
83.3 %
95.8 %
KNN
91.7 %
91.7 %
100 %
91.7 %
3.4 The verification of the potential bioactive markers
Four combinatorial discriminatory quality markers were quantitatively analyzed by HPLC-DAD with high efficiency and generality. It was indicated that the contents of the four markers from 56 batches were totally different, which may contribute to the differentiation of the species. The repeatability, stability and precision of the four compounds were less than 5.0 % and recoveries were between 96.1 % and 103 % with all RSD values less than or equal to 5.55 %. The correlation coefficients of the linear equations higher than 0.99 and the lower limit of quantitation (LOQ) were 0.08 μg/mL of caffeic acid and cimifugin, 0.048 μg/mL of ferulic acid and 0.16 μg/mL of isoferulic acid, respectively (Table S5). It demonstrated a good linear relationship between these four compounds within their respective concentration ranges. The content of four combinatorial discriminatory quality markers of 56 batches were obtained (Table S6) and the intuitive chart was shown in Fig. 6. In summary, the established HPLC-DAD quantitative analysis for four markers was unequivocally accurate and reliable.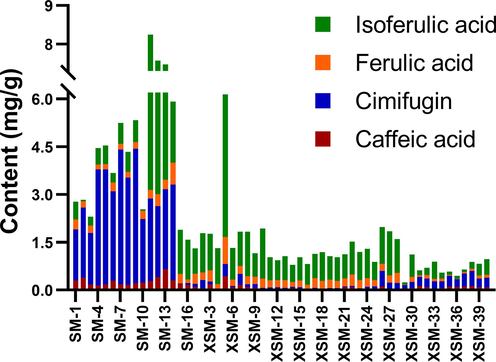
The contents chart of four markers in all batches of samples.
Fisher discriminant model was established to classify unknown samples using SPSS software in terms of the above contents of four combinatorial discriminatory quality markers. The twenty batches (including SM-2, 4, 5, 6, 7, 8, 9, 11, 13, 14, XSM-2, 10, 14, 15, 17, 18, 21, 22, 24, 28) were randomly chosen as training sets and the fifteen batches (SM-1, 10, 15, XSM-1, 3, 4, 5, 6, 7, 8, 9, 16, 19, 23, 25) were test sets. The discriminant equation was derived as follows: Y = 7.029X1 + 1.637X2 − 0.193X3 − 0.125X4 − 3.613 (Y: discriminant score; X1: caffeic acid; X2: cimifugin; X3: ferulic acid; X4: isoferulic acid). The unknown samples will be classified as C. foetida when the discriminant score is higher than the determination value 0 (the average of 3.188 and −3.188 at the group centroids), if not it will be considered as C. dahurica. In addition, the other 21 batches were utilized to the test sets in order to verify the discrimination ability. The results displayed that the accuracy of classification was 94.4 % in cross-validation group demonstrating high feasibility of this model. The batches were correctly grouped by the discriminant model except two samples. Apart from a little higher content of isoferulic acid, the other three components are generally lower in the two batches.
It was suggested that the four combinatorial discriminatory quality markers could distinguish C. foetida and C. dahurica with high accuracy. The content of ferulic acid in C. foetida was higher than that in C. dahurica, while isoferulic acid was the opposite. Caffeic acid was three times higher in C. foetida than in C. dahurica. Moreover, cimifugin was significantly different between the two species, and it was nearly 16 times higher in C. foetida than in C. dahurica. These differences in the composition of secondary metabolites might be attributed to genetic nuances. Consequently, the contents of four markers will be measured and substituted into the discrimination model so as to differentiate the unknown samples. All above indicated that metabolomics techniques can be applied to distinguish different species from the perspective of compositional differences.
4 Conclusion
This study presented an integrated technique to differentiate closely related TCMs as a case of C. foetida and C. dahurica cultivars based on DNA barcoding and metabolomics by UHPLC-Q-TOF-MS. After obtaining the useable DNA sequences, the sequence similarity of ITS2, genetic distance and phylogenetic tree were examined using DNA barcoding technology. As a result, C. foetida and C. dahurica were identified by the variation sites of ITS2 in terms of genetic features. One hundred and fifty-seven chemical components were characterized by UHPLC-Q-TOF-MS in DDA scanning mode. There were forty-eight differential components between C. foetida and C. dahurica. Four of them were totally screened and validated as combinatorial discriminatory quality markers for the differentiation of the two species. It was concluded that the DNA barcoding combined with metabolomics technique was verified to discriminate the original plant species of CR. The technique provides a method to comprehensively and accurately screen differential components of the similar species of CR, and is expected to play an extremely important role in the classification and identification of TCMs in future research.
CRediT authorship contribution statement
Qianqian Zhang: Investigation, Methodology, Writing – original draft, Data curation. Shujing Chen: Methodology, Software. Jiake Wen: Conceptualization, Data curation. Rui Wang: Validation, Visualization. Jin Lu: Conceptualization. Abdulmumin Muhammad-Biu: Methodology. Shaoxia Wang: Resources. Kunze Du: Investigation, Writing – review & editing, Project administration. Wei Wei: Formal analysis. Xiaoxuan Tian: Resources. Jin Li: Resources. Yanxu Chang: Conceptualization, Resources, Writing – review & editing, Project administration.
Acknowledgments
This work was supported by the Science and Technology Program of Tianjin in China (23ZYJDSS00030), and Special Program of Talents Development for Excellent Youth Scholars in Tianjin
Declaration of competing interest
The authors declare that they have no known competing financial interests or personal relationships that could have appeared to influence the work reported in this paper.
References
- Metabolomics and DNA-based authentication of two traditional asian medicinal and aromatic species of Salvia subg. Perovskia. Cells. 2021;10
- [CrossRef] [Google Scholar]
- Non-target metabolomics based on high-resolution mass spectrometry combined with chemometric analysis for discriminating geographical origins of Rhizoma Coptidis. Microchem. J.. 2021;160
- [CrossRef] [Google Scholar]
- Characterization and quantification of ginsenosides from the root of Panax quinquefolius L. by integrating untargeted metabolites and targeted analysis using UPLC-Triple TOF-MS coupled with UFLC-ESI-MS/MS. Food Chem.. 2022;384
- [CrossRef] [Google Scholar]
- Chinese Pharmacopoeia Commission (the first part), 2020. Chinese Pharmacopoeia. PRC. Chinese Medical Science and Techn, Beijing, pp. 75–76.
- A comprehensive strategy integrating metabolomics with multiple chemometric for discovery of function related active markers for assessment of foodstuffs: A case of hawthorn (Crataegus cuneata) fruits. Food Chem.. 2022;383:132464
- [CrossRef] [Google Scholar]
- Cimifugin suppresses NF-kappa B Signaling to prevent osteoclastogenesis and periprosthetic osteolysis. Front. Pharmacol.. 2021;12
- [CrossRef] [Google Scholar]
- Metabolomics investigation on antiobesity effects of Corydalis bungeana on high-fat high-sugar diet-induced obese rats. Chin. Herb. Med.. 2022;14:414-421.
- [CrossRef] [Google Scholar]
- DNA mini-barcoding: A derived barcoding method for herbal molecular identification. Front. Plant Sci.. 2019;10:987.
- [CrossRef] [Google Scholar]
- Inspecting the true identity of herbal materials from Cynanchum using ITS2 barcode. Front. Plant Sci.. 2017;8
- [CrossRef] [Google Scholar]
- Qualitative and quantitative evaluation of Flos Puerariae by using chemical fingerprint in combination with chemometrics method. J. Pharm. Anal.. 2022;12:489-499.
- [CrossRef] [Google Scholar]
- Comprehensive profiling of Lingzhihuang capsule by liquid chromatography coupled with mass spectrometry-based molecular networking and target prediction. Acupunct. Herb. Med.. 2022;2:58-67.
- [CrossRef] [Google Scholar]
- Protective effects of compounds from Cimicifuga dahurica against amyloid beta production in vitro and scopolamine-induced memory impairment in vivo. J. Nat. Prod.. 2020;83:223-230.
- [CrossRef] [Google Scholar]
- Triterpenoids from Cimicifugae rhizoma, a novel class of inhibitors on bone resorption and ovariectomy-induced bone loss. Maturitas. 2007;58:59-69.
- [CrossRef] [Google Scholar]
- Antibacterial actions of Ag nanoparticles synthesized from Cimicifuga dahurica (Turcz.) Maxim. and their application in constructing a hydrogel spray for healing skin wounds. Food Chem.. 2023;418:135981
- [CrossRef] [Google Scholar]
- Characterization of chemical components of Periplocae Cortex and their metabolites in rats using ultra-performance liquid chromatography coupled with quadrupole time-of-flight mass spectrometry. Biomed. Chromatogr.. 2020;34
- [CrossRef] [Google Scholar]
- Discovery of potential Q-marker of traditional Chinese medicine based on plant metabolomics and network pharmacology: Periplocae Cortex as an example. Phytomedicine. 2021;85
- [CrossRef] [Google Scholar]
- Multimodal integrated strategy for the discovery and identification of quality markers in traditional Chinese medicine. J. Pharm. Anal.. 2022;12:701-710.
- [CrossRef] [Google Scholar]
- New phenylpropanoid allopyranosides from the rhizomes of Cimicifuga dahurica. ACS Med. Chem. Lett.. 2019;29:1774-1778.
- [CrossRef] [Google Scholar]
- New monoterpene lactones from Actaea cimicifuga. Planta Med.. 2013;79:308-311.
- [CrossRef] [Google Scholar]
- Analysis of chemotypes and their markers in leaves of core collections of Eucommia ulmoides using metabolomics. Front. Plant Sci.. 2023;13
- [CrossRef] [Google Scholar]
- Three new cycloart-7-ene triterpenoid glycosides from Cimicifuga dahurica and their anti-inflammatory effects. Nat. Prod. Res.. 2021;35:3634-3643.
- [CrossRef] [Google Scholar]
- Systematically identifying the anti-inflammatory constituents of Cimicifuga dahurica by UPLC-Q/TOF-MS combined with network pharmacology analysis. Biomed. Chromatogr.. 2021;35
- [CrossRef] [Google Scholar]
- Polyphenolic compounds with antioxidant potential and neuro-protective effect from Cimicifuga dahurica (Turcz.) Maxim. Fitoterapia. 2016;115:52-56.
- [CrossRef] [Google Scholar]
- Anticomplement activity of cycloartane glycosides from the rhizome of Cimicifuga foetida. Phytother. Res.. 2006;20:945-948.
- [CrossRef] [Google Scholar]
- Analysis of antidepressant activity of Huang-Lian Jie-Du decoction through network pharmacology and metabolomics. Front. Pharmacol.. 2021;12
- [CrossRef] [Google Scholar]
- Combining multidimensional chromatography-mass spectrometry and feature-based molecular networking methods for the systematic characterization of compounds in the supercritical fluid extract of Tripterygium wilfordii Hook F. Analyst. 2023;148:61-73.
- [CrossRef] [Google Scholar]
- Identification of Cimicifugae Rhizoma and its adulterants using ITS2 sequence. China J. Chinese Mater. Med.. 2014;39:2184-2188.
- [CrossRef] [Google Scholar]
- Comparison of data-dependent acquisition, data-independent acquisition, and parallel reaction monitoring in trapped ion mobility spectrometry–time-of-flight tandem mass spectrometry-based lipidomics. Anal. Chem.. 2023;95:9488-9496.
- [CrossRef] [Google Scholar]
- Rapidly discriminate commercial medicinal Pulsatilla chinensis (Bge.) Regel from its adulterants using ITS2 barcoding and specific PCR-RFLP assay. Sci. Rep.. 2017;7
- [CrossRef] [Google Scholar]
- Soluble epoxide hydrolase inhibitors of indolinone alkaloids and phenolic derivatives from Cimicifuga dahurica (Turcz.) Maxim. ACS Med. Chem. Lett.. 2017;27:1874-1879.
- [CrossRef] [Google Scholar]
- Authentication of Zingiber species based on analysis of metabolite profiles. Front. Plant Sci.. 2021;12
- [CrossRef] [Google Scholar]
- Current policies and measures on the development of Traditional Chinese Medicine in China. Pharmacol. Res.. 2021;163:105187
- [CrossRef] [Google Scholar]
- A BAHD hydroxycinnamoyltransferase from Actaea racemosa catalyses the formation of fukinolic and cimicifugic acids. Planta. 2019;250:475-485.
- [CrossRef] [Google Scholar]
- Wurihan, Aodungerle, Bilige, et al., 2022. Metabonomics study of liver and kidney subacute toxicity induced by garidi-5 in rats. Chin Herbal Med. 14, 422-431. https://doi.org/10.1016/j.chmed.2022.05.003.
- Difference analysis of different parts of chicory based on HPLC fingerprint and multi-component content determination. Chin. Herb. Med.. 2022;14:317-323.
- [CrossRef] [Google Scholar]
- Non-targeted metabolomics reveals distinct chemical compositions among different grades of Bai Mudan white tea. Food Chem.. 2019;277:289-297.
- [CrossRef] [Google Scholar]
- Experimental studies of the anti-diarrhea effect of Cimicifuga foetida. Acta Chin. Med. Pharm.. 2016;44:21-23.
- [CrossRef] [Google Scholar]
- Shengxian decoction in chronic heart failure treatment and synergistic property of platycodonis radix: a metabolomic approach and its application. Mol. Biosyst.. 2014;10
- [CrossRef] [Google Scholar]
- Research progress on quality markers of traditional Chinese medicine. J. Pharm. Biomed. Anal.. 2022;211:114588
- [CrossRef] [Google Scholar]
- Efficacy and safety of Cimicifuga foetida extract on menopausal syndrome in Chinese women. Chin. Med. J.. 2013;126:2034-2038.
- [CrossRef] [Google Scholar]
- Data-dependent acquisition and database-driven efficient peak annotation for the comprehensive profiling and characterization of the multicomponents from compound Xueshuantong capsule by UHPLC/IM-QTOF-MS. Molecules. 2019;24
- [CrossRef] [Google Scholar]
Appendix A
Supplementary material
Supplementary data to this article can be found online at https://doi.org/10.1016/j.arabjc.2024.105613.
Appendix A
Supplementary material
The following are the Supplementary data to this article:Supplementary data 1
Supplementary data 1


