

Translate this page into:
A comprehensive study of facemasks pyrolysis using Py-GC/MS, kinetic analysis and ANN modeling
⁎Corresponding author. viboon.sr@chula.ac.th (Viboon Sricharoenchaikul)
-
Received: ,
Accepted: ,
This article was originally published by Elsevier and was migrated to Scientific Scholar after the change of Publisher.
Peer review under responsibility of King Saud University.
Abstract
Abstract
The thermo-kinetics of pyrolysis and product distribution of facemasks, as a blend of filter layers were explored in this study. Pyrolysis products were studied using Py-GC/MS at 550 °C for 30 s, resulting in predominantly aliphatic hydrocarbons (82.6%): alkanes (34.5%) and alkenes (48.1%). Notable gaseous products identified include propene, 2-methyl pentane, and 2,3-dimethyl-1-pentene, while the dominant species among the cycloalkanes were 1,2,3,5-tetraisopropylcyclohexane and 1,3,5-trimethylcyclohexane. Furthermore, we developed a chemical reaction mechanism to describe the main products formed during pyrolysis. Besides, the activation energy was predicted using model-free methods namely FR (214.2 kJ/mol), KAS (200.5 kJ/mol), and FWO (200.6 kJ/mol), as a function of conversion. The Coats – Redfern (CR) model-fitting method revealed that the pyrolysis reaction mechanism within the temperature range of 400 – 550 °C (pyrolysis active zone) belonged to one-dimensional diffusion and contracting cylinder model. The reliability of these results was further affirmed using the Criado method, showing agreement between the experimental and theoretical master plots. The thermodynamic parameters for facemask degradation indicated an endothermic process (ΔH = 205.5 kJ/mol, ΔG = 182.4 kJ/mol, and ΔS = 0.03 kJ/mol·K). To predict weight loss during facemask pyrolysis, we developed an artificial neural network (ANN) model that considered heating rate and temperature as inputs. The most efficient model structure involved an ANN with 2 input layers (2 neurons each), 2 hidden layers (each with 10 neurons), and an output layer (1 neuron). This study is crucial for advancing our understanding of the theoretical aspects of polymeric waste pyrolysis.
Keywords
Diffusion
Kinetics
Mechanisms
Pyrolysis
Py-GC/MS
Surgical facemask

1 Introduction
The convenience, adaptability, and flexibility of plastics make them appealing for various applications. One notable instance of its use arose during the COVID-19 pandemic when prominent global healthcare organizations and governments advocated for the widespread use of personal protective equipment (PPE), specifically facemask, to curb the transmission of the novel coronavirus. However, the extensive utilization of these PPEs resulted in a surge of plastic waste, posing risks to both terrestrial and marine environments and potentially contributing to the spread of infectious diseases (Su et al., 2021; Tesfaldet et al., 2021). The global market value of PPE is estimated at USD 55 billion and expected to grow by 7.5 % from 2023 to 2032 (GMI, 2023). During the COVID-19 pandemic, approximately 3.4 billion waste surgical facemasks were generated daily worldwide (Benson et al., 2021). Surgical facemasks are primarily composed of polypropylene (PP) but may also contain polyethylene (PET), polyurethane (PE), polyacrylonitrile (PAN), polystyrene (PS), and polycarbonate (PC) (Wang et al., 2022), weighing approximately 2.88 g (Schmutz et al., 2020). Given the significant consumption of these disposable facemasks, addressing the environmental impact of plastic waste is imperative for ongoing discussions on sustainability and waste management. Presently, used facemasks are commonly disposed of through landfilling and incineration. Healthcare facilities may employ autoclaves for waste treatment (Singh et al., 2022); however, the widespread use of facemasks in the general population, coupled with inadequate distribution of designated disposal bins in residential and municipal areas, makes landfilling an inevitable practice. Incineration, on the other hand, generates dioxins and other toxic chemicals that can pose a risk to human health (Zhao and Wang, 2018). Alternatively, pyrolysis is encouraged to dispose waste facemask while simultaneously recovering energy and oil (Dharmaraj et al., 2021). Moreover, the minimum operating temperature for pyrolysis (350 – 600 °C) is also deemed sufficient to eliminate any virus strain as long as a safe handling and collection steps are followed (Behera, 2021). Generally, plastic wastes contain high amounts of volatile content and little moisture, resulting in more condensable and non-condensable volatiles during pyrolysis (Dyer et al., 2021). Therefore, due to its polymeric nature, pyrolysis of surgical facemasks is a suitable recycling method for waste utilization in energy and fuel production. However, comprehending the kinetics of pyrolysis and the distribution of products is crucial for designing, optimizing, and scaling up thermochemical conversion of emerging plastic wastes in large quantities such a disposable facemasks.
Thermogravimetric analysis (TGA) and pyrolysis coupled with Gas Chromatography and Mass Spectroscopy (Py-GC/MS) are invaluable techniques for gaining insights into the thermal degradation of plastic polymers and the distribution of resulting products (Açıkalın, 2021). Some recent studies have examined the pyrolysis of waste COVID-19 facemasks and the kinetics of their thermal degradation, such as Yousef et al. (2021), who studied the kinetic results of the pyrolysis of a 3-layer facemask, obtaining activation energies of 237 kJ/mol, 268.7 kJ/mol, and 280.91 kJ/mol using the KAS (Chee et al., 2016), FWO (Koga, 2013), and FR (Sharma et al., 2019) methods, respectively. In the same vein, Chen et al. (2021) compared the thermal decomposition of facemask ear loops (earpiece) with Spandex and Nylon in a nitrogen environment, reporting higher activation energy and frequency factor (271.33 kJ/mol, 2.8 × 10¹⁷ s−1) than Nylon (170 ± 20 kJ/mol, 2.2 ± 0.3 × 10¹⁰ s−1) (Lehrle et al., 2000). (Sun et al., (2021) investigated pyrolysis of a facemask different heating rates as a one-step reaction. The authors reported a mean activation energy of 237.19 kJ/mol and described the reaction mechanism by g(α) = (-ln (1- α))2/3. In terms of pyrolysis kinetics of pure polypropylene, the reported activation energy ranges from 133 to 265 kJ/mol and the frequency factor ranges from 1.47 × 10⁷ – 3. 10 × 1017 s−1 (Aboulkas et al., 2010; Das and Tiwari, 2017; Sousa Pessoa De Amorim et al., 1982). However, there are some discrepancies among these reported studies, and most of them focused on slow pyrolysis of facemasks in a batch laboratory-scale reactor. Furthermore, these investigations primarily focused on analyzing product gases using a macropyrolyzer coupled with Mass Spectrometers (MS). Nevertheless, collecting and analyzing condensable volatiles overlooks a significant range of pyrolysis reaction products. For instance, (Sun et al., (2022) reported the entrapment of about 70 % of the pyrolysis liquid of facemasks in the GC column, mostly heavy hydrocarbons (C36 to C70). In most cases, unlike fast pyrolysis, slow pyrolysis of plastics leads to the generation of heavier and more waxy substances, resulting in a decreased yield of oil (Pal et al., 2022). Furthermore, raising the pyrolysis temperature enhances the production of gaseous products and promotes the formation of cyclic aliphatic and aromatic compounds (Supriyanto et al., 2021). Currently, there are limited studies available on the fast and catalytic pyrolysis of facemasks (Panchal and Vinu, 2023; Sun et al., 2022; Xu et al., 2022). For example, Xu et al. (2022), investigated pyrolysis of facemask filters at a high temperature (900 °C) using Py-GC/MS and predominantly identified aliphatic hydrocarbons like alkenes (22.75 %) and alkanes (17.95 %) in the products. Among the products, 2,3-Dimethyl-1-hepene was the most abundant (9.38 %), while cycloalkanes with carbon number ranging from C18 to C25 dominated the composition of alkanes. In contrast, a study conducted by Panchal and Vinu (2023) reported a predominant presence of only alkenes and a small yield of dienes during pyrolysis at 700 °C for 60 s. These operating temperatures may not be economically viable due to the significant energy consumption needed to achieve such elevated temperatures. Therefore, obtaining reliable fundamental data on the pyrolysis characteristics of surgical facemasks, with a specific focus on their thermal decomposition kinetics and distribution of products, is crucial for the development of appropriate thermal recycling and catalytic processes, especially those utilizing pyrolysis techniques.
Artificial neural network (ANN) models have been utilized in thermal treatment research. Typically, the ANN architectural structure consists of input and output layers connected by one or more hidden layers through a transfer (activation) function. Analogous to human brains, these layers contain neurons, in which increasing their number for training and testing will improve prediction accuracy. ANN models are incredibly beneficial in predicting weight loss or pyrolysis parameters during the thermal degradation of plastics and biomass (Bi et al., 2021).
The aim of this study is to comprehensively investigate the pyrolysis kinetics and the nature of products derived from facemasks as a mixture of its three filter layers. To achieve this, we employed TGA and Py-GC/MS techniques. The reaction kinetics were described based on three model-free iso-conversional methods, while different model-fitting methods were to investigate the underlying reaction mechanisms. Moreover, we used the Criado method, which involves comparing theoretical and experimental master plots to assess the reliabilities of different reaction mechanisms. Additionally, we developed an ANN model to predict the weight loss profile during pyrolysis. A possible reaction pathway elucidating the formation of the dominant gaseous products during facemask pyrolysis was also reported.
2 Materials and methods
2.1 Raw material preparation and characterization
Commonly used surgical facemasks (brand name: Dura) in Thailand were disassembled into parts: filter layers and ear loops. The average weight of each facemask was 2.85 ± 0.2 g. The three filter layers were shredded into workable sizes using scissors and frozen with dry ice to improve brittleness while being simultaneously milled to fine sizes (Fig. S1). This approach is effective at maintaining homogeneity of the samples. The dry ice eventually sublimed after each milling process, and the samples were oven dried separately for 48 hr at 60 °C before storage in a desiccator for subsequent experiments. Furthermore, elemental (CHNS/O) analysis was conducted on the facemask samples using an elemental analyzer (628 series, Leco Corporations - USA). The oxygen content in the samples was determined by difference.
2.2 TG- analysis
Milled facemask parts were subjected to thermogravimetric analysis via TGA (METTLER TOLEDO – TGA/DSC 3+) in an inert environment using nitrogen gas. Experiments were performed with approximately 5 mg of sample loaded into a platinum crucible and heated from 30 °C to 850 °C at a nitrogen flow rate of 20 mL/min. The thermogravimetric (TG) curves were obtained over heating rates of 5,10, 20, and 30 °C/min.
2.3 Py GC–MS analysis
A sample mass of 0.5 mg of facemask blend was loaded for fast pyrolysis at 550 °C for 30 s using a pyroprobe pyrolyser coupled with gas chromatography and mass spectrometer (Py- GC/MS). A pyroprobe pyrolyser (Multifunctional pyrolyzer, PY-2020iD Frontier Lab, Japan) with auto shot sampler AS-1020E interfaced to a gas chromatograph-Mass spectrometer (GCMS QP2020 NX Shimadzu, Japan). The GC separation was conducted using a column with dimensions of 30 m × 0.25 mm Ultra Alloy-5 with a film thickness of (id., 0.25 µm). Helium gas (99.999 %) was used as carrier gas at a column flowrate of 1 mL/min and a split mode at a ratio of 1:50. The oven conditions were programmed such that initially the temperature starts at 50 °C (held for 3 min) and then heated to 200 °C at a rate of 5 °C/min and then ramped again to 350 °C at 10 °C/min and kept at 10 min. Single shot (SS) mode was applied and the pyrolysis interface and the injector temperature were set at 280 °C and the mass spectra were recorded under electron impact (EI) ionization in positive mode at 70 eV. The mass spectrometer was scanned from m/z = 20 to m/z = 800. Identification of the resulting peaks was obtained using the NIST library. The product selectivity was determined by comparing the peak area of a specific compound to the total peak areas obtained from the chromatogram.
2.4 Reaction theoretical consideration
The rate of facemask degradation under isothermal conditions is described based on a solid decomposition proportional to the concentration of the reacted material.
Where α is the conversion rate given by
The variables
,
, and
represent the sample mass at the initial period, time (to), and the end of weight loss, respectively. The values of α considered in the experiments are investigated from 0 to 0.9, depicting the sample in fractions. F (α) is a function of α that can be explained depending on the reaction mechanism (Table 1), and
(T) is the reaction rate constant expressed by the Arrhenius equation.
Reaction mechanism
Code
Integral part, g(α)
Reaction order models
1st order
1.5 order
2nd order
3rd order1R
1.5R
2R
3R
Diffusion model
1-Dimensional diffusion
1-D
2- Dimensional diffusion
2-D
3- Dimensional diffusion
3-D
−1)
Ginstling- Brounshtein
G-D
Shape contraction model
Contracting cylinder
C-1
Contracting sphere
S-1
Acceleratory rate or nucleation-controlled model
Power law
PL-2
Power law
PL-3
Power law
PL-4
Random nucleation and subsequent growth or sigmoidal rate-controlled model
Avarami- Erofeev
AE-2
[
Avarami- Erofeev
AE-3
Avarami- Erofeev
AE-4
[
Sigmoidal rate
SR 2
Sigmoidal rate
SR 3
1/3
Where (J/mol) is the activation energy of the reaction, A is the pre-exponential factor (min−1), R is the universal gas constant (8.314 J/mol K), and T is the absolute temperature (K).
Upon substituting Eq. (3) in Eq. (1), the following expression is developed:
However, if the temperature increases at a constant heating rate of β (°C/min), given by
, then β can be expressed as:
Substituting Eq. (5) in Eq. (4) and rearranging a new expression is obtained.
Integration of Eq. (6), considering
, A, and β as constants over the boundary conditions of α = 0 at
=
and temperature at every conversion as
the following expression was given as
Where
) is the integral function of conversion that can be selected from Table 1. Therefore, if
This general expression equation is followed to determine the kinetic parameters during the pyrolysis process. To ease the calculations, approximate numerical solutions for are proposed (sections 2.4.1 – 2.4.2).
2.4.1 Model-free method
The reaction kinetic of facemask thermal decompositions were studied based on iso-conversional methods such as the Friedman method (FR), Kissenger–Akahira–Sunose (KAS), and Flynn-Wall-Ozawa (FWO). These techniques are widely used to evaluate the kinetic parameters of non-isothermal TG curves of material degradation (Özsin and Pütün, 2022).
-
Friedman (FR) method
FR method is a differential iso-conversional method obtained by taking the natural logarithm of Eq. (6).
The activation energy value using this method can be obtained over a broader range of conversions by assuming that conversion depends only on mass loss rate. Therefore, by plotting a straight-line form versus and a slope of , the activation energy and frequency factor are obtained.
-
Kissenger–Akahira–Sunose (KAS) method
In the KAS method, the kinetic parameters are obtained by assuming
and A independent of temperature and conversion. As mentioned in section (2.3), a numerical approximation is used to express
as
Accordingly, the KAS method was established by inserting Eq. (11) in Eq. (9) and taking the natural logarithm.
Therefore, plotting versus produces a straight line, and the activation energy ( ) can be determined from the slope.
-
Flynn-Wall-Ozawa (FWO) method
The FWO method is an iso-conversional method that calculates the activation energy (
) without prior knowledge of the reaction mechanism. Thus, substituting Eq. (13) in Eq. (9), the reaction rate in logarithmic form can be expressed as follows:
Eq. (14) gives the FWO method where the slope of against 1/T at different heating rates determines the value of when α is constant (Masawat et al., 2019).
2.4.2 Model-fitting method
-
Coats Redfern (CR) method
The Coats-Redfern method is an integral method widely implemented for kinetic investigations of solid decompositions. Eq. (9) is solved by introducing the series expansion to express the exponential part (Ebrahimi-Kahrizsangi and Abbasi, 2008).
Assuming
the simplified expression is attained as:
Therefore, the commonly used background expressions for the integral part g(α) can be selected from Table 1. The plot of versus at different temperatures (corresponding to ) can provide the activation energy ( ) and frequency factor (A). Thereafter, the kinetic reaction models by the CR method are considered by comparing the activation energy value closer to the average value obtained from the mode-free methods.
-
Criado method (Criado et al., 1989; Singh et al., 2021)
This method, also called the master plots method, helps to determine the reliable kinetic model
at every conversion without considering the activation energy and frequency factor. The Criado method is obtained by combining Eq. (6) with Eq. (16):
This method compares the theoretical kinetic profile with the experimental data. The value 0.5 indicates conversion at α = 0.5. Therefore, the left side of Eq. (17) is the characteristic curve of each reaction mechanism in Table 1, while the right-side expression is obtained from the experimental results. Hence, comparing both sides gives insights into the kinetic model to describe the degradation mechanism.
2.4.3 Reaction thermodynamic theory
The thermodynamic parameters involved with the pyrolysis of the facemask sample are enthalpy (ΔH), Gibbs free energy (ΔG), and entropy (ΔS). These parameters are widely employed to evaluate the reaction feasibility or spontaneity and energy change of the reaction system. The following formulas are used to obtain these parameters:
Wherein T and Tm are the conversion temperature and peak temperature on the DTG curves, respectively. The peak temperature is the maximum temperature obtained at each heating rate. is the Boltzmann's constant (1.381 × 10⁻²³ K−1), and represents Planck's constant (6.626 × 10⁻³⁴ J/s).
2.5 Artificial neural network modelling
An artificial neural network (ANN) model was developed using Python − 3 programming to predict the weight loss of facemask during pyrolysis. The model takes the heating rate (β) and temperature as input parameters and the weight loss (expressed in wt.%) as output. 5754 data points were used for the prediction: 80 % of the data was used for training and the remaining 20 % for testing. A Mean Square Error (MSE) function was used to assess the progress of every stage, as shown in Eq. (21). In addition, Eq. (22) optimizes the ANN model between the target (w) and output (z) values. Hence, a higher R2 value is expected for a better prediction.
The number of data points, experimental and the predicted values are denoted as n, λ, and γ, respectively.
3 Results and discussions
3.1 Characterization
3.1.1 Physicochemical properties and FTIR analysis of facemask parts
The disassembled surgical facemasks used in the current study contain three layers an outer, a middle filter, and an inner layer. The number of layers in a single facemask is used to improve the retainability of particulates or viruses for enhanced protection (Kollepara et al., 2021). Elemental analysis (CHN/O) was conducted on the blend of filter layers in face masks and compared with existing literature, as presented in Table 2. The findings reveal that carbon constitutes the primary compound (85.1 wt%), followed by hydrogen (14.2 wt%). The substantial carbon and hydrogen content of facemasks make them suitable candidates for pyrolysis or as co-pyrolysis feedstock along with low hydrogen materials like biomass (Praveen Kumar and Srinivas, 2020). The surgical facemask is commonly believed to consist solely of plastic polymer; however, a small amount of oxygen has been reported in (Panchal and Vinu, 2023), which aligns with the present work. The presence of oxygen may be attributed to the trace additives, such as phthalate esters, used to improve the workability and physical characteristics of facemasks (Wang et al., 2022). *O given by difference: *O = 100 – C – H – N – S. While NA = Not available, and ND = Not detected.
Element (wt.%)
Current study
(Xu et al., 2022)
(Panchal and Vinu, 2023)
C
85.1
85.65
85.3
H
14.2
14.43
14.5
N
0.1
ND
ND
S
–
NA
ND
*O
0.6
–
0.1
FT-IR technique is utilized to analyze the composition of the monomers in the polymer materials used in the facemask layers, as depicted in Figures S2.a – b. The results obtained from the analysis of the three filter layers exhibited similar spectra within the wave number range of 3500 to 500 cm−1. As a result, investigation of the functional groups of each layer resulted in identical wavelengths in the spectrum of 2837 to 2950 cm−1 indicating C–H stretching. Another identical peak was found in the fingerprint region between 810 and 1454 cm−1 as demonstrated in Fig. S2a. As a result, investigation of the functional groups of each layer resulted in identical wavelengths in the spectrum of 2837 to 2950 cm−1 indicating C–H stretching. Another identical peak was found in the fingerprint region between 810 and 1454 cm−1, indicating various stretches such as CH, CH2, and CH3 blends (Jung et al., 2018). The spectrum of facemask filter layers (outer, middle, and inner) was identical with the polypropylene (PP) FT-IR peaks. Therefore, it is suggested that surgical facemask is a multi-layered protective gear predominantly manufactured from PP.
PP is commonly used for its low cost, providing greater stiffness, low density, fatigue resistance, and tenacity during various engineering applications (Kartik et al., 2022). The obtained FT-IR results agree with Jung et al. (2020) stating that the overall weight percentage of PP in the facemask is about 73.33 % because the majority part comprises the filter layers. In this study, we observed that the filter layers and ear loops earpieces make up most of the surgical facemask weight (>80 wt%) where the filter layers contribute to over 65 wt% of the total weight. The remaining mass is related to the nose strap which is mostly made from aluminum. Fig. S2b show the FT-IR results of the ear loop with many peaks in two broad ranges at 2862 to 3290 cm−1 and 577 to 1632 cm−1, similar to Nylon-6 (Jung et al., 2018). The FTIR peak of 3290 cm−1 indicates the presence of N–H stretching, while 2862 cm−1 is identical to the C–H stretch. The stretching at the FT-IR peak of 1632 cm−1 indicates a C-O double bond, and 1537 cm−1 is an N–H bend and C-N single bond stretch. The facemask ear loop is made from a complex polymeric mixture of polyamides; hence, the FT-IR spectra exhibit various stretching at 672, 1261, and 1461 for the C = O bend, C-N, and CH2 bend, respectively (Jung et al., 2018).
3.1.2 TGA-DTG and thermal degradation behavior
Fig. 1. a – b, shows the TG and DTG analysis curves for the facemask mixture of its three filter layers, respectively. Four different heating rates (5, 10, 20, and 30 °C/min) were used to obtain the mass loss curves under a nitrogen environment. The curves were then drawn over a temperature range of 300 – 550 °C, which is the region where the significant mass loss occurred.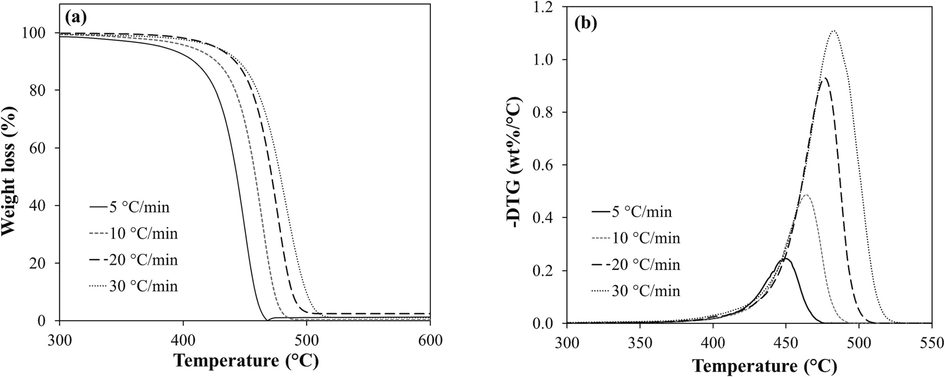
a) TG and b) DTG profile of facemask pyrolysis.
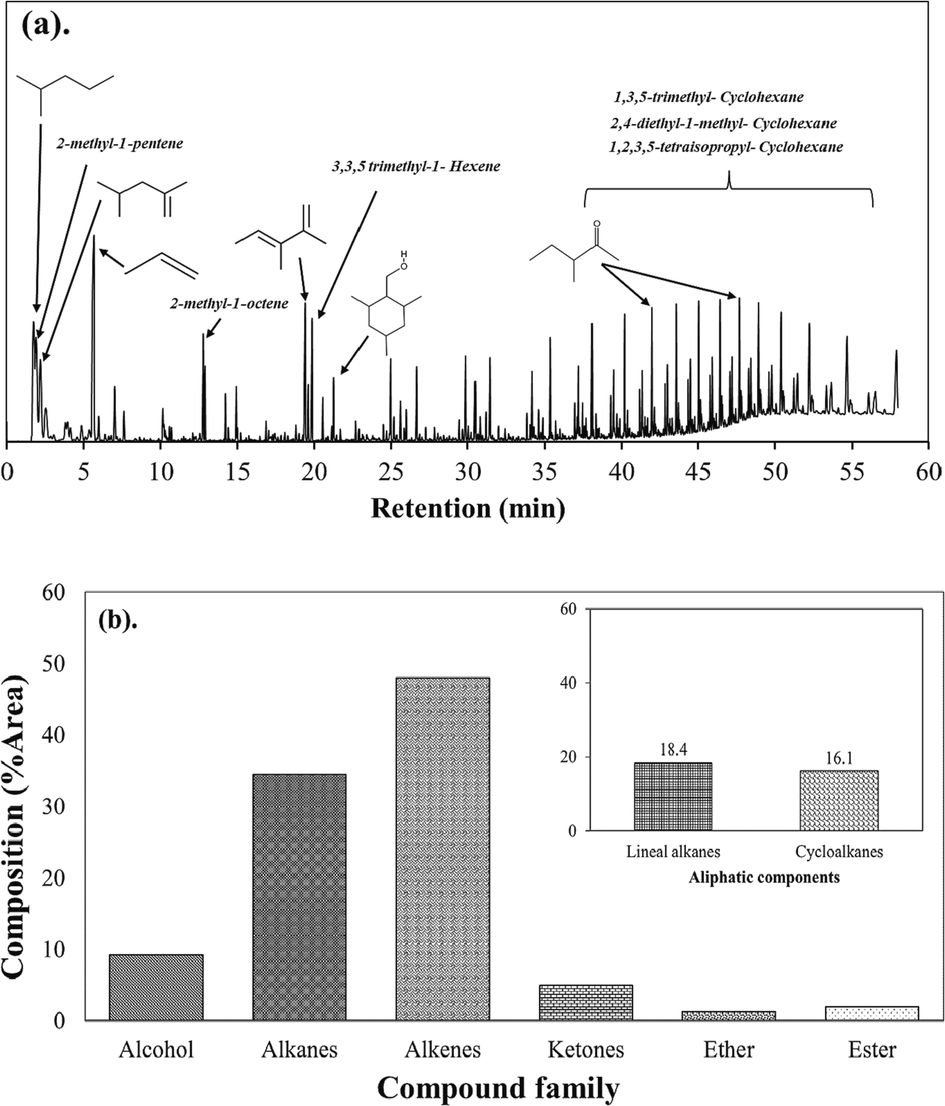
Fast pyrolysis of facemask a) Chromatogram b) Product distribution.
The facemask samples exhibited almost the same weight loss trend at different heating rates. The similar TG trend (Fig. 1a) shows that the samples have the same pyrolysis behavior due to the identical chemical bonds in their molecular structures. Besides, it was observed that the facemask blends were fully degraded between 470 and 511 °C.
As illustrated from the weight losses and DTG curves, the pyrolysis reaction occurred in a single stage at temperatures above 400 °C. However, minor degradations resulting in slight weight loss exist at a temperature range of 300 to 400 °C which are related to the release of small volatiles. From Fig. 1b, the rate of weight loss and conversion (α) also reflects the lateral shift to the right when the heating rate (β) was increased from 5 to 30 °C/min. In addition, increasing the heating rate tends to raise the temperature and peak height in the DTG curves. This phenomenon occurs as thermal resistance builds up inside the sample, resulting in a temperature difference between the heat input rate and heat transfer inside the sample (Sun et al., 2021). The total weight loss range at this stage is 60.2 – 68.3 wt%. Meanwhile, the highest weight loss rate was observed at 483.5 °C. Previous research reported the major thermal degradation temperature of pure polypropylene (PP) at 327 – 477 °C (Kim et al., 2008) and that of facemask (Yousef et al., 2021) at a temperature range of 405 – 510 °C. These results are in consonance with the current study; however, a slight temperature increase exists in the major degradation zone (above 400 °C). Therefore, it is possible that this increase in temperature range could be attributed to the presence of the coloring pigments, binders, or additives (Chellamani et al., 2013), acting as a heat sink.
Moreover, in Fig.S3, it is observed that the temperature at every conversion (Tα) decreases slightly with increasing heating rates (β). This indicates that at higher β, the increase in α with temperature resulted in reducing the conversion rate (dα/dT) α. However, the average conversion rate (dα/dT) aα for each β changes only slightly, indicating a little effect on the heating rate. This is particularly interesting as the mutual effect of heating rate and temperature on the value of the dα/dT may nullify each other.
In this study we attempted to study pyrolysis of facemask by dividing the thermal degradation into thermal segment I at 300 to 400 °C and segment II at 400 to 550 °C. Hence, before reaching segment I, the samples undergo moisture evaporation. Thereafter, with the progress of isothermal heat input, a retardation phase is likely to be developed as the temperature increases towards the polymer degradation level. This delay phase was dominant at temperatures below 300 °C, where the facemask sample changes into a viscous liquid as the PP polymer melts before the start of initial decomposition temperature. Subsequently, the reaction temperature increases, reaching segment I and resulting in bond breaking and the formation of gases such as CO2, CO, CH4, and small hydrocarbon molecules (Shagali et al., 2022). The mass loss at this stage is minimal, comprising less than 5 wt%. However, upon approaching segment II, the decomposition of the facemask was more pronounced (Fig. 1). Furthermore, the degradation temperature progressed more with the increase in heating rate, as indicated by the TGA results. For instance, at 5 °C/min, 30 % by weight of the initial sample mass was lost at 433 °C while the same weight loss occurred at 467 °C at a rate of 30 °C/min. However, the isothermal TG finding suggests that the facemask filter layers decompose sharply with time at temperatures above 446 °C. The facemask decomposition at all heating rates ends around 510 °C with less than 3 wt% of fine solid char remaining at the end of the pyrolysis process. Therefore, based on TGA, complete pyrolysis of surgical facemask can be achieved at a temperature of above 500 °C.
3.2 Pyrolysis - gas chromatography / mass spectrometry (Py-GC/MS) study
Py-GC/MS was utilized to analyze the product of pyrolysis and provide information on their structural compositions. Additionally, quantitative and prompt analysis can be carried out with a minimal or no sample pretreatment is required (Ainali et al., 2021). The temperature used in this process was 550 °C to ensure complete pyrolysis of the facemasks, following results from TGA. The chromatogram of the evolved gases is demonstrated as retention time vs. abundance (absolute intensity), and the identified compound families are depicted in Fig. 2.a – b. The detailed compound distribution can be found in Table S1.
The fast pyrolysis of facemasks resulted in high concentrations primarily aliphatic hydrocarbons (82.6 %) such as alkanes (34.5 %), and alkenes (48.1 %). The pyrolysis products also contained alcohols (9 %) and ketones (4.9 %). Esters (2 %), mainly consisting of acid derivatives like (6-Octenoic acid, 3,7-dimethyl-, 3,7-dimethyl-6-octenyl ester) contributing about 0.86 % of the total gas products. The thermal decomposition of polyolefins such as PP, involves a complex process characterized by random scission mechanisms, resulting in the formation of various complex hydrocarbons (Zhang et al., 2022). In the absence of catalysts, polymer degradation begins with the breakdown of larger molecules into free radicals, followed by successive cracking into smaller compounds and the generation of olefins during the propagation stage. The termination stage occurs when the free radicals polymerize to form intermediates known as oligomers (Hendrawati et al., 2023).
During fast pyrolysis of the facemask samples at 550 °C, alkenes emerged as the predominant components within the hydrocarbon mixture of the pyrolysis product. Specifically, α-alkenes such as propene, 2-methyl-1-pentene, and 2,4-dimethyl-1-pentene were the most abundant, along with alkadienes like 2,3-dimethyl-1,3-pentadiene and 2,5-dimethyl-1,5-Hexadien (Table S1). Furthermore, analysis of the product gas composition indicated the presence of linear alkanes (18.4 %) and cyclic alkanes (16.1 %). These findings align with previous studies on the fast pyrolysis of PP (Supriyanto et al., 2021). The primary cycloalkanes observed were 1,2,3,5-tetraisopropyl-cyclohexane (4.24 %) and 1,3,5-trimethyl-cyclohexane (3.94 %), occurring at retention time 36 – 57 min. These compounds were also identified in the pyrolysis process of pure PP (Jin et al., 2018). Likewise, other cycloalkanes within the C10 to C32 range were the predominant constituents of the pyrolysis product gas derived from facemask pyrolysis conducted at 900 °C (Xu et al., 2022). The broad spectrum of products can be attributed to the cleavage of C–C and C–H bonds, as well as the presence of free radicals. Additionally, the inclusion of a methyl group in the PP molecular structure is crucial in the generation of branched hydrocarbons (both alkanes and alkenes) through random scission.
The possible mechanisms governing the formation of dominant products are illustrated in Fig. 3. The pyrolysis of facemask in this work can be explained by the random scission of the C–C bond and intramolecular hydrogen transfer of PP polymer. The presence of α-alkenes suggests that β-scission reactions are predominant for facemask pyrolysis, which is similar to the results of PP thermal decomposition in (Miskolczi et al., 2009; Zhang et al., 2022). For instance, propene (8.4 %) is produced by the C–C bond breakage at 1 and 2. The second most dominant species in the gaseous products is 2 methyl- pentane (5.5 %), which is an alkane formed in step 2 by the C–C cleavage at 1 and 4, leaving room for receiving two hydrogen radicals. These hydrogen radicals are attached to the carbon at position 1 and carbon holding the second methyl group. Step 3 elucidates the mechanism for forming 2-methyl-1-pentene which is an alkyl-alkene. In this step, the C–C bonds cleaved at positions 1 and 4, while the C–H bond is cleaved at position 3, resulting in the formation of a double bond between the first and second carbon atoms. 2,4 dimethyl-1-pentene in step 4 is formed in a similar manner, with C–C cleavage at 1 and 5. Fast pyrolysis of facemask also revealed the generation of cycloalkanes during the process (step 5 and 6). This phenomenon can be explained by the formation of isomerized radicals at high temperature which subsequently undergo further scissions at position 7, forming secondary radicals and cyclization (Zhang et al., 2022). Overall, fast pyrolysis of surgical facemasks offers a viable valorization route for preparation of valuable chemical precursors or for energy applications.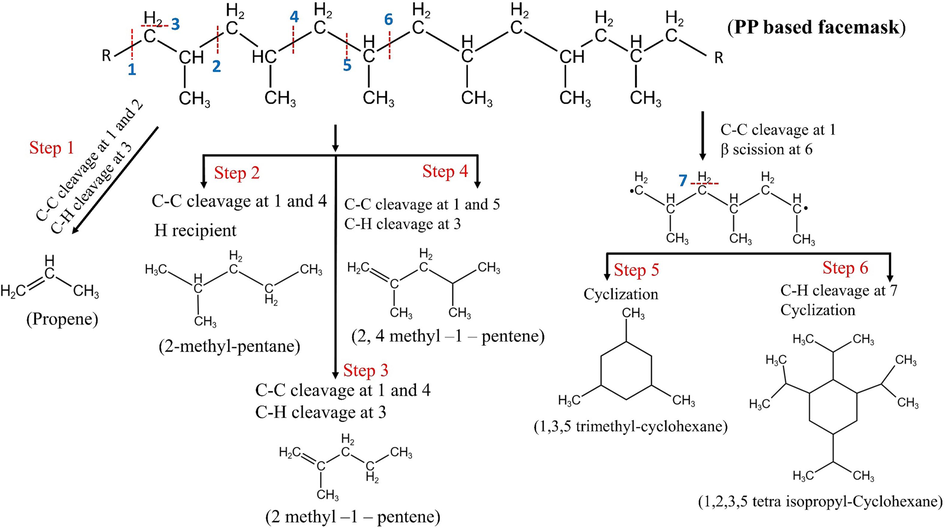
Mechanism of major products formation during facemask fast pyrolysis at 550 °C.
3.3 Kinetic investigation
3.3.1 Model-free methods
Activation energy is an essential parameter in the thermo-kinetic analysis of chemical substances. Activation energy represents the minimum amount of energy necessary to bring the reactant molecules to a state where they can undergo a chemical or physical transformation. This study employs three model-free methods (FR, FWO, and KAS) to examine the apparent activation energy (
) of the facemask filter layers (Fig. S4a – c). Table 3 presents the estimated specific
and A values at the different conversions (α). The values of
obtained from the three models exhibit comparable patterns and produce similar average values. The average activation energies were 214.2, 208.1, and 209.1 kJ/mol based on FR, KAS, and FWO methods, respectively. The standard error associated with
ranges from 10.8 to 11.7 kJ/mol. As illustrated in Fig. 4.a, the slight fluctuations in the activation energies obtained through the model-free methods, in relation to the conversion, indicate that the pyrolysis process follows a single-step reaction. Thus, the overall average activation energy for the thermal decomposition of surgical facemask is 210.5 kJ/mol. The values of
obtained through model-free method in this study corroborate with that of pure PP in N2 environment (Table 4), while the slight deviation among different facemasks sample could possibly arouse from the additives (such as plasticizer, or flame retardants) (Wang et al., 2022) or the choice of the thermal decomposition zone for estimating kinetic parameters. In general, plastic wastes show high activation energy during decomposition like LDPE (148 – 256 kJ/mol), HDPE (134–258 kJ/mol), and PP (124 – 198 kJ/mol) (Das and Tiwari, 2017).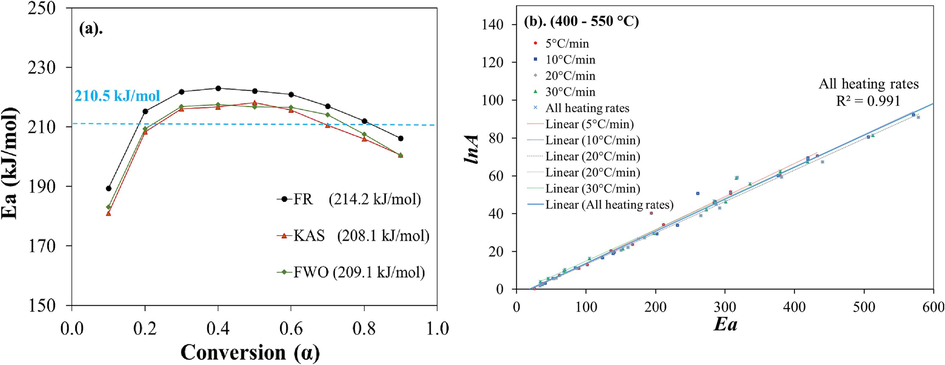
Plots of a) Activation energy using model-free methods and b)
vs
at 400 – 550 °C for all reaction mechanism models.
Conversion
FR
KAS
FWO
A
A
A
α
(kJ/mol)
(s−1)
(kJ/mol)
(s−1)
(kJ/mol)
(s−1)
0.1
189.3
8.82 × 10⁹
181
2.67 × 10⁷
183.1
4.37 × 10¹⁰
0.2
215.3
1.60 × 10¹²
208.3
2.68 × 10⁶
209.4
3.93 × 10¹²
0.3
221.9
7.92 × 10¹²
216.1
1.32 × 10¹⁰
216.9
1.59 × 10¹³
0.4
223
1.44 × 10¹³
216.7
1.61 × 10¹⁰
217.5
1.95 × 10¹³
0.5
222.1
1.59 × 10¹³
218.1
2.17 × 10¹⁰
216.7
1.76 × 10¹³
0.6
221
1.76 × 10¹³
215.6
1.61 × 10¹⁰
216.6
1.95 × 10¹³
0.7
217
1.18 × 10¹³
210.6
7.22 × 10⁹
214.1
1.44 × 10¹³
0.8
212
6.48 × 10¹²
205.9
3.96 × 10⁹
207.6
5.31 × 10¹²
0.9
206.2
2.91 × 10¹²
200.6
1.78 × 10⁹
200.5
1.95 × 10¹²
Average
214.2 ± 10.8
8.75 × 10¹²
208.1 ± 11.7
8.89 × 10⁹
209.1 ± 11.3
1.09 × 10¹³
SN
Sample
Predominant Material
Average Ea (kJ/mol)
Model free method
Model fitting method
ANN model
Reference
1.
Facemask filter
PP
274.2
FR, KAS and FWO
NA
NA
(Yousef et al., 2021)
2.
Facemask ear loop
Nylon-6
271.33
FR, KAS, FWO, Starnik, and Vyazovkin
2nd order chemical reaction
NA
(Chen et al., 2021)
3.
Facemask Filter
PP
237.19
FWO, KAS, and Starink
NA
(Sun et al., 2021)
4.
Polypropylene
124–198
Contracting cylinder and/or contracting sphere
(Aboulkas et al., 2010; Das and Tiwari, 2017; Kim et al., 2008)
5.
Facemask filter layers blend
PP
210.5
FR, FWO, and KAS
- Diffusion and Sigmoidal rate at (300–400 °C).
− 1D diffusion and contracting cylinder at (400–550 °C).2*10*10*1
This study
The values (Table 3) obtained using the KAS method are slightly lower than those estimated using the FWO and FR methods. Comparatively, the estimates provided by the KAS and FWO methods are more closely aligned. However, disparities are to be expected due to the mathematical formulations of the KAS and FWO methods, introducing systematic errors (Aboulkas et al., 2010). The FR method estimates the activation energy by assuming conversion depends only on the mass loss rate. According to Figure S4.a, all the fitting lines generated using the FR method corresponded throughout the entire conversion range. However, slight variation at conversion (0.1 and 0.9) are observed, which can be attributed to the formation of volatiles at low conversions and the generation of radicals at high conversions. These phenomena result from the simultaneous formation of small volatiles during bond breakage (Chen et al., 2019; Shagali et al., 2022). Meanwhile, the slopes of the fitting lines of KAS and FWO methods exhibit similar trends throughout the entire conversion range, especially in the range of 20 % to 90 % conversion. These trend lines collectively indicate that the pyrolysis of facemask filter layers can be explained by a single reaction mechanism within the conversion range of 0.2 to 0.9 according to the FR, KAS, and FWO model-free methods.
3.3.2 Model-fitting method
-
Coats Redfern (CR) method
The Coats Redfern (CR) method was used to obtain the values of and by different models over the heating rates of 5, 10, 20, and 30 °C/min. The CR method is considered a representative model-fitting approach to understand the underlying pyrolysis reaction process (Coats and Redfern, 1964). The appropriate model selected from Table 1 is then considered based on the linear fitting that corresponds to the highest regression coefficient R2 and an closer to the value obtained by the model-free methods (Xi et al., 2021). This is because the highest regression value would not always guarantee that the selected kinetic expression is best fitted (Naqvi et al., 2019).
The ICTAC committee (Koga et al., 2023) has recommended that polymer composites containing fillers exhibit a modified degradation mechanism that deviates from that of the pristine polymer, resulting in a complex and intricate multi-step process with multiple stages Additionally, before reaching the decomposition stage, the facemask undergoes melting, which makes it challenging to avoid minor thermal degradation. As a result, the kinetic triplets of the surgical facemask pyrolysis using the CR method were studied by segmenting the thermal degradation into two zones: segment I (300 – 400 °C) and segment II (400 – 550 °C), respectively. The results are demonstrated in Table 4 as Ea, lnA, and R2 with respect to the models in Table 1. According to the TG- results, a small thermal degradation was observed in segment I, possibly attributed to the escape of light volatiles during the melting stage, while a noticeable degradation occurred in segment II. Therefore, segment II is considered as the major zone for active pyrolysis of facemask. All the models provided good regression coefficients R2 (0.966 – 0.999) for segment II except at 10 and 20 °C/min for the 1st (1R) and 1.5 (1.5R) order reaction models. Furthermore, lower activation energy values were obtained over segment I at 300–400 °C compared with the values estimated at 400 – 550 °C, suggesting lower energy demand for thermal degradation. This aligns with the TGA results, which show that significant thermal degradation of the facemask initiates above 400 °C, while a minor mass loss exists in segment I mostly due to the release of small gaseous molecules, which demand lower activation energy. Good regression coefficient R2 (0.981 – 0.982) and higher
was achieved at the temperature range in segment I, using the diffusion models like 1-D (117.90 kJ/mol), 2-D (118.24 kJ/mol), and 3-D (119.24 kJ/mol). Besides, the random nucleation and subsequent growth or sigmoidal rate-controlled model described as SR3 and AE-2 produced an
of 182.23 kJ/mol and 119.24 kJ/mol at R2 of 0.999 and 0.982, respectively. In a similar comparison, the kinetic triplets in segment II were obtained by the best fit model and
closer to the model-free method (Table 5). Accordingly, good correspondence of
was observed in the chemical reaction model 1R (172.3 kJ/mol) at R2 of 0.999 and the diffusion model 1-D (220.27 kJ/mol) at R2 of 0.994. Chemical reaction, diffusion, and nucleation were observed in earlier studies on facemask (Sun et al., 2021). However, other approaches are required as it is not possible to determine the reaction mechanism solely based on
.
300 – 400 °C
Model
5 °C/min
10 °C/min
20 °C/min
30 °C/min
Average
R2
Ea (kJ/mol)
lnA
Ea (kJ/mol)
lnA
Ea (kJ/mol)
lnA
Ea (kJ/mol)
lnA
Ea (kJ/mol)
lnA
1R
44.5
2.3
–
–
70.8
6.0
37.9
−0.1
51.1
2.7
0.96
1.5R
44.9
2.3
52.7
3.5
–
–
57.2
5.6
51.6
3.8
0.9
2R
45.4
2.5
53
3.5
68.7
5.6
57.4
5.7
56.1
4.3
0.74
3R
53.0
2.8
45.4
1.8
68.7
4.9
57.4
5.0
56.1
3.6
0.74
1-D
97.6
9.7
114.1
11.9
146.8
16.0
113.1
12.5
117.9
12.5
0.981
2-D
98.1
9.2
114.5
11.3
146.9
15.3
113.4
11.8
118.2
11.9
0.981
3-D
99.9
8.1
115.6
10.0
147.4
13.9
114.2
10.5
119.2
10.6
0.982
GB
108.6
22.7
124.9
24.6
157.3
28.8
96.1
18.2
121.7
–
0.966
CR
44.1
1.5
52.2
2.6
68.3
4.8
39.8
0.0
51.1
2.2
0.97
CS
44.2
1.1
52.3
2.3
68.4
4.4
56.8
4.5
55.4
3.1
0.76
PL-2
16.7
2.3
20.8
−1.6
29.0
−0.2
28.3
1.7
23.7
−0.6
0.75
PL-3
7.7
5.0
10.4
−3.6
15.9
−2.5
18.9
0.3
13.2
−2.5
0.88
PL-4
3.2
−5.7
5.2
−4.9
9.3
−3.8
14.1
−0.6
8.0
−3.7
0.96
AE-2
99.9
8.1
115.6
10.0
147.4
13.9
114.2
10.5
119.2
10.6
0.982
AE-3
7.9
−4.1
10.6
−3.5
15.9
−2.5
19.0
0.3
13.4
−2.5
0.87
AE-4
7.9
−4.1
10.6
−3.5
15.9
−2.5
19.0
0.3
13.4
−2.5
0.87
SR 2
99.3
10.1
115.2
12.2
147.2
16.1
113.9
12.6
118.9
12.8
0.982
SR 3
154.1
17.6
178
20.5
226.0
26.3
170.9
19.4
182.2
21.0
0.999
400 – 550 °C
Model
5 °C/min
10 °C/min
20 °C/min
30 °C/min
Average
R2
Ea (kJ/mol)
lnA
Ea (kJ/mol)
lnA
Ea (kJ/mol)
lnA
Ea (kJ/mol)
lnA
Ea (kJ/mol)
lnA
1R
136
20.5
–
–
183.8
27.4
197.1
29.6
172.3
25.9
0.999
1.5R
211.5
2.3
286
46.2
–
–
284.4
46.7
260.7
42.4
0.997
2R
308.3
51.4
419.4
69.5
287.3
45.6
335.9
55.8
337.7
55.6
0.992
3R
419.4
68.8
419.4
68.8
287.3
44.9
379.5
62.5
348.6
56.7
0.993
1-D
140.5
19.6
202.2
29.3
265.4
39.0
273
42.2
220.3
32.6
0.994
2-D
166.6
23.8
231.6
33.9
292.3
43.1
301.2
46.5
247.9
36.8
0.981
3-D
379.1
60.4
506.1
80.5
440.3
67.5
512.5
81.5
459.5
72.5
0.984
GB
193.9
40.3
261
50.8
317.7
59.2
316.3
58.8
272.2
52.2
0.934
CR
89.4
11.2
123.8
16.7
150.3
20.7
152.7
21.6
129
17.6
0.999
CS
102
13.1
138.7
19.0
160.4
22.1
175.6
26.7
144.2
20.2
0.981
PL-2
25.8
0.3
41.3
3.1
57.1
5.8
68.3
9.8
48.1
4.7
0.97
PL-3
13.1
−0.1
23.4
−0.2
33.9
1.7
45.5
5.9
29
1.3
0.97
PL-4
6.7
−1.8
14.5
−2.1
22.3
−0.5
34.1
3.9
19.4
−0.7
0.98
AE-2
61.8
7.5
84.9
11.3
86.1
11.2
104.8
16.5
84.38
11.6
0.966
AE-3
37.1
2.9
52.5
5.6
53.2
5.5
69.7
10.5
53.1
6.1
0.97
AE-4
14.2
−0.7
36.3
2.6
36.8
2.5
36.8
2.6
31
1.8
1
SR 2
284
45.7
377
60.2
381
59.4
419
67.6
365
58.2
0.98
SR 3
432.8
70.6
571.3
92.2
578.2
91.0
628.5
101.2
552.7
88.7
0.999
All models displayed higher activation energies in segment II, confirming it as the primary zone of facemask pyrolysis. However, it’s worth noting that all power laws and Avarami- Erofeev (AE-3 and AE-4) models exhibited lower activation energy and poorer linearity in comparison to the diffusion and nucleation models. In addition, Table 5, shows an increase in activation energy with the heating rate. Moreover, it is important to consider the frequency factor (A), expressed as lnA in this section as it represents the number of molecular collisions that result in a reaction (Dhyani et al., 2018). The values of A were generally higher in thermal segment II when compared to segment I. Moreover, it was noted that an increase in the value of frequency factor was accompanied by a rise in activation energies. Therefore, indicating that at higher temperatures, the likelihood of molecules colliding in the correct orientation increases, resulting in a higher frequency factor.
In Fig. 4b, the variations of the estimated values of were plotted against for thermal segment II. Regression analysis was used to obtain the correlation between the activation energy ( ) and frequency factor (A) by considering a total of 72 data points for each thermal zone at a confidence interval (CI) of 95 %. Accordingly, the expression for segment II is (R2 = 0.991). The respective regression coefficients can be considered very good at estimating the values of the kinetic parameters using the Model-fitting method. A very good R2 for segment II was achieved since the correlation coefficients of the models in the higher heating zone were all above 0.96. Moreover, it is to be noted that the pyrolysis of the facemask blend sample was pronounced at segment II. Therefore, the estimated kinetic parameters are reliable for pyrolysis of the whole facemask.
-
Criado method for model prediction
Other methods are required to establish the mechanism of reactions since comparison of activation energy cannot serve as sole evidence. Therefore, it is possible to determine the mechanism by comparing the theoretical master plots with the experimental ones using the Criado method without considering the frequency factor and activation energy (Criado et al., 1989; Diaz Silvarrey and Phan, 2016). The Criado method has been widely used to predict the reaction mechanisms for lignocellulosic biomass (Luo et al., 2021), sewage sludge (Liu et al., 2021), and plastic pyrolysis (Aboulkas et al., 2010). In this study the master plots of the experimental and representative models in Table 1 are present in Fig. 5 using β of 10 °C/min. The curves for the experimental and the theoretical master plots for all β values remained the same after normalizing the data (Fig. S5 – 8).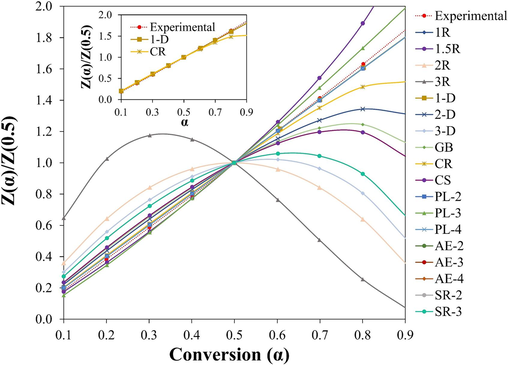
Master plots comparison of experimental and model predictions.
It is observed at conversions 0.1 to 0.6 that the experimental master plot curve overlaps the theoretical master plot curve of CR. However, the master plot for the diffusion model (1-D) overlaps the experimental master plot throughout the entire conversion. There was also an appreciable overlap between the power laws and experimental curves. However, the obtained values of Ea are inconsistent with the values from the model-free method. Consequently, these values cannot accurately describe the thermal degradation process. Therefore, in accordance with the Coats Redfern method, the thermal degradation of the surgical facemask can be depicted by the 1- dimensional diffusion and contracting cylinder models. This result also agrees with the shape contraction model, as demonstrated in Table 4, which describes the pyrolysis of polypropylene.
3.4 Thermodynamic investigation
The thermodynamic parameters such as the enthalpy (ΔH), Gibbs free energy (ΔG), and entropy (ΔS) are presented in Fig. 6.a – d. These parameters were studied using the average value of the activation energy and frequency factor obtained by the model-free method. Moreover, since the pyrolysis reaction is more prominent above 400 °C, thermal degradation in segment II was considered. As a result, the thermodynamic parameters at this thermal zone changed with the respective heating rate at a specific conversion. The average ΔH value ranges from 179.8 to 214.1 kJ/mol, while the ΔG ranges from 176.5 to 189.1 kJ/mol. The entropy is small, ranging from −0.01 to 0.04 kJ/mol·K. The average ΔH, ΔG, and ΔS associated with the thermal degradation process of the facemask are 205.5 kJ/mol, 182.4 kJ/mol, and 0.03 kJ/mol·K, respectively.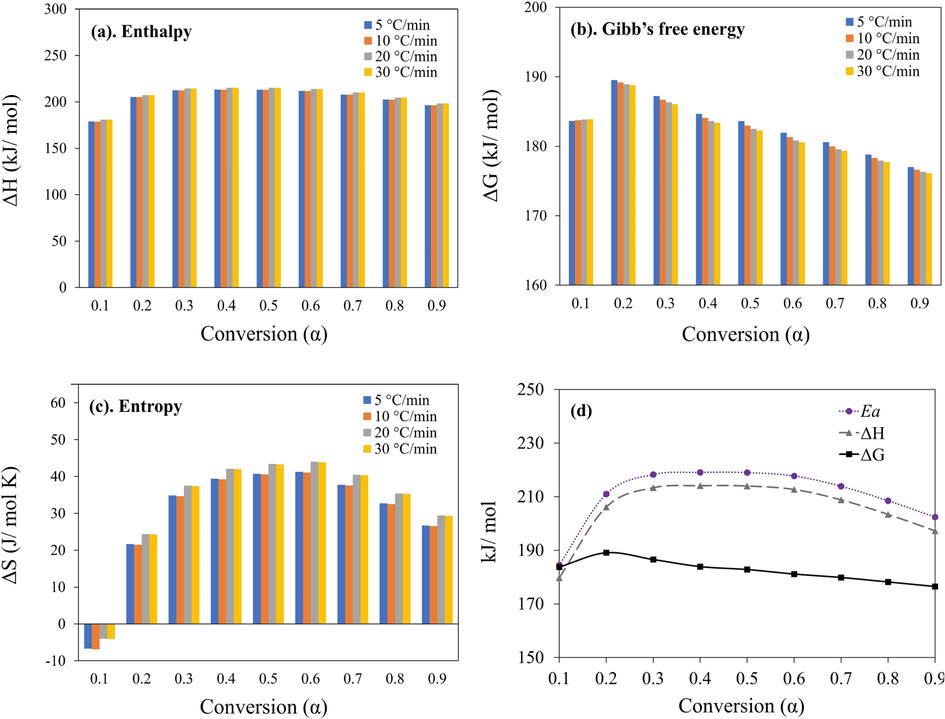
a. Enthalpy (ΔH), b. Gibbs free energy (ΔG) c. Entropy (ΔS) and d. Average Ea, ΔH, and ΔG of surgical facemask thermal degradation using FR, KAS, and FWO models.
Enthalpy change is the energy required or consumed by a particular substance to form another product. It is the difference between the enthalpies of the reactants and products. A positive ΔH indicates an endothermic reaction, meaning that the energy of the reactants is less than the products. In this case, the positive value of ΔH at each conversion (Fig. 6a) shows that the pyrolysis reaction of the facemask filter layers mixture is endothermic. Moreover, at lower conversion, the pyrolysis process exhibits low enthalpy (179.8 kJ/mol); however, the values increase with conversions. Nevertheless, an increase in heating rate showed a minimal effect on the change in enthalpy except at 5 °C/min. The disparity of 5 kJ/mol (as seen in Fig. 6d) between the average activation energy and ΔH implies a condition that is favorable for the generation of an activated complex (Özsin and Pütün, 2022). Technically, the positive difference implies that the prevailing reaction for thermal decomposition requires heat input, such as the pyrolysis process.
The Gibbs free energy (ΔG) represents the degree to which a specific reaction is likely to occur. A positive value of ΔG shows that the reaction is non-spontaneous. As illustrated in Fig. 6b, the results of ΔG corresponding to each conversion are all positive and significantly larger than zero. In this case, the pyrolysis reaction will occur by an external heat source and not spontaneously (on its own). The values of ΔG decrease a little with the increase in the heating rate, but a noticeable variation occurred with an increase in conversion. This decline of ΔG with heating rate could result in rapid movement of the reactants; hence, increasing the chances of collision. As a result, the pyrolysis process accelerates as collisions between the reactant molecules increase. It can be observed that the ΔG value increased between the conversion from 0.1 to 0.3. However, with an increase in conversion at α > 0.3, the ΔG slightly decreased at all values of α. This means that the energy requirement for the facemask pyrolysis is constant throughout the process for α > 0.3.
Entropy (ΔS) is a thermodynamic property that measures the level of disorder in a system. The value of ΔS reflects the reactivity of substances, and larger values indicate higher reactivity. The results in Fig. 6c show that the ΔS at α ≥ 0.2 are positive except at α = 0.1. In this situation, the negative value suggests that the degrees of disorder of the products were lower than the initial reactants. This result may be due to the small volatile products likely to occur through initial bond scissions, resulting in a thermally stable product at the start of the pyrolysis process (Shagali et al., 2022). However, as the pyrolysis reaction progressed, the ΔS increased continuously, indicating an increase in the reactivity and formation of more volatile products. Here, the pattern of ΔS rises fairly with the increase in heating rate, implying the product molecules are excited, leading to more disorder. However, this momentum slows at higher conversions as the volatile production reduces.
3.5 Artificial neural network model prediction
ANN is an effective approach for best fitting complex non-linear pyrolysis TGA results. The ANN model in this work was built on machine-learning python libraries like Scikit-learn, Pandas, and Numby. Moreover, the relu activation function was utilized due to its simplicity in providing fast calculations. As mentioned in the methods section, the ANN model contains an input layer for the heating rate and reaction temperature and an output layer for the target weight loss. Another layer, called the hidden layer, links the input and output layers. These layers include neurons which are the building blocks of ANN models. The neurons' numbers are arbitrary; hence, their selection is based on the cost of computing versus accuracy (Xayachak et al., 2022; Xu et al., 2022). An excess of neurons in an ANN architecture may result in overfitting, where the model exhibits good performance on the training data but poor performance on new data. Conversely, underfitting occurs when a model has an insufficient number of neurons and performs poorly on both training and new data. Accordingly, the most efficient structure for the model in this work followed the topology 2*10*10*1, indicating an input layer, two hidden layers, and an output layer. The two hidden layers contain 10 neurons each. This structure produced good values of MSE and R2 (Table S2) at 0.8834 and 0.9995, respectively. The high R2 value obtained from the training and testing process indicates that the predicted values best fit the test values. In addition, Fig. S9 displays the variation of error in relation to the number of conversions (iterations), demonstrating a decreasing trend in model error as the number of iterations increases. Therefore, for enhanced performance, this study employed 1000 iterations. The results in Fig. 7.a – d show the conversion (α) change between the experimental data and the ANN predicted values. The ANN model successfully predicted the weight loss data by as much as R2 = 0.999 at every β in the active pyrolysis zone (300 – 550 °C). It is to be noted that this “R2” is the correlation between the testing and actual data. In Fig. 8a – d the predicted mass loss profile and the experimentally obtained values coincided almost entirely, reflecting the model’s high accuracy.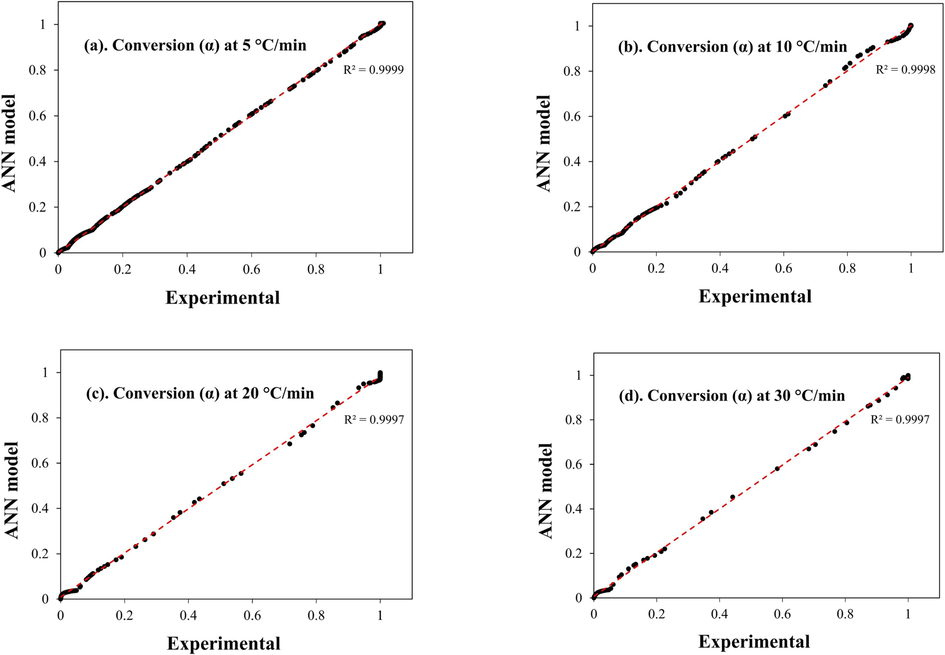
Experimental and ANN predicted weight loss conversion (α) at a. 5 °C/min, b. 10 °C/min c. 20 °C/min and d. 30 °C/min.
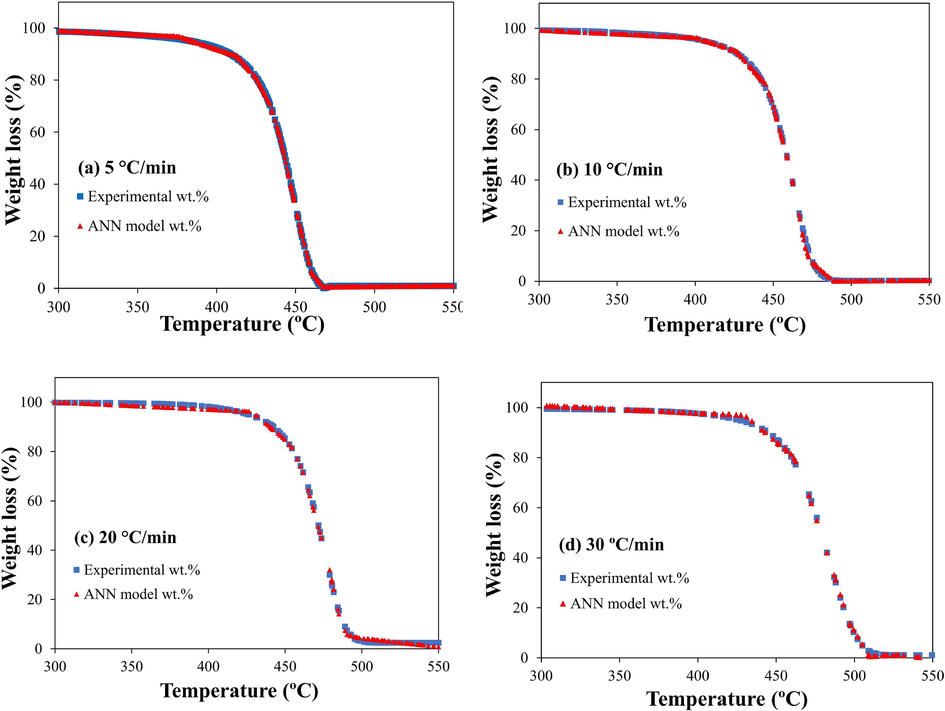
Experimentally determined and ANN predicted TG-curves at a. 5 °C/min, b. 10 °C/min c. 20 °C/min and d. 30 °C/min.
4 Conclusion
The pyrolysis kinetics and thermodynamics of surgical facemask filter layers were examined through a systematic study, dividing the thermal degradation into two segments: segment I (300 – 400 °C) and segment II (400 – 550 °C). TGA analysis revealed significant degradation occurring within the range of 408 – 511 °C, with minor degradation observed at lower temperatures in segment I, likely due to the release of small volatile fragments. Additionally, Py-GC/MS analysis at 550 °C unveiled the composition of fast pyrolysis products and potential reaction mechanisms. As a result, the obtained compound families in the pyrolysis products comprised of hydrocarbons (82.6 %), alcohols (9 %), ketones (4.9 %) and esters (2 %). Propene, 2 methyl- Pentane, 2-methyl-1-pentene, 2,4 dimethyl-1-pentene and 2,3-dimethyl-1,3-pentadiene emerge as the dominant species. Fast pyrolysis of facemask also revealed a substantial generation of cycloalkanes (16 %). The fast pyrolysis process of facemask filter layers was primarily driven by random scission, hydrogen transfer, and cyclization mechanisms. The range of the activation energy (208.1 – 214.2 kJ/mol) and the frequency factor (8.89 × 10⁹ – 1.09 × 10¹³s−1) during pyrolysis were investigated using model-free methods (FR, FWO, and KAS) over the conversions of 0.1 to 0.9. Furthermore, the results from the Coats-Redfern (model fitting) method corresponded well with the value obtained by the model-free method. The Criado method was also utilized to deduce the underlying reaction model independently of the activation energy and frequency factor. As a result, the experimental master plot overlaps with the theoretical master plots at the 1-D diffusion and Contracting cylinder models, which agreed with the Coats-Redfern method. Finally, an artificial neural network (ANN) model accurately predicted the thermal decomposition of the facemasks, given by a topology structure of 2*10*10*1, indicating two input layers, two hidden layers containing 10 neurons each and an output layer. Overall, these findings provide a theoretical basis for the design and optimization of waste facemask pyrolysis processes. Future work is recommended to examine the composition of gaseous products at different pyrolysis temperatures, and the formation of cycloalkanes.
Acknowledgments
This research was funded by the Second Century Fund (C2F) of Chulalongkorn University, Thailand. The authors also thank the assistance of the National Metal and Materials Technology Center (MTEC), Thailand. We also thank Yacob T. Tesfaldet for his assistance with Python code.
Declaration of competing interest
The authors declare that they have no known competing financial interests or personal relationships that could have appeared to influence the work reported in this paper.
References
- Aboulkas, A., El harfi, K., El Bouadili, A., 2010. Thermal degradation behaviors of polyethylene and polypropylene. Part I: Pyrolysis kinetics and mechanisms. Energy Convers Manag 51, 1363–1369. 10.1016/j.enconman.2009.12.017.
- Determination of kinetic triplet, thermal degradation behaviour and thermodynamic properties for pyrolysis of a lignocellulosic biomass. Bioresour. Technol.. 2021;337
- [CrossRef] [Google Scholar]
- Aging effects on low- and high-density polyethylene, polypropylene and polystyrene under UV irradiation: An insight into decomposition mechanism by Py-GC/MS for microplastic analysis. J. Anal. Appl. Pyrolysis. 2021;158
- [CrossRef] [Google Scholar]
- Sousa Pessoa De Amorim, M.T., Bouster, C., Veron, J., 1982. Pyrolysis of polypropylene: II. Kinetics of degradation. J Anal Appl Pyrolysis 4, 103–115. 10.1016/0165-2370(82)80002-8.
- Challenges in handling COVID-19 waste and its management mechanism: A Review. Environ. Nanotechnol. Monit. Manag.. 2021;15:100432
- [CrossRef] [Google Scholar]
- COVID pollution: impact of COVID-19 pandemic on global plastic waste footprint. Heliyon. 2021;7
- [CrossRef] [Google Scholar]
- Pyrolysis characteristics, artificial neural network modeling and environmental impact of coal gangue and biomass by TG-FTIR. Sci. Total Environ.. 2021;751
- [CrossRef] [Google Scholar]
- Kinetic analysis of rice husk pyrolysis using Kissinger-Akahira-Sunose (KAS) method. Procedia Eng.. 2016;148:1247-1251.
- [CrossRef] [Google Scholar]
- Surgical face masks: Manufacturing methods and classification. J. Acad. Indus. Res.. 2013;2:320.
- [Google Scholar]
- Torrefaction, pyrolysis and two-stage thermodegradation of hemicellulose, cellulose and lignin. Fuel. 2019;258
- [CrossRef] [Google Scholar]
- Pyrolysis characteristics, kinetics, thermodynamics and volatile products of waste medical surgical mask rope by thermogravimetry and online thermogravimetry-Fourier transform infrared-mass spectrometry analysis. Fuel. 2021;295
- [CrossRef] [Google Scholar]
- Coats, A.W., Redfern, J.P., 1964. Kinetic Parameters from Thermogravimetric Data. 10.1038/201068a0.
- Applicability of the master plots in kinetic analysis of non-isothermal data. Thermochim. Acta 1989
- [Google Scholar]
- Thermal degradation kinetics of plastics and model selection. Thermochim. Acta. 2017;654:191-202.
- [CrossRef] [Google Scholar]
- Pyrolysis: An effective technique for degradation of COVID-19 medical wastes. Chemosphere. 2021;275:130092
- [CrossRef] [Google Scholar]
- Effect of composting on the thermal decomposition behavior and kinetic parameters of pig manure-derived solid waste. Bioresour. Technol.. 2018;252:59-65.
- [CrossRef] [Google Scholar]
- Kinetic study of municipal plastic waste. Int. J. Hydrogen Energy. 2016;41:16352-16364.
- [CrossRef] [Google Scholar]
- Catalytic co-pyrolysis of biomass and waste plastics as a route to upgraded bio-oil. J. Energy Inst.. 2021;97:27-36.
- [CrossRef] [Google Scholar]
- Evaluation of reliability of Coats-Redfern method for kinetic analysis of non-isothermal TGA. Trans. Nonferrous Met. Soc. Chin.. 2008;18:217-221.
- [CrossRef] [Google Scholar]
- GMI, 2023. Personal Protective Equipment Market [WWW Document]. https://www.gminsights.com/industry-analysis/personal-protective-equipment-ppe-market.
- Hendrawati, Liandi, A.R., Solehah, M., Setyono, M.H., Aziz, I., Siregar, Y.D.I., 2023. Pyrolysis of PP and HDPE from plastic packaging waste into liquid hydrocarbons using natural zeolite Lampung as a catalyst. Case Studies in Chemical and Environmental Engineering 7. 10.1016/j.cscee.2022.100290.
- Co-pyrolysis characteristics of typical components of waste plastics in a falling film pyrolysis reactor. Chin. J. Chem. Eng. 2018:2176-2184.
- [CrossRef] [Google Scholar]
- Jung, M.R., Horgen, F.D., Orski, S. V., Rodriguez C., V., Beers, K.L., Balazs, G.H., Jones, T.T., Work, T.M., Brignac, K.C., Royer, S.-J., Hyrenbach, K.D., Jensen, B.A., Lynch, J.M., 2018. Validation of ATR FT-IR to identify polymers of plastic marine debris, including those ingested by marine organisms. Mar Pollut Bull 127, 704–716. 10.1016/j.marpolbul.2017.12.061.
- Valorization of disposable COVID-19 mask through the thermo-chemical process. Chem. Eng. J.. 2020;405:126658
- [CrossRef] [Google Scholar]
- Valorization of plastic wastes for production of fuels and value-added chemicals through pyrolysis – A review. Therm. Sci. Eng. Prog.. 2022;32:101316
- [CrossRef] [Google Scholar]
- Using isothermal kinetic results to estimate kinetic triplet of pyrolysis reaction of polypropylene. J. Anal. Appl. Pyrolysis. 2008;81:100-105.
- [CrossRef] [Google Scholar]
- ICTAC Kinetics Committee recommendations for analysis of thermal decomposition kinetics. Thermochim. Acta 2023
- [CrossRef] [Google Scholar]
- Koga, N., 2013. Ozawa ’ s kinetic method for analyzing thermoanalytical curves. 10.1007/s10973-012-2882-5.
- Kollepara, P.K., Siegenfeld, A.F., Taleb, N., Bar-Yam, Y., 2021. Unmasking the mask studies: why the effectiveness of surgical masks in preventing respiratory infections has been underestimated. 10.1093/jtm/taab144.
- Lehrle, R.S., Parsons, I.W., Rollinson, M., 2000. Thermal degradation mechanisms of Nylon 6 deduced from kinetic studies by pyrolysis-g.c.
- Pyrolysis characteristic and kinetic analysis of sewage sludge using model-free and master plots methods. Process Saf. Environ. Prot.. 2021;149:48-55.
- [CrossRef] [Google Scholar]
- Luo, L., Zhang, Z., Li, C., Nishu, He, F., Zhang, X., Cai, J., 2021. Insight into master plots method for kinetic analysis of lignocellulosic biomass pyrolysis. Energy 233. 10.1016/j.energy.2021.121194.
- Thermo-kinetics and product analysis of the catalytic pyrolysis of Pongamia residual cake. J. Environ. Manage.. 2019;242:238-245.
- [CrossRef] [Google Scholar]
- Fuels by pyrolysis of waste plastics from agricultural and packaging sectors in a pilot scale reactor. Fuel Process. Technol.. 2009;90:1032-1040.
- [CrossRef] [Google Scholar]
- Pyrolysis of high ash sewage sludge: Kinetics and thermodynamic analysis using Coats-Redfern method. Renew. Energy. 2019;131:854-860.
- [CrossRef] [Google Scholar]
- An investigation on pyrolysis of textile wastes: Kinetics, thermodynamics, in-situ monitoring of evolved gasses and analysis of the char residue. J. Environ. Chem. Eng.. 2022;10
- [CrossRef] [Google Scholar]
- Recent advances in catalytic pyrolysis of municipal plastic waste for the production of hydrocarbon fuels. Processes 2022
- [CrossRef] [Google Scholar]
- Resource recovery from discarded COVID-19 PPE kit through catalytic fast pyrolysis. J. Anal. Appl. Pyrolysis. 2023;170
- [CrossRef] [Google Scholar]
- Catalytic Co-pyrolysis of biomass and plastics (Polypropylene and Polystyrene) using spent FCC catalyst. Energy Fuel. 2020;34:460-473.
- [CrossRef] [Google Scholar]
- Cotton and surgical masks—what ecological factors are relevant for their sustainability? Sustainability (Switzerland). 2020;12:1-13.
- [CrossRef] [Google Scholar]
- Thermal behavior, synergistic effect and thermodynamic parameter evaluations of biomass/plastics co–pyrolysis in a concentrating photothermal TGA. Fuel. 2022;331
- [CrossRef] [Google Scholar]
- Non-isothermal kinetics of pseudo-components of waste biomass. Fuel. 2019;253:1149-1161.
- [CrossRef] [Google Scholar]
- Medical waste: Current challenges and future opportunities for sustainable management. Crit. Rev. Environ. Sci. Technol. 2022
- [CrossRef] [Google Scholar]
- Insights into kinetics, reaction mechanism, and thermodynamic analysis of pyrolysis of rice straw from rice bowl of India. Bioresour. Technol. Rep.. 2021;13
- [CrossRef] [Google Scholar]
- Valorisation of medical waste through pyrolysis for a cleaner environment: Progress and challenges. Environ. Pollut.. 2021;279
- [CrossRef] [Google Scholar]
- Pyrolysis of COVID-19 disposable masks and catalytic cracking of the volatiles. J. Anal. Appl. Pyrolysis. 2022;163:105481
- [CrossRef] [Google Scholar]
- Kinetic, thermodynamic and chemical reaction analyses of typical surgical face mask waste pyrolysis. Therm. Sci. Eng. Prog.. 2021;26
- [CrossRef] [Google Scholar]
- Supriyanto, Ylitervo, P., Richards, T., 2021. Gaseous products from primary reactions of fast plastic pyrolysis. J Anal Appl Pyrolysis 158. 10.1016/j.jaap.2021.105248.
- Assessing face mask littering in urban environments and policy implications: The case of Bangkok. Sci. Total Environ.. 2021;806:150952
- [CrossRef] [Google Scholar]
- Phthalate esters in face masks and associated inhalation exposure risk. J. Hazard. Mater.. 2022;423
- [CrossRef] [Google Scholar]
- Pyrolysis for plastic waste management: An engineering perspective. J. Environ. Chem. Eng.. 2022;10
- [CrossRef] [Google Scholar]
- Properties of oxidatively torrefied Chinese fir residue: Color dimension, pyrolysis kinetics, and storage behavior. Fuel Process. Technol.. 2021;213
- [CrossRef] [Google Scholar]
- Dynamic pyrolytic reaction mechanisms, pathways, and products of medical masks and infusion tubes. Sci. Total Environ.. 2022;842:156710
- [CrossRef] [Google Scholar]
- Kinetic studies on the pyrolysis of plastic waste using a combination of model-fitting and model-free methods. Waste Manag. Res.. 2020;38:77-85.
- [CrossRef] [Google Scholar]
- Pyrolysis kinetic behaviour and TG-FTIR-GC–MS analysis of Coronavirus Face Masks. J. Anal. Appl. Pyrolysis. 2021;156
- [CrossRef] [Google Scholar]
- Kinetics, product evolution, and mechanism for the pyrolysis of typical plastic waste. ACS Sustain. Chem. Eng.. 2022;10:91-103.
- [CrossRef] [Google Scholar]
- Chemical-looping combustion of plastic wastes for in situ inhibition of dioxins. Combust. Flame. 2018;191:9-18.
- [CrossRef] [Google Scholar]
Appendix A
Supplementary material
Supplementary data to this article can be found online at https://doi.org/10.1016/j.arabjc.2024.105605.
Appendix A
Supplementary material
The following are the Supplementary data to this article:Supplementary data 1
Supplementary data 1


