

Translate this page into:
A highly selective fluorescent probe for nanomolar detection of ferric ions in the living cells and aqueous media
⁎Corresponding author at: Department of Chemistry, Hallym University, 1 Okcheon-dong, Chuncheon 24252, South Korea. satish_nimse@hallym.ac.kr (Satish Balasaheb Nimse)
-
Received: ,
Accepted: ,
This article was originally published by Elsevier and was migrated to Scientific Scholar after the change of Publisher.
Peer review under responsibility of King Saud University.
Abstract
Abstract
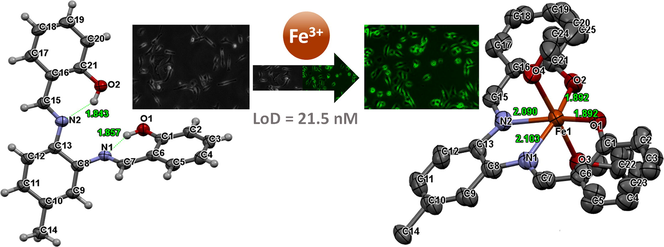
A novel probe 3 was developed for the detection of Fe3+. Probe 3 showed a chelation-induced fluorescence enhancement (CIFE) effect. Single-crystal X-ray data shows that probe 3 is a tetradentate ligand for Fe3+. Probe 3 showed high selectivity for Fe3+ with LOD of 21.5 nM in a semi-aqueous medium. Probe 3 was applied for in-vitro detection of Fe3+ in live HTC 116 cells.
Abstract
A dipodal fluorescent probe 3, with imine and hydroxyl moieties as binding sites, has been synthesized and characterized with spectroscopic methods, single-crystal X-ray techniques, and DFT. The synthesized probe 3 (φ = 0.0028) showed highly sensitive and highly specific fluorescent ‘turn-on’ effect (λem = 453 nm) for the 1:1 binding with Fe3+ ions to form probe 3.Fe3+ complex (φ = 0.203) in semi-aqueous medium (acetonitrile:water (50:50; v/v)) and live cells. The 1:1 binding stoichiometry of probe 3 and Fe3+ ions was proposed by DFT calculations and confirmed by the NMR spectroscopy, crystal structures of probe 3 and 3.Fe3+ complex, and mass spectrum of probe 3.Fe3+ complex. The stability of probe 3.Fe3+ complex in a wide pH range (pH 2–12) and reversibility for binding with Fe3+ ions in the presence of EDTA indicates that it can be an effective chemosensor for the detection of Fe3+ ions in various samples, including living cells. Importantly, with the LOD of 21.5 nM for the detection of Fe3+ ions, probe 3 did not show any interference from potentially competing ions even at a 1:3 ratio, indicates its biocompatibility. The nanomolar limit of detection (21.5 nM), cell permeability, and low cytotoxicity allows the probe 3 to be an excellent tool for the live-cell imaging and detection of ferric ions in live cells.
Keywords
Fluorescent sensor
Chelation-induced fluorescence enhancement
Fe3+
Schiff base
Live cells imaging
Nanomolar detection

1 Introduction
The growth of a simple and highly efficient fluorescent chemosensor for responsive and discriminatory gratitude of analytes of ecological and biological uses is a primary objective for synthetic chemists (Lehn, 1995; Atood et al., 1996; de la Torre et al., 2013; Beer and Gale, 2001). In recent years, the development of highly specific and sensitive chemosensors has attracted significant interest in detecting heavy metals due to their importance in environmental, biology, and chemistry domains (Yin et al., 2019; Li et al., 2016, 2020; Pan et al., 2017; Reimann et al., 2019; Kaur et al., 2018). Iron is an essential element as it plays a vital role in living organisms (Zuo et al., 2019). The Fe3+ is an indispensable ion since it is an essential component of haemoglobin, myoglobin, and various enzymes (Li et al., 2014). The Fe3+ plays an essential role in biochemical signalling pathways, material transportation, and acts as a coenzyme in the enzymatic metabolism of vitamin B (Chen et al., 2014). Both the elevated levels and the lack of Fe3+ can cause various dysfunctions in the organisms.
The excess intake of Fe3+ can cause a disparity of iron ion in the blood leading to the oxidative damage to cells, reduced blood circulation to the heart (Kaur et al., 2016; Li et al., 2019). Fe3+ is a crucial element in the biosynthesis and proper functioning of haemoglobin and myoglobin (Sharma et al., 2017). Hence, the lack of Fe3+ can affect the synthesis of haemoglobin and myoglobin. The lack of Fe3+ can reduce the activities of cytochrome C and ribonucleotide reductases (Rasheed et al., 2015). The enzymes that require Fe3+ as coenzyme are also closely linked to the bio-oxidation, tissue respiration, synthesis, and decomposition of neurotransmitters (Turunen et al., 2004). Therefore, the lack of Fe3+ can cause a decrease of immunity, inability in the regulation of the body temperature, and neurological disorders (Atchudan et al., 2018; Chen et al., 2017). Hence, it is crucial to develop a method that is fast and sensitive for the identification and quantification of Fe3+ in living organisms.
According to the recent reports, many methods, with their advantages and disadvantages, have been used to detect Fe3+, including ion chromatography (Wolle et al., 2014), potentiometric stripping voltammetry (Hu et al., 2016), inductively coupled plasma atomic emission spectrometry (ICP-AES) (Duan et al., 2003). The fluorescent probe-based method has received tremendous attention in recent years owing to its easiness to use, low cost, short response time, and prominent applications in biology and other aspects (Chinen et al., 2015). Therefore, the development of a highly specific fluorescent chemosensor for Fe3+ is inevitable. There are several reports on the probes used to detect Fe3+ in the previous literature (Li et al., 2016, 2011; Hanwell et al., 2012). The reported Fe3+ fluorescent sensors are known to be fluorescence-quenched due to the paramagnetic properties of Fe3+. Hence, these sensors are not beneficial to detecting intracellular Fe3+ due to the intracellular high-throughput signals and interferences from the background fluorescence (Li et al., 2016; Mun et al., 2016). Therefore, a fluorescent sensor that demonstrates fluorescence enhancement upon binding with the Fe3+ is highly appreciated (Li et al., 2014).
Herein, as a part of our ongoing research on cation recognition studies, we report on a probe 3 (Scheme 1) containing two imine bonds and two phenolic hydroxyl groups that function as a tetra-dentate binding site for the Fe3+ ions. Based on Job plots, UV–vis titrations, fluorescence titrations, single X-ray crystallography, and theoretical calculations, the binding structure and sensing mechanism of probe 3 were explained. Fluorescence microscopy studies showed that probe 3 could be used as a fluorescent sensor for the detection of Fe3+ in living human colon carcinoma (HTC 116) cells.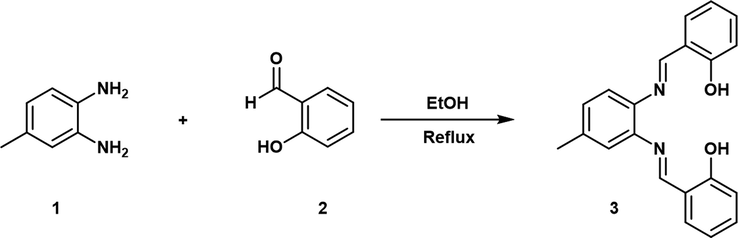
Synthesis of probe 3.
2 Material and methods
2.1 Reagents and instruments
All reagents were purchased from Sigma-Aldrich (South Korea) and used as received unless otherwise stated. The reaction was carried out under an argon atmosphere. All reactions were monitored using thin-layer chromatography (TLC) on Merck Silica Gel 60 F254 plates to confirm the successful formation of the product. The developed plates were visualized under UV light (254 nm). The synthesized compound was characterized by 1H and 13C NMR on a Jeol FT-NMR spectrometer (400 MHz; JEOL, Japan). The chemical shifts (δ) are reported in parts per million (ppm), and the coupling constants (J) are quoted in Hz. UV absorptions and fluorescence emission spectra were measured on the Shimadzu UV-1800 spectrometer (Shimadzu, Japan) and Agilent Cary Eclipse fluorescence spectrophotometer (Agilent Technologies, USA), respectively. High-resolution mass spectra were obtained on a JMS-700 MStation Mass Spectrometer (JEOL, Japan). The mass spectra of 3.Fe3+ complex were obtained by matrix-assisted laser deposition/ionization (time-of-flight), MALDI-TOF mass spectrometry on a Bruker Autoflex speed TOF/TOF spectrometer (Bruker Daltonics, Bremen, Germany). The X-ray analysis was performed using a Bruker AXS D8 Quest CMOS diffractometer (Bruker, USA). Microplate Reader was Spectramax Plus 384 from Molecular Devices, USA, and the Florescent Microscope, Zeiss-ScopeA1, Germany, were used in the present study.
2.2 Synthesis of probe 3
Probe 3 was synthesized using the reported literature procedures (Nimse et al., 2009; Sagasser et al., 2019). As shown in Scheme 1, a solution of 2-hydroxybenzaldehyde (0.50 g, 4.1 mmol) in ethanol (15.0 mL) was added slowly to a solution of 4-methylbenzene-1,2-diamine (0.25 g, 2.05 mmol) in ethanol (15.0 mL) at room temperature. The reaction mixture was stirred, refluxed for 3 h, and TLC was performed to monitor the progress of reaction. The mixture was stirred for an additional 2 h at room temperature upon completion of reaction indicated by TLC. The resulting crude yellow precipitate was recrystallized from ethyl acetate/hexane (1:2) mixed solvent. Yield: 89%. 1H NMR (CDCl3, δ ppm): 13.19 (s, 1H, —OH), 13.13 (s, 1H, —OH), 8.63 (s, 1H, —CH), 8.62 (s, 1H, —CH), 7.39–7.35 (m, 4H, Ar), 7.15 (s, 2H, Ar), 7.06–7.03 (m, 3H, Ar), 6.93–6.91 (m, 2H, Ar) 2.42 (s, 3H). 13C NMR: (CDCl3, δ ppm) 163.8, 163.0, 161.6, 161.5, 142.7, 140.1, 138.1, 133.5, 133.3, 132.5, 132.4, 128.6, 120.6, 119.6, 119.5, 119.4, 119.1, 117.8, 117.7, 21.3. HR-EIMS+: m/z = 330.1367 [M]+ (calcd for C21H18N2O2, 330.1368).
2.3 UV–vis and fluorescence spectral measurements
A double distilled water and spectroscopic grade acetonitrile were used for the preparation of stock and working solutions. The stock solution of probe 3 (25 × 10−6 M) was prepared in acetonitrile: water (50:50; v/v) binary solvent. The stock solution of cations (25 × 10−5 M) were prepared in double-distilled water. UV–Visible absorption and fluorescence experiments were performed to determine the selectivity of the probe 3 towards a series of cations and anions (Na+, K+, Ag+, Cs+, Ca2+, Cu2+, Mg2+, Ba2+, Pd2+, Ni2+, Co2+, Zn2+, Al3+, Fe3+, Cr3+, Fe2+, Mn2+, Cl−, Br−, I−, CN−, CH3COO−, and ClO4− at room temperatures (298 K).
Probe 3 showed selectivity for the detection of Fe3+ in the absorption and fluorescence titrations. Job’s plot analysis was used to determine the binding stoichiometry of probe 3 with Fe3+ ion by UV–Visible absorption and fluorescence spectroscopy. A probe 3 was titrated with successive addition of Fe3+ (0.02 mL) in water to a solution of probe 3 (2.0 mL) in a binary solvent mixture of acetonitrile: water (50:50; v/v) system. The collected data were processed using the Benesi-Hildebrand equation (Benesi and Hildebrand, 1949) to determine the association constant (Ka) of analyte Fe3+ ion with probe 3. The fluorescence intensity was recorded at λex/λem = 326/453 nm alongside a reagent blank with the excitation and emission slits set to 5.0 nm.
2.4 Crystal growth for single X‑ray crystallography
The single crystals of probe 3 were obtained by slow diffusion of n-hexane in ethyl acetate. However, to obtain the single crystals of the 3.Fe3+ complex, probe 3 (0.10 g, 0.302 mmol), Fe(NO3)3·9H2O (0.135 g, 0.333 mmol) were refluxed with stirring in ethanol (10 mL) for 3 h. Then a slow diffusion of n-hexane to the mixture at room temperature produced single crystals of 3.Fe3+ complex. A suitable single crystal was carefully mounted for X-ray crystallography with the help of a trace of Fomblin oil on a Mitegen micromesh mount. Then it was transferred to the goniometer head with a fixed chi angle, a molybdenum Kα wavelength fine focus sealed X-ray tube (λ = 0.71073), a single crystal curved graphite incident beam monochromator, a Photon100 CMOS area detector, and an Oxford Cryosystems low-temperature device. X-ray diffraction data were collected at 150 K using ω and φ scans to a maximum resolution of Θ = 28.351° (0.65 Å). Data reduction, scaling, and absorption corrections were performed using SAINT (Bruker, V8.38A). The final completeness is 94.00% out to 28.351° in Θ. Multi-scan absorption correction was performed using SADABS 2016/2 (Krause et al., 2015). The absorption coefficient µ of this material was 0.637 mm−1 at this wavelength (λ = 0.71073 Å), and the minimum and maximum transmissions were 0.213 and 0.263. The space group was determined based on systematic absences using XPREP (Sheldrick, 2008) as Pbca. The structure was solved using direct methods with ShelXS-97 and refined by full-matrix least-squares on F2 using ShelXL-2018/3 and the graphical interface ShelXLE (Rev937) (Sheldrick, 2015). All non-hydrogen atoms were refined anisotropically. Hydrogen atom positions were calculated geometrically and improved using a riding model. Mercury, PyMol, and POVRay were used for molecular measurements and molecular visualization (Macrae et al., 2006).
2.5 Effect of pH on the detection of Fe3+ and reversibility of the probe 3
The effect of pH (pH = 2–12) on the probe 3 has been examined both in the absence and presence of Fe3+ ions. The pH was adjusted by adding Perchloric acid and Tetrabutylammonium hydroxide, respectively, in the HEPES buffered system.
We also examined the reversibility of probe 3, which is a critical constraint for the fluorescent recognition process. For reversibility study, a four equivalent of Ethylenediaminetetraacetic acid (EDTA) was added to the solution containing probe 3.Fe3+ complex obtained by equimolar concentrations. The reversibility was recorded by alternate additions of one equivalent of Fe3+ and four equivalents of EDTA.
2.6 Determination of quantum yield of probe 3 and probe 3.Fe3+ complex
The quantum yields (Φ) of probe 3 and its complexes with Fe3+ were measured using the following formula. Where A is the area under the emission spectral curve, OD is the optical density of the compound at the excitation wavelength, and η is the refractive index of the solvent. The quantum yield of the probe 3 and its complexes with Fe3+ was determined using quinine sulfate (0.578) as the standard.
2.7 Cell culture studies
The cytotoxicity assay (MTT (3-(4,5-dimethylthiazol-2-yl)-2,5-diphenyltetrazolium bromide) assay) and cell imaging study of probe 3, Fe3+, and Fe3+ combined with probe 3 was performed using HCT116 (Colorectal carcinoma cell line). The HCT116 cells were procured from Korea cell line bank, Seoul, South Korea. Dulbecco Modified Eagle Medium (DMEM), fetal bovine serum (FBS), trypsin, 3-(4, 5-dimethyl thiazol-2yl)-2, 5-diphenyl tetrazolium bromide was procured from Thermo Fisher Scientific, USA. DMSO was procured from Biosesang, Korea. Cell culture plates and glass coverslips were procured from SPL Life Sciences, Korea. The HCT116 cells were grown in an incubator at 37 °C and 5% CO2 using DMEM media containing 2 mM glutamine and 10% FBS. Cells were trypsinized for seeding at 70–90% of cell confluency.
2.8 Cytotoxicity assay and cell imaging
About 2000 HCT116 cells per well were seeded in 96 well plates. After 24 h, the media containing probe 3, Fe3+ ion, and probe 3 with Fe3+ (1, 10, 25, and 50 µM) were added to the wells and incubated for further 24 h. Control wells were treated with equivalent volumes of dimethyl sulfoxide (DMSO). 200 µL of fresh media containing MTT solution and incubated for four hours at 37 °C. The absorbance was recorded at 570 nm using a microplate reader to evaluate the cell viability. Each experiment was executed three times. The data analysis was performed using the Origin software.
For cell imaging, the HCT116 cells were seeded separately on poly-L-lysine coated 14 mm coverslips in 6 well plates and allowed to grow for 24 h. For cell imaging control experiments, 10 µM of Fe3+ ion and 10 µM of probe 3 were incubated separately for 30 min at 37 °C and 5% CO2 in the dark. For cell imaging of the probe 3 and Fe3+ complex, 10 µM of Fe3+ ion was incubated separately for 30 min. Then, the media was replaced with 10 µM of probe 3 and incubated for an additional 30 min. The cells were washed with PBS buffer (pH = 7.4), followed by fixing with 2% paraformaldehyde for 30 min after removing the media. Coverslip was mounted on a glass slide, and imaging was performed under a fluorescence microscope (Zeiss-ScopeA1, Germany). Images were taken through a blue (430–480 nm) channel.
3 Results and discussion
3.1 Synthesis of probe 3
Probe 3 was synthesized by the reaction of one mole of 4-methylbenzene-1,2-diamine with two moles of 2-hydroxybenzaldehyde in ethanol with stirring and refluxing for 3 h. The probe 3, a brown-coloured compound, was obtained with good yield. The synthesized probe 3 was characterized by 1H NMR, 13C NMR, and ESI-MS spectroscopic methods (Fig. S1-3). The spectral investigation gave consistent data with the structure of probe 3, and finally, the structure was confirmed with single-crystal X-ray crystallography. The crystallographic data are listed in Table S1†, and the selected bond parameters are shown in Table S2†. The CIF files for probe 3 and probe 3.Fe3+ complex were deposited in the Cambridge Structure Database with CCDC No 1985816 and 1985819.
3.2 Detection of Fe3+ by probe 3
The binding performance of probe 3 for the cation recognition was monitored by using the UV–visible absorption and fluorescence spectroscopy. The absorption and fluorescence properties of probe 3 were studied in acetonitrile:water (50:50; v/v) binary solvent upon addition of various cations such as Na+, K+, Ag+, Cs+, Ca2+, Cu2+, Mg2+, Ba2+, Pd2+, Ni2+, Co2+, Zn2+, Al3+, Fe3+, Cr3+, Fe2+, Mn2+, Cl−, Br−, I−, CN−, CH3COO−, and ClO4−. The probe 3 showed two maxima bands (Fig. 1a) in the absorption spectra at 253 nm and 326 nm corresponding to the n-π* and π-π* transitions, respectively.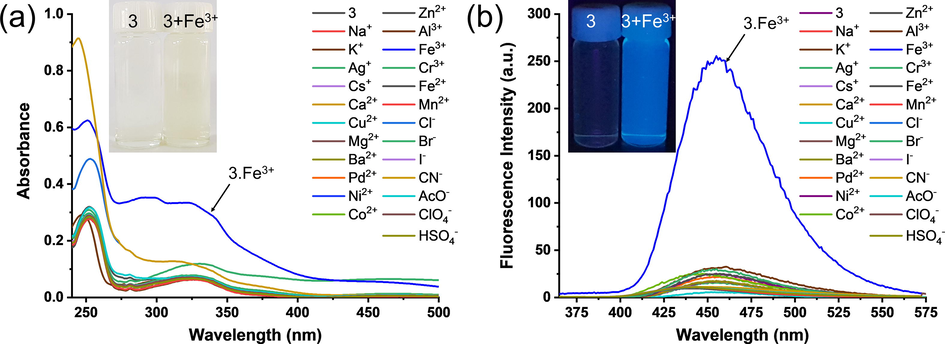
(a) Changes in absorbance spectrum of probe 3 (25 × 10−6 M) upon the addition of various metal ions (25 × 10−6 M) and (b) Changes in absorbance spectrum of probe 3 (25 × 10−6 M) upon the addition of various metal ions (25 × 10−6 M) in the mixture of acetonitrile: water (50:50; v/v). Inset shows the colour change of the solutions from colourless to pale yellow and fluorescence ‘turn-on’ effect.
The addition of one equivalent Fe3+ ions to the solution of probe 3 resulted in the increased absorbance at 326 nm, along with the formation of a new peak at 292 nm. However, the absorption spectra of probe 3 did not show significant changes in the presence of other cations. The existence of keto-amine tautomerism within a molecule can be determined by UV–vis spectroscopy. Keto-amine isomerism of a Schiff-base can be acknowledged if there is a formation of a new band at a higher wavelength (generally >400 nm) in polar solvents (Hayvali and Yardimci, 2008). However, in the probe 3.Fe3+ complex, a new band formation over 400 nm was not observed, indicating the absence of keto-amine tautomerism. The increase in absorption, at 292 nm and 326 nm in the presence of the Fe3+ ions, clearly indicate the selectivity of probe 3 for Fe3+ ions.
The fluorescence spectroscopy measurements were also performed to evaluate the ability of probe 3 for the recognition of other cations. As shown in Fig. 1b, the probe 3 showed weak fluorescence (λex = 326 nm, λem = 453 nm). The weak fluorescence signals were attributed to the conformational flexibility due to the C⚌N double bond and the photo-induced electron transfer (PET) process that occurs at the excited state. As presented in Fig. 1b, the probe 3 showed a highly selective ‘Off–On’ fluorescence increase at 453 nm upon the addition of equimolar Fe3+ ions. Whereas, there was an insignificant change in the fluorescence emission spectra of probe 3 upon the addition of equimolar Na+, K+, Ag+, Cs+, Ca2+, Cu2+, Mg2+, Ba2+, Pd2+, Ni2+, Co2+, Zn2+, Al3+, Fe3+, Cr3+, Fe2+, Mn2+, Cl−, Br−, I−, CN−, CH3COO−, and ClO4− ions. The increase in fluorescence intensity of probe 3 in the presence of Fe3+ at 453 nm is attributed to the large chelation-induced fluorescence enhancement (CIFE) effect (Ganguly et al., 2013). Therefore, the selectivity of the probe 3 for the Fe3+ ions was confirmed by the marked increase in the fluorescent intensity.
The Schiff base probes obtained by using o-phenylenediamines various benzaldehydes have been reported to show selectivity for Mg2+ ions (Taherpour et al., 2018; Hariharan and Anthony, 2014) in the organic solvents. The selectivity of chemosensors highly depends on the solvent systems, and this dependency can be used for the desired applications (Xie et al., 2018; Yao et al., 2017). In the present study, probe 3 was developed for the possible applications in live-cell imaging. Hence, the aqueous solvent system was used for the selectivity study.
3.3 Binding mechanism and association constant
The Job’s plot continuous variation method was employed to evaluate the binding stoichiometry of probe 3 with Fe3+ ions using UV–visible absorption and fluorescence spectroscopy. The molar ratio of the metal ions was changed from 0.1 to 1.0 by keeping the total concentration of probe 3, and Fe3+ ions at 25 × 10−6 M. The absorption maxima (λ = 326 nm) was observed when the molar ratio of the probe 3 to Fe3+ was 0.5, indicating the formation of a 1:1 (3.Fe3+) complex (Fig. S4a†).
Similarly, the maximum fluorescence intensity (λex = 326 nm, λem = 453 nm) was observed when the molar ratio of probe 3 to Fe3+ was 0.5, further confirming the formation of 1:1 (3.Fe3+) complex (Fig. S4b†). The possible binding mode of the probe 3 with the Fe3+ ions is through the coordination of two nitrogen atoms (N) of the azomethine moieties and two oxygen atoms (O) of the phenolic hydroxyl groups (Fig. S5†). Further, the formation of 1:1 (3.Fe3+) complex was also confirmed by the MALDI-TOF mass spectrometry (Fig. S6). Therefore, probe 3 is considered as a tetradentate probe. The probe 3 (2.0 mL) was titrated with successive addition of Fe3+ (0.02 mL) in the acetonitrile: water (50:50; v/v) mixed solvent system to measure the association constant (Ka). The association constant has been measured by using Both the UV–visible absorption and fluorescence spectroscopy (Fig. 2). Both the UV–visible absorption and fluorescence data were processed using the Benesi-Hildebrand plots (Eq. S1†, S2†). The Ka values for the binding of Fe3+ ions to the probe 3 by UV–visible absorption and fluorescence spectroscopy were found to be 4.0 × 10⁴ M−1 and 2.7 × 10⁴ M−1, respectively. These results indicated that the probe 3 has a high binding affinity for Fe3+.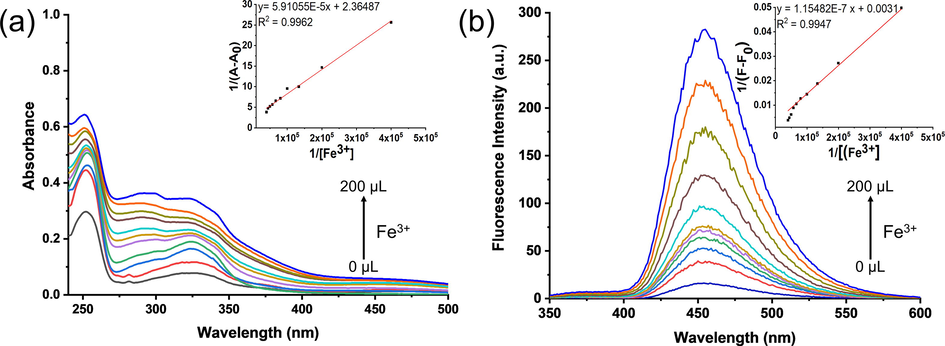
(a) UV–vis absorption and (b) emission spectra of probe 3 (c = 25 × 10−6 M) up on successive addition of Fe3+ (0–200 µL, c = 25 × 10−5 M) in acetonitrile:water (50:50; v/v) binary mixture. Inset shows (a) absorption at 326 nm and (b) fluorescence intensity at 453 nm (λex = 326 nm) as a function of increasing Fe3+ concentration.
3.4 NMR spectroscopy, density functional theory (DFT) calculations, and X-ray crystal structure
The 1H NMR was employed to investigate the binding mechanism further using acetonitrile‑d3😀2O (1:1) mixture (Fig. 3a–b). The 1H NMR of probe 3 recorded in acetonitrile‑d3 shows the phenolic —OH protons to appear at δH 13.13 and 13.19. However, in acetonitrile‑d3😀2O (1:1) mixture, the phenolic —OH protons showed up-field shift (Fig. 3b, the upfield region not shown, from δ13.13 and δ13.19 to δ3.17 ppm). The upfield shift of —OH protons was attributed to the presence of due to D2O in the mixture. The signal of —OH (15.13 ppm) also became broad on the addition of Fe3+ because of the paramagnetic nature of Fe3+ ion. It is interesting to notice that the imine C-H protons (δH 8.75, 8.76) does not show any change in the presence of added D2O. This point outs a shift of a nitrogen lone pair in the direction of the metal ions.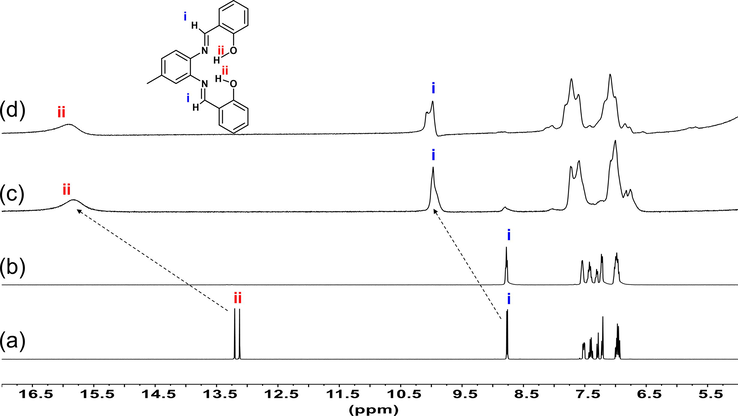
1H NMR spectral changes of (a) probe 3 in acetonitrile‑d3, (b) probe 3 in acetonitrile‑d3😀2O (1:1) mixture, (c) 3 + Fe3+ (1 Equiv) acetonitrile‑d3😀2O (1:1) mixture, (d) 3 + Fe3+ (2 Equiv) in acetonitrile‑d3😀2O (1:1) mixture.
By the addition of 1 and 2 equivalents of Fe3+ to the acetonitrile‑d3😀2O (1:1) mixture containing probe 3, the phenolic —OH (ii) protons and imine C—H protons (i) showed marked downfield shift of ΔδH = 2.75 and ΔδH = 1.21 (Fig. 3c–d), respectively. These results supported the initial assumption that the probe 3 forms a complex with the Fe3+ ions are through the coordination of two nitrogen atoms (N) of the azomethine moieties and two oxygen atoms (O) of the phenolic hydroxyl groups (Fig. S5†).
The binding mechanism of Fe3+ ions to probe 3 was further investigated by the density functional theory (DFT). A possible 3D structure of the 3.Fe3+ complex was calculated by the DFT method using the 1:1 binding stoichiometry between probe 3 and the Fe3+ ions. Density functional theory (DFT) calculations were carried out using Gaussian 09. The molecular geometries of the singlet ground state of probe 3 and the 3.Fe3+ complex were optimized using hybrid B3LYP functions with a 6-31G++(d,p) (C, H, N, O) and LANL2DZ (Fe) basis sets (Xu et al., 2013). Avogadro 1.2.0 was used to obtain the HOMO, LUMO results, and information for bond length and bond angles (Chereddy et al., 2014). The DFT computed structure of the probe 3 and 3.Fe3+ complex are shown in Fig. 4a. The optimized structure of the probe 3 showed weak intramolecular hydrogen bonds with the lengths of 2.306 Å (N1⋯H10) and 2.348 Å (N2⋯H20) (Fig. 4a). The weak hydrogen bonding interactions complement well with the phenolic-OH peaks in the downfield region of 1H NMR spectra at δH 13.13 and 13.19 (Fig. S1†).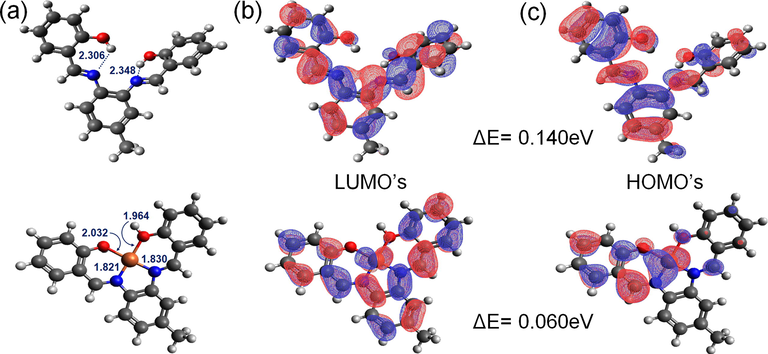
(a) DFT optimized structures of probe 3 and its complex with Fe3+ by hybrid B3LYP functions with a 6-31G++(d,p) and LANL2DZ basis sets. The LUMO’s (b) and HOMO’s (c) illustrations of probe 3 and its complex with Fe3+.
Probe 3 provides a binding site to accommodate the Fe3+ ions through the two azomethine-N and two phenolate-O donor atoms. The DFT optimized structures of probe 3 and its complex with Fe3+ have affirmed that the probe 3 acts as a tetradentate probe for coordination with Fe3+ ions. Upon complexation with Fe3+, the interaction energy (Eint = EComplex-EProbe-EFe3+) is lowered by −150.09 kcal/mol, indicating the formation of a stable complex. The increase in absorbance and the fluorescence enhancement was complemented by the drop in the energy difference between the highest occupied molecular orbital (HOMO) and lowest unoccupied molecular orbital (LUMO) of probe 3 (Fig. 4b-c).
The single-crystal X-ray crystallography data of probe 3 and its complex with the Fe3+ ions also supported the initial assumption that the probe 3 coordinates with Fe3+ ions through the two nitrogen atoms (N) of the azomethine moieties and the two oxygen atoms (O) of the phenolic hydroxyl groups (Fig. 5a-b). Crystal data collection and structure refinement details are presented in Table S1†, and the selected bond parameters are shown in Table S2†. The crystal structure of the probe 3 showed weak intramolecular hydrogen bonds with the lengths of 1.857 Å (N1⋯H10) and 1.843 Å (N2⋯H20) (Fig. 5a). Hydrogen bonding of the phenolic —OH was a major beneficial attribute in cation recognition. Invariably, the phenolic hydrogen atoms formed an intramolecular hydrogen bond with the N atoms of the imine groups, giving a six-member ring. This communication was typically characterized in terms of phenolic oxygen to imine nitrogen separation (Patil et al., 2014). In the free receptor structure, the molecular involvement was via intramolecular hydrogen bonding. However, the chelation in the presence of Fe3+ show enhanced fluorescence intensity due to the intramolecular charge transfer (ICT) process (Torawane et al., 2017).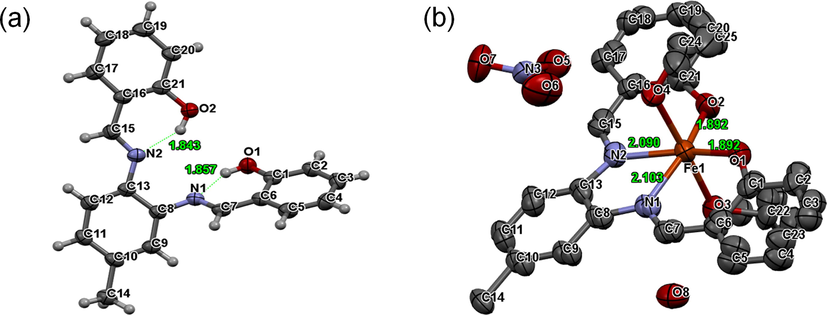
Single X-ray crystal structure of (a) probe 3 (50% probability ellipsoids) and (b) probe 3.Fe3+ complex (50% probability ellipsoids, H atoms omitted for clarity).
The crystals of 3.Fe3+ complex were grown in ethanol by slow diffusion of n-hexane (Fig. 5b). The crystal structure was found to be a mononuclear complex that was in the orthorhombic crystal system with space group Pbca. Probe 3 formed a mononuclear complex with Fe3+ ions through the two nitrogen atoms (N) of the azomethine moieties and the two oxygen atoms (O) of the phenolic hydroxyl groups. However, there is a disorder of the methyl group of the probe 3 in the 3.Fe3+ complex, and it extends into the remainder of the ligand. The probe 3 in the complex is disordered by a pseudo-mirror operation that places the methyl group in the two possible alternative positions. The methyl disorder induces a slight shift of the entire probe 3, and whole probe disorder modeling was required. The two disordered moieties were restrained from having similar geometries. Phenolate O atoms were excluded from the disorder. Phenolate C atoms, as well as C7, C15, and the N atoms were constrained to share ADPs with their counterparts created by the pseudo-mirror operation. Uij components of ADPs for disordered atoms closer to each other than 2.0 Å were restrained from being similar. Subject to these conditions, the occupancy ratio was refined to 0.569(7) to 0.431(7).
Both metal coordinated ethanol molecules are disordered (two and three-fold, respectively). All ethanol moieties were restrained from having similar geometries. Ethanol O-H segments were excluded from the disorder. Uij components of ADPs for disordered atoms closer to each other than 2.0 Angstrom were restrained from being similar. Subject to these conditions, the occupancy rates refined to 0.547(3), 0.343(3), and 0.110(3) for the segment of O3, and to 0.697(8) and 0.303(8) for the segment of O4. Water and ethanol -H atom positions were refined, and O-H distances were restrained to 0.84(2) Angstrom, respectively.
The bond lengths between the N1⋯Fe3+, N2⋯Fe3+, O1⋯Fe3+, and O2⋯Fe3+ were found to be 2.103 Å, 2.090 Å, 1.892 Å, and 1.892 Å, respectively. The two molecules of solvent ethanol were also coordinated with Fe3+ ions through oxygen atoms at the 90° angle to the plane of the probe 3.Fe3+ complex. These results indicated that the probe 3 forms a 1:1 complex with the Fe3+ ions. Further, the crystal structure of the probe 3.Fe3+ complex confirmed that probe 3 acts as a tetradentate probe for coordination with Fe3+ ions.
3.5 Probe 3 as a chemosensor for Fe3+ ions in aqueous media
Highly specific and sensitive detection of the target analyte in the presence of the potentially competing analytes is an important criterion for any compound to be a chemosensor. Therefore, the specificity of probe 3 for Fe3+ was determined in a competition experiment by recording the fluorescence spectra of probe 3 in the presence of Fe3+ (1 equiv.) ion mixed with other cations (1 equiv.). The results of the competition experiments are presented in Fig. 6.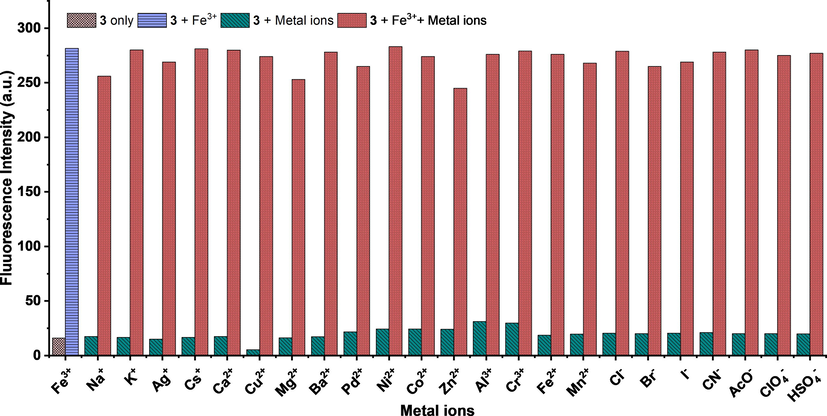
Competitive study of probe 3 with Fe3+ in the absence and presence of three equivalents of other metals ions (λex = 326 nm, λem = 453 nm).
The fluorescence spectra of probe 3 did not show significant variation as compared to the same amount of Fe3+ in solution with and without three equivalents of other cations. The coefficient of variation in the percent change of fluorescence intensity was below ±10%. These results indicated that the probe 3 recognizes Fe3+ ions without any interference from other potentially competing cations. Therefore, the high selectivity and specificity of probe 3 for Fe3+ ions make it a suitable chemosensor for the analytical applications in the real sample analysis. The fluorescence intensity at 453 nm was plotted at various concentrations of Fe3+ ions to obtain a calibration plot (Fig. S7†). The LOD = 3σ/slope, and IUPAC approved equation was used for the determination of limit of detection (LOD) (Long and Winefordner, 1983). Where σ is the standard deviation of (n = 10) blank samples, and LOD was found to be 21.5 nM. The probe 3 detects Fe3+ ions with the LOD lower than that of the recommendations by WHO in potable water (21.5 × 10⁻⁹ M vs. 5.36 × 10⁻⁶ M). Further, in comparison to the various reported methods (Table S3†), the sensing capability of the probe 3 for Fe3+ ion designated that the fluorescence assay presented here is sensitive, selective, and facile.
3.6 Effect of pH on the detection of Fe3+ and reversibility of the probe 3
The effect of pH on probe 3 has been tested both in the absence and in the presence of Fe3+ ions (pH 2.0–12.0) as shown in Fig. 7a. The emission intensity (λem = 453 nm) of the probe 3 did not show significant change with change in pH. However, in the presence of Fe3+ ions in the equimolar ratio, the emission intensity (λem = 453 nm) of probe 3.Fe3+ complex has changed considerably with the change in pH value. The emission intensity of the probe 3.Fe3+ complex is significantly high at pH 2.0–6.0 than pH 7.0 at which all other experiments were carried out. The increase in pH value showed a significant decrease in the emission intensity of the probe 3.Fe3+ complex.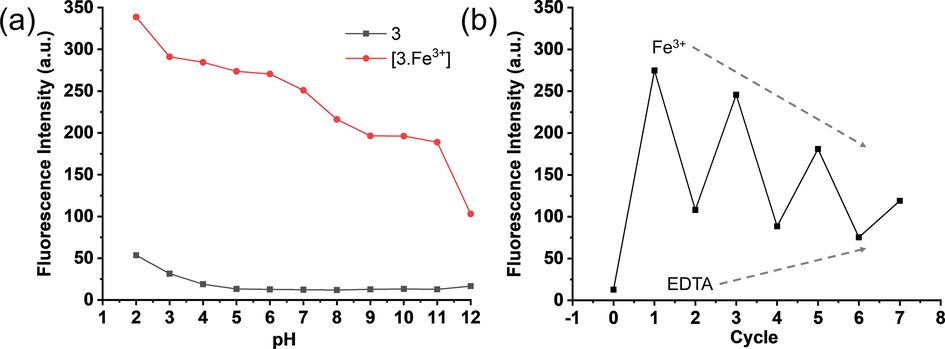
(a) Fluorescence intensity of probe 3 and probe 3.Fe3+ complex in acetonitrile:HEPES buffer (at various pH values) (50:50; v/v) binary mixture, (b) Fluorescence intensities of 3.Fe3+ complex (1:1) in the presence of EDTA for many cycles) in acetonitrile:water (50:50; v/v) binary mixture. Fluorescence spectra were recored using λex = 326 nm and λem = 453 nm.
These pH-dependent studies indicate that the interactions of the Fe3+ ions with probe 3 are pH dependant. The decrease in emission intensity with the increase in pH indicates that the Fe3+ ions are released from the complex, perhaps due to interaction with increased −OH concentration. Nevertheless, the probe 3, when complexed with Fe3+ ions, showed significant fluorescence intensity at pH 7.0, indicating the fact that the probe 3 could be employed for biological applications to detect the intracellular Fe3+ ions.
The reversibility of chemosensors is an essential characteristic for adjudicating its ability for various applications. The reversibility also indicates the stability of the probe and its complex with metal ion during in vitro studies. Probe 3 was evaluated in a reversibility test in the presence of Fe3+ ions and EDTA, as shown in Fig. 7b. The emission spectra of probe 3 have been recorded with one equivalent of Fe3+, showing the high emission intensity indicating the formation of probe 3.Fe3+ complex. Upon the addition of four equivalent of EDTANa2 to the solution, the emission intensity significantly decreased. The quenching in intensity in the presence of EDTANa2 indicates that it seizes the metal ion from the 3.Fe3+ complex and liberate the free probe 3. The addition of one equivalent of Fe3+ ion to the solution causes emission enhancement, which was quenched by adding another four equivalents of EDTA. This cycle of reversibility repeats several times. These results indicate that the probe 3 is reversible for Fe3+ ion binding. However, the requirement of four equivalent EDTA to significantly quench the fluorescence intensity indicates that the probe 3 forms a stable 3.Fe3+ complex.
3.7 Quantum yield of probe 3 and probe 3.Fe3+ complex
Quantum yields of probe 3 and its complex with Fe3+ have been determined using quinine sulfate as a standard. The quantum yield of the probe 3 is minimal (φ = 0.0028). The quantum yield of probe 3 increases 72.5 folds in the presence of Fe3+ ions to form probe 3.Fe3+ complex (φ = 0.203).
3.8 Cytotoxicity and cell imaging application of probe 3 for Fe3+ ions
Probe 3 was used to detect Fe3+ in living HTC 116 cell lines to explore its biological applications. The MTT assay allowed to estimate the cytotoxicity of probe 3, Fe3+, and probe 3.Fe3+ complex after exposure of cells to the concentrations of 1, 10, 25, and 50 µM for 24 h with DMSO as a control. As depicted in Fig. 8a, the results are shown as the percent cell growth for each group compared to the control.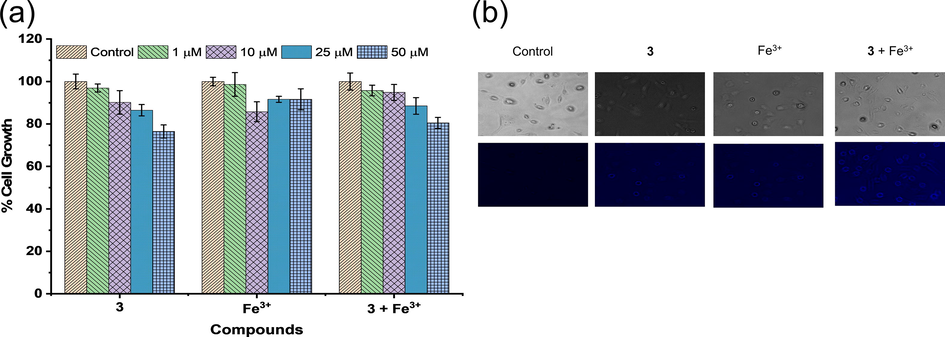
(a) Cytotoxicity assay of probe 3, Fe3+, and probe 3 + Fe3+ on the HTC 116 cells after 24 h, (b) bright-field images (top row), green channel (middle row), and red channel (bottom row) of cells incubated with control, probe 3, Fe3+, and probe 3 + Fe3+.
There was no significant cell death even after 24 h of treatment at 1–25 µM of the probe 3, Fe3+ ions, and the probe 3.Fe3+ complex, as shown in Fig. 8a. However, upon treatment at 50 µM of probe 3 and probe 3.Fe3+ complex, the 20% decrease in cell growth was observed. Hence, for cell imaging applications, a concentration of 10 µM of probe 3 was chosen.
Upon incubation of cells with Fe3+ ions (10 µM), the cells showed non-significant fluorescence, as shown in Fig. 8b. However, upon incubation with probe 3 (10 µM) only, very weak fluorescence was observed. However, the fluorescence intensity was increased upon incubation of cells with probe 3 in the presence of the Fe3+ ions (Fig. 8b). These results indicated that the probe 3 has a high potential in the biological applications to detect Fe3+ in an in vitro assays.
4 Conclusion
In summary, a novel tetradentate probe comprising two nitrogen atoms (N) of the azomethine moieties and two oxygen atoms (O) of the phenolic hydroxyl groups was designed and synthesized using a simple Schiff base condensation reaction. The synthesized probe showed a highly sensitive and highly specific fluorescent ‘turn-on’ effect (λem = 453 nm) for the 1:1 binding with Fe3+ ions in a semi-aqueous medium (acetonitrile:water (50:50; v/v)) and living cells. The 1:1 binding stoichiometry of probe 3 and Fe3+ ions was proposed by DFT calculations and confirmed by the NMR spectroscopy, crystal structures of probe 3 and 3.Fe3+ complex, and mass spectrum of probe 3.Fe3+ complex. The reversibility of probe 3 for binding with Fe3+ ions in the presence of EDTA indicates that it can be an effective chemosensor for detecting Fe3+ ions in various samples, including living cells. Importantly, with the LOD of 21.5 nM for detecting Fe3+ ions, probe 3 did not show any interference from potentially competing ions even at a 1:3 ratio, indicates its biocompatibility. Finally, the probe 3, with excellent cytocompatibility and cell permeability, was successfully applied for monitoring the Fe3+ ions in the live HTC 116 cells.
Acknowledgments
Hallym University Research Fund (HRF-201911-008) supported this research.
References
- Highly fluorescent nitrogen-doped carbon dots derived from Phyllanthus acidus utilized as a fluorescent probe for label-free selective detection of Fe3+ ions, live cell imaging and fluorescent ink. Biosens. Bioelectron.. 2018;99:303-311.
- [CrossRef] [Google Scholar]
- Comprehensive Supramolecular Chemistry. Elsevier Exeter; 1996.
- A rapid aqueous fluoride ion sensor with dual output modes. Angew. Chem. Int. Ed.. 2001;113:502-532.
- [CrossRef] [Google Scholar]
- A Spectrophotometric Investigation of the Interaction of Iodine with Aromatic Hydrocarbons. J. Am. Chem. Soc.. 1949;71:2703e7.
- [CrossRef] [Google Scholar]
- Glutathione capped silver nanoclusters-based fluorescent probe for highly sensitive detection of Fe3+. Sens. Actuat. B: Chem.. 2014;202:631-637.
- [CrossRef] [Google Scholar]
- Electrolyzing synthesis of boron-doped graphene quantum dots for fluorescence determination of Fe3+ ions in water samples. Talanta. 2017;164:100-109.
- [CrossRef] [Google Scholar]
- A naphthalimide based PET probe with Fe3+ selective detection ability: theoretical and experimental study. Analyst. 2014;139:6352-6356.
- [CrossRef] [Google Scholar]
- Nanoparticle probes for the detection of cancer biomarkers, cells, and tissues by fluorescence. Chem. Rev.. 2015;115:10530-10574.
- [CrossRef] [Google Scholar]
- A voyage into the synthesis and photophysics of homo- and heterobinuclear ensembles of phthalocyanines and porphyrins. Chem. Soc. Rev.. 2013;42:8049-8105.
- [CrossRef] [Google Scholar]
- Determination of ultra-trace concentrations of elements in high purity tellurium by inductively coupled plasma mass spectrometry after Fe(OH)3 coprecipitation. J. Spectrochim. Acta. Part B.. 2003;58:1679-1685.
- [CrossRef] [Google Scholar]
- Selective fluorescence sensing of Cu(ii) and Zn(ii) using a new Schiff base-derived model compound: naked eye detection and spectral deciphering of the mechanism of sensory action. Analyst. 2013;138:6532-6541.
- [CrossRef] [Google Scholar]
- Avogadro: An advanced semantic chemical editor, visualization, and analysis platform. J. Cheminfo.. 2012;4(1)
- [Google Scholar]
- Selective fluorescence sensing of Mg2+ ions by Schiff base chemosensor: effect of diamine structural rigidity and solvent. RSC Adv.. 2014;4:41565-41571.
- [CrossRef] [Google Scholar]
- Synthesis and spectroscopic characterization of asymmetric Schiff bases derived from 4′-formylbenzo-15-crown-5 containing recognition sites for alkali and transition metal guest cations. Transition Met. Chem.. 2008;33:421-429.
- [CrossRef] [Google Scholar]
- Graphene oxide-assisted synthesis of bismuth nanosheets for catalytic stripping voltammetric determination of iron in coastal waters. Microchim. Acta. 2016;183:855-861.
- [CrossRef] [Google Scholar]
- Azaindole modified imine moiety as fluorescent probe for highly sensitive detection of Fe3+ ions. Sens. Actuat. B: Chem.. 2016;232:396-401.
- [CrossRef] [Google Scholar]
- Fe(III) conjugated fluorescent organic nanoparticles for ratiometric detection of tyramine in aqueous medium: A novel method to determine food quality. Food Chem.. 2018;245:1257-1261.
- [CrossRef] [Google Scholar]
- Comparison of silver and molybdenum microfocus X-ray sources for single-crystal structure determination. J. Appl. Cryst.. 2015;48:3-10.
- [CrossRef] [Google Scholar]
- Supramolecular Chemistry-Concept and Perspective. Weinheim: VCH; 1995.
- Sulfur-doped graphene quantum dots as a novel fluorescent probe for highly selective and sensitive detection of Fe3+. Anal. Chem.. 2014;86:10201-10207.
- [CrossRef] [Google Scholar]
- Rhodamine-based chemodosimeter for fluorescent determination of Hg2+ in 100% aqueous solution and in living cells. Anal. Chim. Acta. 2016;934:218-225.
- [CrossRef] [Google Scholar]
- Rhodamine-based chemosensor for fluorescence determination of trivalent chromium ion in living cells. Sens. Actuat. B: Chem.. 2016;2016(223):705-712.
- [CrossRef] [Google Scholar]
- A dual-function probe based on naphthalene for fluorescent turn-on recognition of Cu2+ and colorimetric detection of Fe3+ in neat H2O. Spectrochim. Acta, Part A. 2019;210:266-274.
- [CrossRef] [Google Scholar]
- Reaction-based highly selective and sensitive monomer/polymer probes with Schiff base groups for the detection of Hg2+ and Fe3+ ions. Spectrochim. Acta Part A. 2020;243:118763
- [CrossRef] [Google Scholar]
- Development of fluorescent zinc chemosensors based on various fluorophores and their applications in zinc recognition. Dyes Pigments. 2016;131:100-133.
- [CrossRef] [Google Scholar]
- Fluoranthene-based pyridine as fluorescent chemosensor for Fe3+. Inorg. Chem. Commun.. 2011;14:1656-1658.
- [CrossRef] [Google Scholar]
- A new rhodamine-based fluorescent chemosensor for Fe3+ and its application in living cell imaging. Dyes Pigm.. 2014;104:110-115.
- [CrossRef] [Google Scholar]
- Limit of detection a closer look at the IUPAC definition. Anal. Chem.. 1983;55:712A-724A.
- [CrossRef] [Google Scholar]
- Mercury: visualization and analysis of crystal structures. J. Appl. Crystallogr.. 2006;39:453-457.
- [CrossRef] [Google Scholar]
- Fluorescence imaging for Fe3+ in Arabidopsis by using simple naphthalene-based ligands. RSC Adv.. 2016;6:53912-53918.
- [CrossRef] [Google Scholar]
- New water-soluble iminecalix[4]arene with a deep hydrophobic cavity. Tetrahedron Lett.. 2009;50:7346-7350.
- [CrossRef] [Google Scholar]
- Schiff base derived Fe3+-selective fluorescence turn-off chemsensors based on triphenylamine and indole: synthesis, properties and application in living cells. RSC Adv.. 2017;7:36007-36014.
- [CrossRef] [Google Scholar]
- Al3+ selective colorimetric and fluorescent red shifting chemosensor: application in living cell imaging. Dalton Trans.. 2014;43:2895-2899.
- [CrossRef] [Google Scholar]
- Turn-on ratiometric fluorescent probe for selective discrimination of Cr3+ from Fe3+ in aqueous media for living cell imaging. Chem. Eur. J.. 2015;21:16349-16353.
- [CrossRef] [Google Scholar]
- Water-soluble sulfonate Schiff-base ligands as fluorescent detectors for metal ions in drinking water and biological systems. ACS Omega. 2019;4:2874-2882.
- [CrossRef] [Google Scholar]
- A New approach in cancer treatment: discovery of chlorido[N, N'-disalicylidene-1,2-phenylenediamine]iron(III) complexes as ferroptosis inducers. J. Med. Chem.. 2019;62(17):8053-8061.
- [CrossRef] [Google Scholar]
- A highly selective fluorescent probe for Fe3+ in living cells: a stress induced cell based model study. Org. Biomol. Chem.. 2017;15:1006-1012.
- [CrossRef] [Google Scholar]
- Crystal structure refinement with SHELXL. Acta Cryst.. 2008;A64:112-122.
- [CrossRef] [Google Scholar]
- Photoinduced electron transfer process on emission spectrum of N, N’-bis(salicylidene)-1,2-phenylenediamine as a Mg2+ cation chemosensor: a first principle DFT and TDDFT study. J. Mol. Struct.. 2018;1161:339-344.
- [CrossRef] [Google Scholar]
- A novel terephthalaldehyde based turn-on fluorescent chemosensor for Cu2+ and its application in imaging of living cells. Photochem., A. Photobiol. Sci.. 2017;16:1464-1470.
- [CrossRef] [Google Scholar]
- Metabolism and function of coenzyme Q. Biochim Biophys Acta.. 2004;1660:171-199.
- [CrossRef] [Google Scholar]
- Method development for the redox speciation analysis of iron by ion chromatography–inductively coupled plasma mass spectrometry and carryover assessment using isotopically labeled analyte analogues. J. Chromatogr. A.. 2014;1347:96-103.
- [CrossRef] [Google Scholar]
- Solvent directed selective and sensitive fluorescence detection of target ions using a coumarin–pyridine probe. Analyst. 2018;143:5583-5588.
- [CrossRef] [Google Scholar]
- A novel “turn-on” fluorescent probe for Fe3+ in aqueous media based on C[double bond, length as m-dash]N isomerization. New J. Chem.. 2013;37:274-277.
- [CrossRef] [Google Scholar]
- Solvent-dependent and highly selective anion sensing and molecular logic application of bisindolylmaleimide derivatives. RSC Adv.. 2017;7:12161-12169.
- [CrossRef] [Google Scholar]
- Cu2+ biological imaging probes based on different sensing mechanisms. Curr. Med. Chem.. 2019;26(21):3958-4002.
- [CrossRef] [Google Scholar]
- A dual responsive colorimetric/fluorescent turn-on sensor for highly selective, sensitive and fast detection of Fe3+ ions and its applications. J. Photoch. Photobio. A. 2019;382 111876 (1–8)
- [CrossRef] [Google Scholar]
Appendix A
Supplementary material
Supplementary data to this article can be found online at https://doi.org/10.1016/j.arabjc.2020.09.061.
Appendix A
Supplementary material
The following are the Supplementary data to this article:Supplementary data 1
Supplementary data 1


