

Translate this page into:
A novel fluorescent aptasensor based on mesoporous silica nanoparticles for the selective detection of sulfadiazine in edible tissue
⁎Corresponding author. letao@cqnu.edu.cn (Tao Le)
-
Received: ,
Accepted: ,
This article was originally published by Elsevier and was migrated to Scientific Scholar after the change of Publisher.
Abstract
Abstract
Sulfadiazine (SDZ) is a broad-spectrum antibiotic used to treat bacterial infections in animals, and SDZ residues in food can be harmful to human health. As a result, an aptasensor based on silica nanoparticles was developed for the rapid detection of SDZ. An aptamer that specifically binds to SDZ was obtained using graphene oxide-SELEX and further truncated to a 13 nt sequence (SDZ30-1:5′-AACCCAATGGGAT-3′), which has a high affinity (Kd = 65.72 nM). In addition, it was found by molecular simulation that a steric hindrance could prevent the target molecule from entering the binding pocket formed by the key base “TGG”, which affects the total binding free energy of SDZ30-1 and the target molecule, thereby affecting the affinity of SDZ30-1 to the target. The SDZ30-1 was selected as the fluorescent probe to establish an aptasensor for the detection of SDZ residues in milk and honey. The aptasensor exhibited a wide dynamic linear range (3.125 – 100 ng/mL) and a limit of detection (LOD = 1.68 ng/mL). The aptasensor in spiked samples recovered at a rate of 95.12 – 105.47%, with a coefficient of variation of less than 13.18 %. The results of aptasensor were positively correlated with those of HPLC (R2 > 0.8687). Based on the above results, it could be inferred that the aptasensor can be used sensitively and rapidly for the detection of SDZ residues in edible tissue.
Keywords
Sulfadiazine
Aptamer
Molecular stimulation
Fluorescent aptasensor

1 Introduction
Sulfadiazine (SDZ) belongs to the family of sulfonamides, and it is frequently used in animal husbandry to prevent and treat bacterial infections in livestock due to its high efficiency and low cost (Kazemi et al., 2017). However, it has been demonstrated that high levels of SDZ residues can accumulate in human bodies through food chains, causing allergic reactions, impaired liver function, damaged urinary system, and hemolytic anemia symptoms (Alipanahpour et al., 2021). Therefore, the US, EU, and China set a maximum residue limit of 100 µg/kg for SDZ in edible tissue (Dong et al., 2019). SDZ residues were determined by enzyme-linked immunoassay (Chen et al., 2017), high performance liquid chromatography (HPLC) (Gaballah et al., 2021), and capillary electrophoresis (Li et al., 2020a). Although these methods are reliable and sensitive, they usually require high technical expertise, and are expensive and time-consuming. Therefore, it is necessary to develop a simple, rapid, and low-cost detection method to detect SDZ residues in edible tissue.
Aptamers are short single-stranded DNA/RNA, with the advantages of in vitro synthesis, easy modification, convenient store, and long-term stability (Sadeghi et al., 2018). Since aptamers can fold into specific spatial conformations and then specifically bind to targets, they are used in the field of biosensor monitoring (Chen et al., 2022, Sharma et al., 2022). Among them, fluorescent aptasensors have attracted much attention due to their advantages of simple operation, fast response speed, and no damage to samples (Zhao et al., 2021). And fluorescent aptasensors based on nanomaterials (quantum dots, nano gold, nano silicon, etc.) are widely used due to their high specificity and precision (Wang et al., 2020, Wang et al., 2021). Mesoporous silica (MSNs), with its uniform pore size and easy surface modification, is often used as a fluorescent molecular loading platform for aptasensors to detect antibiotics (Birader et al., 2021), toxins (Tan et al., 2019), and heavy metals (Ma et al., 2020). These approaches rely on the interaction of positively charged aminated mesoporous silica (MSN-NH2) and negatively charged aptamers to build molecular gates that seal fluorescein molecules in the pores. (Tan et al., 2020). However, long-term centrifugation and excessive washing with distilled water will lead to the leakage of fluorescein molecules, resulting in loss of precision. Therefore, we constructed an aptasensor to detect SDZ residues by immobilizing fluorescein molecules on the surface of MSNs using the Watson-Crick base complementary pairing principle.
Molecular simulations, an in silico strategy for drug discovery, have been used to study the binding mechanism between aptamers and targets (Habibzadeh et al., 2019). Recently, aptamer binding mechanisms to targets have been discovered in the aptamer screening literature (Dolati et al., 2018, Zhang et al., 2018, Zhu et al., 2021). However, most of the literature has used molecular docking to perdict the position and distance of hydrogen bonds between aptamer-target complexes. The Van der Waals interactions such as π-π stacking, CH/π interactions, and hydrophobic interactions, which play an important role in binding of the aptamer to the targets, have not been considered yet (Trinh et al., 2021). Therefore, our team investigated the effect of the van der Waals interaction forces on the aptamer binding target using molecular docking and molecular dynamics (MD) simulations.
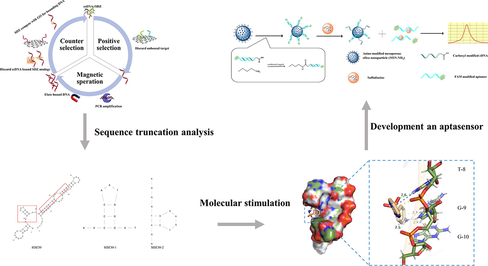
In this study, the graphene oxide(GO)-SELEX strategy was used to screen the aptamers of SDZ, and truncated aptamers (13 nt) with high affinity and specificity were eventually obtained by optimizing the primary, secondary, and tertiary structures of the aptamers. To the best of our knowledge, this is the first report of a truncated aptamer of SDZ. Molecular docking techniques and MD simulations were used to study how van der Waals forces affect target recognition by aptamers. Furthermore, the aptasensor was constructed to detect SDZ residues in edible tissue by immobilizing fluorescent molecules on the silica surface.
2 Materials and methods
2.1 Material and reagents
All standard antibiotics were purchased from Sigma-Aldrich (St. Louis, MO, USA). GO (2 mg/mL, 500 nm), streptavidin magnetic beads and carboxyl functionalized magnetic beads (MBs) (30 mg/mL, 2 × 100 beads/mL) were purchased from Invitrogen (Carlsbad, CA, USA). MSN-NH2, 1-(3-Dimethylaminopropyl)-3-ethyl carbodiimide (EDC) was supplied by Sangon Biotech (Shanghai, China). Black polystyrene microtiter plates were purchased from Thermo Fisher Scientific Inc (Wilmington, USA). All other chemicals were of analytical grade and were obtained from Beijing Chemical Reagent Company (Beijing, China).
The primer sequences listed below have all been used in previous studies (Shi et al., 2020). All oligonucleotide sequences were synthesized by Shanghai Sangong Biotechnology Co., Ltd. (Shanghai, China). The ssDNA library for aptamer selection:
5′-FAM-GACAGGCAGGACACCGTAAC-N40-CTGCTACCTCCCTCCTCTTC-3′,
Forward primer (FP):5′-FAM-GACAGGCAGGACACCGTAAC-3′,
Reverse primer (RP):5′-biotin-GAAGAGGAGGGAGGTAGCAG-3′,
cDNA: 5′-COOH-ATCCCATTGGGTT-3′.
2.2 In vitro selection of aptamers
The GO-SELEX technique was used to select aptamers in this study (Kou et al., 2020). Briefly, 200 μL of 500 nM ssDNA library was denatured at 95 °C for 10 min, quickly cooled on ice for 10 min and then incubated at 25 °C for 25 min. For the initial screening, 200 μL of 500 nM ssDNA library was incubated with an equal mole number of SDZ for 1 h at 25 °C under agitation. Subsequently, 2 mg/mL GO solution (mass ratio of ssDNA/GO was 1:25, Fig. S1) was added to the reaction solution and incubated at 25 °C under stirring for 20 min. ssDNA not bound to SDZ was adsorbed on the surface by GO via π-π stacking. After incubated for 20 min and centrifuged at 15,000 rpm for 10 min, the supernatant was collected.
The collected supernates were amplified with FP and RP. The original PCR reaction system was 2 × Taq Master Mix 100 μL, FP (50 μM) 4 μL, RP (50 μM) 4 μL and template solution 92 μL. A total of 11 cycles were perfomred, with the parameters set as follows: pre-denaturation at 95 °C for 5 min, at 95 °C for 30 s, at 58 °C for 30 s, and at 72 °C for 10 s, followed by the extension at 72 °C for 1 min (Fig. S2). The PCR amplification product was purified with streptavidin magnetic beads, and then the streptavidin magnetic beads were washed with NaOH (50 mM). The eluate was collected as the library for the next round of screening. Sulfonamides were then used as negative screening. Finally, SDZ was added for positive screening again and again until the ssDNA content in the system did not change (Fig. S3). UV–VIS spectroscopy (UV–VIS spectroscopy, Hitachi UH5300, Japan) was used to determine the ssDNA content at the end of each screening cycle.
2.3 Affinity characterization of sequence and sequence truncation analysis
First, SDZ dissolved in dimethylformyl was added to the EDC-activated MBs solution and incubated for 10 h with shaking.Subsequently, the MBs were rinsed three times with phosphate-buffered solution (PBS, PH = 7.4). Next, different concentrations of aptamers (25, 50, 100 150, 200 nM) labeled with FAM (λex = 492 nm and λem = 518 nm) were mixed with MBs and incubated in the dark for 1 h. MB was washed with PBS for 3 times, then washed with 50 mM NaOH, and finally the supernatant after washing was collected. The fluorescence intensity in the supernatant was used to characterize the affinity of aptamers. The fluorescence intensity was measured with Vorioskan LUX (Thermo Scientific, USA). Affinity was expressed by calculating the dissociation constant (Kd) value. The Kd value was calculated according to the equation Y = Bmax × X/(Kd + X), Origin 9.0 software was used for nonlinear regression analysis, where X is the concentration of aptamer, Y is the relative fluorescence intensity, and Bmax is the maximum number of binding sites (Sadeghi et al., 2018, Kou et al., 2020, Zhu et al., 2021).
The candidate aptamer with the lowest Kd value was selected as the subsequent aptamer truncated analysis. Multiple sequence alignments were performed on the primary structure pairs of sequences using DNAMAN (https://www.lynnon.com/dnaman.html) to find conserved motifs. The secondary structures of these candidate aptamers were predicted at room temperature using internet-based Mfold (https://www.unafold.org/).
2.4 Molecular Docking
The tertiary structures of aptamer were obtained from RNAComposer. (https://rnacomposer.cs.put.poznan.pl/). The SDZ secondary structure was mapped using Chemoffice 2019 software and its energy was minimized. To determine the possible binding site between SDZ and SDZ30-1 (a truncated aptamer), molecular docking was performed using Autodock 1.5.6 (https://autodock.scripps.edu) and then visualized using PYMOL software (https://pymol.org).
2.5 MD trajectory analysis
MD simulations were performed using the GROMACS 2016.6 and G_MMPBSA software (Kumari et al., 2014, Autiero et al., 2018). Equilibration was performed at constant particle number, volume and temperature and isothermal isobaric. The aptamer-target complexes were first subjected to 100 ns of implicit solvent model MD simulations, followed by explicit solvent MD simulations of the resulting structurally stable complexes. The stability of aptamer-target complex was then assessed using the root mean square deviation (RMSD).
2.6 Combined with free energy calculations
The MM/PBSA method, which is also known as the Molecular Mechanics/Poisson-Boltzmann surface area for calculations, was used to estimate binding free energy and energy decomposition of MD trajectories. The binding free energy is split into a molecular mechanics term and a solvation energy which are calculated separately. The basic principle of the calculation is the difference between the binding free energy of two solvated molecules in the bound and free states or comparing the binding free energy of different solvated conformations of the same molecule (Klimovich et al., 2015). ΔGbind is the free energy of binding, Evdw is van der Waals energy, Eele is the electrostatic energy in the gas phase, Gpolar is the polar solvation energy, Gnonpolar is non-polar solvation energy.
2.7 Construction of the aptasensor
The schematic diagram of the fluorescent aptasensor constructed on silica was shown in Fig. 1. First, 20 mg of MSN-NH2 was dispersed in PBS (PH = 7.4), 50 µL of carboxylated cDNA (10 µM) was activated with EDC, and then they were mixed and incubated for 2 h to form MSN-NH2/cDNA complexes. 50 µL of aptamer (10 µM) was added and incubated in the dark for 3 h, and the pellet was retained by centrifugation to form the MSN-NH2/cDNA/aptamer complex. Finally, the compounds were resuspended in PBS and stored at 4 °C for later use.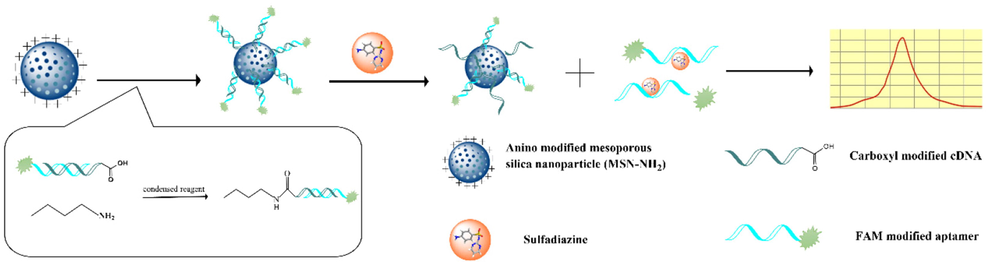
Schematic diagram of a fluorescent aptasensor based on MSN-NH2 to detect SDZ.
A standard curve was established as follows. 10 µL of the above particle suspension (aptamer concentration of 600 nM) was added to 150 µL of SDZ solutions of various concentrations (0, 3.125, 6.25, 12.5, 25, 50, 100 ng/mL) diluted in PBS. Then, the mixed solution was incubated for 1 h at 25° C in the dark. Finally, the supernatant was retained by centrifugation, and its fluorescence value was measured. The limit of detection (LOD) was calculated according to LOD = 3 SD/slope, SD was the standard deviation of the fluorescence intensity of the blank sample, and the slope was the slope of the linear regression response curve (Yan et al., 2022).
2.8 Aptasensor for analysis of SDZ in real-world samples
The aptasensor was validated using real-world samples spiked with known concentrations of SDZ (50, 100, and 150 µg/kg). The samples were purchased from the local market, and the processing method was referred to the supplementary information. The original samples were confirmed to be free of SDZ by HPLC. The spiked samples were tested using aptasensor and HPLC, and both recovery rate and coefficient of variation were evaluated. The recovery formula was as follows: (measured concentration/known concentration) × 100%. The concentration of each spiked recovered sample was measured five times.
3 Results and discussion
3.1 Characterization of aptamers
All candidate sequences were divided into five families based on homology (Table S1). Based on the multiple sequence alignment of thirty candidate sequences, most of the candidate sequences shared the conserved motifs ‘TGG’ and ‘GGT’. Subsequently, the secondary structures of the candidate sequences were analyzed and the conserved motifs were located on the stem loop as important parameters for screening candidate aptamers. (Macdonald et al., 2016, Ye et al., 2019). Finally, SDZ1, SDZ15, SDZ22, SDZ25, and SDZ30 were selected as candidate aptamers for subsequent experiments (Fig. S5).
The Kd vaule of each candidate aptamer was then measured by fluorimetry to evaluate their affinity to SDZ (Ma et al., 2015). Targeted at a fixed amount of SDZ (50 ng/mL), the binding reaction was carried out with different concentrations of FAM-labeled candidate aptamers. The fluorescence intensity in the supernatant was evaluated after elution. The amount of aptamer used was proportional to the intensity of the fluorescence. A non-linear fit using Origin 9.0 software allowed the dissociation constants of each aptamer to be determined according to the equation Y = Bmax × X/(Kd + X). As shown in Fig. 2A, the Kd values of SDZ15 (Kd = 245.42 nM) and SDZ30 (Kd = 217.77 nM) were significantly lower than other candidate aptamers. The specificity of SDZ30 and SDZ15 was then evaluated. The results were shown in Fig. 2B and Fig. S4, the relative fluorescence intensity obtained by SDZ30 combined with SDZ was much higher than that of other antibiotics, and SDZ15 also showed a certain preference for other sulfonamide antibiotics. This showed that the specificity of SDZ30 to SDZ was better than that of SDZ15. Therefore, SDZ30 was selected for subsequent experiments.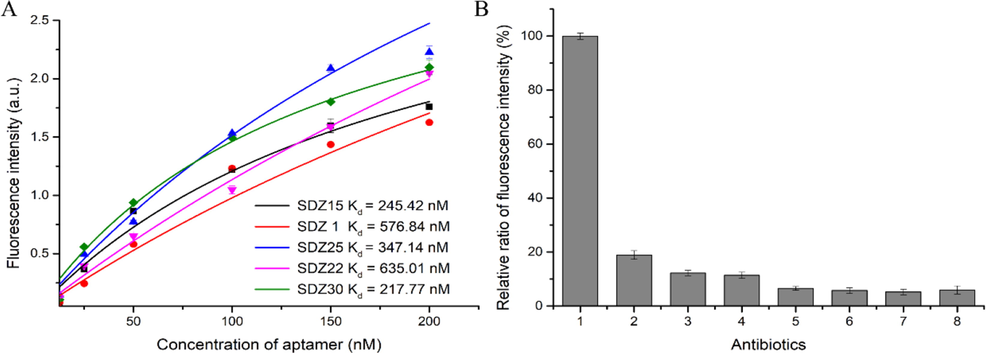
(A) The affinity of each aptamer was determined using a non-linear regression equation, and the relationship between FAM-aptamer concentration and relative fluorescence intensity was studied; (B) Verification of the specificity of SDZ30 to SDZ, (1) SDZ, (2) SN, (3) SMR, (4) SMZ, (5) Kanamycin, (6) Chloramphenicol, (7) Oxytetracycline, (8) Doxycycline, the aptamer concentration was 1 μM, and the concentration of all antibiotics was 100 ng/mL.
3.2 Optimization of the aptamer sequence
To make the aptamer have a better practical application ability, the sequence of SDZ30 was truncated. The secondary structure of SDZ30 was shown in Fig. 3A, and the conserved motifs “TGG” and “GGT” were located in the two stem-loops, respectively. According to the result of previous studies, the binding sites of aptamers to targets were usually in stem-loops, G-quadruplexes, and pseudoknots (Chen et al., 2014, Macdonald et al., 2016, Wu et al., 2019, Gao et al., 2020). Therefore, we truncated the two stem loops and named them SDZ30-1 (Fig. 3B) and SDZ30-2 (Fig. 3C). As shown in Table 1, the affinity of SDZ30-1 (Kd = 65.72 nM) was approximately 4 times higher than that of SDZ30. The affinity of SDZ30-2 (Kd = 210.41 nM) remained unchanged from that of SDZ30. Therefore, we choose SDZ30-1 (5' – AACCCAATGGGAT − 3') as the aptamer for practical application.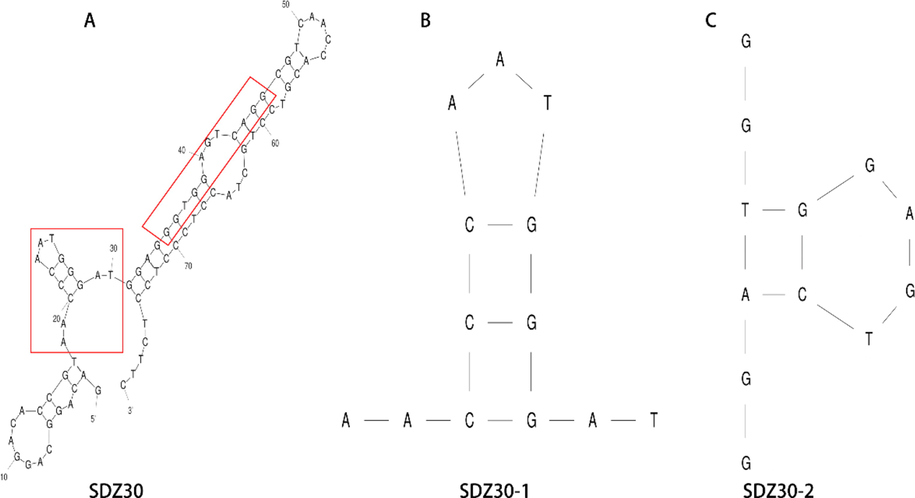
SDZ30 secondary structures and truncated aptamer secondary structures.(A) SDZ30; (B) SDZ30-1; (C)SDZ30-2.
Aptamers
Seqquences (5′–3′)
Kd (nM)
SDZ30
GACAGGCAGGACACCGTAACCCAATGGGATGGAGGGTGG
AGTCAGGCGTCAACCACGTCCTGCTACCTCCCTCCTCTTC217.77
SDZ30-1
AACCCAATGGGAT
65.72
SDZ30-2
GGTGGAGTCAGG
210.41
3.3 Aptamer/ligand equilibrum simulation
MD simulations were carried out with SDZ30-1 using SDZ, sulfanilamide (SN), sulfamerazine (SMR) and sulfamethazine (SMZ) as ligands, respectively. Structural changes of the SDZ30-1/ligand complex during the simulation were observed using RMSD (Chen et al., 2019). As shown in Fig. 4, in the range of 0–20 ns, the RMSD value curves of the four systems fluctuate significantly, indicating that the nucleic acid backbone was moving violently during this process (Xie et al., 2020). The average RMSD was 0.5 nm within 20 to 100 ns, as shown in Fig. 4A, and there was no noticeable fluctuation, showing that the SDZ30-1/SDZ has stabilized. The SDZ30-1/SN was stable from 40 ns to 100 ns, with an average RMSD of 0.6 nm, showing that it was less stable than the SDZ30-1/SDZ (Fig. 4B.). Fig. 4C and D showed that the RMSD value curves of SDZ30-1/SMZ and SDZ30-1/SMR showed no signs of stability from 0 to 100 ns, indicating that the stability of SDZ30-1/SMZ and SDZ30-1/SMR was weaker than SDZ30-1/SN. This indicated that one of the reasons why SDZ30-1 specifically binds to SDZ was that SDZ30-1/SDZ has the highest stability.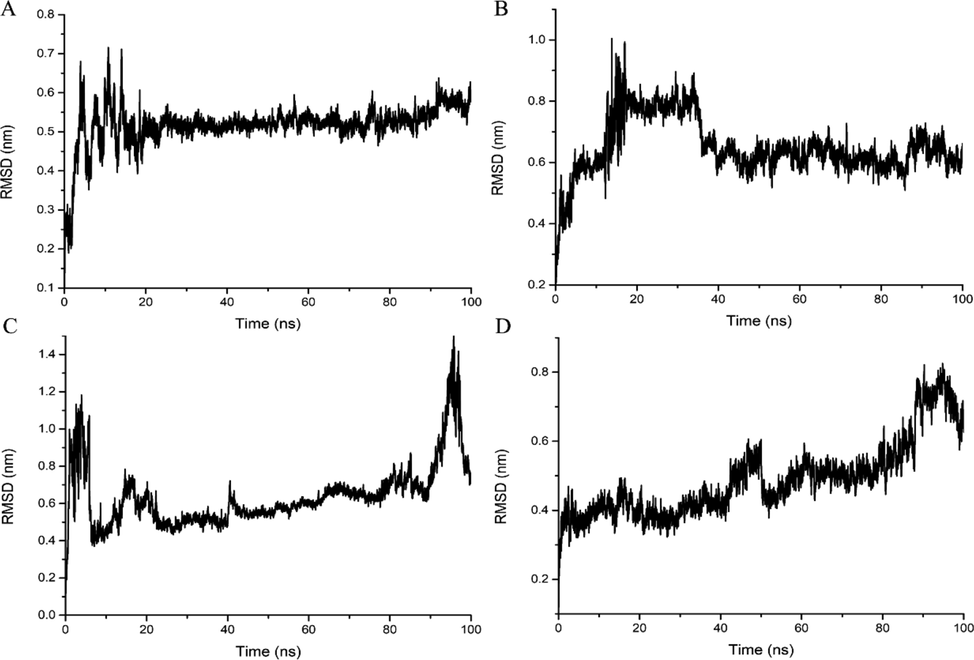
RMSD values for SDZ30-1 with (A) SDZ, (B) SN, (C) SMR, (D) SMZ.
3.4 Binding free energy analysis of SDZ30-1/ligand
To investigate the effect of aptamer/ligand binding free energy variations on SDZ30-1 affinity, the binding free energy of SDZ30-1 to SDZ, SN, SMR, and SMZ was calculated using the MM/PBSA method (Sponer et al., 2014). As shown in Table 2, the binding free energies of SDZ30-1 and the four sulfonamides were −17.37 Kcal/mol, −7.33 Kcal/mol, −4.87 Kcal/mol, and −3.43 Kcal/mol, respectively. As show in Fig. 4, the SDZ30-1/SDZ system was the most stable, with the highest electrostatic energy and the lowest solvation energy, while the SDZ-1/SMZ system was the most unstable, with the lowest electrostatic energy and the highest solvation energy. Therefore, the van der Waals energy and the electrostatic energy played a pivotal role in the specific binding of SDZ30-1, while the solvation energy can hinder the specific binding of SDZ30-1.
Energy
SDZ
SN
SMR
SMZ
ΔGvdw
−45.68 ± 0.89
−46.94 ± 2.29
−47.46 ± 0.98
−48.73 ± 2.98
ΔGele
−15.96 ± 1.43
−12.82 ± 0.92
−11.86 ± 2.25
−13.19 ± 1.02
ΔGpolar
28.26 ± 2.53
33.43 ± 2.49
34.32 ± 1.83
36.35 ± 2.15
ΔGnonpo
16.01 ± 1.71
19.00 ± 0.87
20.13 ± 0.65
22.14 ± 1.00
Δsolv
44.28 ± 4.52
52.44 ± 3.44
54.45 ± 3.67
59.40 ± 4.32
ΔGtotal
−17.37 ± 1.12
−7.33 ± 1 0.22
−4.87 ± 1.01
−3.43 ± 0.85
3.5 Structural analysis of SDZ30-1/ligand
As a representative structure for the SDZ30-1/ligand, we used the stable structure from the kinetic simulations. As shown in Fig. 5, the four ligand were located near the pocket formed by the conserved sequence “TGG” (The eighth, ninth, and tenth bases of the 5′ end of SDZ30-1: T8, G9, G10), and the distance between the four ligand molecules and the pocket was positively correlated with the size of molecule (VSDZ = 233.7 A3, VSN = 159.6 A3, VSMR = 254.0 A3, VSMZ = 269.1 A3) (Li et al., 2020b). In the structure diagram, the green bonds represent hydrogen bonds, the yellow bonds represent π-anions, the red bonds represent CH/π interactions, the blue bonds represent π-sulfur bonds, and the gray bonds represent π–π stacking. Among them, π–π stacking and CH/π interaction belong to van der Waals interaction, and hydrogen bond belongs to electrostatic interaction.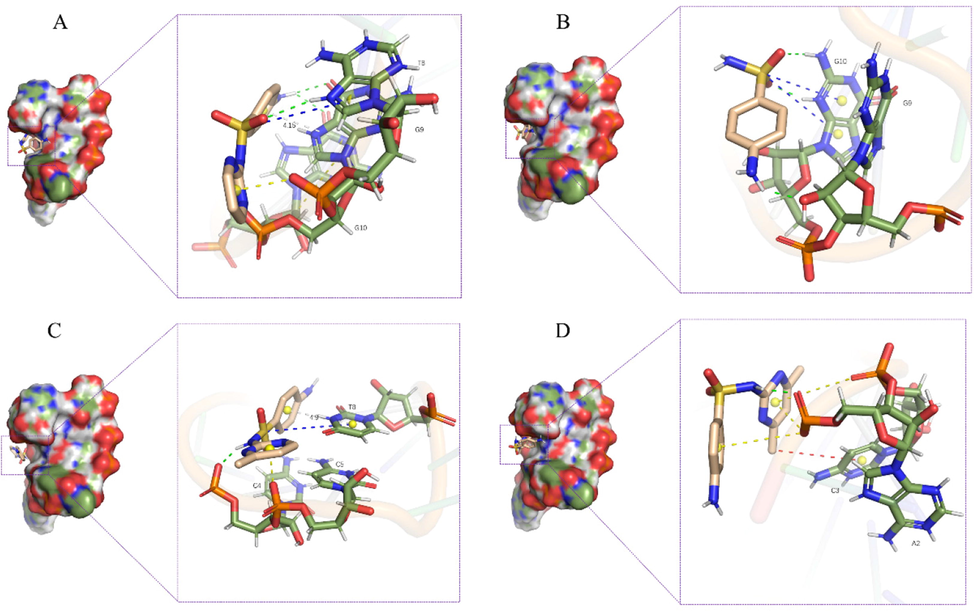
Three-dimensional structure of (A) SDZ30-1/SDZ, (B) SDZ30-1/SN, (C) SDZ30-1/SMR, (D) SDZ30-1/SMZ.
For SDZ30-1/SN, as shown in Fig. 5B, SN entered the binding pocket due to its small size, and SN formed hydrogen bonds with G9 base and G10 base, respectively. However, because SN lacks a six-membered carbon–nitrogen ring, the binding free energy contribution of G9 base and G10 base to SDZ30-1/SN was lower than that of SDZ30-1/SDZ (Fig. S6). For the SDZ30-1/SDZ, as shown in Fig. 5A, there was a π-anion interaction between the T8 base and the six-membered carbon–nitrogen ring, forming a delocalized π bond with -NHSO2-, so the binding pocket can accommodate SDZ well. There was a π-π stacking between G9 base and the benzene ring, with the shortest interaction distance of 4.12 Å. Thus, T8 base and G9 base contributed the most to the binding freedom of SDZ30-1/SDZ (Fig. S6). For SDZ30-1/SMR, as shown in Fig. 5C, due to the large size of the SMR molecule, it cannot fully enter the binding pocket, and only π-π stacking occured with the T8 base of the conserved motif, and the interaction distance was 4.9 Å. The additional methyl group of the SMR molecule increases the steric hindrance of SDZ30-1 binding to the SMR. For SDZ30-1/SMZ, Fig. 5D demonstrated that the two additional methyl groups in SMZ increase the steric hindrance to accessing the binding pocket, resulting in SMZ not interacting with the conserved motif “TGG”.
3.6 The principle of the aptasensor
The detection mechanism of the aptasensor was shown in Fig. 1. The carboxyl-modified cDNA was attached to MSN by forming an amide bond with MSN-NH2. FAM-labeled aptamers were immobilized on the surface of MSN by Watson-Crick base pairing. When the presence of SDZ was detected in the sample, FAM-labeled aptamers left the surface of MSN and entered the supernatant to bind SDZ. The supernatant was then retained by centrifugation, and the fluorescence intensity in the supernatant was positively correlated with the concentration of SDZ. Finally, quantitative detection of SDZ can be achieved by the measurement of the fluorescence intensity.
3.7 Optimisation of the aptasensor conditions
The aptamer’s concentration and the aptamer/target’s incubation time were chosen as parameters to optimize the aptasensor. As shown in Fig. 6A and B, the concentration of the SDZ30-1 was 600 nM, and the incubation time of aptamer/target was 75 min for the best sensor performance. Under optimized experimental conditions, Fig. 6C showed a good linear relationship between fluorescence intensity and SDZ concentration in the dynamic range of 3.125 to 100 ng/mL (y = 0.02357x + 0.044, R2 = 0.9841). And the LOD of aptasensor for SDZ was 1.68 ng/mL. Furthermore, this detection method was compared with previously reported methods. As shown in Table 3, the LOD of the proposed method was comparable to or even lower than some previously reported methods. Therefore, the fluorescent aptasensor detection method had the advantages of high sensitivity, easy operation, less time consuming and low cost, which can be used as a new method to detect SDZ residues.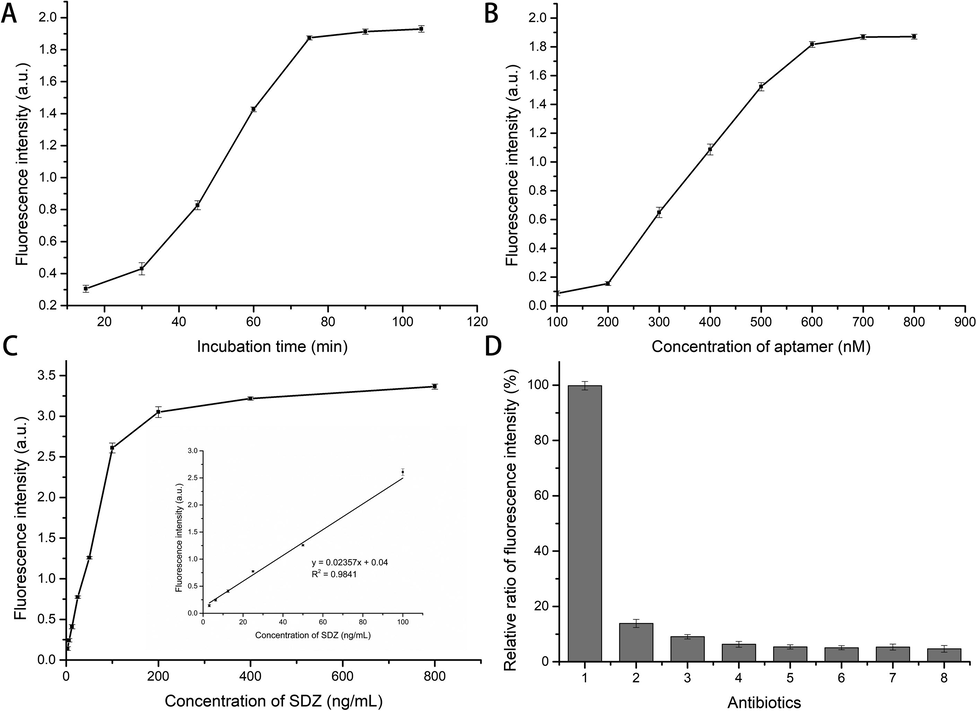
(A) The influence of the incubation time of SDZ and aptamer on the fluorescence intensity; The concentration of SDZ was 50 ng/mL. (B) The influence of SDZ30-1 concentration on the fluorescence intensity; (C) linear fitting of the fluorescence intensity of the aptasensor; (D) The relative fluorescence intensity of other antibiotics was determined using the fluorescence intensity of SDZ as a standard (1) SDZ, (2) SN, (3) SMR, (4) SMZ, (5) Kanamycin, (6) Chloramphenicol, (7) Oxytetracycline, (8) Doxycycline.
Methods
LOD (ng/mL)
Reference
Based on traditional methods
HPLC
0.9
Alipanahpour et al. (2021)
Capillary Electrophoresis
3.14
Dai et al. (2017)
Spectrophotometry
19
Errayess et al. (2017)
Antibody based methods
Chitosan-based ELISA
8.64
Zeng et al. (2021)
Multiplex dipstick immunoassay
3
Han et al. (2016)
Fiber-mediated ELISA
0.5
Nie et al. (2019)
Aptamer based methods
Fluorescence aptasensor
1.68
Present Work
Under optimized experimental conditions, 50 ng/mL of several antibiotics (SDZ, SN, SMR, SMZ, Kanamycin, Chloramphenicol, Oxytetracycline, Doxycycline) were used to evaluate the specificity of the aptasensor for the detection of SDZ. As shown in Fig. 6D, the relative fluorescence intensity of other antibiotics and structural analogues of SDZ was less than 20%. These results indicated that the aptasensor has good specificity for detecting SDZ.
3.8 Accuracy of aptasensor in detecting real samples
To evaluate the accuracy of the aptasensor in detecting real-world samples, recovery experiments were performed on milk and honey. As shown in Table 4, the recoveries were 95.12–105.47%, and the coefficient of variation ranged from 3.34 to 13.18 %. It was confirmed that the accuracy and precision of the aptasensor were within an acceptable range. Furthermore, the results of aptasensor were positively associated (R2 > 0.8687) with the results of HPLC detection results, indicating that the aptasensor was reliable in detecting SDZ.
Sample
Spike (μg/kg)
Aptasensor
HPLC
R2
Recovery (%)
CV (%)
Recovery (%)
CV (%)
Milk
50
95.12
10.24
99.54
1.34
0.9445
100
98.43
3.43
100.58
1.76
150
101.33
5.37
100.78
2.01
Honey
50
96.17
9.52
99.92
3.46
0.8687
100
99.01
4.75
100.93
2.98
150
105.47
13.18
101.24
1.04
4 Conclusions
We first screened a truncated aptamer SDZ30-1 (base sequence: 5′ -AACCCAATGGGAT- 3′) with high affinity (Kd = 65.72 nM) and against SDZ specificity by GO-SELEX and truncation technology. On the basis of molecular docking techniques and MD simulations, the recognition mechanism of SDZ30-1 and SDZ was discussed, and it was found that van der Waals energy and electrostatic energy provided the main contribution for SDZ30-1 to identify SDZ, whereas the solvation energy weakened the binding free energy. In addition, steric hindrance made SMR and SMZ differ in distance from the conserved motif “TGG”, which in turn affected the binding free energy of SDZ30-1 to the target complex. Finally, the fluorescence aptasensor based on MSN-NH2 was designed for the detection of SDZ residues. The aptasensor exhibited a wide dynamic linear range (3.125 – 100 ng/mL) and a detetion limit (LOD = 1.68 ng/mL). The aptasensor in spiked samples recovered at a rate of 95.12 – 105.47%. There was a good correlation (R2 > 0.8687) between the detection results of aptasensor and the detection results of HPLC. Therefore, the proposed aptasensor has broad application prospects for SDZ detection in edible tissues.
CRediT authorship contribution statement
Jiaming Tang:. Qiming Kou:. Xingyue Chen: Investigation. Yarong Wang:. Lulan Yang: Methodology. Xu Wen: Methodology. Xiaoling Zheng: Writing – original draft. Xueling Yan: Investigation. Tao Le: Writing – review & editing.
Acknowledgements
This work was supported by the National Natural Science Foundation of China (Grant No. 31671939), the Postgraduate Scientific Research and Innovation Project of Chongqing Municipal Education Commission (CYS21273), the Chongqing University Innovation Research Group Project (No. CXQT20031).
Declaration of Competing Interest
The authors declare that they have no known competing financial interests or personal relationships that could have appeared to influence the work reported in this paper.
References
- Highly selective magnetic dual template molecularly imprinted polymer for simultaneous enrichment of sulfadiazine and sulfathiazole from milk samples based on syringe-to-syringe magnetic solid-phase microextraction. Talanta. 2021;232:122449.
- [Google Scholar]
- The intrinsic flexibility of the aptamer targeting the ribosomal protein S8 is a key factor for the molecular recognition. BBA-Gen. Subjects. 2018;1862:1006-1016.
- [Google Scholar]
- Colorimetric aptasensor for on-site detection of oxytetracycline antibiotic in milk. Food Chem.. 2021;356:129659.
- [Google Scholar]
- Sandwich-type electrochemical aptasensor based on Au-modified conductive octahedral carbon architecture and snowflake-like PtCuNi for the sensitive detection of cardiac troponin I. Biosens. Bioelectron.. 2022;212:114431.
- [Google Scholar]
- Selection and characterization of single stranded DNA aptamers recognizing fumonisin B1. Microchim. Acta. 2014;181:1317-1324.
- [Google Scholar]
- Visualizing RNA dynamics in live cells with bright and stable fluorescent RNAs. Nat. Biotechnol.. 2019;37:1287-1293.
- [Google Scholar]
- Ultrasensitive Immunochromatographic Strip for Fast Screening of 27 Sulfonamides in Honey and Pork Liver Samples Based on a Monoclonal Antibody. J. Agric. Food Chem.. 2017;65:8248-8255.
- [Google Scholar]
- Determination of Sulfonamide Residues in Food by Capillary Zone Electrophoresis with On-Line Chemiluminescence Detection Based on an Ag(III) Complex. Int. J. Mol. Sci.. 2017;18:1801286.
- [Google Scholar]
- Selection of specific aptamer against enrofloxacin and fabrication of graphene oxide based label-free fluorescent assay. Anal. Biochem.. 2018;549:124-129.
- [Google Scholar]
- Sulfadiazine destruction by chlorination in a pilot-scale water distribution system: Kinetics, pathway, and bacterial community structure. J. Hazard. Mater.. 2019;366:88-97.
- [Google Scholar]
- A sensitive method for the determination of Sulfonamides in seawater samples by Solid Phase Extraction and UV-Visible spectrophotometry. Spectrochim. Acta A. 2017;181:276-285.
- [Google Scholar]
- Determination of Tetracycline, Oxytetracycline, Sulfadiazine, Norfloxacin, and Enrofloxacin in Swine Manure Using a Coupled Method of On-Line Solid-Phase Extraction with the UHPLC-DAD. Antibiotics (Basel). 2021;10:111397.
- [Google Scholar]
- Isolation of DNA aptamers targeting N-cadherin and high-efficiency capture of circulating tumor cells by using dual aptamers. Nanoscale. 2020;12:22574-22585.
- [Google Scholar]
- In silico studies of the interaction of the colon cancer receptor and RNA aptamer adsorbed on (1 0 1) facet of TiO2 nanoparticle investigated by molecular dynamics simulation. Adsorption. 2019;26:941-954.
- [Google Scholar]
- A sensitive and semi-quantitative method for determination of multi-drug residues in animal body fluids using multiplex dipstick immunoassay. Anal. Chim. Acta. 2016;927:64-71.
- [Google Scholar]
- Synthesis of a novel molecularly imprinted polymer based on functionalized multi-walled carbon nanotubes for selective extraction of sulfadiazine prior to spectrophotometric determination. J. Iran. Chem. Soc.. 2017;14:1935-1944.
- [Google Scholar]
- Guidelines for the analysis of free energy calculations. J. Comput. Aid. Mol. Des.. 2015;29:397-411.
- [Google Scholar]
- Selection and truncation of aptamers for ultrasensitive detection of sulfamethazine using a fluorescent biosensor based on graphene oxide. Anal. Bioanal. Chem.. 2020;413:901-909.
- [Google Scholar]
- g_mmpbsa–a GROMACS tool for high-throughput MM-PBSA calculations. J. Chem. Inf. Model.. 2014;54:1951-1962.
- [Google Scholar]
- Determination of sulfa antibiotic residues in river and particulate matter by field-amplified sample injection-capillary zone electrophoresis. Electrophoresis. 2020;41:1584-1591.
- [Google Scholar]
- Production of generic monoclonal antibody and development of chemiluminescence immunoassay for determination of 32 sulfonamides in chicken muscle. Food Chem.. 2020;311:125966.
- [Google Scholar]
- Ultrasensitive Controlled Release Aptasensor Using Thymine-Hg(2+)-Thymine Mismatch as a Molecular Switch for Hg(2+) Detection. Anal. Chem.. 2020;92:14069-14075.
- [Google Scholar]
- Selection, characterization and application of aptamers targeted to Aflatoxin B2. Food Control.. 2015;47:545-551.
- [Google Scholar]
- Truncation and Mutation of a Transferrin Receptor Aptamer Enhances Binding Affinity. Nucleic Acid Ther.. 2016;26:348-354.
- [Google Scholar]
- Optical Fiber-Mediated Immunosensor with a Tunable Detection Range for Multiplexed Analysis of Veterinary Drug Residues. ACS Sens.. 2019;4:1864-1872.
- [Google Scholar]
- Development and characterization of DNA aptamers against florfenicol: Fabrication of a sensitive fluorescent aptasensor for specific detection of florfenicol in milk. Talanta. 2018;182:193-201.
- [Google Scholar]
- Ultrasensitive probeless capacitive biosensor for amyloid beta (Aβ) detection in human plasma using interdigitated electrodes. Biosens. Bioelectron.. 2022;212:114365.
- [Google Scholar]
- Selection and Application of DNA Aptamers Against Sulfaquinoxaline Assisted by Graphene Oxide-Based SELEX. Food Anal. Method. 2020;14:250-259.
- [Google Scholar]
- Molecular Dynamics Simulations of Nucleic Acids. From Tetranucleotides to the Ribosome. J. Phys. Chem. Lett.. 2014;5:1771-1782.
- [Google Scholar]
- A simple mesoporous silica nanoparticle-based fluorescence aptasensor for the detection of zearalenone in grain and cereal products. Anal. Bioanal. Chem.. 2020;412:5627-5635.
- [Google Scholar]
- A novel fluorescence aptasensor based on mesoporous silica nanoparticles for selective and sensitive detection of aflatoxin B1. Anal. Chim. Acta. 2019;1068:87-95.
- [Google Scholar]
- Development of novel fluorescence-based and label-free noncanonical G4-quadruplex-like DNA biosensor for facile, specific, and ultrasensitive detection of fipronil. J. Hazard. Mater. 2021:127939.
- [Google Scholar]
- Silica-Coated Silver Nanoparticles Decorated with Fluorescent CdTe Quantum Dots and DNA Aptamers for Detection of Tetracycline. ACS Appl. Nano Mater.. 2020;3:9796-9803.
- [Google Scholar]
- An Ultrasensitive Label-Free Fluorescent Aptasensor Platform for Detection of Sulfamethazine. Int. J. Nanomed.. 2021;16:2751-2759.
- [Google Scholar]
- Perspective on the Future Role of Aptamers in Analytical Chemistry. Anal. Chem.. 2019;91:15335-15344.
- [Google Scholar]
- Molecular dynamics study of the recognition of ATP by nucleic acid aptamers. Nucleic Acids Res.. 2020;48:6471-6480.
- [Google Scholar]
- A novel aptasensor based on Fe3O4/Au/g-C3N4 for sensitive detection of sulfameter in food matrices. Sens. Actuat. B-Chem.. 2022;353:131148.
- [Google Scholar]
- Fluorometric determination of lipopolysaccharides via changes of the graphene oxide-enhanced fluorescence polarization caused by truncated aptamers. Mikrochim. Acta. 2019;186:173.
- [Google Scholar]
- A simple and rapid immunochromatography test based on readily available filter paper modified with chitosan to screen for 13 sulfonamides in milk. J. Dairy Sci.. 2021;104:126-133.
- [Google Scholar]
- Selection of a DNA Aptamer against Zearalenone and Docking Analysis for Highly Sensitive Rapid Visual Detection with Label-Free Aptasensor. J. Agric. Food Chem.. 2018;66:12102-12110.
- [Google Scholar]
- Aptamer-based fluorescent sensors for the detection of cancer biomarkers. Spectrochim. Acta A. 2021;247:119038.
- [Google Scholar]
- Selection and characterization of an ssDNA aptamer against thyroglobulin. Talanta. 2021;223:121690.
- [Google Scholar]
Appendix A
Supplementary material
Supplementary data to this article can be found online at https://doi.org/10.1016/j.arabjc.2022.104067.
Appendix A
Supplementary material
The following are the Supplementary data to this article:Supplementary data 1
Supplementary data 1


