

Translate this page into:
A novel ratiometric fluorescent aptasensor accurately detects patulin contamination in fruits and fruits products
⁎Corresponding authors at: Hebei Technology Innovation Center for Fruits and Vegetables Fermentation, Hengshui 053000, China. dengjk1989@163.com (Jiankang Deng), rpkxw@126.com (Rongrong Wu)
-
Received: ,
Accepted: ,
This article was originally published by Elsevier and was migrated to Scientific Scholar after the change of Publisher.
Abstract
Patulin (PAT) contamination in fruit and fruit products is a significant public health concern. Here, we developed a ratiometric fluorescent aptasensor for PAT detection based on aptamer-recognition and Exonuclease III amplification. Two structure selective dyes, SYBR Green I (SGI) and N-methyl mesoporphyrin IX (NMM), were used as fluorescent probes. In the developed biosensing system, the binding of PAT to aptamer triggered the liberation of cDNA. Subsequently, amplification was mediated by Exonuclease III. S1 was released from the S1-S2 duplex by enzymatic hydrolyzation and incorporated into a stable G-quadruplex. As a result, the fluorescence of SGI decreased, whereas that of NMM increased. There was a strong linear correlation between the relative fluorescence intensity and PAT concentrations (20 to 500 ng·L−1 range) (R2 = 0.99). The biosensing system was highly sensitive, and could detect PAT concentration as low as 4.7 ng·L−1. The sensor was also highly specific, and could differentiate PAT from several other related mycotoxins. In summary, we developed a new bioassay for the accurate detection of PAT contamination in fruits and fruit products. This research provides a new approach for developing ratiometric bioassays based on structure-selective dyes and enzymatic conversion processes.
Keywords
Patulin
Aptamer
Exonuclease III
SYBR Green I
N-methyl mesoporphyrin IX

1 Introduction
Patulin (PAT) is a secondary metabolite produced by several fungal species such as Aspergillus and Penicillium (Ioi et al., 2017). PAT is one of the most common toxins that readily contaminates fruits and silage, especially apples, hawthorns, pears, and tomatoes (Vidal et al., 2019). A previous study showed that the concentration of PAT in 30.7% of 137 fruit products in China ranged from 10.0 to 276.9 μg/kg (Ji et al., 2017). Toxicological experiments suggest that PAT is potentially a harmful mycotoxin. For example, PAT may cause gastrointestinal symptoms including nausea, vomiting, ulcers, intestinal hemorrhages, and lesions in the duodenum. Toady, PAT is known to be linked with adverse neurological, gastrointestinal, and immunological effects (Frisvad 2018, Vidal et al., 2019; Saleh and Goktepe 2019).
Based on the Chinese National Food Safety standards GB 2761–2017, the permissible limit of PAT in fruits and their products is 50 μg/kg. Internationally, particularly in Europe, the permissible maximum PAT concentration in fruit juice is less than 50 μg/kg, and not more than 10 μg/kg for fruits fed to infants and children (Torović et al., 2017). However, the lack of a rapid screening method for PAT severely hampers the production of safe agricultural products. In China, PAT is one of the key contaminants of agricultural products. In general, there is an urgent economic and social need for the accurate monitoring of PAT in fruit and fruit products in China.
The production of safe fruits and related products relies on the development of rapid, highly sensitive, and specific methods of PAT detection in these products. Traditional quantitative methods for PAT analysis in food products mainly include high performance liquid chromatography (HPLC), high performance liquid chromatography tandem mass spectrometry (HPLC-MS), thin layer chromatography (TLC), gas chromatography mass spectrometry (GC–MS), and capillary electrophoresis (CE) (Li et al., 2017; Sadok et al., 2019; Vidal et al., 2019). However, these methods are slow, cumbersome, and highly technical.
Aptamers can specifically bind to target molecules such as proteins, amino acids, small organic molecules and inorganic ions (Lan et al., 2017). In contrast to antibodies, aptamers are artificially synthesized and possess good stability and high temperature tolerance, and thus can be stored for longer time periods at room temperature. Given their good specificity and relative simplicity, aptasensors facilitate the rapid on-farm detection of numerous molecular food contaminants (Ahmadi et al., 2019; Wu et al., 2018). Therefore, we explored the utility of an aptasensor-based method for PAT detection in fruit products. Wu and colleagues developed a high-affinity aptamer for PAT through the systematic evolution of ligands by exponential enrichment (SELEX) (Wu et al., 2016). Currently, given their high sensitivity, electrochemical strategies based on aptamers have been proposed for PAT detection (He and Dong, 2019; Xu et al., 2019). Fluorescence aptasensors offer several key advantages such as high sensitivity, simplicity and low cost (Wen et al., 2017). The sensitivity of a biosensor usually depends on the established relationship between the concentration of the target analyte and the signal. A fluorescence sensor with only a single signal output may give false positive or false negative test results based on the increase or decrease of the detection signal. However, a ratiometric sensor with two detection signals can overcome the shortcomings of the single signal output. The presence of the target molecule enhances the fluorescence of one fluorophore, but decreases that of the other. This strategy can not only improve detection sensitivity, but also enhance specificity (Deng et al., 2018a). Fluorescent ratiometric probes eliminate the instability of the probes themselves and reduce the error caused by environmental contaminants.
Commercial or nanomaterial-based probes can be used with aptamers for PAT detection (Ahmadi et al., 2019; Wu et al., 2018). However, labeling oligonucleotides with fluorophores and/or quenchers increases the cost of detection (Ahmadi et al., 2019). Besides, the combination of aggregation of luminescence molecules and enzyme-assisted chain replacement signal amplification increases the sensitivity and specificity of the test (Zhang et al., 2020). Most importantly, the use of direct structure recognition dyes as a signal indicator avoids the covalent attachment of the probes on to the DNA, which also makes the use of the biosensors possible (Guo et al., 2017). Inspired by previous work, for the first time, we developed a highly sensitive and specific ratiometric fluorescent aptasensor for PAT detection based on two structure recognition dyes, SYBR Green I (SGI) and N-methyl mesoporphyrin IX (NMM).To further improve the sensitivity of this assay, Exo III-assisted cascaded recycling amplification was designed. The potential application of the ratiometric aptasensor for PAT detection was evaluated by apple juices, grape juices, haw juices, and not-from-concentrate (NFC) juice contaminated with PAT.
2 Materials and methods
2.1 Materials
The PAT aptamer (AptPAT) and other oligonucleotides (HPLC), low range DNA Marker (25–500 bp, B600303), acryl/bis (acrylamide/N, N’-methylene bisacrylamide) 30% solution (29:1) and tris-(hydroxymethyl)aminomethane (Tris, 99.9%) were purchased from Sangon Biotech Laboratory, Ltd (Shanghai, China). PAT (99.9%), aflatoxin M1 (AFM1, 99%), zearalenone (ZEN, 99%), aflatoxin B1 (AFB1, 99%), ochratoxin A (OTA, 99%), fumonisin B1 (FB1, 99%), pectinase (1500 U/mL), and PriboFast multifunctional cleanup columns MFC 228 were purchased from Pribolab (Qingdao, China). Exonuclease III (E.coli, M0206L) and NEBuffer™ 1 (pH 7.4, 70 mM NaCl, 10 mM MgCl2, 20 mM KCl) were purchased from New England Biolabs (Beverly, MA, USA). SYBR™ Gold nucleic acid gel stain dye were purchased from Invitrogen (CA, USA). SYBR Green I nucleic acid gel stain dye and 6 × DNA loading buffer were obtained from Solarbio Science & Technology Co., Ltd. (Beijing, China). PuriMagTM G-streptavidin magnetic beads (SA-MB, 10 mg·mL−1, diameter: 0.2 μm) were obtained from PuriMag Biotech Ltd (Xiamen, China). Tetramethylethylenediamine (TEMED, 99.5%), ethyl acetate (99.9%), magnesium chloride hexahydrate (99.5%), potassium chloride (99%), and ethylenediamine tetraacetic acid disodium salt (Na2EDTA, 99%) were acquired from Aladdin (Beijing, China). Ammonium persulfate (98%) was purchased from Macklin Biochemical (Shanghai, China). A stock solution of N-methyl mesoporphyrin IX (100 μM) from J&K Scientific Ltd., (Beijing, China) was prepared in dimethyl sulfoxide and stored in darkness at − 20°C. The oligonucleotides were dissolved in distilled water and quantified using X-5 UV–vis absorption spectroscopy (Yuanxi, Shanghai, China). The water used was purified using an a ultra-pure water purification system (GT-30L, Shanghai, China).
2.2 Establishment of the PAT-targeting aptasensor
Magnetic bead-biotinylated aptamer (MB-AptPAT) MB-AptPAT was prepared by incubating biotinylated aptamer (AptPAT) for 15 min at room temperature with SA-MB in binding buffer (20 mM Tris-HCl, 1 M NaCl, 1 mM EDTA, 0.02% Triton X-100, pH 7.8) in a shaking incubator. The MB-AptPAT was collected from the bottom of the vial using an MRack magnetic separation rack (PuriMag Biotech, Xiamen, China) and washed with the binding buffer to remove the unbound aptamer. The MB-AptPAT was mixed with complementary sequence cDNA in PBS for 1 h at room temperature to hybridize into dsDNA (AptPAT-cDNA) on the surface of magnetic beads (MBs). The MB-AptPAT-C complex (MB-AptPAT-cDNA) was resuspended in PBS and stored at 4°C until use.
Given the target PAT has a high affinity for the aptamer, it can displace the trigger-cDNA from the MB-AptPAT-C complex. The cDNA initiated the enzymatic reaction and cyclic reaction with the aid of Exo III. Signal amplification can be achieved by an Exo III-assisted cascaded recycling strategy as follows. First, the DNA duplex S1-S2 probe was prepared by blending S1 and S2 in 1 × NEBuffer 1. The S1-S2 duplex was thermally annealed at 90°C for 10 min and then naturally cooled to room temperature. Second, varying PAT concentrations were mixed with MB-AptPAT-C complex in 1 × NEBuffer 1 to a final volume of 50 μL. After magnetic separation, the supernatant was retained and mixed with the S1-S2 hybrid (500 nM) and 20 U Exo III in 1 × NEBuffer1. The mixture was incubated for 70 min at 37°C in a TUS-200P shaking water bath (Yiheng Corp., Shanghai, China), and thereafter heated for 20 min at 80°C to stop the digestion.
After adding the signal probes, SGI and NMM into the above solution, the fluorescence spectra of the mixture were recorded after 30 min using an F-4500 spectrofluorometer (Hitachi Co., Tokyo, Japan). The spectra were scanned from 483 nm to 634 nm under excitation at 390 nm. For all the measurements, both spectra excitation and emission slit widths were set at 10 nm.
2.3 Optimization of detection conditions
Several parameters influenced the performance of the ratiometric aptasensor. As such, to obtain the best performance, critical factors such as Exo III concentration, reaction time, and temperature, as well as the amount of SGI and NMM, were all optimized. During the optimization process, 100 ng·L−1 PAT was chosen. The Exo III concentration was evaluated from 0 U to 25 U. The incubation temperature and time for the reaction were evaluated from 25 °C to 50 °C and 0 to 90 min, respectively. The effectiveness of both SGI and NMM was evaluated at amounts ranging from 300 nM to 800 nM.
2.4 Selectivity of this assay
Five biotoxins, ZEN, AFB1, OTA, FB1 and AFM1 were used to assess the specificity of the developed aptasensor. The concentration of the above mycotoxins was comparable to that of PAT (300 ng·L−1). The analysis was performed as described in the preceding section.
2.5 Detection of PAT in real samples
To demonstrate the practical application of the assay, a PAT recovery test was performed. Apple juices, grape juices, haw juices and NFC juices sampled from the local supermarket were assessed for PAT contamination. Three PAT concentrations (100, 200 and 400 ng·L−1) were added into the above samples. Before detection by this ratiometric method, the spiked samples were subjected to centrifugation at 8000 rpm for 10 min. The analysis was performed as described in Sections 2.2 and 2.3. The recovery rate was calculated by the equation: where C1, C2 and C0 are the concentration with the addition of the standard obtained by the sensor, the analytical concentration without the addition of the standard, and the spiked amount of the standard respectively.
The initial PAT concentrations were assessed as previously described by Hussain et al (2020) but with minor modifications. One milliliter of juice sample was placed into a 50 mL centrifuge tube containing 10 mL of water before adding 100 μL of pectinase. After mixing, the solution was incubated overnight in darkness. PAT was then extracted twice using 10 mL ethyl acetate. The upper organic layers were blended and rotary evaporated to dry at 40°C (N-1300D-W, EYELA, Tokyo, Japan) before re-dissolving the sample in 5 mL acetic acid. The samples were purified using the multifunctional column PriboFast MFC228 and thereafter slowly dried using nitrogen. The dry residue was dissolved in 400 µL mobile phase (95% acetonitrile/5% water) and filtered (0.22 µm membrane).
The PAT was separated at 40°C using the Atlantis T3 column (150 × 4.6 mm i.d.; particle size 3 μm, Waters, Milford, MA, USA) before measuring its concentration using Agilent 1260 HPLC (Agilent Technologies, Santa Clara, CA, USA), equipped with a diode-array detector (DAD). The elution flow rate of acetonitrile was 0.8 mL/min (mobile phase A). The gradient elution program was utilized with acetonitrile (mobile phase A) and water (mobile phase B) under the conditions: 0–13 min 5% B; 13–15 min 100 %B, 15–20 min 5 %B. Ten microliters of the sample was subjected to HPLC and determined at 276 nm. Quantification of PAT was calibrated by external standard method. The PAT was expressed in micrograms per liter of juice (μg/L).
2.6 Circular dichroism
The characterization of the secondary DNA in the detection system was performed using circular dichroism (CD) spectroscopy. The CD spectra were obtained using a JASCO J-715 spectropolarimeter (Tokyo, Japan). The DNA (10 µM) was dissolved in 1 × NEBuffer 1 in the presence of 100 mM KCl. The step size and band width were both set at 1 nm.
2.7 Native polyacrylamide gel electrophoresis
Native polyacrylamide gel electrophoresis (PAGE) was performed using 20% polyacrylamide gel, using the DYCZ-24KS vertical electrophoresis system (Liuyi, Beijing, China). The preparation of 20% polyacrylamide gel was performed as described in detail in our previous work (Deng et al., 2018b). Briefly, 5 μL of sample was mixed with 6 × loading buffer (1 μL) and separated on freshly prepared gel. The electrophoretic separation was performed in 1 × TBE buffer for 2 h at a constant potential of 100 V. The gel was stained for 30 min using 1 × SYBR Gold solution and thereafter observed using a T-Green Transilluminator (Tiangen Biotech, Beijing, China).
3 Results and discussion
3.1 The scientific principle of the assay
The scientific principle of the ratiometric biosensor for PAT detection is depicted in Scheme 1. To improve the detection sensitivity and selectivity, an aptamer recognition assay, magnetic bead separation and Exo III-assisted amplification strategy were incorporated into the ratiometric assay. In the present investigation, SGI and NMM were employed as the two response signals to generate a ratiometric signal. SGI and NMM are common commercial dyes that exhibit conformation specificity in dsDNA and G-quadruplexes, respectively (Kong et al., 2013; Kreig et al., 2015). The absorption, excitation and emission spectra of SGI and NMM are shown in Figures S1 and S2. There was overlap between the absorption spectra and excitation spectra of SGI and NMM. When excited at the same wavelength (390 nm), the emission spectra of SGI (maximum emission peak at 517 nm) and NMM (maximum emission peak at 606 nm) completely separated (Figure S2).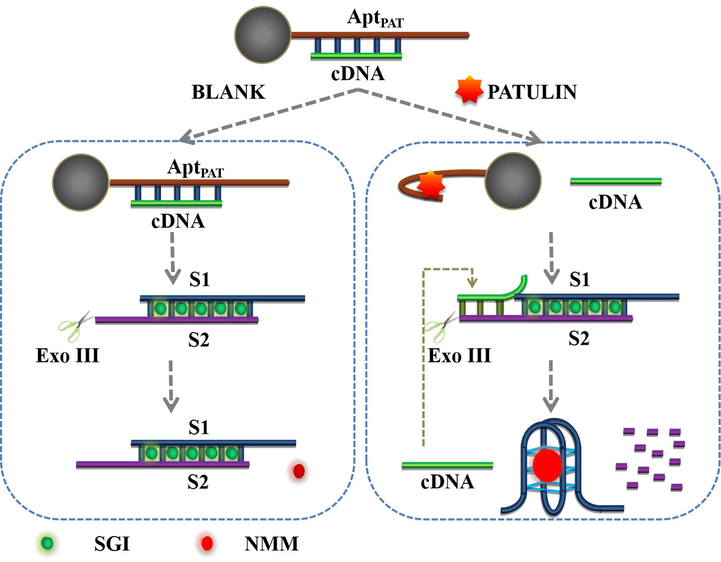
The working mechanism of the ratiometric aptasensor.
The tight binding of AptPAT on SA-MB was mediated by the strong interaction between biotin on the 5′-terminal of aptamer and streptavidin on the surface of SA-MB. The amount of AptPAT binding with SA-MB was quantified using UV–Vis (Figure S3). The amount of biotin-labeled aptamer absorbed by SA-MB was 0.154 ± 0.001 pM per μg MB.
On the surface of the MBs, the AptPAT and its partially complementary cDNA strand could be hybridized into dsDNA. As shown in Scheme 1, as the S1-S2 duplex possessed protruding 3′-termini, it was resistant to Exo III cleavage. In the absence of PAT, SGI subsequently intercalated into the S1-S2, leading to the bright fluorescence of SGI. In the presence of PAT, it was preferentially bound to the aptamer, displacing cDNA from the MB-AptPAT-C complex. The cDNA then initiated Exo III-catalyzed cascaded recycling amplification. The new duplex (cDNA-S1-S2) had blunt 3′-termini, and could thus be hydrolyzed by Exo III. The S2 strand was systematically removed from the 3′-termini, leading to the release of cDNA and S1. The next cycled process was then triggered by the cDNA again. Potassium ions could enhance the transformation of strand S1 (with a GGGTTTTGGGTTTTGGGTTTTGGG sequence) into a stable G-quadruplex structure. NMM is a highly selective G-quadruplex-specific dye. The binding of NMM onto the G-quadruplex dramatically increased its fluorescence intensity, while free NMM showed relatively low-intensity fluorescence. As a result, the decrease of the SGI fluorescence intensity and the increase in the NMM fluorescence intensity occurred at the same excitation wavelength. Overall, PAT was quantified based on the ratiometric signal.
3.2 Method validation
To validate the feasibility of the sensor, FL, PAGE and CD were performed after the described process.
Upon addition, PAT specifically associated with the aptamer. This induced the separation of the cDNA, and thus triggered the Exo III-assisted amplification system. The fluorescence response of SGI and NMM in the absence of PAT and the S1-S2 duplex is depicted in line 1 of Fig. 1. This response indicated that the system had very low background fluorescence. The addition of PAT could only enhance the fluorescence intensity of SGI, which occurred because of the released cDNA (line 2 in Fig. 1). Before adding PAT, the S1-S2 duplex could not be hydrolyzed by Exo III. This resulted in high SGI but a low NMM fluorescence signal (line 3 in Fig. 1). After adding the target analytes, the released cDNA hybridized with S1-S2, forming a new cDNA-S1-S2 duplex. Exo III hydrolyzed cDNA-S1-S2, releasing S1, which transformed into a stable G-quadruplex structure. This resulted in the decreasing fluorescence of SGI and the increasing fluorescence of NMM (line 4 in Fig. 1).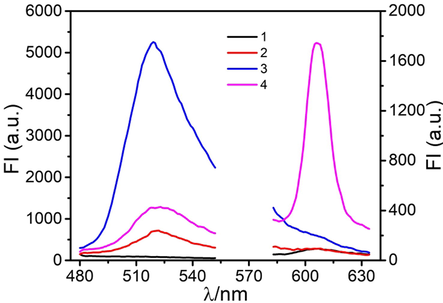
The fluorescence spectra of the biosensing system: (1) MB-AptPAT-C complex without PAT and without S1-S2, (2) MB-AptPAT-C complex with PAT (200 ng·L−1) and without S1-S2, (3) MB-AptPAT-C complex without PAT and with S1-S2 (500 nM), (4) MB-AptPAT-C complex with PAT (200 ng·L−1) and S1-S2 (500 nM).
The position of the 25–500 bp DNA marker, MB-AptPAT-C complex + PAT, S1, S2 and MB-AptPAT-C complex + PAT + S2 are shown in Fig. 2, lanes 1 to 5. The addition of PAT resulted in the release of cDNA from the MB-AptPAT-C complex, forming a new duplex (lane 5). The coexistence of both S1 and S2 yielded a new belt (lane 6), suggesting that the S1-S2 remained metastable even in the presence of Exo III. After incubating the biosensing system in the presence of PAT, the products showed belts corresponding to S1, cDNA and short ssDNA fragments, located between band S1 and cDNA (lane 7). When there was no Exo III, two belts were generated (lane 8 in Fig. 2): S1-S2 and suspected cDNA-S1-S2. These findings indicated that PAT was bound with the aptamer, which triggered the release of cDNA and the formation of the cDNA-S1-S2 complex. The enzymatic hydrolysis generated short ssDNA fragments (lane 7, Fig. 2).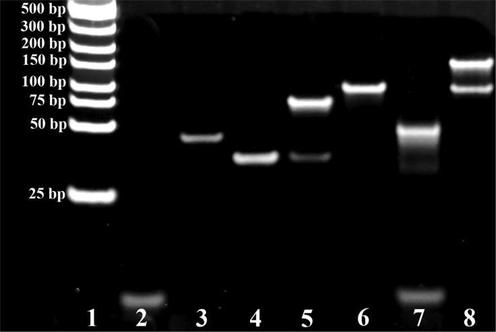
Gel electrophoresis showing the DNA interaction of the biosensing system. Lanes 1–8: (1) DNA marker (25–500 bp); (2) MB-AptPAT-C complex + PAT; (3) S1; (4) S2; (5) MB-AptPAT-C complex + PAT + S2; (6) S1-S2 + Exo III; (7) MB-AptPAT-C complex + PAT + S1-S2 + Exo III ; (8) MB-AptPAT-C complex + PAT + S1-S2 + without Exo III.
To distinguish the secondary structures of oligonucleotides, CD spectra experiments were observed (Figure S4). The CD spectra for the negative peak at 244 nm and a positive peak at 265 nm are shown in line 1 of Figure S4. These peaks were attributed to S1. The CD spectra demonstrated the formation of a typical parallel structure (Karsisiotis et al., 2011; Raje et al., 2019). In contrast, S2 (Figure S4, line 2) displayed a relatively low amplitude, suggesting that there was no obvious structure. S1-S2 (Figure S4, line 3) yielded a sharp positive band at 218 nm, a broad band at 278 nm, and negative band at 250 nm, which was typical of the B-form duplex (Mirzapoor and Ranjbar, 2017). After enzymatic hydrolysis in the presence of PAT, the new bands at 246 nm and 264 nm demonstrated the formation of a parallel G-quadruplex. Additionally, the peak plateau between 264 nm and 284 nm suggested the presence of intermediate and new structures as products of partial enzymatic hydrolysis (Figure S4, line 4). The fluorescence assay findings were consistent with PAGE analyses.
3.3 Optimization of experimental conditions
To enhance the performance of the system, major parameters such as the dosages of SGI and NMM, Exo III concentration, temperature, and reaction time were all optimized. Considering that the sensing system was based on the changes in the SGI/NMM fluorescence signal, we first investigated the optimal concentrations of these dyes. The SGI concentration was quantified by measuring the optical density at the extinction coefficient ε495 = 70000 M−1·cm−1 (Dragan et al., 2012). Upon binding to dsDNA, the fluorescence of SGI was dramatically enhanced. As shown in Figure S5, for the ratio of fluorescence of SGI without PAT (F0) to that with PAT (F), F0/F reached maximum at an SGI concentration of 400 nM. Unlike SGI, the signal-to-background (F/F0) of NMM was partially influenced by the consumption of NMM. In general, 500 nM NMM and 400 nM SGI were the optimal concentrations for the two dyes.
The activity of Exo III was also a determining factor due to the differences in enzymatic efficiency under varying conditions (Wang et al., 2020; Zhou et al., 2020). Therefore, the Exo III concentration, temperature and reaction time for the best enzymatic hydrolysis were also optimized. As shown in Fig. 3A, the F606/F517 ratio rose with the increase in Exo III from 0 U to 20 U, but remained constant beyond 20 U. Thus, 20 U was adopted as the optimal of Exo III concentration. The enzymatic temperature of the assay was optimized using a gradient of temperatures from 25°C to 50°C (Fig. 3B). The maximum F606/F517 ratio was achieved at 37°C, which resulted in highest enzymatic hydrolysis. Upon dissolving Exo III in reaction buffer, its activity was only maintained for a certain period of time. F606/F517 increased from 0 to 90 min and reached a plateau within 70 min (Fig. 3C). Therefore, 37°C and 70 min were appointed as the most reasonable temperature and reaction time of this sensing system.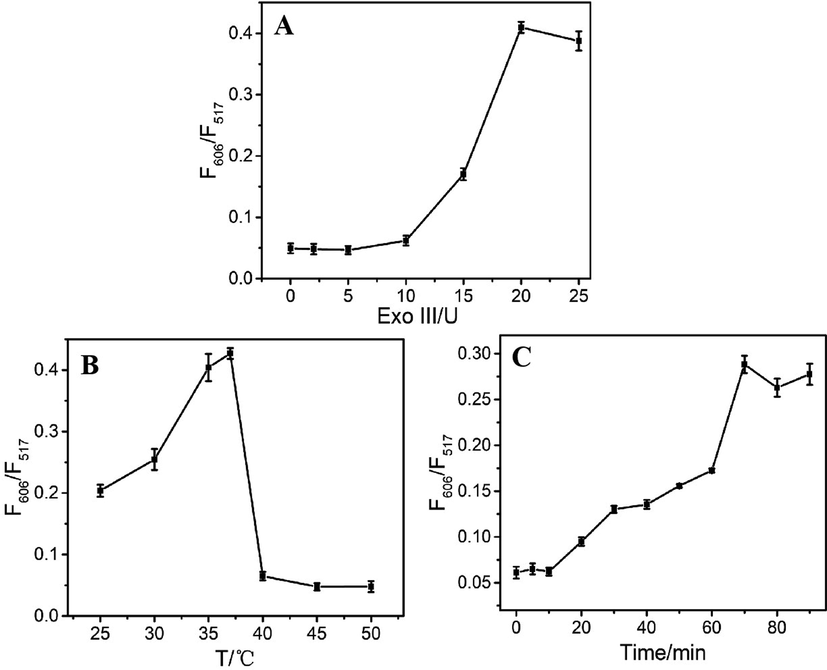
The F606/F517 ratio of the sensing system as a function of (A) Exo III concentration, (B) temperature and (C) the reaction time.
3.4 The performance of the established assay for PAT detection
The utility of the system for PAT detection was assessed under the described optimal parameters. We observed a strong negative correlation (R2 = 0.99) between the F606/F517fluorescence signal and the PAT concentration in the range from 20 to 500 ng·L−1 (Fig. 4). The relationship between F606/F517 fluorescence and PAT concentration can be expressed as Y = 7E − 05X + 0.0366, where Y defines the relative F606/F517 fluorescence signal, and X is the PAT concentration (ng·L−1). The limit of detection (LOD) of the developed system for PAT was 4.7 ng·L−1, demonstrating its high sensitivity. The limit of detection was expressed as 3σ/slope as previously described (Zhang et al., 2015), where σ is the standard deviation of the background signal. The LOD of the proposed assay was comparable to that of existing tests(Ahmadi, et al., 2019; He and Dong, 2019; He and Dong, 2018; Ma et al., 2018; Wu et al., 2016; Xu et al., 2019; Zhang et al.,2020) (Table S3 in the Supporting information). Compared with electrochemical aptasensors, the developed sensor was inferior to them in terms of LOD and stability. However, it appeared to have several advantages related to simple sample pre-treatment, and speed. The high sensitivity of the developed assay was attributed to the amplification system and the two molecular-binding dyes.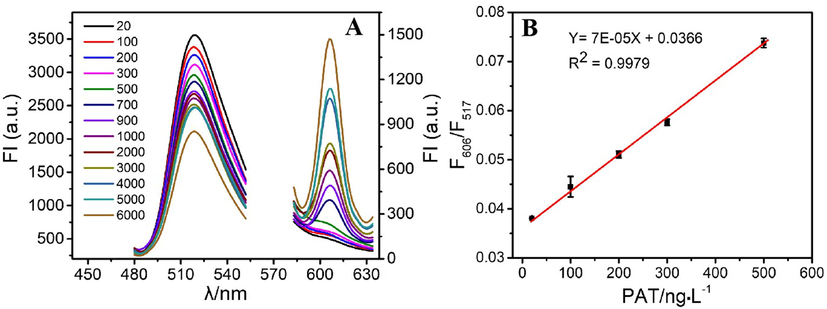
(A) The fluorescence response of the aptasensor at varied PAT concentrations (20, 100, 200, 300, 500, 700, 900, 1000, 2000, 3000, 4000, 5000, and 6000 ng·L−1). (B) The relationship between the F606/F517 and PAT concentration.
The specificity of the system in differentiating PAT from other mycotoxins was assessed using ZEN, AFB1, OTA, FB1 and AFM1. From Fig. 5, it was found that the F606/F517 signal was only enhanced with addition of PAT, but not the listed toxins. As can be seen from Figure S6, when adding the co-existing toxin and PAT simultaneously, there was no significant effect on the fluorescence response. The superior specificity was assigned to the high affinity between the aptamer and PAT. The aptamer could only combine with PAT, with the cDNA initiating the Exo III-based amplification. However, the other toxins could not split the aptamer-cDNA complex, and thus, the process could not proceed.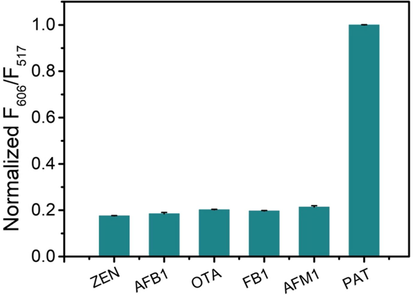
The specificity of the developed assay for PAT detection. ZEN, AFB1, OTA, FB1, AFM1 and PAT (all were used at 300 ng·L−1).
3.5 Practical application of the assay
The initial sensitivity and selectivity of the assay were assessed using PAT dissolved in a buffer solution. Its practical application, however, was assessed using real samples, such as NFC juice, apple juice, grape juice, and haw juice. HPLC was conducted to measure the original PAT in the above samples and spiked samples. The results for these samples were negative which indicated that the PAT contents were below the LOD of the HPLC method. The PAT concentrations added to the above samples were 100, 200 and 400 ng·L−1. As shown in Table 1, PAT recovery using the designed method ranged from 81.17% to 100.88%. The results showed that the developed method was consistent with HPLC (Table S2), indicating the proposed method’s high level of reliability. These findings demonstrated the excellent stability and potential practical application of the proposed PAT screening model using real fruits and fruit products.
Samples
PAT (ng·L−1)
Recovery (%)
Spiked
Found mean ± SD
NFC
100
88.04 ± 5.46
88.04 ± 5.46
200
189.43 ± 17.61
94.72 ± 8.81
400
369.52 ± 12.15
92.38 ± 3.04
Apple juices
100
82.62 ± 3.68
82.62 ± 3.68
200
162.33 ± 9.52
81.17 ± 4.76
400
385.11 ± 18.63
96.28 ± 4.66
Grape juices
100
95.00 ± 3.90
95.00 ± 3.90
200
177.48 ± 13.17
88.74 ± 6.59
400
403.52 ± 17.86
100.88 ± 4.47
Haw juices
100
99.01 ± 4.15
99.01 ± 4.15
200
173.22 ± 15.81
86.61 ± 7.91
400
354.91 ± 13.20
88.73 ± 3.30
4 Conclusions
Herein, we developed a highly sensitive and accurate ratiometric aptasensor for PAT detection in fruits and fruit products, based on two structure recognition dyes, SGI and NMM. The presence of PAT induced cDNA release from the MB-AptPAT-C complex, which initiated Exo III-mediated enzymatic hydrolysis. With the assistance of Exo III, the signal change was further amplified, which resulted in the fluorescence of SGI decreasing and the fluorescence of NMM recovering. The ratio of SGI to NMM signals was strongly correlated with the PAT concentration. In general, our method can be used for effective PAT screening in fruit and fruit products. Given its sensitivity, it substantially minimizes both false-positive and false-negative results. This approach provided instructive suggestions for developing ratiometric assays based on structure-selective dyes and enzymatic conversion processes.
CRediT authorship contribution statement
Jiankang Deng: Methodology, Project administration, Supervision, Writing – review & editing. Jing Hu: Investigation. Juanjuan Zhao: Investigation. Zhiqiang Zhang: Methodology. Qinghua Wang: Writing – original draft. Rongrong Wu: Writing – review & editing.
Acknowledgments
This work was supported by the Natural Science Foundation of Hebei Province, China (grant No. C2019111044), the Research Foundation for Talented Scholars of Hengshui University (grant No. 2018GC14), the Science and Technology Research Program of Higher Education of Hebei Province (No.QN2019302) and the Program of the Social Science Foundation of Hebei Province (grant No. HB19TY025). We thank LetPub (www.letpub.com) for its linguistic assistance during the preparation of this manuscript.
Declaration of Competing Interest
The authors declare that they have no known competing financial interests or personal relationships that could have appeared to influence the work reported in this paper.
References
- A rapid and simple ratiometric fluorescent sensor for patulin detection based on a stabilized DNA duplex probe containing less amount of aptamer-involved base pairs. Talanta. 2019;204:641-646.
- [CrossRef] [Google Scholar]
- A ratiometric fluorescent biosensor based on cascaded amplification strategy for ultrasensitive detection of kanamycin. Sensor. Actuat. B-Chem.. 2018;273:1495-1500.
- [CrossRef] [Google Scholar]
- A target-induced logically reversible logic gate for intelligent and rapid detection of pathogenic bacterial genes. Chem. Commun.. 2018;54(25):3110-3113.
- [CrossRef] [Google Scholar]
- SYBR Green I: Fluorescence Properties and Interaction with DNA. J. Fluoresc.. 2012;22(4):1189-1199.
- [CrossRef] [Google Scholar]
- A critical review of producers of small lactone mycotoxins: patulin, penicillic acid and moniliformin. World Mycotoxin J.. 2018;11(1):73-100.
- [CrossRef] [Google Scholar]
- Label-free ratiometric DNA detection using two kinds of interaction-responsive emission dyes. Biosens. Bioelectron.. 2017;87:320-324.
- [CrossRef] [Google Scholar]
- Hierarchically porous Zr-MOFs labelled methylene blue as signal tags for electrochemical patulin aptasensor based on ZnO nano flower. Sensor. Actuat. B-Chem.. 2019;294:192-198.
- [CrossRef] [Google Scholar]
- Aptamer based voltammetric patulin assay based on the use of ZnO nanorods. Microchim. Acta. 2018;185(10):462.
- [CrossRef] [Google Scholar]
- Patulin mycotoxin in mango and orange fruits, juices, pulps, and jams marketed in Pakistan. Toxins. 2020;12(1):52.
- [CrossRef] [Google Scholar]
- Mitigation of patulin in fresh and processed foods and beverages. Toxins. 2017;9(5):157.
- [CrossRef] [Google Scholar]
- Occurrence of patulin in various fruit products and dietary exposure assessment for consumers in China. Food Control. 2017;78:100-107.
- [CrossRef] [Google Scholar]
- Topological characterization of nucleic acid G-Quadruplexes by UV absorption and circular dichroism. Angew. Chem. Int. Edit.. 2011;50(45):10645-10648.
- [CrossRef] [Google Scholar]
- A universal and label-free aptasensor for fluorescent detection of ATP and thrombin based on SYBR Green I dye. Biosens. Bioelectron.. 2013;42:193-197.
- [CrossRef] [Google Scholar]
- G-quadruplex formation in double strand DNA probed by NMM and CV fluorescence. Nucleic Acids Res.. 2015;43(16):7961-7970.
- [CrossRef] [Google Scholar]
- Recent Progress in Nanomaterial-Based Optical Aptamer Assay for the Detection of Food Chemical Contaminants. ACS Appl. Mater. Inter.. 2017;9(28):23287-23301.
- [CrossRef] [Google Scholar]
- Determination of trace patulin in apple-based food matrices. Food Chem.. 2017;233:290-301.
- [CrossRef] [Google Scholar]
- A fluorometric aptasensor for patulin based on the use of magnetized graphene oxide and DNase I-assisted target recycling amplification. Microchim. Acta. 2018;185(10):487.
- [CrossRef] [Google Scholar]
- Biophysical and electrochemical properties of self-assembled noncovalent SWNT/DNA hybrid and electroactive nanostructure. Physica E.. 2017;93:208-215.
- [CrossRef] [Google Scholar]
- Binding of anticancer drug adriamycin to parallel G-quadruplex DNA [d-(TTAGGGT)]4 comprising human telomeric DNA leads to thermal stabilization: A multiple spectroscopy study. J. Mol. Recognit.. 2019;33(2):1965-1974.
- [CrossRef] [Google Scholar]
- Developments in the monitoring of patulin in fruits using liquid chromatography: an overview. Food Anal. Method.. 2019;12(1):76-93.
- [CrossRef] [Google Scholar]
- The characteristics, occurrence, and toxicological effects of patulin. Food Chem. Toxicol.. 2019;129:301-311.
- [CrossRef] [Google Scholar]
- Patulin in fruit juices: occurrence, bioaccessibility, and risk assessment for Serbian population. Food Addit. Contam. A.. 2017;35(5):985-995.
- [CrossRef] [Google Scholar]
- The mycotoxin patulin: An updated short review on occurrence, toxicity and analytical challenges. Food Chem. Toxicol.. 2019;129:249-256.
- [CrossRef] [Google Scholar]
- A novel resonance Rayleigh scattering aptasensor for dopamine detection based on an Exonuclease III assisted signal amplification by G-quadruplex nanowires formation. Arab. J. Chem.. 2020;13(8):6598-6605.
- [CrossRef] [Google Scholar]
- Screening and development of DNA aptamers as capture probes for colorimetric detection of patulin. Anal. Biochem.. 2016;508:58-64.
- [CrossRef] [Google Scholar]
- An ultrasensitive aptasensor based on fluorescent resonant energy transfer and exonuclease-assisted target recycling for patulin detection. Food Chem.. 2018;249:136-142.
- [CrossRef] [Google Scholar]
- Electrostatic assembly of gold nanoparticles on black phosphorus nanosheets for electrochemical aptasensing of patulin. Microchim. Acta.. 2019;186(4):238.
- [CrossRef] [Google Scholar]
- Upconversion luminescence resonance energy transfer-based aptasensor for the sensitive detection of oxytetracycline. Anal. Biochem.. 2015;489:44-49.
- [CrossRef] [Google Scholar]
- Ultrasensitive competitive detection of patulin toxin by using strand displacement amplification and DNA G-quadruplex with aggregation-induced emission. Anal. Chim. Acta.. 2020;1106:161-167.
- [CrossRef] [Google Scholar]
- Construction of an Exonuclease III-propelled integrated DNAzyme amplifier for highly efficient microRNA detection and intracellular imaging with ultralow background. Anal. Chem.. 2020;92(22):15069-15078.
- [CrossRef] [Google Scholar]
- An efficient target-intermediate recycling amplification strategy for ultrasensitive fluorescence assay of intracellular lead ions. Chem. Commun.. 2017;53(54):7525-7528.
- [CrossRef] [Google Scholar]
Appendix A
Supplementary material
Supplementary data to this article can be found online at https://doi.org/10.1016/j.arabjc.2021.103569.
Appendix A
Supplementary material
The following are the Supplementary data to this article:Supplementary data 1
Supplementary data 1


