

Translate this page into:
A novel resonance Rayleigh scattering aptasensor for dopamine detection based on an Exonuclease III assisted signal amplification by G - quadruplex nanowires formation
⁎Corresponding author at: School of Public Health, Hebei Medical University, Shijiazhuang 050017, PR China. lingmei622@126.com (Ling Mei Niu),
⁎⁎Corresponding author. guozhiyong@nbu.edu.cn (Zhiyong Guo)
-
Received: ,
Accepted: ,
This article was originally published by Elsevier and was migrated to Scientific Scholar after the change of Publisher.
Abstract
A new method was constructed for detecting dopamine based on aptamer-specific recognition and resonance Rayleigh scattering (RRS) of G - quadruplex nanowires (G - wires). The dopamine aptamer was used to recognize the target of dopamine, and the Exonuclease III was applied to cleave the hairpin DNA, and the G - wire formation was induced in the presence of K+ and Mg2+. This phenomenon was confirmed by polyacrylamide gel electrophoresis. Thus, a quantitative relationship between the RRS intensity of the G - wires and the dopamine concentration was established. The experimental conditions were optimized, such as the concentration of Mg2+, reaction temperature, reaction time and the concentration of Exonuclease III in the reaction system, and the interference substances were investigated, such as uric acid, ascorbic acid and serotonin. Under the optimal conditions, there was a good linear relationship between the RRS and the logarithm of dopamine concentration in the range from 5.0 × 10⁻¹¹ M to 1.0 × 10⁻⁸ M (r = 0.995), with a detection limit of 1.2 × 10⁻¹¹ M. The novel method for dopamine detection showed excellent selectivity and high sensitivity, and could be used to detect dopamine in mice brain tissues.
Keywords
Aptamer
Dopamine
Exonuclease III
Hairpin DNA
RRS

1 Introduction
Dopamine is a neurotransmitter in the hypothalamus and pituitary glands that helps cells transmit pulsed chemicals, it plays an active role in the central nervous, cardiovascular, immune, renal and hormonal system (Lan et al., 2019; Álvarez-Martos et al., 2019). In recent years, the level of dopamine has become a biomarker for detecting various clinical diseases, such as Parkinson’s disease, Huntington’s disease, schizophrenia and depression (Kriks, et al., 2011; Li, et al., 2013). Therefore, finding a highly sensitive and selective detection method for dopamine is very important. Various detection techniques have been developed, such as electrochemical methods (Takmakov, et al., 2000), chemiluminescence (Lan et al., 2019), high performance liquid chromatography (Parent et al., 2017), mass spectroscopy (Duncan et al., 1984), fluorescence (Wei et al., 2019; Suzuki, 2017). However, these techniques always need expensive experimental instruments or show poor sensitivity and selectivity.
Thus, a highly specific and sensitive method is urgently needed. Aptamer is a DNA or RNA fragment that is synthesized in vitro and specifically screened from the oligonucleotide library using systematic evolution of ligands by exponential enrichment (SELEX) for specific recognition of the target (Sun et al., 2018). The selected nucleic acid aptamers can specifically and efficiently bind to target molecules such as heavy metal ions, cancer cells, proteins, organic small molecules and so on (Du et al., 2010; Liu et al., 2012). At the same time, the nucleic acid aptamer has the advantages of good biocompatibility, easy synthesis, easy modification and good stability, which makes it an important material in the construction of various sensors such as electrochemical, fluorescent and chemiluminescent sensing platforms (Chu et al., 2016; Guo et al., 2015).
Resonance Rayleigh Scattering (RRS) is a special type of elastic scattering that occurs when the Rayleigh scattering (RS) wavelength is at or near its molecular absorption band (Long et al., 2004). It is affected by the molecular structure, size, form, shape, charge distribution and interfacial properties. RRS can also provide useful information concerning the interaction of biological macromolecules and molecular recognition (Ren et al., 2016). RRS is very sensitive to interactions caused by weak interactions such as hydrophobic interactions, hydrogen bonding, electrostatic attraction, and aggregation interactions between biological macromolecules (Shi et al., 2013). In recent years, resonance Rayleigh scattering has been widely used to detect metal ions and biomacromolecules, dyes, nucleic acids, proteins and metal ions due to its simplicity, sensitivity and rapidity (Hou et al., 2007; Bao et al., 2002).
As it is well known, many substance has the character of RRS, such as G-wire. Recently, many fluorescence sensors based on G-quadruplex have been mentioned (Verdian-Doghaei et al., 2014; Verdian-Doghaei et al., 2015). Under certain conditions, four G bases rich in guanine nucleic acid sequences are capable of self-assembly by Hoogsteen hydrogen bonding to form a square planar structure, which is designated as a G - tetrad (Bose et al., 2018). With these G - tetrad structures used as basic units, a plurality of G - tetrad are stacked by π-π bond to form a helical G - quadruplex DNA (Davis, 2004). Studies have shown that G-quadruplex can be divided into parallel structure, antiparallel structure and hybrid structure according to factors such as the arrangement and orientation of nucleotide chains (Oliviero and Pinto, 2017). The guanine-rich DNA sequence c-myc can form a parallel G - quadruplex structure. In the presence of Mg2+ and K+, the parallel structure of the G-quadruplex can be connected end to end, forming a long, continuous and linear nanostructure through the axis, called a G – wire (Dai et al., 1995). In the presence of Mg2+, the parallel G - quadruplex stacks form G - wire nanostructures, resulting in a significant increase in the RRS intensity, enabling differentiation of other DNA topologies (Shi et al., 2013).
As far as we know, the optical properties of G-wire have not been applied in the detection of dopamine. In this paper, a novel aptasensor was successfully designed based on Exonuclease III (Exo III) assisted G-wire amplification of RRS intensity to detect dopamine. Here, based on the specific binding ability of aptamers to dopamine and the intensity of G - wire amplification RRS, a hairpin DNA containing a G-quadruplex-forming sequence was designed and the base of the 5′ end of the hairpin DNA was complementary to the aptamers. In the presence of dopamine, the aptamer bound to the target and released from the hairpin DNA, thereby activating the digestion of the Exo III. As a result, a G - quadruplex structure formed and further formed a long filamentous shaped G - wire nanostructures in the presence of Mg2+ and K+. G-wire has obvious RRS enhancement characteristics. The higher the dopamine concentration, resulted in a more G-wire formation in a unit time, and gave a stronger fluorescence detection signal. More importantly, the designed aptasensor has been successfully applied in the detection of dopamine in mice brain tissue with excellent selectivity and specificity.
2 Material and methods
2.1 Chemical and material
Dopamine was purchased from Alfa Aesar of Thermo Fisher Scientific (Shanghai, China). Uric Acid was purchased from Fluka. Ascorbic Acid was purchased from Tianjin Yongda Chemical Reagent Co., Ltd. Epinephrine and serotonin was purchased from SIGMA. Glucose was purchased from Shijiazhuang Reagent Factory. Tris was obtained from Sangon Biotech (Shanghai) Co., Ltd. NaCl was purchased from Guangdong Shantou Xilong Chemical Co., Ltd. KCl was purchased from Shanghai Kechang Fine Chemicals Co., Ltd. MgCl2 was purchased from Tianjin Chemical Reagent Co., Ltd. Exonuclease III was purchased from Takara Biomedical Technology (Beijing) Co., Ltd. HCl was purchased from Tianjin Fengchuan Chemical Reagent Technology Co., Ltd. The rapid silver dye kit for nucleic acid was obtained from Real-Times Biotechnology Co., Ltd (Beijing, China). The dopamine ELISA kit was supplied by Elabscience Biotechnology Co., Ltd (Wuhan, China). Tris–HCl buffer solution A (pH 7.4) contained 20 mmol/L Tris, 100 mmol/L NaCl, 5 mmol/L MgCl2. Tris–HCl buffer solution B (pH 7.4) contained 10 mmol/L Tris, 150 mmol/L KCl, 200 mmol/L MgCl2. All other chemicals used were of analytical reagent grade. Ultra-high pressure water (18.25 MΩ cm) was used in the experiments. Dopamine aptamer and hairpin DNA and dopamine were purchased from Shanghai Sangon Biological Engineering Technology &Services Co., Ltd. The sequences were shown as follows:
Dopamine aptamer: 5′- GTCTCTGTGTGCGCCAGAGAACACTGGGGCAGATATGGGCCAG CA CAGAATGAGGCCC-3′
Hairpin DNA1: 5′- GACAGGGTGGGGAGGGTGGGGCCACCCT-3′ (The 5 ′end of which has 3 bases that complement the dopamine aptamer.)
Hairpin DNA2: 5′- GAGACAGGGTGGGGAGGGTGGGGCCACCCT-3′ (The 5 ′end of which has 5 bases that complement the dopamine aptamer.)
Hairpin DNA3: 5′- CAGAGACAGGGTGGGGAGGGTGGGGCCACCCT-3′ (The 5 ′end of which has 7 bases that complement the dopamine aptamer.)
Hairpin DNA4: 5′- CACAGAGACAGGGTGGGGAGGGTGGGGCCACCCT-3′ (The 5 ′end of which has 9 bases that complement the dopamine aptamer.)
Hairpin DNA5: 5′-CACACAGAGACAGGGTGGGGAGGGTGGGGCCACCCT-3′ (The 5 ′end of which has 11 bases that complement the dopamine aptamer.)
2.2 Apparatus
F-7000 fluorescence spectrophotometer (Hitachi, Japan) equipped with a 150 W Xe lamp was used to record the Resonance Rayleigh scattering spectra. The experimental temperature was controlled by LS-2500 cryogenic thermostatic tank (Nanjing xinchen biotechnology Co., Ltd). The water used throughout the experiment was supplied by SMART ultra-pure water system (Heal Force SMART-N, Heal Force Development Ltd.). The pH of each solution was measured with a PHSJ-3F potentiometer (Shanghai Electronic Science Instrument Co., Ltd). Electrophoresis was carried out using a JY - CX3B sequencing electrophoresis of JY – ECP 3000 electrophoresis power (Beijing Junyi Electrophoresis Equipment Co., Ltd).
2.3 Detection of dopamine
The specific method of dopamine detection was as follows: At first, the prepared hairpin DNA was heated to 95 °C for 5 min and then allowed to slowly cool down to room temperature for 2 h before using. The hybridization reaction was performed by mixing dopamine aptamer (3.0 μM, 20.0 μL), hairpin DNA (3.0 μM, 20.0 μL) and 20.0 μL dopamine solutions of different concentrations in Tris–HCl buffer solution A (20.0 mM Tris, pH 7.4). The mixture was incubated for 2 h at 4 °C. Subsequently, 10.0L Exo Ш solution (6.0U/μL) was added to the solution and the mixture was incubated for 1 h at 4 °C. Then 230.0 μL Tris–HCl buffer solution B (150.0 mM KCl, 200.0 mM MgCl2, pH 7.4) was added and placed at 4 °C for 2 h to promote G- quadruplexes polymerization to form large G-wire nanostructures which were orderly assembled. Fluorescence spectrophotometer was used to detect the RRS spectrum of the solutions. Constantly low temperature tank was equipped to control the experimental temperature at 4 °C. The wavelength of resonance Rayleigh scattering spectrum was measured by synchronous scanning at λex = λem (Δλ = 0 nm). The scanning range of synchronous fluorescence wavelength is from 220 nm to 650 nm with the slits (EX/EM) of 10.0/10.0 nm. In the experiment, the voltage of photoelectric multiplier (PMT) was selected as 400 V. The raised the RRS intensity (ΔI) was considered as ΔI = I1 − I0, where I1 and I0 represent the RRS intensity of mixture in presence or absence of dopamine, respectively.
2.4 Polyacrylamide gel electrophoresis
Polyacrylamide gel electrophoresis (PAGE) analysis was conducted to prove the specific binding of dopamine with aptamer and the formation of G-wire. Samples for PAGE analysis were prepared as follows: (1) DNA marker was sample 1; (2) hairpin DNA (3.0 μM) was sample 2; (3) dopamine aptamer (3.0 μM) was sample 3; (4) a mixture of 3.0 μM hairpin DNA, 3.0 μM dopamine aptamer, 30 nM dopamine, 150.0 mM K+ and 200.0 mM Mg2+ was incubated and used as sample 4; (5) a mixture of a mixture of 3.0 μM hairpin DNA, 3.0 μM dopamine aptamer, 150.0 mM K+ and 200.0 mM Mg2+ was incubated and used as sample 5. Samples verified with electrophoresis were prepared according to the “Detection of dopamine” procedure. During the 12% polyacrylamide gel separation, the sample and 6 × loading buffer solution were performed in a volume ratio of 5: 1. The electrophoresis process was carried out in a 1 × TBE buffer solution, and electrophoresis was continuously performed for 5 h at a constant voltage of 200 V. Silver staining was performed according to the instructions of the silver staining kit, which were briefly described as follows: The gel plate was first placed in a 100 mL stain and shaken evenly for 5 min. Then, the staining solution was drained, and the gel was shaken in a 100 mL silver staining solution at a constant rate for 10 min. Finally, after adding ultrapure water of 100 mL to the pan and shook for 5 min to rinse the gel, the expected nucleic acid band can be observed.
2.5 Analysis of dopamine in brain tissue of mice
In this experiment, dopamine was detected in mouse brains of different groups. Eight-week-old male AP0E mice (25–28 g) were purchased from Beijing Weitong Lihua Experimental Animal Technology Co., Ltd and randomly divided into four groups: high-fat diet and potassium perfluorooctane sulfonate administration group, common diet and potassium perfluorooctane sulfonate administration group, high-fat diet and sodium carboxymethyl cellulose control group, common diet and sodium carboxymethyl cellulose control group. Potassium perfluorooctane sulfonate (5 mg/kg) and 0.5% sodium carboxymethyl cellulose (0.1 mL/10 g) were given to the administration group and control group respectively. Mice were killed after continuous gavage for 8 weeks. Their brain tissues were added 7.5 mL/g phosphate buffer saline and homogenated for 30 s, followed by centrifugation at 14,000 r/min for 15 min (4 °C). Perchloric acid precipitant was added at a 2:1 ratio and centrifuged at 14,000 r/min for 15 min in the low temperature. The supernatant was taken for further RRS and ELISA analysis. ELISA was carried by Sevier Biotech Co., Ltd.
3 Results and discussion
3.1 Detection mechanism of the RRS aptasensor
The detection mechanism of the RRS aptasensor for dopamine was shown in Scheme 1. The designed hairpin DNA was composed of three parts: a region that binds to the aptamer, a c-myc sequence which is capable of forming a parallel stranded G-quadruplex, and a region complementary to the stem. If dopamine is present in the solution, the binding of dopamine to aptamer will cause a separation for apatamer from hairpin DNA. As it was well known, Exo Ш preferentially excises a single oligonucleotide from the 3′ hydroxyl end of double-stranded DNA (dsDNA), of which the preferred substrates are blunt or recessed 3′ - termini of dsDNA, while 3′ protruding termini and single-strand DNA are resistant to Exo Ш (Jiang et al., 2018; Shevelev and Hübscher, 2002). As a result, the enzymatic reaction was triggered and the double-strand part of hairpin was cleaved, leaving the G-rich of the c-myc sequence remained and forming a single-stranded DNA of a parallel G-quadruplex which is not digested by the enzyme. Incubated in a solution rich in magnesium ions and potassium ions at low temperatures, G-quadruplexes will gradually stack to form a G-wire super nanostructure, which can significantly enhance the RRS intensity. Contrastively, in the absence of dopamine, the binding for aptamer to the hairpin DNA and the enzymatic cleavage reaction will not occur. Consequently, no forming of G-wire will not cause the change of RRS intensity.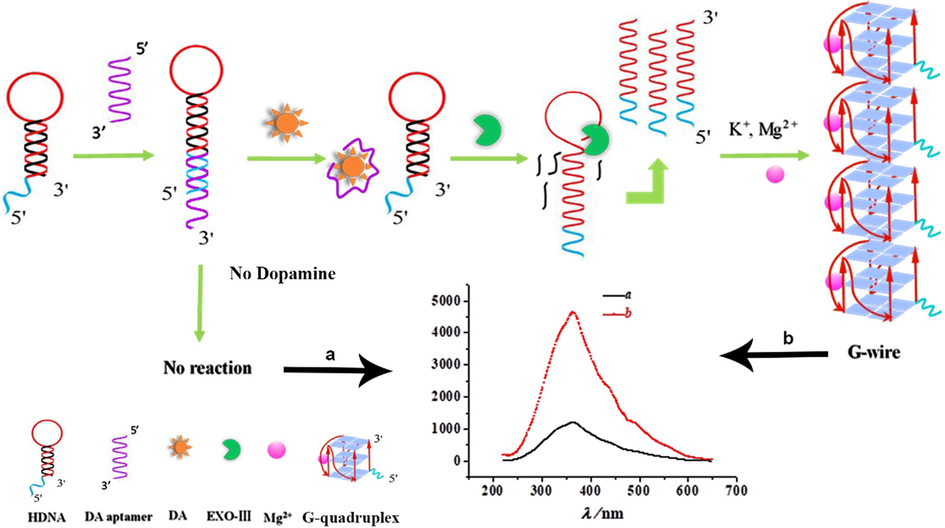
Schematic diagram of the experimental design of dopamine detection using a resonance Rayleigh scattering aptasensor.
3.2 Feasibility analysis
To verify the feasibility of the designed aptasensor, the RRS intensity was compared in the presence and absence of dopamine. As shown in Fig. 1A, in the absence of dopamine, the aptamer complemented to the 5′- end base of the hairpin DNA to form a stable double-stranded DNA, which was shown as curve a in the RRS spectrum. The RRS of the peak is 1212. Because the peak appeared at 363 nm, the RRS intensity was measured at 363 nm in the following experiments. Comparatively, in the presence of dopamine, the RRS intensity was significantly increased, which was shown as curve b. The peak height at 363 nm is 4612. The significant increasing in RRS intensity was probably because that the aptamer preferentially bound to dopamine and released from the hairpin DNA. As a result, digestion of the Exo Ш was triggered and the formation of G - wires obviously enhanced the RRS intensity under the aid of magnesium and potassium ions. Basing on the above results, further experimental researches were carried out.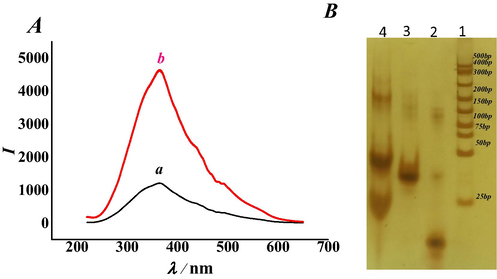
(A) Typical RRS spectra of (a) hairpin DNA + aptamer + Exo Ш + Mg2+ and (b) hairpin DNA + aptamer + dopamine + Exo Ш + Mg2+. (B) PAGE analysis: (1) DNA marker; (2) hairpin DNA (3.0 μM); (3) aptamer (3.0 μM); (4) hairpin (3.0 μM) + aptamer (3.0 μM) + DA(10.0 nM) + Exo Ш(6.0 U/µL) + Mg2+(200.0 mM). (The concentrations of dopamine, hairpin DNA, aptamer, Exo Ш and Mg2+ were 10.0 nM, 3.0 μM, 3.0 μM, 6.0 U/µL, and 200.0 mM, respectively. The reaction time of hairpin DNA and aptamer was 120 min. The reaction temperature of Exo Ш was 4 °C. The quantity of bases in the complementary pairing of the hairpin DNA and aptamer was 3. The reaction time of Mg2+ was 120 min. The pH of the Tris-HCl buffer solution was 7.4.)
The feasibility of this strategy was further verified by polyacrylamide gel electrophoresis. The result was shown in Fig. 1B. Lane 1 represented the DNA marker, and lanes 2 and 3 represented the hairpin DNA and aptamer, respectively, at concentrations of 3.0 μM. When hairpin DNA, aptamer, dopamine, Exo Ш, Mg2+ and K+ were mixed together, experiments were carried out according to the protocol mentioned above, and the electropherogram of the results was shown as lane 4. The position of the band below was higher than that of lane 3 and lane 2, indicating that the hairpin DNA and the aptamer formed a double-stranded DNA. There was a band at the base pair about 220, indicating that Exo III cut hairpin DNA and formed G-wires at the higher bands.
The above experimental characterization showed that the G-quadruplex nanowires were successfully formed and RRS aptasensor based on the formation of G-quadruplex nanowires was successfully applied in dopamine detection.
3.3 Optimization of hairpin DNA and aptamer reactions
The coupled reaction time of aptamer with hairpin DNA was a pivotal factor that affects dopamine detection by the designed aptasensor. The effects of different reaction times on the RRS intensity were compared. The aptamer that bound to the hairpin DNA acted as a recognition probe for dopamine, and poor combination of them will affect the dopamine test results directly. The solution in absence of dopamine was carried out as a blank sample under the same conditions, and the RRS signal was as the respective background. The results, as shown in Fig. S1a, showed that the RRS intensity (ΔI) gradually increased with the reaction time of aptamer with hairpin DNA in the range of 30–120 min, and reached the maximum at 120 min. As it was known, the dopamine was detected according to the difference of signals between the solutions in absence and presence of dopamine. However, if hairpin DNA was not completely combined with apatamer, the Exo III digestion was then triggered to increase the signal of background. As a result, the signal of dopamine will be decreased. Nevertheless, with the extension of combination time, the degree of reaction completeness was improved. So, when the signal maximum arrived at 120 min, the aptamer was completely combined with hairpin DNA, and then the signal was almost stable. Considering the above result, 120 min was chosen as the optimal reaction time for aptamer with hairpin DNA.
In addition, the quantity effect of complementary bases of hairpin DNAs on the dopamine assay was investigated and the results were shown in Fig. S1b. The sequences of hairpin DNA of different quantities of complementary bases were shown in Table S1. A nucleic acid aptamer specifically binds to a target substance by a weak interaction between molecules such as electrostatic interaction, hydrogen bonding, and van der Waals force (Hu et al., 2012). As shown in Fig. S1b, the RRS intensity (ΔI) decreased with the quantity of complementary base increasing. As it is well known, the more complementary bases in hairpin DNA, the stronger interaction they have between the aptamer and the hairpin DNA. So, it was not easy for aptamer to detach from hairpin DNA. Therefore, the experiment was performed by adopting the sequence of the hairpin DNA which was complementary to aptamer with three pairing bases.
3.4 Effect of Mg2+ concentration
Parallel stranded G-quadruplexes are capable of forming a higher structure with G-wire nanostructures in magnesium ion solutions (Shi et al., 2013), so the concentration of Mg2+ is an important condition to be optimized. Tris–HCl buffer solution B containing Mg2+ of different concentrations was prepared for the experiment to study the effect of Mg2+ concentration on the RRS intensity of dopamine. Because the increased RRS intensity of G-wires can be used as a detection signal for dopamine, the formation of G-wires was a crucial condition to detect dopamine. As Mg2+ can induce G-quadruplex stacking to form G-wires (Miyoshi et al., 2003), the concentration of Mg2+ was optimized. As shown in Fig. S2, the intensity of RRS (ΔI) gradually increased with the concentration of Mg2+ rising in the range of 40.0–200.0 mM, and stabilized when it exceeded 200.0 mM, indicating a saturated concentration has been arrived. Therefore, Tris–HCl buffer solution B was prepared by choosing the Mg2+concentration of 200.0 mM.
3.5 Effect of Exo III activity
The activity of Exo III was also a pivotal factor for the detection of dopamine by the designed aptasensor. Here, the effects of Exo III on the RRS intensity were optimized, including the Exo III reaction temperature and its concentration. Because the initiation of the enzyme digestion was an important prerequisite to release the G-quadruplex sequence of the hairpin DNA, so whether Exo III maintained a good activity at a suitable temperature was very effective to perform enzymatic cleavage. As shown in Fig. S3a, the RRS (ΔI) intensity gradually decreased with the Exo III reaction temperature rising in the range of 4 °C to 50 °C, and slightly increased in the range of 50–60 °C. The above results might be due to the fact that the enhancement of the temperature probably caused the dissociation of aptamer from hairpin DNA even in absence of dopamine. However, the concentration of dopamine was quantified according to the intensity difference between the dopamine solutions and blank. As a result, the rising of blank signals led to RRS intensity decreasing. But when the temperature was over 50 °C, the activity of the enzyme was gradually destroyed and the RRS (ΔI) showed a little increasing. Therefore, 4 °C was chosen as the optimum reaction temperature for Exo III. The effects of different Exo III concentrations on the RRS intensity were further investigated. As shown in Fig. S3b, the RRS (ΔI) value increased with Exo III concentration increasing and reached a plateau at 6.0 U/μL. Therefore, 6.0 U/μL of Exo Ш was selected in the following experiment.
3.6 Analytical performance of the dopamine aptasensor
Dopamine concentration assay was performed using RRS aptasensor under optimized experimental conditions. As shown in Fig. 2, with the increase of dopamine concentration, the RRS intensity was gradually enhanced in the wavelength range of 220–650 nm and all the responses were obviously higher than those in the absence of dopamine. Under the optimized conditions, the RRS intensity showed a good linear relationship with the natural logarithm of dopamine concentration in the range of 0.05–10.0 nM. The linear equation is ΔI = 1880.2 + 591.19ln(C), the correlation coefficient r is 0.995, and ΔI and C represent RRS intensity and dopamine concentration, respectively. The calculated detection limit was 0.01 nM (3 s/D). The limit of detection referred to three-fold of the standard deviation of the blank concentrations and divided by the slope (where s was the standard deviation of the blank solutions, n = 15). The results of this method compared with previous methods were shown in Table 1. The detection limit of this method is 0.012 nM. Compared with the electrochemical method (Alvarez-Martos and Ferapontova, 2016; Azadbakht et al., 2016), this method shows a better sensitivity. There are also many fluorescent aptamer sensors for dopamine detection (Huang et al., 2016; Xu et al., 2015). This strategy detected dopamine by forming G-wires and detecting RRS intensity, which needed not to introduce special quantum dots, fluorescence quenching or fluorescence resonance energy transfer, which was good for the environment and more intuitive.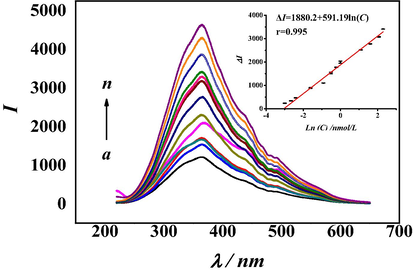
RRS spectra of aptamer sensors with different concentrations of dopamine. (a) 0.0 nM, (b) 0.05 nM, (c) 0.07 nM, (d) 0.09 nM, (e) 0.2 nM, (f) 0.4 nM, (g) 0.6 nM, (h) 0.6 nM, (i) 0.8 nM, (j) 1.0 nM, (k) 3.0 nM, (l) 5.0 nM, (m) 8.0 nM, (n) 10.0 nM. (The reaction time of hairpin DNA and aptamer was 120 min. The reaction temperature of Exo Ш was 4 °C. The quantity of bases in the complementary pairing of hairpin DNA and aptamer was 3. The reaction time of Mg2+ was 120 min. The pH of the Tris-HCl buffer solution was 7.4.)
Detection method
Materials
Limit of detection (nM)
Determinationrange (nM)
Reference
Electrochemistry
RNA aptamer and cysteamine-modified Au electrode
–
100–5000
(Farjami et al., 2012)
Electrochemistry
RNA aptamer, tethered to cysteamine modified gold electrodes via the alkanethiol linker
62.0
100–1000
(Alvarez-Martos et al., 2016)
Electrochemistry
DNA aptamer, glassy carbon electrode and acid-oxidized carbon nanotubes
0.2
1–30
(Azadbakht et al., 2016)
Fluorescence
Ru complex, quantum dots and DNA aptamer
19.0
50–3000
(Huang et al., 2016)
Fluorescence
DNA aptamer, rhodamine B and gold nanoparticles
2.0
26–2900
(Xu et al., 2015)
Fluorescence
DNA aptamer, Exo III, Mg2+ and G- quadruplex
0.012
0.05–10
This work
3.7 Selectivity of the RRS aptasensor for dopamine detection.
To investigate the selectivity of this method, the RRS intensity of 10.0 nM dopamine solution was detected which contained various interfering substances (uric acid, ascorbic acid, epinephrine, glucose and serotonin). The concentration of the interferences was 50.0 nM. A dopamine solution containing no interference was also determined as a comparison. As can be seen from Fig. 3, uric acid, ascorbic acid, epinephrine, glucose, and serotonin hardly showed interfere with the determination of dopamine. The relative error of ±5% was taken as the interference limit. The results showed this method had an excellent selectivity.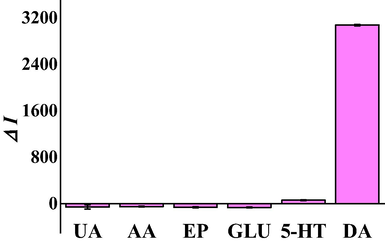
Selectivity of the proposed RRS aptasensor for 10.0 nM dopamine from 50.0 nM ascorbic acid, 50.0 nM glucose, 50.0 nM uric acid, 50.0 nM epinephrine, and 50.0 nM serotonin. (The concentrations of hairpin DNA, aptamer and Mg2+ were 3.0 µM, 3.0 µM, and 200.0 mM, respectively. The reaction time of hairpin DNA and aptamer was 120 min. The reaction temperature of Exo Ш was 4 °C. The quantity of bases in the complementary pairing of hairpin DNA and aptamer was 3. The reaction time of Mg2+ was 120 min. The pH of the Tris-HCl buffer solution was 7.4.).
3.8 Analysis of dopamine in real samples
To evaluate the validity and suitability of the designed RRS aptasensor in real samples, the dopamine concentration in mouse brain tissue was determined using the classical ELISA method and the RRS aptasensor method, respectively. After a statistical analysis, the results were shown in Table 2. The difference between these two methods showed no statistical significance and had a good consistency (P = 0.496 > 0.1). We randomly selected an actual sample and added four concentrations of standard dopamine solutions of low, middle and high to measure the intra-day precision. As shown in Table 3, the recoveries of the spiked samples and relative standard deviation ranged within 80.00–91.67% and 1.28–2.56%, respectively. Therefore, the designed RRS aptasensor can be successfully used for the detection of dopamine in actual samples.
Sample
DA(ELISA) nmol/L
DA(RRS) nmol/L
Ordinary feed, control
0.35
0.25
Ordinary feed, control
0.35
0.24
Ordinary feed, control
0.34
0.24
Ordinary feed, control
0.33
0.24
Ordinary feed, control
0.33
0.24
Ordinary feed, control
0.33
0.24
Ordinary feed, control
0.32
0.23
Ordinary feed, PFOS
0.31
0.23
Ordinary feed, PFOS
0.30
0.23
Ordinary feed, PFOS
0.23
0.30
Ordinary feed, PFOS
0.23
0.30
Ordinary feed, PFOS
0.21
0.30
Ordinary feed, PFOS
0.21
0.29
High fat diet, control
0.20
0.29
High fat diet, control
0.20
0.27
High fat diet, control
0.20
0.27
High fat diet, control
0.20
0.25
High fat diet, control
0.25
0.20
High fat feed, PFOS
0.20
0.25
High fat feed, PFOS
0.19
0.24
High fat feed, PFOS
0.22
0.19
High fat feed, PFOS
0.21
0.19
High fat feed, PFOS
0.20
0.17
High fat feed, PFOS
0.20
0.18
NO.
Spiked (nM)
Measured (nM)
Recovery (%)
RSD (%)
1
0
0.20
2
0.05
0.24
80.00
2.56
3
0.09
0.28
88.89
1.28
4
0.60
0.75
91.67
1.38
5
8.00
7.45
90.63
1.45
4 Conclusions
A novel and ultrasensitive detection strategy of dopamine was established using resonance Rayleigh scattering aptasensor based on an Exonuclease III assisted signal amplification by G-quandruplex nanowire formation. For the proposed method here, aptamer was applied to realize the specific identification and cyclic amplification strategy was applied to improve the sensitivity. Therefore, the presented proposal showed good selectivity and sensitivity. The detection limit reached 0.01 nM. The method can be applied to detect actual samples, with satisfactory results. Considering above advantages, the developed resonance Rayleigh scattering aptasensor can be further applied to explore the influence of pollutants on neurotransmitters for clinical diagnoses and disease prevention.
Acknowledgements
The authors are deeply grateful to the Hebei Science Fund for Distinguished Young Scholars (H2016206557) for the support they extended.
Declaration of Competing Interest
The authors declare that they have no known competing financial interests or personal relationships that could have appeared to influence the work reported in this paper.
References
- Electrochemical label-free aptasensor for specific analysis of dopamine in serum in the presence of structurally related neurotransmitters. Anal. Chem.. 2016;88:3608-3616.
- [CrossRef] [Google Scholar]
- Dopamine binding and analysis in undiluted human serum and blood by the RNA-aptamer electrode. ACS. Chem. Neurosci.. 2019;10:1706-1715.
- [CrossRef] [Google Scholar]
- Design and characterization of electrochemical dopamine-aptamer as convenient and integrated sensing platform. Anal. Biochem.. 2016;507:47-57.
- [CrossRef] [Google Scholar]
- High-sensitivity detection of DNA hybridization on microarrays using resonance light scattering. Anal. Chem.. 2002;74:1792-1797.
- [CrossRef] [Google Scholar]
- High-resolution AFM structure of DNA G-wires in aqueous solution. Nat. Commun.. 2018;9:1-9.
- [CrossRef] [Google Scholar]
- A self-assembly aptasensor based on thick-shell quantum dots for sensing of ochratoxin A. Nanoscale.. 2016;8:4127-4133.
- [CrossRef] [Google Scholar]
- Self-assembly of DNA oligomers into high molecular weight species. Biochem.. 1995;34:3655-3662.
- [CrossRef] [Google Scholar]
- G-quartets 40 years later: from 5'-GMP to molecular biology and supramolecular chemistry. Angew. Chem. Int. Ed. Engl.. 2004;43:668-698.
- [CrossRef] [Google Scholar]
- Solid-state probe based electrochemical aptasensor for cocaine: a potentially convenient, sensitive, repeatable, and integrated sensing platform for drugs. Anal. Chem.. 2010;82:1556-1563.
- [CrossRef] [Google Scholar]
- Comparison of high-performance liquid chromatography with electrochemical detection and gas chromatography-mass fragmentography for the assay of salsolinol, dopamine and dopamine metabolites in food and beverage samples. J. Chromatogr.. 1984;336:199-209.
- [CrossRef] [Google Scholar]
- RNA aptamer based electrochemical biosensor for selective and label-free analysis of dopamine. Anal. Chem.. 2012;8:121-128.
- [CrossRef] [Google Scholar]
- A novel electrochemical aptasensor for ultrasensitive detection of kanamycin based on MWCNTs–HMIMPF6 and nanoporous PtTi alloy. Biosens. Bioelectron.. 2015;74:691-697.
- [CrossRef] [Google Scholar]
- A new and selective and sensitive nanogold-labeled immunoresoance scattering spectral assay for trace prealbumin. Talanta. 2007;72:463-467.
- [CrossRef] [Google Scholar]
- An ultrasensitive fluorescent aptasensor for adenosine detection based on exonuclease III assisted signal amplification. Biosens. Bioelectron.. 2012;34:83-87.
- [CrossRef] [Google Scholar]
- A universal label-free fluorescent aptasensor based on Ru complex and quantum dots for adenosine, dopamine and 17beta-estradiol detection. Biosens. Bioelectron.. 2016;79:198-204.
- [CrossRef] [Google Scholar]
- Label-free detection of exonuclease III activity and its inhibition based on DNA hairpin probe. Anal. Biochem.. 2018;555:55-58.
- [CrossRef] [Google Scholar]
- Kriks, S., Shim, J., Piao, J., Ganat, Y., Wakeman, D., Xie, Z., Carrillo-Reid, L., Auyeung, G., Antonacci, C., Buch, A., Yang, L., Beal, M., Surmeier, D., Kordower, J., Tabar, V., Studer, L., 2011. Dopamine neurons derived from human ES cells efficiently engraft in animal models of Parkinson’s disease. Nature 480, 547–551. 10.1038/nature10648.
- Chemiluminescence of Lucigenin/Riboflavin and its application for selective and sensitive dopamine detection. Anal. Chem.. 2019;91:2135-2139.
- [CrossRef] [Google Scholar]
- An ultrasensitive nanowire-transistor biosensor for detecting dopamine release from living PC12 cells under hypoxic stimulation. J. Am. Chem. Soc.. 2013;135:16034-16037.
- [CrossRef] [Google Scholar]
- A novel label-free electrochemical aptasensor based on graphene–polyaniline composite film for dopamine determination. Biosens. Bioelectron.. 2012;36:186-191.
- [CrossRef] [Google Scholar]
- Resonance Rayleigh scattering determination of trace amounts of Al in natural waters and biological samples based on the formation of an Al(III)–morin–surfactant complex. Anal. Chim. Acta.. 2004;501:89-97.
- [CrossRef] [Google Scholar]
- Structural transition from antiparallel to parallel G-quadruplex of d(G4T4G4) induced by Ca2+. Nucleic. Acids. Res.. 2003;31:1156-1163.
- [CrossRef] [Google Scholar]
- Self-Assembly of G-Rich Oligonucleotides Incorporating a 3′-3′ Inversion of Polarity Site: A New Route Towards G-Wire DNA Nanostructures. ChemistryOpen.. 2017;6:599-605.
- [CrossRef] [Google Scholar]
- Parent, K., Hil, l D., Crown, L., Wiegand, J., Gies, K., Miller, M., Atcherley, C., Heien, M., Cowen, S., 2017. Platform to enable combined measurement of dopamine and neural activity. Anal. Chem. 89, 2790–2799. 10.1021/acs.analchem.6b03642.
- Ultrasensitive label-free resonance rayleigh scattering aptasensor for Hg2+ using Hg2+-triggered exonuclease III-assisted target recycling and growth of G-wires for signal amplification. Anal. Chem.. 2016;88:1385-1390.
- [CrossRef] [Google Scholar]
- A highly sensitive resonance Rayleigh scattering method to discriminate a parallel-stranded G-quadruplex from DNA with other topologies and structures. Chem. Commun.. 2013;49:6209-6211.
- [CrossRef] [Google Scholar]
- Label-free fluorescent sensor based on aptamer and thiazole orange for the detection of tetracycline. Dyes. Pigments.. 2018;149:867-875.
- [CrossRef] [Google Scholar]
- Design and synthesis of fluorescent reagents for selective detection of dopamine. Sens. Actuat. B-Chem.. 2017;239:383-389.
- [CrossRef] [Google Scholar]
- Subsecond adsorption and desorption of dopamine at carbon-fiber microelectrodes. Anal. Chem.. 2000;72:5994-6002.
- [CrossRef] [Google Scholar]
- Conformational switch of insulin-binding aptamer into G-quadruplex induced by K+and Na+: an experimental and theoretical approach. J. Biomol. Struct. Dyn.. 2015;33:1153-1163.
- [CrossRef] [Google Scholar]
- A fluorescent aptasensor for potassium ion detection-based triple-helix molecular switch. Anal. Biochem.. 2014;466:72-74.
- [CrossRef] [Google Scholar]
- A simple dopamine detection method based on fluorescence analysis and dopamine polymerization. Microchem. J.. 2019;145:55-58.
- [CrossRef] [Google Scholar]
- A facile aptamer-based sensing strategy for dopamine through the fluorescence resonance energy transfer between rhodamine B and gold nanoparticles. Dyes. Pigments.. 2015;123:55-63.
- [CrossRef] [Google Scholar]
Appendix A
Supplementary material
Supplementary data to this article can be found online at https://doi.org/10.1016/j.arabjc.2020.06.016.
Appendix A
Supplementary material
The following are the Supplementary data to this article:Supplementary data 1
Supplementary data 1


