

Translate this page into:
A novel silica supported chitosan/glutaraldehyde as an efficient sorbent in solid phase extraction coupling with HPLC for the determination of Penicillin G from water and wastewater samples
⁎Corresponding author. Azari.hjh@gmail.com (Ali Azari),
⁎⁎Corresponding author. profederlima@gmail.com (Eder C. Lima)
-
Received: ,
Accepted: ,
This article was originally published by Elsevier and was migrated to Scientific Scholar after the change of Publisher.
Peer review under responsibility of King Saud University.
Abstract
In this study, silica@chitosan-glutaraldehyde (Si@Cs-G) was synthesized as a novel adsorbent for extraction of Penicillin G (PG) from the synthetic and real samples followed by HPLC determination. The synthesized adsorbents were characterized by the scanning electron microscopy (SEM), X-ray diffraction (XRD), fourier transform infrared (FTIR), dynamic light scattering (DLS), transmission electron microscopy (TEM) and nitrogen adsorption–desorption techniques. The factors influencing the extraction efficiency including pH, sorbent dose, extraction time, extraction solvent type and its volume were investigated and optimized.
Under the optimal conditions (sorbent dosage: 25 mg, desorption solvent (acetonitrile) with volume of 0.75 mL; pH: 6 and extraction time: 50 min), the Si@Cs-G demonstrated high efficiency and linearity (R2 > 0.999) with the concentration of penicillin G ranging from 1 to 300 μg L−1. Extraction recovery in synthetic samples was 98.977%, with LOD = 0.493 μg L−1, LOQ = 1.638 μg L−1 and RSD < 1.953%. The method was successfully applied for determination of PG in real water samples (tap, river, lake and well water) and wastewater samples (SH and SHB hospital effluent). The obtained relative recoveries were in the range of 91.31% -123.27% with RSD less than 6.34% for all the real samples. The dominant mechanism in the PG adsorption process was involved in the π-π interaction, hydrogen bonding, and electrostatic interaction.
Keywords
SPE
HPLC
Penicillin G Antibiotic
Silica@chitosan-glutaraldehyde
Determination

1 Introduction
Penicillin G (PG, with the molecular weight 372.48 and pKa = 2.75) as a representative β-lactam compound, has been widely used in treating a varied range of diseases which were induced by gram-positive and/or gram-negative bacteria in humans and animals, including infections by sensitive bacteria, gastrointestinal and urinary tract infections, meningitis, and septicemia (Chen et al., 2017; Oliver et al., 2020). In recent years, the enormous or inappropriate usage of PG caused the excessive accumulation of antibiotic residues in edible animal tissues and body fluids, which are potentially toxic and dangerous for human health (Iannini et al., 2006; Zhao et al., 2019).
Despite strict rules and standards regarding the discharge of antibiotics into the environment, illegal use and excessive discharge of this pollutant into the environment is still observed. Therefore, considering the devastating effects of antibiotics in the ecosystem, establish a sensitive and efficient analytical method to detect the residual of PG in aqueous (water and wastewater) samples is very necessary (Pirsaheb et al., 2019). Solid-phase extraction (SPE) is one of the most popular techniques for preconcentration of analytes in different samples due to the high enrichment factors, low reagent consumption, simplicity, time saving and convenience (Dil et al., 2019). The adsorbent selection plays a key role in SPE procedures.
Chitosan (Cs) is a polysaccharide polymer which has bifunctional groups and accordingly possesses unique physiological activity and physio-chemical properties. Hydrophilicity, harmlessness, biodegradability, low cost, abundance, and ease of chemical derivatization caused that Cs was considered as useful and auspicious materials for preparing the adsorbents (Salari et al., 2019; Azari et al., 2019). However, when Cs is exposed to a high concentration of pollution and low pH, it spontaneously gets oxidized/destructed, leading that the chitosan converted to the unstable and unreliable adsorbent (Huang et al., 2020). To overcome the disadvantages of Cs and enhance its operation, crosslinking modification is frequently suggested by researchers due to abundant amino (—NH2) and hydroxyl (—OH) functional groups in Chitosan structure that provide substantial reaction sites (Vakili et al., 2019).
Many reports have revealed that glutaraldehyde (G) as efficient crosslinker can provide a cheap and convenient way to improve the mechanical properties of Cs and its resistance to acidic media and thermal stability (Ramachandran et al., 2019; Wu et al., 2019). Nevertheless, weak mechanical property of Cs, especially as its swelling increases, considered to be a major concern. In the last few decades, several researchers try to link Cs with other materials to improve the mechanical strength of the hybrid or composite material. Among the different hybrid materials, it has been proved that silica nanoparticles have the proper ability to enhance Cs mechanical and interfacial properties. Moreover, silica has superior properties of mechanical stability, insolubility, biocompatibility, and adsorption (Sengupta et al., 2019; Pant et al., 2020). Therefore, the silica@chitosan composite is a suitable trial to enhance the mechanical properties and adsorption performance of chitosan adsorbents.
Research on new adsorbents that can preconcentrate and separate PG antibiotic from complex samples is an interesting topic that has attracted the attention of many researchers in analytical sciences (Benito-Peña et al., 2006). However, the utilization of silica@chitosan-glutaraldehyde (Si@Cs-G) as the sorbent for SPE has not reported in the literature and it is hoped that mentioned insight will be a basic and pioneering research for other researchers. Accordingly, the purpose of this study can be summarized as: synthesized a novel Si@Cs-G by plant-based products method and its characterization by scanning electron microscopy (SEM), X-ray diffraction (XRD), Fourier transform infrared (FTIR), dynamic light scattering (DLS), transmission electron microscopy (TEM), X-ray photoelectron spectroscopy (XPS) and nitrogen adsorption–desorption; Investigating the PG extraction using SPE technique and analytical determination by high performance liquid chromatography; optimizing the affecting variables on SPE process under batch system; and finally determination of PG residues real water and wastewater samples.
2 Experimental
2.1 Reagents and materials
The model antibiotic, Penicillin G potassium salt (PG. K+ ≥98.0%), was supplied by Tehran Pharmaceutical Co, Ltd. (Tehran, Iran). Glutaraldehyde (OHC(CH2)3CHO, 50% m/v aqueous solution), APTES (C9H23NO3Si, >99%), methanol (CH3OH, ACS grade), sodium hydroxide (NaOH, 93%), and hydrochloric acid (HCl, 35–37%) purchased from Merck Co. (Germany). Methanol and acetonitrile were HPLC grade and acquired from J.T. Baker (USA). Rosa damascene was provided from local markets in Tehran, Iran. Deionized water was utilized throughout this research. All other chemicals were of analytical grade and used as received without any further purification.
2.2 Synthesis of Si@Cs-G
In this work, Chitosan was obtained from shrimp shell wastes, which is available in abundance in the southern parts of Iran. Azari et al. (Mohseni-Bandpi et al., 2015) method was used to synthesize the Chitosan with some modifications. Before the silanization process, the Cs (10 g) were immersed in 2 M NaOH solution (to stabilize the pH in 9–10). The slurry was refluxed at 373 K for 20 min. Afterward, the mixture was poured into 600 mL ultra-pure water at 298 °K. The Cs was filtered through a filter paper, washed with deionized water until neutralization, and dried in a vacuum oven at 393°K for 1 day. Subsequently, the silanization process was carried out base on plant green chemistry procedure as followed: In the beginning, dried leaves of Rosa damascene were thoroughly washed with deionized water to withdraw any dirt material; it was fatherly dried at room temperature for 1 day. Subsequently, leaves of Rosa damascene (RDE) were boiled (60 g L−1) at 80℃ for 1 h to obtain the extract of RDE. After precipitation, the RDE was filtered by a vacuum pump and stored at 4 °C. In another flask, 5 g of Cs was transferred into a 200 mL toluene in the presence of nitrogen bubbled and stirred at 25 °C during two hours. Thereupon, 10 mL APTES: RDE in the ratio 1:3 was added dropwise to the slurry, and the mixture was vigorously stirred at 100 °C under N2 for a further 120 min. At this step, the pH should be adjusted to 6–7. After stirring, the light-yellow colored precipitate that appeared was filtered off, washed thrice with 40 mL toluene, and 40 mL distilled water, respectively, and then centrifuged (6000 rpm). The silanized Cs (Si@Cs) dried overnight at 60℃ oven and stored in desiccator while cooling in. For modification of Si@Cs with glutaraldehyde (G), 5 g of Si@Cs has slurried with a 20% G (25 mL) solution. The slurry was magnetically stirred at 25 °C for 1 day, followed by centrifugation. Eventually, the precipitate was thoroughly washed with methanol (40 mL) and sterile-distilled water to remove any unreacted GA and dried in vacuum at 333°K to obtain silica@chitosan-glutaraldehyde (Si@Cs-G). The schematic of Si@Cs-G synthesis is shown in Fig. S1.
2.3 Characterization
The morphology and structure of the sorbents were characterized by XRD, SEM, BET, BJH, FTIR, TEM, and DLS. The X-ray powder diffraction spectra and crystal phases of the composite were obtained by XRD diffractometer (D8 Advance, Bruker, Germany) equipped using Cu Ka radiation (k = 1.540562 A˚, 40 kV, 40 mA). The relative intensity was recorded over the scattering range of 5 to 40° (2θ = 5°–40°). The surface morphology and structure of the Si@Cs-G was characterized by scanning electron microscopy (SEM, Philips XL-30, USA) at 15 kV and magnification of 500×. Before analysis, the surface coated with gold using a sputter coater. The nitrogen adsorption–desorption isotherms were measured using a Micromeritics Tristar 3000 analyzer at 77 K to determine the textural properties of samples. Before analysis, approximately 0.1 g of the samples were degassed in a vacuum at 200 ℃ for 5 h. The Brunauer–Emmett–Teller (BET) and Barrett–Joyner–Halenda (BJH) methods were used to examine the specific surface area and the pore size distribution of Cs and Si@Cs-G, respectively. Transmission electron microscopy (TEM, Hitachi, H-7500, Japan) operating at 80 kV was used to determine the size distribution and polydispersity of Si@Cs-G. Fourier transform infrared spectra (FTIR), recorded on a Shimadzu-8400S spectrometer (Japan), were employed to identify the chemical functional groups present in the Cs and Si@Cs-G. adsorbents were prepared as KBr pellets and scanned against a blank KBr pellet background at wavenumbers ranging from 4000 to 400 cm−1 with a 4 cm−1 spectral resolution. Dynamic light scattering particle size analysis was performed to determine the particle size distributions of Cs and Si@Cs-G (DLS, SZ-100 nanoparticle series).
2.4 SPE procedure
To optimize the SPE procedure, 10 mL of 40.0 μg L−1 PG standard solution were placed in a 20 mL polypropylene conical tubes. In all trials, the mixture was shaken at a constant speed equal to 200 rpm and temperature of 25 ± 2℃. The effect of pH on extraction was conducted over a pH range of 1–14 by mixing 10 mg of Si@Cs-G as sorbent for 40 min. The solution pH was adjusted using 0.1 mol L−1 NaOH or HCl. The effect of sorbent dosage on the extraction process was examined by the addition of diverse amounts of the adsorbents (2.5–100 mg) into 40 μg L−1 of PG at optimized pH value obtained earlier during 40 min. The effect of different time on PG extraction was studied in the range of 5–80 min at an optimized pH and adsorbent dose under 40 μg L−1 of PG concentration and room temperature. For desorption, various efficient solvents, i.e., Acetonitrile (ACTN), Acetone (ACT), Ethanol (EtOH) and Methanol (MeOH) were applied to improve the efficiency and minimize potential interferences from the sample matrix. Following that, the effect of the best desorption solvent volumes (0.1–1.5 mL) was studied under obtained optimized conditions. The desorption process was then carried out by ultrasonic bath (operating at 37 kHz, 200 W) at room temperature for 40 min. The resultant desorption solution was evaporated using a nitrogen pressure blowing concentrator to near dryness. Finally, the residue was re-dissolved in efficient solvents, filtered through 0.22 μm PTFE filter, and was injected into the HPLC-UV system for analysis. All experiments were carried out in triplicates, and the values reported as the average of three readings. Blank samples were run in parallel on PG solutions without the addition of the adsorbent, showing that the experimental procedure did not lead to any reduction of its concentration, and pH variations were unrelated to sorbent effects.
2.5 Apparatus and analysis
A stock of penicillin G was prepared in de-ionized water. The concentration of penicillin G was determined by using high performance liquid chromatography (HPLC) system, with an Ultimate XB C18 column (4.6 × 250 mm, 5 μm). The detailed chromatography conditions were carried out as following. The samples were measured with a flow rate of 0.6 mL/min; Column temperature: 35 °C, mobile phase: methanol/phosphate (0.1 M potassium dihydrogen phosphate, pH: 4.5), injection volume: 20 μL; detection wavelength: 220 nm. The retention time for the antibiotic is ∼ 4.2 min. The detection and quantification limits (LOD and LOQ) were calculated by the standard deviation of the response and the slope of calibration curves, according to the literature (Acikkapi et al., 2019; Porto et al., 2019). The repeatability of the measurements performed (n = 6) attained the precision of the method of PG extraction. Data analysis and calculations were performed using the software Excel and Origin pro software. A pH meter (HI-110 - Canada) was used to measure the pH of solutions.
2.6 Real sample
In order to investigate the ability of Si@Cs-G to extract the PG antibiotic in real conditions, four different water samples i.e. tap, river, well and lake water, and two hospital wastewater samples including SH and SHB were considered. In the next step, selected samples were filtered and stored in brown glass bottles at 4 ℃ in the refrigerator. For minimizing the microbial degradation, the antibiotics were extracted in less than 1 day from sampling. It is necessary to explain that the sample preparation steps were based on the studies of Krakkó et al. (2019) and Aydin et al. (2019). Finally, all samples were examined in the two phases, including non-spiked and spiked of PG antibiotic. Spiked samples were prepared by adding 25 and 50 μg L−1 antibiotic concentrations into the environmental samples. Processes and conditions were performed according to the SPE procedure under optimized conditions and analyzed using the HPLC-UV method that previously established. The relative recoveries (RR%) were calculated using Eq. (1).
3 Results and discussion
3.1 Characterization
The SEM image of pure Cs, Si@Cs, and Si@Cs-G, are given in Fig. 1A–C. The pure Cs and Si@Cs are formed in a compact nano-flakes shape; whereas, Si@Cs-G is in a semi-cylinder shape. The pure Cs has a smooth surface, but, after modification, the shape of the chitosan becomes irregular, forming particle aggregates, due to the grafting reaction of Cs with APTES and G as modifiers (see Fig. 1). A rough surface of Si@Cs-G was observed. After the adsorption process, adsorbent surface coverage faced with significant changes due to PG binding on the Si@Cs-G (Fig. 1D). It can be observed that PG development as a layer on the surface of Si@Cs-G.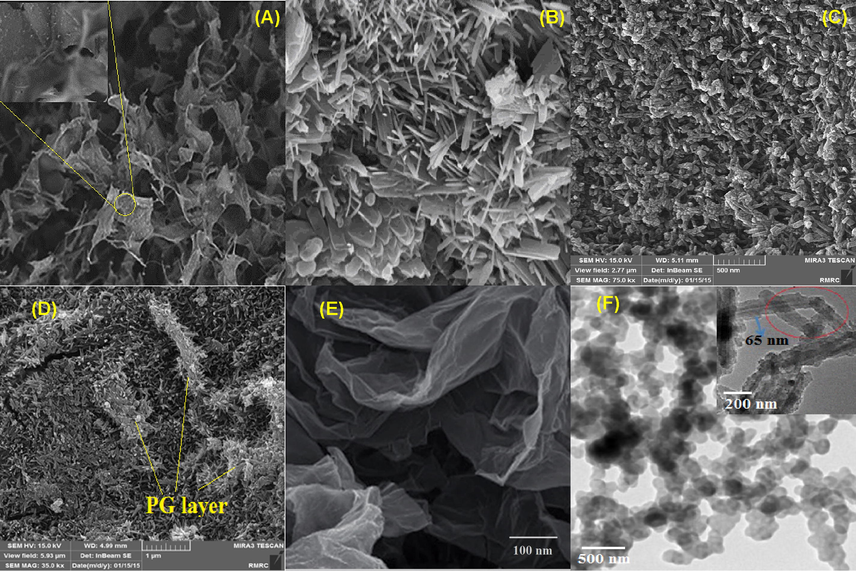
SEM image of Cs (A), Si@Cs (B), Si@Cs-G (C) and Si@Cs-G after adsorption (D), TEM image of Cs (E) and Si@Cs-G (F).
The size and morphology of Cs and modified Cs nanoparticles were evaluated using TEM and dynamic light scattering (DLS) techniques. Fig. 1E shows a TEM image of the Cs nanoparticles. The image shows that Cs has a flake-like shape, smooth surface, and resemble structure in shape and averaged particle sizes between 10 and 100 nm. The TEM image of modified Cs nanoparticles are shown in Fig. 1F. The morphology of the Si@Cs-G formed as spherical and cylindrical shapes with average sizes of 100–240 nm. Furthermore, excellent dispersibility and no severe agglomeration of the particles was observed. A magnified TEM image (Fig. 1F, it is inner) illustrates that the modified Cs had a semi core-shell structure, i.e., with denser skirts and looser interiors. The DLS measurement (Fig. 2A) also shows that Cs and SI@CS-G nanoparticles have an average size of 54.87 nm and 187.83 nm, which is consistent with the TEM observation.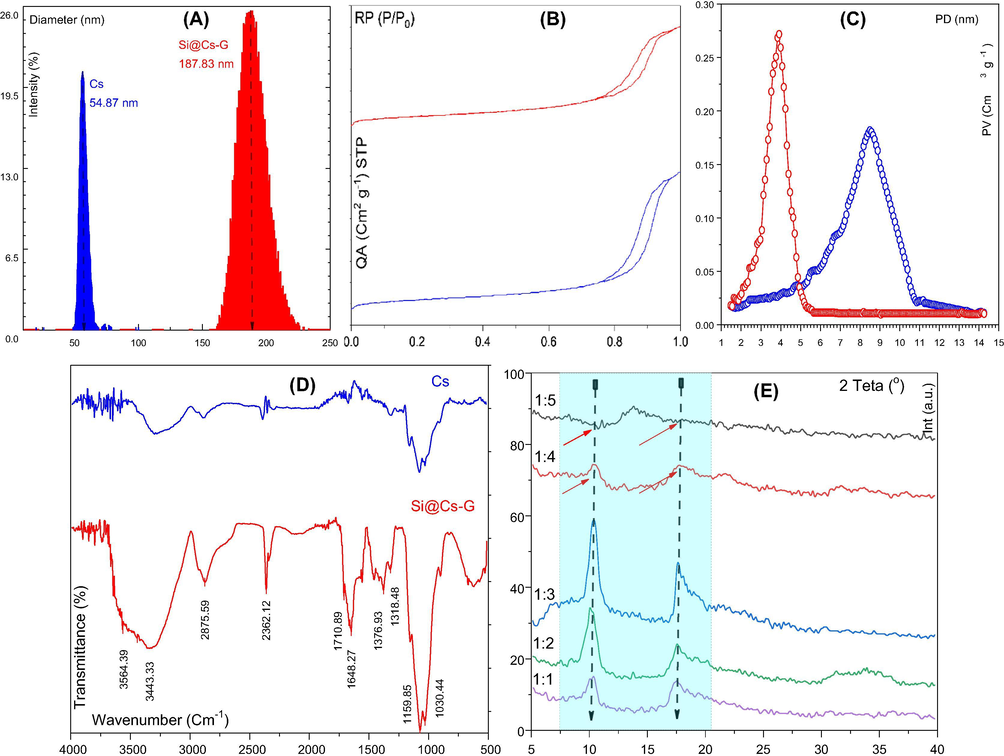
DLS of Cs and Si@Cs-G (A), N2 adsorption-desorption isotherms (B) and corresponding pore size distribution curves of Cs (blue line) and Si@Cs-G (red line) (C), FTIR of Cs and Si@Cs-G (D), XRD of Cs and Si@Cs-G with variation of APTES-G ratio (E).
The isotherms of adsorption and desorption of nitrogen and pore size distribution curves are shown in Fig. 2B–C reveals that the Cs and Si@Cs-G (APTES- G ratio 1:3) belong to type IV isotherm (Fig. 2B) (according to IUPAC classification) and H2 type hysteresis loop. It indicates that the Cs remains “inkbottle” type mesoporous structure and concentrated pore size distribution after modification. The Cs and Si@Cs (Fig not shown, see Supplementary file, Table S1) had BET surface areas of 223.7 and 224.3 m2 g−1 and pore volumes of 1.069 and 1.074 cm3 g−1, respectively, indicating that the thin Si layer did not block the pores in the Cs. The SBET, pore-volume, and average pore diameter of Si@Cs-G with different APTES-G contents are listed in Table S1. The results clearly show a decrease in the specific surface area of nanocomposites with the increase of APTES-G mass ratio. A decrease in SBET and pore volume of samples in higher APTES-G content (>1:3) could be attributed to the compact packing of the Cs molecules in the interlayer space, resulting in the blocking of pores, which prevents the adsorption of nitrogen molecules (Bensalem et al., 2017). The agglomeration and coagulation of APTES-G composite in a high mass ratio is another reason for decreasing of nitrogen molecules adsorption in pores.
The FTIR spectra of the Cs and Si@Cs-G surface is shown in Fig. 2D. The broadband at 3000–3600 cm−1 indicates the O—H stretching vibration of chitosan overlapped with the N—H stretching bands of Cs and Si@Cs-G materials (Branca et al., 2016). The band at 2926 cm−1 (weak intensity) can be assigned to C—H stretch. The vibrational bands at 2362 cm−1 could be assigned to the C⚌O stretching of secondary amide (Branca et al., 2016). The band at 1376 cm−1 is assigned to the bending vibration of the N—H bond (Branca et al., 2016). The absorption band at 1318 cm−1 can be assigned to ether bonds or N—H stretching of amide. The strong bands at 1159 and 1030 cm−1 are assigned to stretching vibration of —Si—O—CH3, and Si—CH2, respectively (Panagiotaki et al., 2020). For the Si@Cs-G, it was observed an N—H stretching band at 3443 cm−1 and a C—H stretching band at 2875 cm−1 (Schiffman and Schauer, 2007). It was observed in the FTIR spectrum of the Si@Cs-G, a new absorption band at 1648 cm−1 that is assigned to the C⚌O group, demonstrating that the chitosan nanoparticles have been linked with the carbonyl group of the glutaraldehyde (Schiffman and Schauer, 2007).
XRD investigated the sample crystallinity and change of Cs structure before and after modifying in the 2θ range of 5°–40° (Fig. 2E). The XRD spectrum of Cs displayed two sharp diffraction peaks at 2θ = 10.20° and 17.84°, revealing the high crystallinity of Chitosan. The crystallinity of the Si@Cs-G increased with an increase in APTES-G ratio up to 1:3, and after that, a decrease in crystallinity was observed with a further increase in APTES-GA content of the adsorbent. This result can be attributed to the increase in intermolecular hydrogen bonding due to the presence of more —OH and or free —NH2 groups within the Cs structure, which in turn results in the better packing of the macromolecular polymeric chains (Sarathchandiran et al., 2019). However, with increasing the APTES-G ratio of more than 1:3, intermolecular hydrogen bonding decreased (broken) due to the steric hindrances induced at higher APTES-G content. As can be seen in 1:5 APTES-G ratio, the characteristic peaks at 2θ = 10.2° and 17.84° approximately disappeared, and a weak and broad peak centered at 2θ = 13.1° appeared. This difference in XRD patterns may be attributed to the cross-linking reaction between chitosan and glutaraldehyde and/or APTES. Concerning the XRD pattern of the Si@Cs-G, the specific peaks originally corresponding to the Cs component almost disappear at APTES-G ratio > 1:3 and just diffraction peaks at 2θ = 13.1° is well retained, confirming that the Cs component in the composite becomes nearly amorphous.
3.2 Optimization of the SPE procedure
3.2.1 pH
The effect of pH on the extraction of PG by the Cs, Cs-G, Si@Cs and Si@Cs-G are presented in Fig. 3A. The peak areas increased with the increase of initial pH of the solution at values up to 6 in all samples. This observation is compatible with the chelation mechanism. Also, the mechanism of extraction can be attributed to less significant H+ ions competition of adsorption at alkaline conditions (Xiang et al., 2019).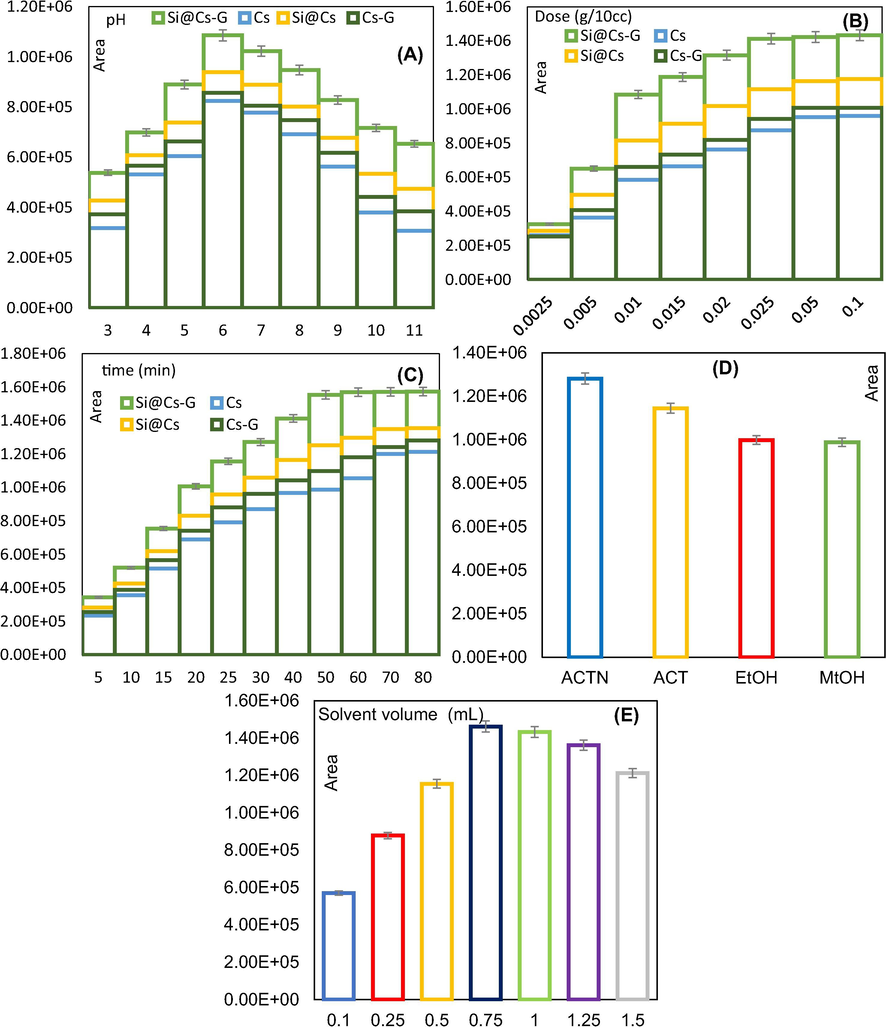
Effect of pH (A), adsorbent amount (B), extraction time (C), eluent type (D), and solvent volume (E) on PG extraction efficiency.
The interactions between the PG and
and/or
groups in the sorbents structure can be expressed by following the reactions, as shown by Eqs. (2) and (3).
In fact, Eqs. (2) and (3) indicates imine groups (i.e., and/or ) in the structure of prepared adsorbent in the solution are protonated and and/or
groups are formed. Eqs. (4) and (5) also represents the complex formation between
(quaternary amino groups) and/or
in the samples and COOH (carboxyl groups) in PG antibiotic. In simpler terms, electrostatic bonding interactions between adsorbent and adsorbate is the primary mechanism of PG extracting as follows:
At lower solution pH (especially at pH ≤ 4), the synthesized adsorbent has its low peak areas (<699564); this could be related to the dissolve and lose the stability of the biopolymer (Cs) and modifier agents (APTES and G). With increasing the pH from 4 to 5, peak areas reached to 889965. At pH 6, we found the PG extraction was increased up to 1085964. Adriano et al. (Adriano et al., 2005) also observed that the highest sorption of amoxicillin by chitosan beads occurred at pH 6.5. For solution pH about 7, the PG extraction was reduced a bit, and when the pH of the solution increases, the peak areas decreases drastically. This is due to the reaction in Eqs. (2)–(3) proceeded to the left because the pKa of protonated imine groups is 6. This caused a decrease in the number of and/or sites, thus, decreasing the extraction of PG through Eqs. (4)–(5). In addition, the remarkable competitive adsorption of hydroxide ions at elevated pH values led to a decrease the peak areas. On the other side, at pH (6) < pHzpc (6.76), the surface of the adsorbents becomes positive. This pH values were also well above the pKa (2.75) value of PG, indicating that under such circumstances it was mainly in the anionic form. Consequently, different charges between the surface of the adsorbent and the adsorbed molecule have led to the electrostatic attraction forces between the solute in a solution and the solid surface, which improved the system efficiency. Based on the results, the optimum pH of the solution is 6, to give the corresponding adsorbent–PG complex.
3.2.2 Adsorbent dosage
Fig. 3B shows the effect of adsorbents dosage variation on PG extraction process. In Fig. 3B, Si@Cs-G shows much larger peak areas compared to Cs, Cs-G and Si@Cs, which could be attributed to the multifunctional amine groups grafted amine groups on the surface of Cs, increasing the number of active sites for adsorption. Also, at high adsorbent dosages the number of and/or groups present on the adsorbent interact with PG. It can be seen that the maximum peak areas were attained at about 25 mg of Si@Cs-G (50 mg for other adsorbents in the same conditions) and was almost the same even at higher doses. Therefore, the Si@Cs-G with 25 mg and Cs, Cs-G and Si@Cs with 50 mg were chosen as the best sorbent dosage in further experiments.
3.2.3 Contact time
From Fig. 3C, the peak areas increased sharply during the first 50 min for Si@Cs-G and 70 min for Cs then getting to decrease till gradually tended to the equilibrium state. Like Cs, an equilibrium time of 70 min was also observed in Si@Cs and Cs-G adsorbents. The proper efficiency at the beginning of the adsorption process can be related to the presence of large vacant sites and functional groups on the adsorbents that begin to fill over time (Crini and Badot, 2008). The presence of multiple functional groups (due to chemical binding), lone pair of electrons on the adsorbent, abundant availability of active sites, and large surface area (due to perceiving porous and mesh structure of Si@Cs-G) might be responsible for better efficiency and faster performance of PG extraction by Si@Cs-G than Cs, Cs-G and Si@Cs.
3.2.4 Desorption solvent and volume
The type of recovery agent (eluents) is an effective parameter to improve the extraction efficiency. Four eluting solvents with different polarities including; Acetonitrile, Acetone, Ethanol and Methanol at various volumes (0.1–1.5 mL) were tested to determine the most suitable eluting solvent for the extraction of PG. Fig. S2 shows the effect of desorption time in term of different solvents. The results indicated that the recovery of the analytes is low at 10 and 20 min and improves with increasing time. However, in the period of 40 to 60 min, the efficiency does not change and has a constant trend. Therefore, desorption time = 40 min was considered for further study. Among the tested solvents (Fig. 3D), ACTN with highest recovery efficiency, was recognized as the most effective solvent for target compound extraction. The above-mentioned results indicate that the adsorption of selected antibiotic on the Si@Cs-G is mainly based on hydrogen bond interactions. Hence, ACTN could probably create strong hydrogen bonds with the analytes and disconnect the interactions between the analytes and adsorbent. The results also revealed that the ACT, EtOH, and MeOH were placed in the next position with less recovery efficiency. The volume of desorption solvent should be enough for quantitatively recovering of all the analytes from the sorbent. Fig. 3E indicates that using 0.75 mL of ACTN resulted in maximum efficiency. Thus, the ACTN with volume of 0.75 mL was selected for further experiments.
3.3 Method validation
After obtaining the optimized conditions (sorbent dosage: 25 mg, ACTN desorption solvent with volume of 0.75 mL; pH: 6 and extraction time: 50 min), the analytical merits of the method including linear range (LR), limits of detection (LOD), limits of quantification (LOQ), coefficient of determination (R2), average recoveries (Re) in spiked samples, preconcentration factor (PF), enrichment factor (EF), and precision (RSD%) were calculated and given in Table 1.
Parameters
Values
R Square
0.9998
Regression equation after preconcentration
y = 28059x + 232558
R Square
0.999
Adjusted R Square
0.997
Linear range (μg L−1)
1–300
Limit of detection (LOD, μg L−1)
0.493
Limit of quantification (LOQ, μg L−1)
1.638
Reproducibility (RSD, %)
1.953
Repeatability (RSD, %) (N = 5)
5.854
Average recoveries (%) in spiked samples
98.977
Enrichment factor
92.224
Preconcentration factor
65.175
In this section, eight concentration levels of the analytes were spiked to distill water (blank samples) and were extracted according to the proposed procedure. The method was linear within the concentration range of 1–300 µg L−1 with R square = 0.999 and adjusted R square = 0.997, which indicates decent linearity within the range. The LOD based on the signal to noise ratio (S/N) of 3 was 0.493 µg L−1 and LOQ established at an S/N of 10 equal to 1.638 µg L−1. The RSDs were calculated for six replicates (n = 6) extractions on the same day equal to 0.12–8.82%. The average recoveries, enrichment and preconcentration factor also were obtained within 98.977%, 92.224 and 65.175, respectively. The reusability of the Si@Cs-G was investigated by performing five adsorption–desorption cycles. According to the results, extraction recovery of PG by Si@Cs-G after 6 times reused decreased ∼ 5.8%. Based on the evidence, it can be reported that the developed method provided an acceptable recovery rate and verified to be a reliable and accurate method for PG antibiotic determination from synthetic samples.
3.4 Real samples analysis
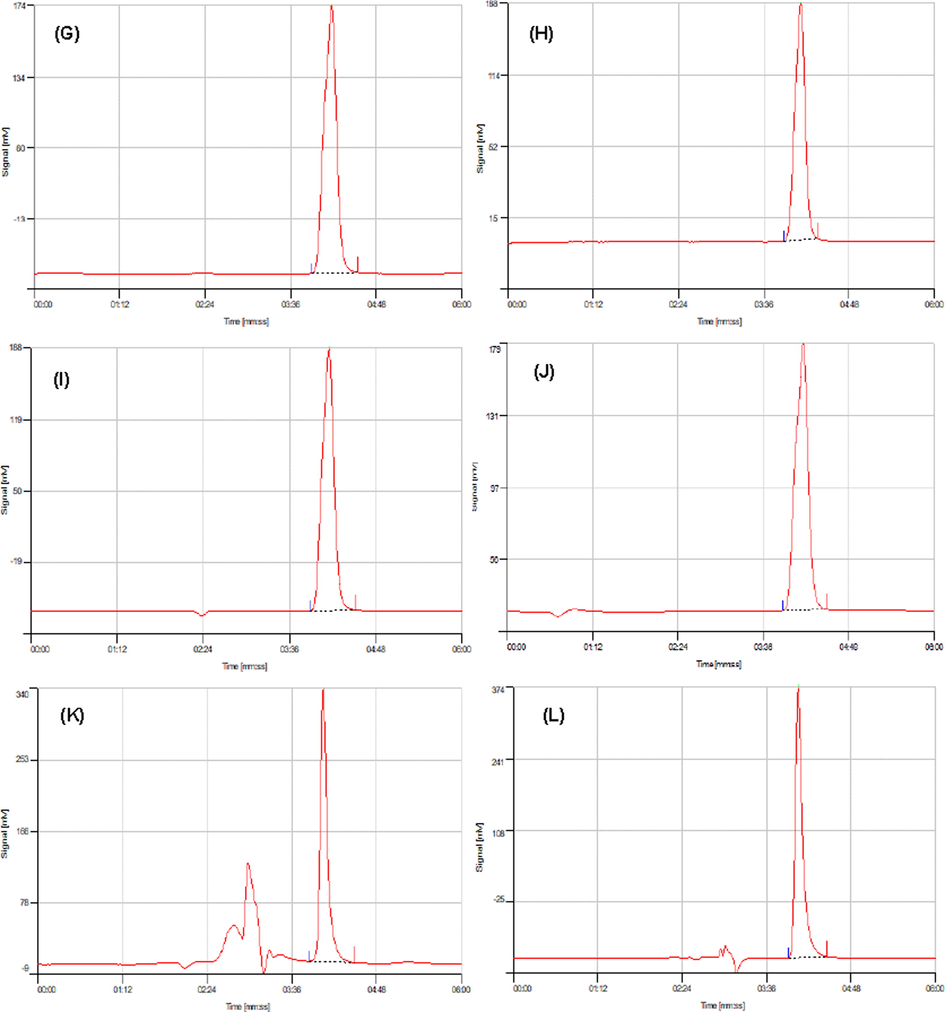
The proposed SPE-HPLC method based on Si@Cs-G was employed to the analysis of PG in six different samples. Under the optimized extraction conditions detailed above, the relative recoveries (RR%) and RSDs% (n = 6 for each determination) of the target compounds were calculated and their results were summarized in Table 2. As can be seen in blank samples, PG was detected only in the SH and SHB hospital effluent at a concentration < LOD. However, PG residues were not found in other water samples. To study the accuracy of the method, the recovery experiment was performed by adding the PG antibiotic to every six real samples at two concentrations levels of 25 and 50 μg L−1 with three repetitions. After that, the spiked samples were analyzed by the current method, and their results were compared with the synthetic samples. According to the results, the 91.31 < RR (%) < 123.27 with RSDs (%) < 6.34 for the studied samples. Evidence indicating that the developed method had an appropriate accuracy and was suitable for the analysis of the PG antibiotic in water and wastewater samples with RR > 91.31% while this parameter had higher value in hospital wastewaters effluent than water samples. The non-spiked and spiked chromatograms of PG obtained for water and wastewater samples in concentration of 50 μg L−1 are shown in Fig. 4.
Added
Found (μg L−1)
RR (%)
Added
Found (μg L−1)
RR (%)
(μg L−1)
Values
± RSD
Values
± RSD
(μg L−1)
Values
± RSD
Values
± RSD
Tap water
River water
0.00
n.d.
–
–
–
0.00
n.d.
–
–
–
0.00
n.d.
–
–
–
0.00
n.d.
–
–
–
0.00
n.d.
–
–
–
0.00
n.d.
–
–
–
25.00
24.64
2.02
98.56
2.62
25.00
24.15
2.04
96.61
3.61
25.00
24.72
1.82
98.88
2.47
25.00
24.43
2.04
97.71
3.61
25.00
23.76
2.47
95.04
3.51
25.00
22.83
2.53
91.31
4.10
50.00
49.38
2.10
98.76
1.44
50.00
48.62
1.73
97.25
1.14
50.00
49.99
2.01
99.98
1.35
50.00
49.33
1.65
98.65
1.05
50.00
49.95
1.96
99.90
1.30
50.00
49.33
1.90
98.66
1.31
Lake water
Well water
0.00
n.d.
–
–
–
0.00
n.d.
–
–
–
0.00
n.d.
–
–
–
0.00
n.d.
–
–
–
0.00
n.d.
–
–
–
0.00
n.d.
–
–
–
25.00
24.41
2.12
97.66
3.33
25.00
24.45
2.31
97.81
3.75
25.00
24.56
2.11
98.25
3.33
25.00
24.54
2.46
98.15
3.90
25.00
23.22
2.41
92.90
3.76
25.00
23.09
2.23
92.35
3.67
50.00
49.02
1.86
98.04
1.23
50.00
49.06
1.77
98.11
1.11
50.00
49.69
1.80
99.38
1.17
50.00
49.75
1.75
99.50
1.10
50.00
49.58
1.86
99.16
1.22
50.00
49.46
1.71
98.91
1.06
SH Waste water
SBH Waste water
0.00
<LOD
–
–
–
0.00
<LOD
–
–
–
0.00
<LOD
–
–
–
0.00
<LOD
–
–
–
0.00
<LOD
–
–
–
0.00
<LOD
–
–
–
25.00
28.23
2.25
112.92
4.22
25.00
28.89
2.63
115.55
3.81
25.00
27.73
2.87
110.92
4.98
25.00
29.01
1.90
116.03
3.08
25.00
26.32
2.97
105.28
6.34
25.00
27.70
2.05
110.78
3.23
50.00
57.73
3.25
115.46
3.88
50.00
58.74
2.84
117.48
3.38
50.00
60.93
2.94
121.86
3.58
50.00
61.63
3.14
123.27
3.68
50.00
59.92
3.42
119.84
4.06
50.00
61.11
3.00
122.22
3.54
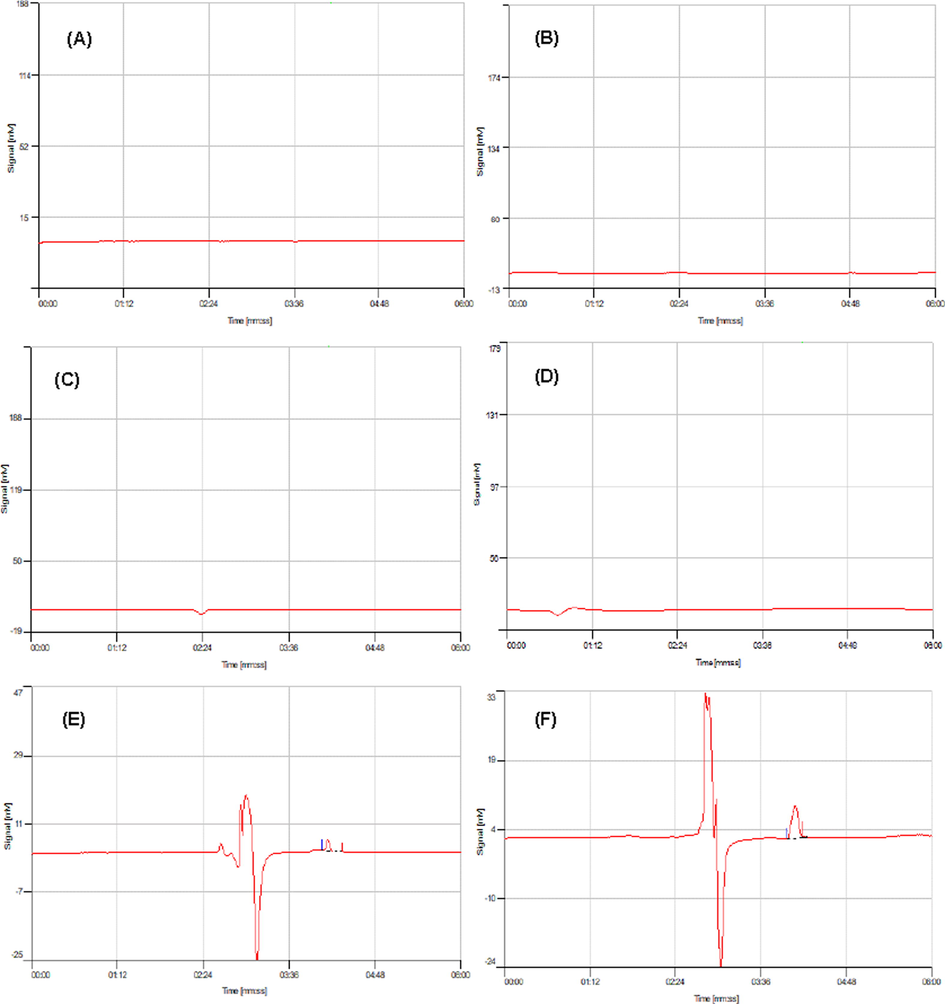
HPLC chromatograms referring the analysis of PG for un-spiked tap water (A), river water (B), well water (C), lake water (D), SH hospital effluent (E), SHB hospital effluent (F), and spiked tap water (G), river water (H), well water (I), lake water (J), SH hospital effluent (K), SHB hospital effluent (L) samples (spiked concentration of 50 μg L−1).
HPLC chromatograms referring the analysis of PG for un-spiked tap water (A), river water (B), well water (C), lake water (D), SH hospital effluent (E), SHB hospital effluent (F), and spiked tap water (G), river water (H), well water (I), lake water (J), SH hospital effluent (K), SHB hospital effluent (L) samples (spiked concentration of 50 μg L−1).
3.5 Comparison with other extraction methods
A comparison between the performances of the preset technique with other methods applied for PG analyzing in the previous literature is shown in Table 3. As can be seen, MS detection systems showed LODs better than the present method, which may be due to the high sensitivity of the MS/MS than the UV detector. However, higher costs and complexity can be weaknesses of MS systems although that is an outstanding detector. The developed methodology in present research demonstrate that LOD, RRs, and RSDs is better than some methods and comparable with the others. Low operational costs, green chemistry and little organic solvent consumed are another advantage of the proposed method for the extraction of PG. In fact, the high percentage of SPE recoveries (>98.977%) with good RSD (<1.953%) and relative recoveries between 91.31 and 123.27% in terms of real samples can confirm the superiority of the developed adsorbent in comparison to the reported ones. The very low LOD (0.493 µg L−1) and strong linearity (0.999) of the proposed method indicate that Si@Cs-G is a highly efficient adsorbent for the extraction of the target analytes. Therefore, it can be concluded that the synthesized adsorbent can be used as a novel alternative material to extract the PG concentration from samples.
Sorbents
Instrumental
Sample
RR
Linear range
LOD
LOQ
RSD
Ref.
SMIPs
HPLC
Tap water
84.6
1.25–200
0.25
0.5
1.2
(Du et al., 2014)
SMIPs
HPLC
Milk
83.1
1.25–201
0.12
0.3
1.5
(Du et al., 2014)
HLB cartridge
HPLC–DAD
Wastewater
95.7
25–100
0.27
0.81
1.3
(Opriş et al., 2013)
HLB cartridge
HPLC–DAD
Wastewater
68.3
100–500
3
10
8.4
(Babić et al., 2006)
HLB cartridge
LC–MS–MS
DI water
92.2
0.1–20
0.01
ND
8.6
(Cha et al., 2006)
HLB cartridge
LC–MS/MS
Poudre River
93.8
0.1–21
0.01
ND
7.4
(Cha et al., 2006)
Cartridge C-18
LC–MS/MS
Ground water
103
0.01–0.1
0.01
ND
8
(Pozo et al., 2006)
HLB cartridge
HPTLC
Well water
89.4
100–400
50
100
3.12
(Babić et al., 2007)
HLB cartridge
HPTLC
Wastewater
62.7
100–400
50
100
6.97
(Babić et al., 2007)
Elute Plexa cartridges
LC/MS/MS
Wastewater
111
0.1–10
0.02
0.22
2
(Ngigi et al., 2020)
MIP cartridge
HPLC
Tap Water
96
10–250
1.7
ND
7.6
(Urraca et al., 2007)
MIP cartridge
HPLC
River water
90
10–250
1.3
ND
8.4
(Urraca et al., 2007)
Si@Cs-G
HPLC-UV
DI water
98.9977
1–300
0.493
1.638
1.953
This study
3.6 Isotherm modeling
Different models, i.e., Langmuir, Freundlich, and Liu, were considered to evaluate the potential of Cs and Si@Cs-G on the extraction of PG molecules (see Table 4 and Fig. S3).
Cs
Si@Cs-G
Langmuir
Qmax (µg g−1)
138
307
KL (L mg−1)
1.79
32.6
R2adj
0.943
0.879
SD (mg g−1)
13.7
46.0
Freundlich
KF (µg g−1 (µg L−1)−1/nF)
79.2
238
nF
5.75
9.84
R2adj
0.956
0.968
SD (µg g−1)
12.0
23.7
Liu
Qmax (µg g−1)
169
366
Kg (L µg−1)
0.820
22.3
nL
0.516
0.313
R2adj
0.977
0.988
SD (µg g−1)
8.82
14.2
Based on the values of R2adj and SD, the Liu isotherm model presented the best results (R2adj closer to 1.00; lower values of SD). The Liu isotherm model (Puchana-Rosero et al., 2016) is a combination of the Langmuir and Freundlich isotherm models, but the monolayer assumption of the Langmuir model and the infinite adsorption assumption that originates from the Freundlich model are discarded. The Liu model predicts that the active sites of the adsorbent cannot possess the same energy. Therefore, the adsorbent may present active sites preferred by the adsorbate molecules for occupation (Puchana-Rosero et al., 2016), however, a saturation of the active sites should occur, unlike in the Freundlich isotherm model.
3.7 Mechanism of PG sorption on Si@Cs-G
The extraction mechanisms of PG by Si@Cs-G depend on the adsorbate-adsorbent and adsorbate-solvent interactions. These interactions are mainly chemical, electrostatic, and physical. The electrostatic interaction, hydrogen bonding, and π-π interaction, explains the extraction mechanism of PG on Si@Cs-G. High total pore volume and suitable surface area of Si@Cs-G causes a decrease in the diffusion resistance, leading to a decrease in the extraction energy, facilitating the PG passage by the pores of the adsorbent. Nevertheless, the principal mechanism of the PG extraction can be considered as:
-
π-π electron donor-acceptor interaction between the π bond of N⚌C of bound of Si@Cs-G) with the π bonds of the aromatic ring of PG antibiotic could contribute with the extraction. (See Supplementary file, Fig. S4).
-
XPS spectra of the Si@Cs-G adsorbent before and after PG extraction were obtained to help explore the PG adsorption mechanism. The N1s spectra of Si@Cs-G before and after PG extraction is shown in Fig. 5A and 5B. In Fig. 5A, the bands at 400.3 and 398.9 eV were assigned to and , respectively. In Fig. 5B, the new band occurs at 401.0 eV that is assigned to an ammonium group ( ), and the change of BE component at 400.3 eV is related to the amino groups' of chitosan interacting with PG during the adsorption process. The NH2 groups of Cs present on Si@Cs-G can be protonated at lower pH forming NH3+ species, that the PG− anion can interact, forming a complex. Considering the point above, the mechanism of PG extraction by Si@Cs-G could be: the amino groups ( ) on the surface of Si@Cs-G are protonated to an ammonium form ( ) and PG anions were adsorbed onto the Si@Cs-G via electrostatic attraction and hydrogen bonding ( is the representative specie):
The interaction between carboxylic groups ( ) in PG structure and silanol group of adsorbents can be considered as useful postulated in the extraction process be as follows:
Besides, PG molecules may be incorporated into the Si@Cs-G structure by complex reaction with aldehyde group ( ) of glutaraldehyde in addition to amine groups as well.
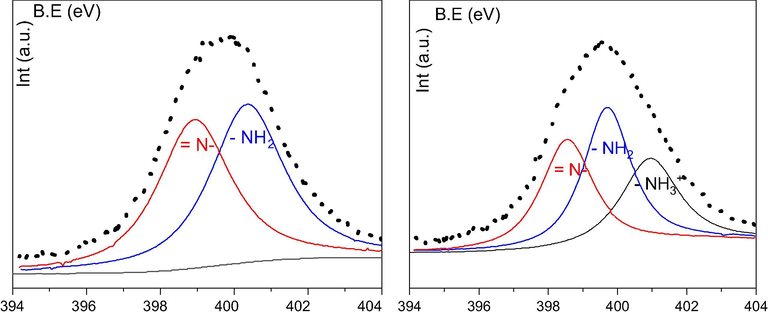
- The N1s spectra of Si@Cs-G before (A) and after (B) PG extraction.
4 Conclusion
A novel, and efficient Si@Cs-G SPE system was fabricated and applied for the extraction of PG antibiotic from synthetic and real samples. In this research, the following conclusions were observed: (a) pH = 6, contact time = 50 min, adsorbent dosage = 25 mg at room temperature were determined as optimized conditions for PG extraction by Si@Cs-G. (b) The best desorption rate was associated to acetonitrile solvent at volume of 0.75 mL under 40 min. (c) In the synthetic terms, the recovery rate of PG was more than 98.97% with high linearity and the RSDs < 1.95%. (d) PG residues were not found in the real water samples; however, it was detected in the wastewater treatment effluent less than LOD. (e) For all real samples 91.31 < relative recoveries (%) < 123.27 were obtained with RSDs < 6.34%.
Acknowledgment
This work was supported by Qom University of Medical Sciences [grant number: 97972, Ethical code: IR.MUQ.REC.1397.156]. E.C. Lima thanks for the grants of CNPq and FAPERGS (Brazil).
Declaration of Competing Interest
The authors declare that they have no known competing financial interests or personal relationships that could have appeared to influence the work reported in this paper.
References
- A newly synthesized graft copolymer for magnetic solid phase microextraction of total selenium and its electrothermal atomic absorption spectrometric determination in food and water samples. Food Chem.. 2019;284:1-7.
- [Google Scholar]
- Stabilization of penicillin G acylase by immobilization on glutaraldehyde-activated chitosan. Braz. J. Chem. Eng.. 2005;22:529-538.
- [Google Scholar]
- Antibiotics in hospital effluents: occurrence, contribution to urban wastewater, removal in a wastewater treatment plant, and environmental risk assessment. Environ. Sci. Pollut. Res.. 2019;26:544-558.
- [Google Scholar]
- Experimental design, modeling and mechanism of cationic dyes biosorption on to magnetic chitosan-lutaraldehyde composite. Int. J. Biol. Macromol.. 2019;131:633-645.
- [Google Scholar]
- Solid phase extraction and HPLC determination of veterinary pharmaceuticals in wastewater. Talanta. 2006;70:732-738.
- [Google Scholar]
- Determination of veterinary pharmaceuticals in production wastewater by HPTLC-videodensitometry. Chromatographia. 2007;65:105-110.
- [Google Scholar]
- Evaluation of mixed mode solid phase extraction cartridges for the preconcentration of beta-lactam antibiotics in wastewater using liquid chromatography with UV-DAD detection. Anal. Chim. Acta. 2006;556:415-422.
- [Google Scholar]
- Characterization of chitosan/montmorillonite bionanocomposites by inverse gas chromatography. Colloids Surf., A. 2017;516:336-344.
- [Google Scholar]
- Role of the OH and NH vibrational groups in polysaccharide-nanocomposite interactions: A FTIR-ATR study on chitosan and chitosan/clay films. Polymer. 2016;99:614-622.
- [Google Scholar]
- Trace determination of β-lactam antibiotics in surface water and urban wastewater using liquid chromatography combined with electrospray tandem mass spectrometry. J. Chromatogr. A. 2006;1115:46-57.
- [Google Scholar]
- High sensitive detection of penicillin G residues in milk by surface-enhanced Raman scattering. Talanta. 2017;167:236-241.
- [Google Scholar]
- Application of chitosan, a natural aminopolysaccharide, for dye removal from aqueous solutions by adsorption processes using batch studies: A review of recent literature. Prog. Polym. Sci.. 2008;33:399-447.
- [Google Scholar]
- Magnetic dispersive micro-solid phase extraction with the CuO/ZnO@ Fe 3 O 4-CNTs nanocomposite sorbent for the rapid pre-concentration of chlorogenic acid in the medical extract of plants, food, and water samples. Analyst. 2019;144:2684-2695.
- [Google Scholar]
- Selective determination of penicillin G from tap water and milk samples using surface molecularly imprinted polymers as solid-phase extraction sorbent. Mol. Imprinting. 2014;2:18-29.
- [Google Scholar]
- Highly selective uranium adsorption on 2-phosphonobutane-1, 2, 4-tricarboxylic acid-decorated chitosan-coated magnetic silica nanoparticles. Chem. Eng. J.. 2020;388:124349
- [Google Scholar]
- Adverse cutaneous reactions and drugs: a focus on antimicrobials. J. Chemother.. 2006;18:127-139.
- [Google Scholar]
- Single-run ultra-high performance liquid chromatography for quantitative determination of ultra-traces of ten popular active pharmaceutical ingredients by quadrupole time-of-flight mass spectrometry after offline preconcentration by solid phase extraction from drinking and river waters as well as treated wastewater. Microchem. J.. 2019;148:108-119.
- [Google Scholar]
- Development of a novel magnetite–chitosan composite for the removal of fluoride from drinking water: adsorption modeling and optimization. RSC Adv.. 2015;5:73279-73289.
- [Google Scholar]
- Occurrence of antibiotics residues in hospital wastewater, wastewater treatment plant, and in surface water in Nairobi County, Kenya. Environ. Monit. Assess.. 2020;192:18.
- [Google Scholar]
- Invited review: Fate of antibiotic residues, antibiotic-resistant bacteria, and antibiotic resistance genes in US dairy manure management systems. J. Dairy Sci.. 2020;103:1051-1071.
- [Google Scholar]
- Determination of some frequently used antibiotics in waste waters using solid phase extraction followed by high performance liquid chromatography with diode array and mass spectrometry detection. Cent. Eur. J. Chem.. 2013;11:1343-1351.
- [Google Scholar]
- Non-porous phosphonated ionic silica nanospheres as nanocarriers for efficient intracellular delivery of doxorubicin. Mater. Today Commun.. 2020;23:100787
- [Google Scholar]
- Curcumin loaded Silica Nanoparticles and their therapeutic applications: A review. J. Mater. NanoSci.. 2020;7:1-18.
- [Google Scholar]
- A new composite of nano zero-valent iron encapsulated in carbon dots for oxidative removal of bio-refractory antibiotics from water. J. Cleaner Prod.. 2019;209:1523-1532.
- [Google Scholar]
- Determination of ascorbic acid in natural fruit juices using digital image colorimetry. Microchem. J.. 2019;149:104031
- [Google Scholar]
- Efficient approach for the reliable quantification and confirmation of antibiotics in water using on-line solid-phase extraction liquid chromatography/tandem mass spectrometry. J. Chromatogr. A. 2006;1103:83-93.
- [Google Scholar]
- Microwave-assisted activated carbon obtained from the sludge of tannery-treatment effluent plant for removal of leather dyes. Colloids Surfaces A: Physicochem. Eng. Aspects. 2016;504:105-115.
- [Google Scholar]
- Recent Developments in Chitosan-Based Nanocomposites, Bio-based Polymers and Nanocomposites. Springer; 2019. p. :183-215.
- High performance removal of phenol from aqueous solution by magnetic chitosan based on response surface methodology and genetic algorithm. J. Mol. Liq.. 2019;285:146-157.
- [Google Scholar]
- Interaction pattern and in vitro, in vivo release behavior of simvastatin-loaded chitosan nanoformulation. Drug Dev. Ind. Pharm.. 2019;45:1725-1739.
- [Google Scholar]
- Evaluation and comparison of tensile strength, water absorption, hardness and colour stability of three commercially available maxillofacial silicone elastomers An in vitro study, Advanced Research in Dentistry and Oral Hygiene (ARDOH) J Dent Forecast.. 2019;2(2):1024.
- [Google Scholar]
- Direct extraction of penicillin G and derivatives from aqueous samples using a stoichiometrically imprinted polymer. Anal. Chem.. 2007;79:695-701.
- [Google Scholar]
- Regeneration of chitosan-based adsorbents for eliminating dyes from aqueous solutions. Sep. Purif. Rev.. 2019;48:1-13.
- [Google Scholar]
- Effect of citric acid induced crosslinking on the structure and properties of potato starch/chitosan composite films. Food Hydrocolloids. 2019;97:105208
- [Google Scholar]
- Carbon-based materials as adsorbent for antibiotics removal: mechanisms and influencing factors. J. Environ. Manage.. 2019;237:128-138.
- [Google Scholar]
- Bioaccumulation of antibiotics in crops under long-term manure application: Occurrence, biomass response and human exposure. Chemosphere. 2019;219:882-895.
- [Google Scholar]
Appendix A
Supplementary material
Supplementary data to this article can be found online at https://doi.org/10.1016/j.arabjc.2020.07.020.
Appendix A
Supplementary material
The following are the Supplementary data to this article:Supplementary data 1
Supplementary data 1


