

Translate this page into:
A stable N-containing heterocyclic carboxylic acid ligand Co-MOF for photoelectric performance and anionic dyes adsorption
-
Received: ,
Accepted: ,
This article was originally published by Elsevier and was migrated to Scientific Scholar after the change of Publisher.
Abstract
Metal-organic frameworks (MOFs) are crystalline porous hybrid materials with periodic network structure and abundant active sites, which are promising adsorbents for organic pollutants. Herein, a novel Co(II)-based organic framework (Co-MOF) [Co2(L1)2(L2)] (L1 = 3-(3-carboxylphenyl) isonicotinic acid, L2 = 4, 4′-Azopyridin) was developed for selective dyes adsorption. Experiments suggest that the Co-MOF exhibits high stability, good photoelectricity and high selectivity for dyes adsorption. For dyes adsorption, the Co-MOF shows a strong adsorption to methyl orange achieving a high capacity up to 440.5 mg g−1, but shows a weak adsorption to methylene blue or rhodamine, indicating its better selectivity for anionic dyes. An insight into the selective removal of the methyl orange is being accounted for by acid-base attraction, anion-π and π–π stacking interactions, involving the Co ion, phenyl rings, and ocarboxylate of L, and the phenyl rings, and osulfonate of MO. The current work contributes to the development of future multifunctional MOF materials with the application in environment protection.
Keywords
Metal-organic frameworks (MOFs)
3-(3-carboxylphenyl) isonicotinic acid
Photoelectricity
Dyes adsorption
Structure

1 Introduction
The increasing amount of organic dye wastewater has caused great challenges worldwide. Particularly, with the development of industry, a large number of organic dyes have a profound impact on the environment and living systems. Organic dye molecules usually contain one or more benzene rings, which are difficult to degrade by conventional chemical and biological methods (Carneiro et al., 2010, Ayar et al., 2007, Qin et al., 2009). With the increasingly strict control of environmental pollution before the discharge of organic dyes, the physical adsorption treatment of organic dyes has been paid more attention (Rajak et al., 2017, Vinothkumar et al., 2022, Li et al., 2021, Zhang et al., 2021a). Methyl orange (MO), a common azo dye pollutant in water (Pérez-Urquiza et al., 2000), widely comes from printing, papermaking, pharmaceutical and food industries. To eliminate this pollutant in water, different physical, chemical and biological methods have been explored in the last decades (Shabbir et al., 2017, Mohammadi et al., 2011, Luan et al., 2021). As an efficient and economical method, the adsorption method for MO removal provides flexibility in design and operation. To date, a series of adsorption materials, e.g., activated carbons, inorganic compounds and Metal Organic Frameworks (MOFs) (Chen et al., 2010, Ai et al., 2011, Asuha et al., 2010, Haque et al., 2011), have been developed for removing pollutants from water. MOF materials are composed of metal ions and organic ligands connected by coordination bonds, and they have high designability, flexible spatial structure and easy combination (Xia et al., 2022, Zhao et al., 2019a). Therefore, MOF materials exhibit a wide application prospect in gas adsorption (Xu et al., 2020, Li et al., 2009), sensors (Zhao et al., 2019b, Jin et al., 2021, Tan et al., 2022), magnetic (Zhang et al., 2021b, Chang et al., 2014, Wang et al., 2015), optical materials(Ye et al., 2018, Wang et al., 2019, Yang et al., 2020a), and catalyst (McMillion et al.,2019, Song et al., 2013, Dong et al., 2017, Ugale et al., 2016, Yuan et al., 2019, Liu et al., 2020). MOFs is usually formed by the self-assembly of appropriate ligands and inorganic building units and mostly a simple modulation in the ligand can result in novel structures. MOFs exhibit unsaturated metal coordination sites, periodic structure, adjustment porosity, and good water stability, which can be utilized as an excellent material for the adsorption of dyes. MOFs are possible applications for dye removal and adsorption due to their large surface area, convenient pore size adjustability, and extended morphology through connection with organic ligands and inorganic metals. For organic dye adsorption, a Co-MOF material developed by Wei et al can selectively remove Congo red (CR) dyes and maintain excellent performance in multiple dye mixes (Wei et al.,2021). A Zn-MOF material from Wu et al shows a unique selective adsorption of methylene blue dye (Wu et al.,2019). Qiu et al. reported that acid-promoted UiO-66 selectively adsorbs anionic dyes from mixed dyes [methyl orange (MO)/methylene blue (MB) and MO/rhodamine B (RhB)] and that the positive zeta potential of UiO-66 is beneficial for the adsorption of anionic dyes (Qiu et al.,2017). The features of MOFs can be modified to adjust their physicochemical properties. Sun et al. developed SiO2@ZIF-67/CNTs composite using ultrasonication and followed by calcination for the removal of MO at pH = 7. This calcined composite did not show much qmax (321.7 mg g−1) at pH = 7 even though it has a high surface area (1135 m2g−1) (Sun et al., 2020). Even though, MIL-53(Al) is acts negatively charge at pH = 6 to obtained moderate qmax (1 8 2) for negatively charged MO. Similarly, another group observed even though negatively charged Cu-MOF show higher removal (92.6%) of MO within 90 min (Sharabati et al., 2020, Mantasha et al., 2020). The extraordinary performance of MOF material for dye adsorption is ascribed to the supramolecular interactions between MOF and adsorbed substances (Zhang et al., 2020, Yang et al., 2020b), which are including electrostatic interactions, hydrogen bond interactions and π - π interactions.
However, the mechanism of dye adsorption is not limited to this. In this work, we propose the possibility that there are other weak intermolecular forces, such as acid-base interactions. A new MOF material [Co2(L1)2(L2)] was designed and synthesized by using 3-(3-carboxylphenyl) isonicotinic acid (L1) and 4, 4 '-Azopyridin (L2) as organic linkers, and Co (II) as coordination center. Based on crystal structure analysis, the stability, photoelectricity and the dyes adsorption of the Co-MOF were evaluated. Moreover, the mechanism of the Co-MOF for the adsorption of dyes was also discussed.
2 Experimental
2.1 Synthesis method
All chemicals used were commercially purchased and without any further purification. The mixture of Co(Ac)2·4H2O (0.10 mmol, 24.91 mg), 3-(3-carboxylphenyl) isonicotinic acid (0.10 mmol, 24.3 mg) and 4, 4 '-Azopyridin (0.10 mmol, 18.42 mg) were dissolved in 8 mL of deionized water. Then the solution was placed in a 25 mL Teflon-lined autoclave and kept at 393 K for 72 h, resulting in large quantities of regular purple crystals. Elemental analysis (%): Calcd is C36H22N6O8Co2: C, 55.07; H, 2.80; N, 10.70%. Findings: C, 55.13; H, 2.78; N, 10.68%.
2.2 Characterization method
Single-crystal X-ray diffraction data of Co-MOF was collected on a Rigaku XL AB Pro diffractometer equipped with Mo-Kα radiation (λ = 0.71073 A). Shelx-2014 and Olex 2.0 were used to directly fit the solution using the full matrix least squares method. Firstly, all metal atoms were located, followed by oxygen, nitrogen and carbon atoms of the compound. And then theoretical hydrogenation, and luckily all the hydrogens are in the ideal geometry. The molecular formula of the final compound was derived from crystallographic data combined with elemental and thermogravimetric data. Detailed crystal data of Co-MOF are listed in Table S1, and partial bond lengths and bond angles are listed in Table S2.
Powder XRD patterns of Co-MOF were collected on a Bruker D8-Advance X-ray diffractometer with Cu Kα radiation (λ = 1.5406 Å). Elemental analysis of C, H and N was carried out on a 2400 Perkin-Elmer analyzer. The thermal stability of the samples in temperature range 0–800 °C was measured under N2 flow by thermogravimetric analysis (TGA) (STA-2500). The UV–vis absorption spectra were recorded by PerkinElmer Lambda 35 spectrophotometer at room temperature. The infrared spectra (4000 ∼ 500 cm−1) were recorded by using KBr pellet on an AvatarTM 360 E.S.P. IR spectrometer. The CHI 660E electrochemical workstation was used for photoelectric test. The working area of the working electrode was 1.0 cm2, and ITO was used to modify the MOF. X-ray photoelectron spectroscopy (XPS) measurement was performed on a PHI 5300 spectrometer using a Perkin-Elmer double-anode X-ray source operating at 13 kV and 250 W of magnesium radiation. The magnetic susceptibility of the compound was measured in a magnetic field of 2000 Oe in the range of 2–300 K.
2.3 Dyes adsorption method
A series of aqueous solutions containing methyl orange (MO), rhodamine (RhB), methylene blue (MLB) and Congo red (CR) were prepared. To evaluate the preference of Co-MOF for different dye molecules adsorption, 10 mg Co-MOF samples were separately dispersed in the above 50 mL (20 mg/L) solution to form dye@Co-MOF suspension. The temperature of dye adsorption was carried out at 293 K. The dye solution was evenly mixed with magnetic stirring at 700 rpm, and its absorbance was measured every five minutes. By controlling other variables or changing the concentration of dye, the maximum adsorption capacity of MO was explored. The adsorption capacity at equilibrium (Qe, mg g−1) of the MOF was calculated with the following equation. (Chen et al., 2021)
3 Results and discussion
3.1 Structure of Co-MOF
3.1.1 Crystal structure of Co-MOF
The crystal structure of the complex [Co2(L1)2(L2)] (L1 = 3-(3-carboxylphenyl) isonicotinic acid, L2 = 4, 4 '-Azopyridin) was characterized by single crystal X-ray diffraction analysis. The complex belongs to monoclinic crystal system, P21/n space group. It can be clearly seen from Fig. 1a that the coordination environment of the Co-MOF, Co(II) adopts a tetrahedral configuration with a [CoO2N2]. Two oxygen atoms are provided by two carboxyl groups of different L1, while two nitrogen atoms are from L1 and L2 ligand respectively. The Co-O bond lengths are 2.0179(17) and 1.9288(15) Å, and the Co-N bond lengths are 2.0353(18) and 2.0709(17) Å. The L1 ligands are completely deprotonated, and each L1 ligand connects three cobalt ions via a pyridine nitrogen atom and two monodentately coordinated carboxyl oxygen atom to form a two-dimensional layered structure (Fig. 1b). The adjacent two-dimensional layers are then connected to each other via L2 ligand spacers to form a three-dimensional porous framework. Interestingly, the void created by the framework that allows the two equivalent frameworks to penetrate mutually, resulting in a 2-fold interpenetrated 3D architecture (Fig. 1c). Due to the arrangement of the 2-fold interpenetrated networks, the pore size of the structure is greatly decreased. From the topological view, the Co(II) atoms can be considered as 4-connected nodes, and the ligand can be regarded as a 3-connected node. As a result, the structure of Co-MOF shows a (3,4) -connected three-dimensional network with topologies of (4.82) (4.85) (Fig. 1d).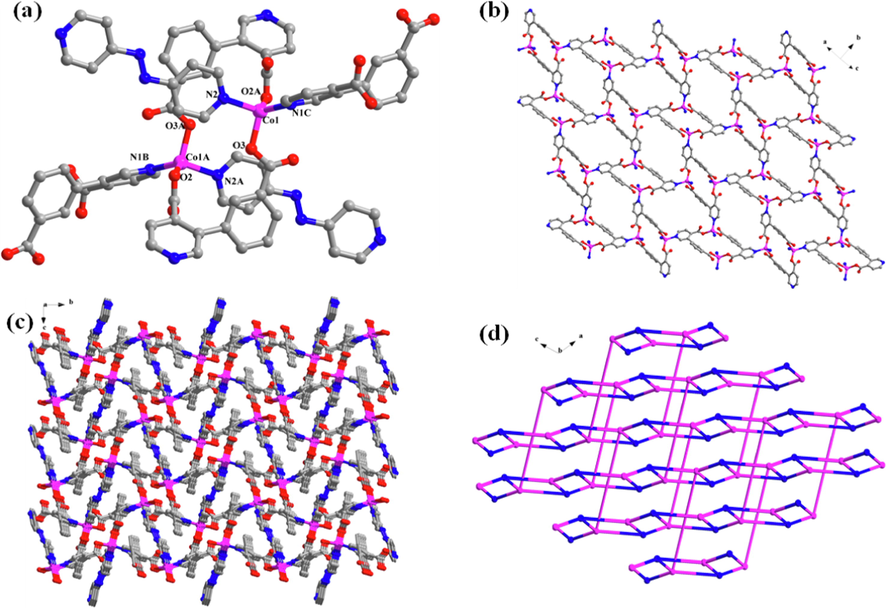
(a) Coordination environment diagram of the Co-MOF, code A: 1-X, 1-Y, 1-Z; B: 1.5-x, −0.5 + y, 0.5-z; C: −0.5 + x, 1.5-y, 0.5 + z; (b) The forming layers of the 2D network structure; (c) The 3D microporous framework in Co-MOF; (d) Simplified topology diagram.
3.1.2 FT-IR, UV–vis and XPS analysis
For the FT-IR spectra, the absorption peak in the fingerprint region is typical aromatic hydrogen stretching vibration of ligands. The peaks at 1630 cm−1 and 1600 cm−1 belong to the skeleton vibration of phenyl and pyridine rings in the ligand respectively. The peaks at 1420 cm−1 and 1360 cm−1 are probably caused by the stretching vibration of nitrogen-nitrogen double bond and carbon–nitrogen single bond in the azo ligand respectively. After adsorption, the material shows the characteristic peak of methyl orange. The symmetric and asymmetric tensile vibrations of O⚌S⚌O bond appear at the absorption peaks of 1180 cm−1 and 1260 cm−1 respectively. The characteristic peak of C—S tensile vibration is 600 cm−1, while that of S—O tensile vibration is 1065 cm−1. Other similar bands associated with sulfonic acid groups occur in the 600 to 1400 cm−1 range. A broad peak appears at 3420 cm−1, which may be an unpaired oxygen that combines with the H atom in H2O to form —OH. (Figure S1).
To characterize the optical properties of Co-MOF, the UV–visible absorption spectra of L1, L2 and Co-MOF at room temperature were measured (Figure S2). The absorption peak of L1 ligand is about 300 nm due to the presence of π → π* transition in benzene ring (Min et al., 2019), and the absorption band of L2 ligand is between 250 nm and 500 nm. In the same range (250–550 nm), Co-MOF shows stronger and wider absorption comparing with ligand. Therefore, the adsorption of Co-MOF has a significant red shift compared to the original ligand L1 and L2, which may be related to the d-d transition of high spin Co (II) (Guo et al.,2011). The band gap Eg of Co-MOF was calculated by drawing a tangent line at the inflection point of (Ahν)2 and (hν) curves (Li et al., 2018). The intercept between the tangent line and the abscissa is the band energy of a compound with a direct band gap. The estimated direct bandgap width of Co-MOF is 1.781 eV (Figure S3).
XPS spectra of Co-MOF shows that the binding energy in the range of 545 ∼ 525 eV belongs to O1s and the range of 771–812 eV belongs to Co2p. The spectra are corrected for the C1s peak, which is known to occur at 284.5 eV. The spectral range of N1s is between 392 and 410 eV. In summary, XPS measurements were performed to verify the elemental composition of the synthesized Co-MOF complexes (Zhao et al., 2023, Zhao et al.,2022). (Figure S4).
3.2 Stability, photoelectricity
3.2.1 Stability of Co-MOF
To study the thermal stability of Co-MOF, the polycrystalline sample was heated from 25 °C to 800 °C at a heating rate of 10 °C min−1 under a N2 atmosphere. For the thermogravimetric curve (Figure S5), it remains basically flat from 25 °C to 433 °C, indicating a high thermal stability in this temperature range. After heated to 433 °C, the thermogravimetric curve drops precipice and remains stable until 527 °C, the mass change is about 39%, revealing the decomposition of structural frame. The platform after 798 °C indicates the complete collapse of the structure, the residual mass is about 47.1% with residual material of Co3O4 mixture.
In addition, PXRD patterns show that the diffraction peaks of the synthesized Co-MOF are consistent with the simulation results, verifying the phase purity of the synthesized samples. The disappearance of characteristic peak reflected that the structures of Co-MOF in pH 1 and 12 solution were destroyed. In addition, the diffraction peak of the soaked Co-MOF is consistent with the simulated diffraction peak, which indicates the high stability of the Co-MOF in the solutions (pH = 3, 5, 7, 9) (Figure S6). Above results suggest that the Co-MOF has excellent solvent stability and pH stability (range from 3 to 9).
3.2.2 Photoelectric property of Co-MOF
To explore the photoelectric property of Co-MOF, the photoelectronic performance of the material was evaluated. After grounded in ethanol, the material is fully covered in indium tin oxide (ITO) conductive glass at 70–80 °C oven to prepare the working electrode. The standard three-electrode system was tested in 0.5 M NaNO3 aqueous solution after composed of indicator electrode and calomel electrode. The cyclic voltammetry curve (Fig. 2a) shows that the working electrode has a strong photoelectric response to negative voltage, and its current density exceeds 60 μA cm−2 at a voltage of −0.4 V.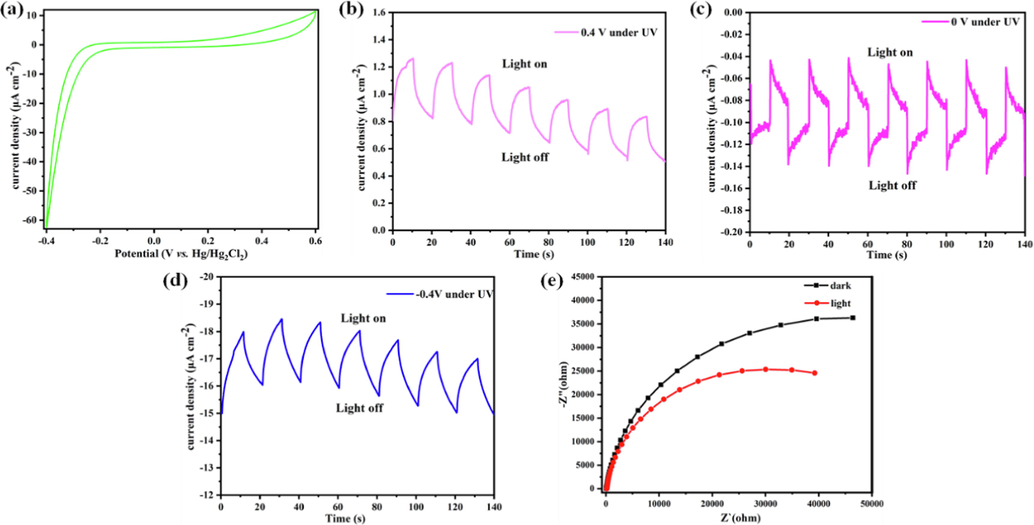
(a) The cyclic voltammogram curve of Co-MOF. (b) Transient current density–time curve of Co-MOF measured at bias potential of 0.4 V vs. Hg/Hg2Cl2 by periodic (10 s) on–off cycles of 300 W Xe lamp irradiation. (c) The bias potential of 0 V; (d) the bias potential of −0.4 V. (d) Electrochemical impedance spectroscopy (EIS) Nyquist plots of Co-MOF measured at bias of −0.2 V under dark and light irradiation state.
In addition, under switching illumination (10 s) and adding 0.4 V bias potential, the working electrode shows significant photoelectronic response behavior (Fig. 2b). It is noteworthy that the periodic and persistent photocurrent signal are displayed in the multiple light on/off cycles. To further confirm the photoelectric response of the material, the photoelectric response at bias voltages of 0 and −0.4 V were respectively measured. As expected, the response at −0.4 V was better than that at 0 V, corresponding to the cyclic voltammetry curve (Fig. 2c, 2d). To clarify the effect of additional light on the current generation of the working electrode, electrochemical impedance spectroscopy (EIS) experiment was carried out at −0.2 V potential (Fig. 2e). It is found that the addition of light can effectively reduce the charge transfer resistance.
3.3 Dyes adsorption
To investigate the adsorption capacity of Co-MOF, the material was used to adsorb dye molecules in aqueous solution. Methyl orange (MO), Congo red (CR), Methylene Blue (MB) and Rhodamine B(RhB) were selected as pollutant models, and the adsorption properties of Co-MOF for dyes in the solution were investigated by UV/vis spectroscopy. As shown in Fig. 3, the Co-MOF has different adsorption capacity for above four dyes. The material shows excellent adsorption performance for MO and CR (Fig. 3a, b). In particular, it can be found from Figure S8 that the color of MO changes significantly in the adsorption process. However, the UV spectra of Fig. 3c and d in different periods are basically at the same position, indicating that Co-MOF has no adsorption capacity for methylene blue and rhodamine. In order to further explore its adsorption performance, MO was taken as the target for further discussion and exploration.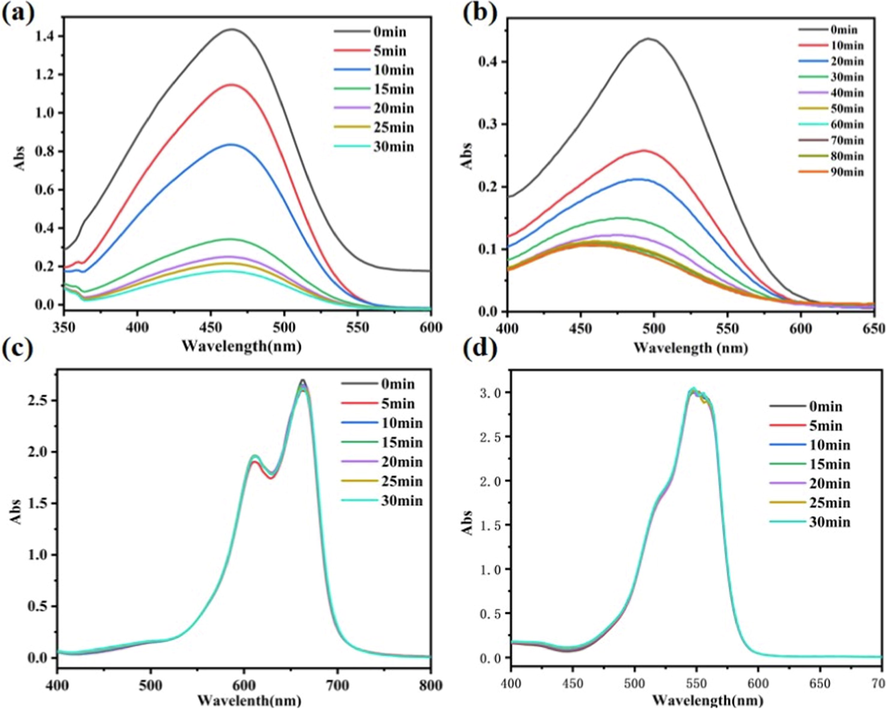
UV–vis absorption spectra of the dye solution containing the adsorbent Co-MOF at different times (a) methyl orange; (b) Congo red; (c) Methylene blue; (d) Rhodamine.
The removal of MO was investigated in a wide concentration range, and results are shown in Figure S9-12. The adsorption capacity of Co-MOF increases with the increase of initial MO concentration, in line with the behavior of typical sorbents (Qiu et al.,2011). To better understand the adsorption capacity of Co-MOF on MO, its adsorption isotherm was constructed by the Langmuir 、Freundlich and Themkin mathematical model and results are shown in Figure S11. The fitting results of the three models are not very different (Wang et al.,2023). In order to further explore the adsorption energy, we choose the relatively common Langmuir model for description with equation as follows:
Adsorption kinetics is related to mass transfer rate and dissolution rate. The analysis of adsorption kinetics is of great significance for understanding the adsorption process and exploring the adsorption mechanism (Zeng et al., 2018). To further understand the adsorption process, the influence of contact time on the adsorption of MO with different initial concentration on Co-MOF was explored (Fig. 4b). The adsorption rate changes irregularly. When the concentration of MO is 60 mg/L, the adsorption rate changes most significantly. In addition, the MO concentration of 50 mg/L was selected for kinetic study (Fig. 4c), and the Co-MOF kinetic evaluation was described by mathematical pseudo-second-order model as follows:
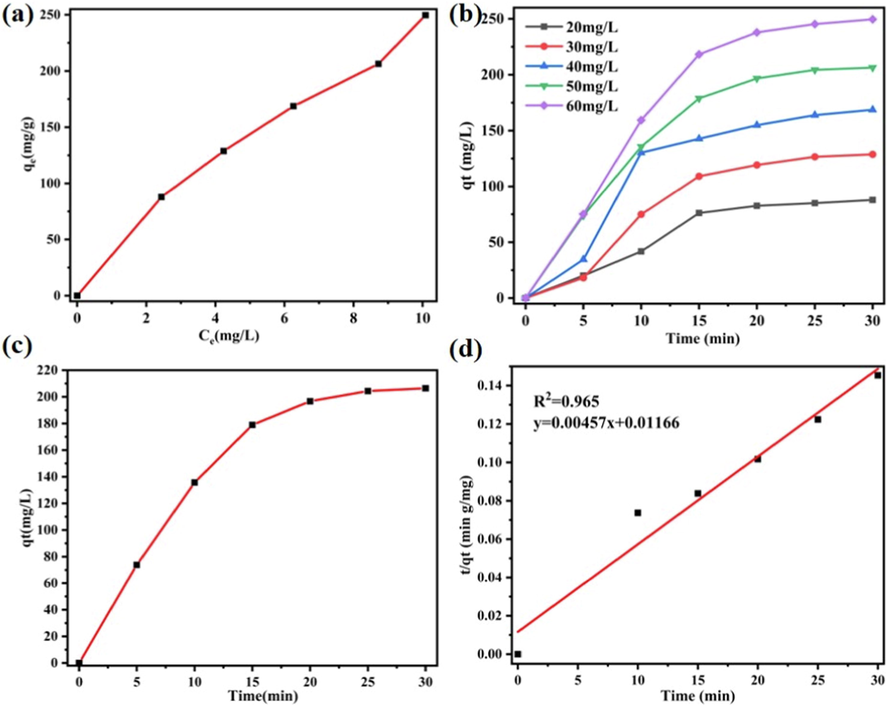
(a) Effect of the equilibrium concentration on the removal of methyl orange by Co-MOF; (b) Effect of contact time on the removal of methyl orange about different initial concentration; (c) Effect of contact time on the removal of methyl orange about 50 mg/L of initial concentration (d) linear form of the pseudo-second-order model about 50 mg/L of initial concentration.
The adsorption kinetics of Co-MOF was satisfactorily described by the quasi-second-order model, and the correlation coefficient of t/qt curve is 0.965. The Co-MOF’s adsorption rate constant of MO is 0.0018 g mg−1 min−1, which is the same as that of other MOFs materials reported in the literature.
The influence of different pH values on the adsorption capacity of each adsorbent is shown in Figure S12. We found that the overall effect was small, showing a slight increase in pH from 4 to 10, but the overall difference was not large. Therefore, the adsorbent can maintain a certain adsorption capacity in the appropriate range of acid and base. (Wang, et al., 2022).
To clarify adsorption mechanism, XRD patterns of Co-MOF before MO adsorption are consistent with those acquired by MERCURY simulation, as shown in Fig. 5a. After MO adsorption, the experiment was conducted to investigate the stability of Co-MOF. Some changes occurred in the new powder XRD patterns, as shown in Fig. 5a, which may be due to crystal phase changes caused by material contact with water, as reported in other MOFs. (Ramírez et al., 2021, Huskinson et al., 2014). The zeta potential of Co-MOF is negative; thus, the adsorption is not driven by electrostatic interactions. (Wang, et al., 2021). After adsorption, the zeta potential of MO@Co-MOF become more negative (Figure S17), which is not conducive to the adsorption of more MO by electrostatic interactions. The specific surface area (Figure S18) and pore size distribution (Figure S19) of the samples were obtained by N2 adsorption–desorption isotherm test to reflect the pore characteristics of the samples. N2 adsorption experiment showed that the BET surface area of Co-MOF was 40.2 m2g−1, and the average pore size was 3.35 nm, this is likely to be the mesoporous adsorption of sample accumulation. The MO shows a linear molecular configuration and its size wasrelatively small (Figure S13、Table S4), which was easier to interact with available sites of MOF and thus be adsorbed. At the same time, the XPS enhanced N-element peak after adsorbing dye can also indicate that the azo dye methyl orange is adsorbed by the material (Fig. 5b). Finally, the appropriate length of ligand versus dye molecule also play an important role which may lead to strong π-π interactions between benzene ring/azo group of dye molecules and pyridine rings with conjugated double bond of azo linker as shown in Fig. 5c. Thus, it is the multiple weak inter-molecular interaction (including acid-base attraction, π···π interactions and so on) rather than electrostatic interactions that contribute to the effective adsorption of MO. (Wen et al., 2016, Wen et al., 2015).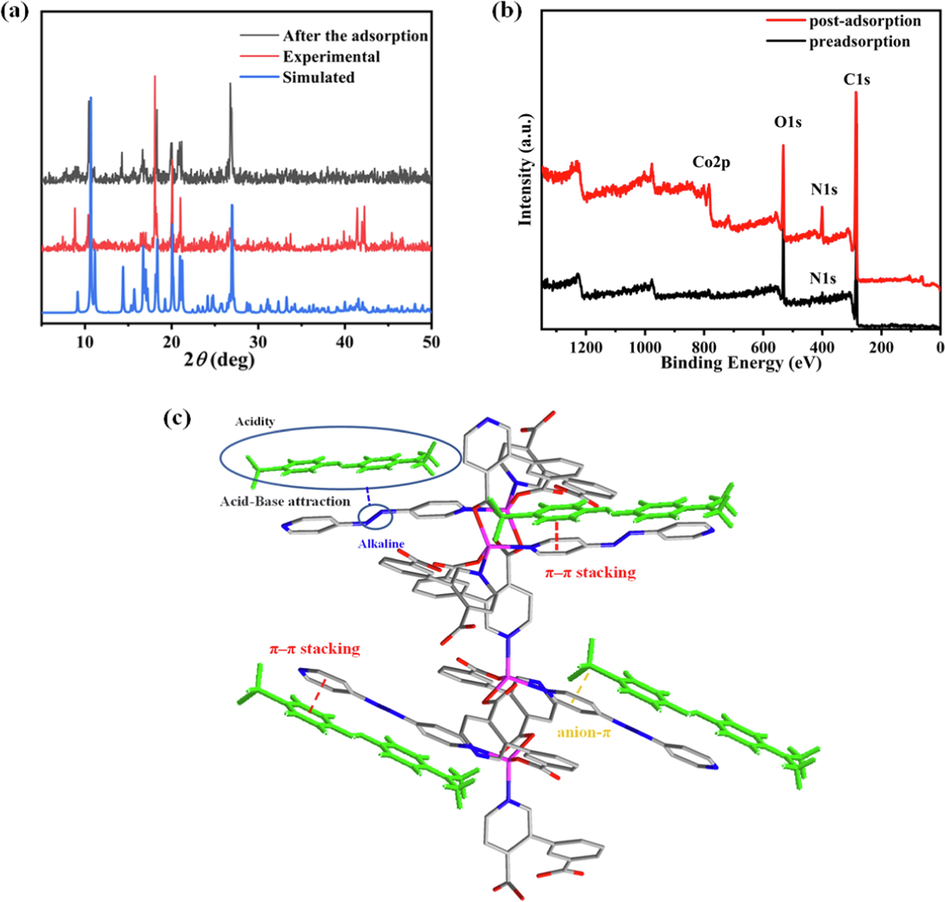
(a) XRD patterns of Co-MOF before and after MO adsorption. (b) XPS spectra of Co-MOF before and after dye adsorption. (c) Schematic diagram of hypothesized adsorption mechanism.
4 Conclusion
In summary, a new type Co(II) crystal multifunctional MOF can be synthesized by solvothermal method using nitrogen-containing heterocyclic carboxylic acid as ligand. The Co-MOF has a three-dimensional frame complex structure belonging to the P21/n space group of monoclinic system. The Co-MOF has excellent solvent and pH stability and N2 adsorption experiment showed that the BET surface area of Co-MOF was 40.2 m2g−1, and the average pore size was 3.35 nm. The Co-MOF can adsorb methyl orange efficiently (440.5 mg g−1), but shows low adsorption performance to methylene blue or rhodamine. The selectivity of Co-MOF for dye adsorption may also be related to the low electron density in the pyridine linker, resulting in strong electrostatic interaction with anionic dyes.
CRediT authorship contribution statement
Ying Zhao: Methodology, Data curation, Writing – review & editing. Yin- Hang Chai: Investigation, Data curation, Writing – original draft. Ling Ding: . Shuang Wang: Investigation, Methodology. Yi-ni Wang: Investigation, Methodology. Lu-Fang Ma: Resources, Supervision. Bang-Tun Zhao: Resources, Supervision, Methodology, Supervision, Resources.
Acknowledgements
This work was supported by the National Natural Science Foundation of China (Grant No. 22171123 and 21801111), Training Plan for Young Core Teachers in Higher Education of Henan Province (2021GGJS131) and Key Science and Technology Program of Henan Province (212102210574).
Declaration of Competing Interest
The authors declare that they have no known competing financial interests or personal relationships that could have appeared to influence the work reported in this paper.
References
- Adsorption of methyl orange from aqueous solution on hydrothermal synthesized Mg-Al layered double hydroxide. J. Chem. Eng. Data. 2011;56:4217-4225.
- [Google Scholar]
- Adsorption of methyl orange and Cr(VI) on mesoporous TiO2 prepared by hydrothermal method. J. Hazard. Mater.. 2010;181:204-210.
- [Google Scholar]
- Adsorptive removal of Methylene blue and Methyl orange from aqueous media by carboxylated diaminoethane sporopollenin: On the usability of an aminocarboxilic acid functionality-bearing solid-stationary phase in column techniques. J. Hazard. Mater.. 2007;146:186.
- [Google Scholar]
- Assessment of water contamination caused by a mutagenic textile effluent/dyehouse effluent bearing disperse dyes. J. Hazard. Mater.. 2010;174:694-699.
- [Google Scholar]
- Exploring the structural diversities and magnetic properties of copper (II) and manganese (II) complexes based on 5-methoxyisophthalate and flexible bis (imidazole) ligands. Cryst Eng Comm. 2014;16:870-882.
- [Google Scholar]
- Equilibrium and kinetic studies of methyl orange and methyl violet adsorption on activated carbon derived from Phragmites australis. Desalination. 2010;252:149-156.
- [Google Scholar]
- Metal-Organic Frameworks with Tb4 Clusters as Nodes: Luminescent Detection of Chromium (VI) and Chemical Fixation of CO2. Inorg. Chem.. 2017;56:6244-6250.
- [Google Scholar]
- A Series of 2D and 3D Metal-Organic Frameworks Based on a Flexible Tetrakis(4-pyridyloxymethylene) methane Ligand and Polycarboxylates: Syntheses, Structures, and Photoluminescent Properties. Cryst. Growth Des.. 2011;11:3609-3621.
- [Google Scholar]
- Adsorptive removal of methyl orange and methylene blue from aqueous solution with a metal-organic framework material, iron terephthalate (MOF-235) J. Hazard. Mater.. 2011;185:507-511.
- [Google Scholar]
- Recent progresses in luminescent metal–organic frameworks (LMOFs) as sensors for the detection of anions and cations in aqueous solution. Dalton Trans.. 2021;50:1950-1972.
- [Google Scholar]
- Construction of porous 2D MOF nanosheets for rapid and selective adsorption of cationic dyes. Dalton Trans.. 2021;50:3348-3355.
- [Google Scholar]
- Selective gas adsorption and separation in metal-organic frameworks. Chem. Soc. Rev.. 2009;38:1477-1504.
- [Google Scholar]
- A first new porous d–p HMOF material with multiple active sites for excellent CO2 capture and catalysis. Chem. Commun.. 2020;56:2395-2398.
- [Google Scholar]
- Selective capture of Hg(II) and Ag(I) from water by sulfur-functionalized polyamidoamine dendrimer/magnetic Fe3O4 hybrid materials. Sep. Purif. Technol.. 2021;257:117902
- [Google Scholar]
- Two dimensional (2D) molecular frameworks for rapid and selective adsorption of hazardous aromatic dyes from aqueous phase. Sep. Purif. Technol.. 2020;238:116413
- [Google Scholar]
- Imidazole for Pyridine Substitution Leads to Enhanced Activity Under Milder Conditions in Cobalt Water Oxidation Electrocatalysis. Inorg. Chem.. 2019;58:1391-1397.
- [Google Scholar]
- Ultra-high capacity of lanthanum-doped UiO-66 for phosphate capture: Unusual doping of lanthanum by the reduction of coordination number. Chem. Eng. J.. 2019;358:321-330.
- [Google Scholar]
- Adsorption process of methyl orange dye onto mesoporous carbon material-kinetic and thermodynamic studies. J Colloid Interf Sci. 2011;362:457-462.
- [Google Scholar]
- Determination of sulfonated azo dyes in river water samples by capillary zone electrophoresis. J. Chromatogr. A. 2000;883:277-283.
- [Google Scholar]
- Adsorption of anionic dyes on ammonium-functionalized MCM-41. J. Hazard. Mater.. 2009;162:133.
- [Google Scholar]
- Acid-promoted synthesis of UiO-66 for highly selective adsorption of anionic dyes: adsorption performance and mechanisms. J. Colloid Interface Sci.. 2017;499:151-158.
- [Google Scholar]
- Thiol-functionalization of metal-organic framework by a facile coordination-based postsynthetic strategy and enhanced removal of Hg2+ from water. J. Hazard. Mater.. 2011;196:36-43.
- [Google Scholar]
- Design and construction of a ferrocene based inclined polycatenated Co-MOF for supercapacitor and dye adsorption applications. J. Mater. Chem. A. 2017;5:17998.
- [Google Scholar]
- Highly efficient methyl orange adsorption by UV-012, a new crystalline Co(II) MOF. Cryst Eng Comm. 2021;23:3537-3548.
- [Google Scholar]
- Periphyton biofilms: A novel and natural biological system for the effective removal of sulphonated azo dye methyl orange by synergistic mechanism. Chemosphere. 2017;167:236-246.
- [Google Scholar]
- Selective removal of dual dyes from aqueous solutions using a metal organic framework (MIL-53(Al)) Polyhedron. 2020;190:114762
- [Google Scholar]
- Catalytic fixation of CO2 to cyclic carbonates by phosphonium chlorides immobilized on fluorous polymer. Green Chem.. 2013;15:110.
- [Google Scholar]
- Preparation of SiO2@ZIF-67/CNTs and research on its adsorption performance at low-temperature. Colloids Surf A Physicochem Eng Asp. 2020;603:125205
- [Google Scholar]
- Highly pH-Stable Ln-MOFs as sensitive and recyclable multifunctional materials: luminescent probe, tunable luminescent, and photocatalytic performance. Cryst. Growth Des.. 2022;22:323-333.
- [Google Scholar]
- Construction of 3-Fold-Interpenetrated three-dimensional metal-organic frameworks of Nickel (II) for highly efficient capture and conversion of carbon dioxide. Inorg. Chem.. 2016;55:9757-9766.
- [Google Scholar]
- Strongly co-ordinated MOF-PSF matrix for selective adsorption, separation and photodegradation of dyes. Chem. Eng. J.. 2022;428:132561
- [Google Scholar]
- Synthesis of MgNiCo LDH hollow structure derived from ZIF-67 as superb adsorbent for Congo red. J. Colloid Interface Sci.. 2022;612:598-607.
- [Google Scholar]
- A hydrolytically stable cage-based metal–organic framework containing two types of building blocks for the adsorption of iodine and dyes. Inorg. Chem. Front.. 2021;8:1083.
- [Google Scholar]
- Syntheses, crystal structures, and magnetic studies of two Cobalt (II) coordination polymers based on concurrent ligand extension. Inorg. Chem. Commun.. 2015;62:42-46.
- [Google Scholar]
- Organic Crystalline Materials in Flexible Electronics. Chem. Soc. Rev.. 2019;48:1492-1530.
- [Google Scholar]
- Feasible synthesis of bifunctional polysilsesquioxane microspheres for robust adsorption of Hg(II) and Ag(I): Behavior and mechanism. J. Hazard. Mater.. 2023;442:130121
- [Google Scholar]
- A series of novel Co(ii)-based MOFs: syntheses, structural diversity, and various properties. Cryst. Eng. Comm.. 2021;23:6376-6387.
- [Google Scholar]
- Metal-organic frameworks constructed from d-camphor acid: bifunctional properties related to luminescence sensing and liquid-phase separation. ACS Appl. Mater. Interfaces.. 2015;7:4449-4455.
- [Google Scholar]
- A multifunctional cadmium-organic framework comprising tricarboxytriphenyl amine: selective gas adsorption, liquid-phase separation and luminescence sensing. RSC Adv.. 2016;6:1388-1394.
- [Google Scholar]
- New doubly interpenetrated MOF with [Zn4O] clusters and its doped isomorphic MOF: sensing, dye, and gas adsorption capacity. Cryst. Growth Des.. 2019;19:6774-6783.
- [Google Scholar]
- Tandem utilization of CO2 photoreduction products for the carbonylation of aryl iodides. Nat. Commun.. 2022;13:2964.
- [Google Scholar]
- A robust Th-azole framework for highly efficient purification of C2H4 from a C2H4/C2H2/C2H6 mixture. Nat. Commun.. 2020;11:3163.
- [Google Scholar]
- Hexanuclear Zn (II)-Induced Dense π-Stacking in a Metal-Organic Framework Featuring Long-Lasting Room Temperature Phosphorescence. Inorg. Chem.. 2020;59:10395-10399.
- [Google Scholar]
- Modulation of the driving forces for adsorption on MIL-101 analogues by decoration with sulfonic acid functional groups: Superior selective adsorption of hazardous anionic dyes. Dalton Trans.. 2020;49:6651-6660.
- [Google Scholar]
- Molecular Barrier Enhanced Aromatic Fluorophores in Co-Crystals with Unity Quantum Efficiency. Angew. Chem. Int. Ed.. 2018;57:1928-1932.
- [Google Scholar]
- Indium-Organic frameworks based on dual secondary building units featuring halogen-decorated channels for highly effective CO2 fixation. Chem. Mater.. 2019;31:1084-1091.
- [Google Scholar]
- Degradation of dyes by peroxymonosulfate activated by ternary CoFeNi layered double hydroxide: Catalytic performance, mechanism and kinetic modeling. J. Colloid Interface Sci.. 2018;515:92-100.
- [Google Scholar]
- Cadmium (II) and cobalt (II) coordination compounds based on a benzenesulfonic terpyridine ligand: syntheses, structures, luminescent sensing and magnetic properties. J. Solid State Chem.. 2021;298:122148
- [Google Scholar]
- Reticular synthesis of two anionic Zn(ii)-MOFs for organic dye adsorption/separation and lanthanide ion sensitization. Cryst. Eng. Comm.. 2021;23:3319-3325.
- [Google Scholar]
- Superior selective adsorption of anionic organic dyes by MIL-101 analogs: regulation of adsorption driving forces by free amino groups in pore channels. J. Mol. Liq.. 2020;302:112616
- [Google Scholar]
- Growth of Cu2O nanoparticles on two-dimensional Zr-ferrocene-metal-organic framework nanosheets for photothermally enhanced chemodynamic antibacterial therapy. Inorg. Chem.. 2022;61:9328-9338.
- [Google Scholar]
- Silver nanoparticle-modified 2D MOF nanosheets for photothermally enhanced silver ion release antibacterial treatment. Acta Phys.-Chim. Sin. 2023;39:2211043.
- [Google Scholar]
- Zn6 Cluster Based metal−organic framework with enhanced room-temperature phosphorescence and optoelectronic performances. Inorg. Chem.. 2019;58:6215-6221.
- [Google Scholar]
- Tetraphenylethylene-Decorated metal−organic frameworks as energy-transfer platform for the detection of nitro-antibiotics and white-light emission. Inorg. Chem.. 2019;58:12700-12706.
- [Google Scholar]
Appendix A
Supplementary material
Supplementary data to this article can be found online at https://doi.org/10.1016/j.arabjc.2023.104878.
Appendix A
Supplementary material
The following are the Supplementary data to this article:Supplementary data 1
Supplementary data 1


