

Translate this page into:
A study for quality evaluation of Taxilli Herba from different hosts based on fingerprint-activity relationship modeling and multivariate statistical analysis
⁎Corresponding author at: College of Pharmacy, Nanjing University of Chinese Medicine, Nanjing 210023, China. 300100@njucm.edu.cn (Xun-hong Liu)
-
Received: ,
Accepted: ,
This article was originally published by Elsevier and was migrated to Scientific Scholar after the change of Publisher.
Peer review under responsibility of King Saud University.
Abstract
In this study, a fingerprint-activity relationship modeling between chemical fingerprints and antirheumatic activity was established, and multivariate statistical analysis was used to evaluate the quality of Taxilli Herba (TH) from different hosts. Characteristic fingerprints of 20 batches of TH samples were generated by high-performance liquid chromatography coupled with triple quadrupole-time of flight tandem mass spectrometry (HPLC-Triple TOF-MS/MS), and the similarity analysis was calculated based on thirteen common characteristic peaks by hierarchical clustering analysis (HCA). Subsequently, nine efficacy markers were discovered by combining fingerprints and antirheumatic activity through grey correlation analysis (GCA) and bivariate correlation analysis (BCA). Meanwhile, the content of 5 constituents in 9 markers was determined by high-performance liquid chromatography coupled with triple quadrupole-linear ion trap tandem mass spectrometry (HPLC-QTRAP-MS/MS). The comprehensive quality of TH was assessed using multivariate statistical analysis, including principal components analysis (PCA) and technique for order preference by similarity to ideal solution (TOPSIS). The results showed that a high dose of TH extract could markedly ameliorate arthritis damage compared to other doses, with flavonoids playing an important role in the antirheumatic activity. The comprehensive quality of samples from Morus alba L. (SS) was superior to those from Liquidambar formosana Hance (FXS). The present study will demonstrate the markers associated with efficacy, and provide an applicable strategy for more comprehensive quality control and evaluation of TH.
Keywords
Taxilli Herba
Hosts
Fingerprint-activity relationship modeling
Multivariate statistical analysis
Quality evaluation

- AIA
-
adjuvant-induced arthritis
- ANOVA
-
one-way analysis of variance
- BCA
-
bivariate correlation analysis
- BW
-
body weight
- CMC-Na
-
carboxymethyl cellulose sodium
- CUR
-
curtain gas
- ELISA
-
enzyme-linked immunosorbent assay
- ESI
-
an electrospray ionization
- FCA
-
freund’s complete adjuvant
- FHD
-
Liquidambar formosana Hance high dose
- FLD
-
Liquidambar formosana Hance low dose
- FMD
-
Liquidambar formosana Hance middle dose
- FXS
-
Liquidambar formosana Hance
- GCA
-
grey correlation analysis
- GS1
-
nebulization gas
- GS2
-
auxiliary gas
- HCA
-
hierarchical clustering analysis
- HPLC
-
high performance liquid chromatography
- HPLC-QTRAP-MS/MS
-
high-performance liquid chromatography coupled with triple quadrupole-linear ion trap tandem mass spectrometry
- HPLC-Triple TOF-MS/MS
-
high-performance liquid chromatography coupled with triple quadrupole-time of flight tandem mass spectrometry
- IL-1β
-
interleukin 1β
- IL-6
-
interleukin 6
- IL-10
-
interleukin 10
- IACUC
-
Institutional Animal Care and Use Committee
- IS
-
spray voltage
- LOD
-
detection limit
- LOQ
-
quantification limit
- PCA
-
principal components analysis
- RA
-
rheumatoid arthritis
- RSD
-
relative standard deviation
- SHD
-
Morus alba L. high dose
- SLD
-
Morus alba L. low dose
- SMD
-
Morus alba L. middle dose
- S/N
-
signal-to-noise ratio
- SPF
-
Specific Pathogen Free-grade
- SS
-
Morus alba L.
- TCM
-
traditional Chinese medicine
- TEM
-
ion source temperature
- TH
-
Taxilli Herba
- TGT
-
tripterygium glycosides tablets
- TNF-ɑ
-
tumor necrosis factor-alpha
- TOPSIS
-
technique for order preference by similarity to ideal solution
- UV
-
ultraviolet spectrophotometry
Abbreviations
1 Introduction
As a traditional Chinese medicine (TCM), Taxilli Herba (TH) is the dried stems and branches with leaves of Taxillus chinensis (DC.) Danser, which is recognized as an authentic medicinal herb of Guangxi Province in China. It has traditional functions of dispelling wind-damp and reinforcing liver and kidney, as well as modern pharmacological effects such as anti-inflammatory and analgesic (Lin et al., 2017). It has attracted extraordinary attention due to its remarkable efficacy in rheumatoid arthritis (RA). It was reported that the research on TH was divided into two main sections. On the one hand, the content of the main flavonoids was determined by high-performance liquid chromatography (HPLC) and ultraviolet spectrophotometry (UV) (Chen et al., 2019; Huang et al., 2017). On the other hand, quercitrin and avicularin were found to be the effective substances for dispelling rheumatism based on the “syndrome-efficacy-analysis of biological samples” method combined with chemical analysis techniques (Li et al., 2018; Li et al., 2016; Wang, 2015; Guan, 2017). Nevertheless, considering the fact that TH also contains many other types of bioactive constituents such as organic acids, tannins and terpenoids, it is one-sided and unscientific to evaluate the quality of TH only from the indicative constituents. As is known to all, TCM has complex and various constituents and usually exerts effects through multi-components acting on multi-targets in multi-pathways. Hence, it is essential to establish a comprehensive and scientific evaluation system for the quality of TCM.
The semi-parasitic plant characteristic of TH causes its host species and number to be up to hundreds. The variability of hosts may lead to differences in the types and content of chemical constituents and the clinical efficacy (Su et al., 2016). It is worth mentioning that the 2020 edition of the Chinese Pharmacopoeia does not explicitly limit the source of the host of TH, requiring only that cardiac glycosides are not detected (Chinese Pharmacopoeia Commission, 2020). TH from Morus alba L. (SS) has been positively confirmed by generations of medical practitioners and most frequently applied in clinical practice. At present, the quality evaluation of TH from different host sources is predominantly limited to the assessment of overall similarity by HPLC fingerprint (Lu et al., 2020), which has the disadvantage of not being able to identify the unknown constituents. On the contrary, high-performance liquid chromatography coupled with triple quadrupole-time of flight tandem mass spectrometry (HPLC-Triple TOF-MS/MS) systems combines strong separation ability and powerful structure identification capability of mass spectrometry, which is a widely used and mature technique in the analysis of chemical constituents and quality control of TCM (Mei et al., 2021). Furthermore, the differences in chemical constituents of TH from more common Morus alba L. and Liquidambar formosana Hance (FXS) hosts have been studied (Yuan et al., 2021). However, it remains unclear whether the therapeutic effects of TH from these two hosts are equivalent for the same disease. Thus, the correlation analysis of chemical fingerprints and efficacy is imperative and meaningful to explore the main constituents exerting effects and establish quality standards that can reflect the intrinsic quality of TCM.
In this work, the main objective was to identify efficacy-associated bioactive markers from both chemical and biological aspects utilizing fingerprint-activity relationship modeling, and to evaluate the quality of TH from two hosts by merging multivariate statistical analysis. Initially, the chemical fingerprints were established by HPLC-Triple TOF-MS/MS, and the experiment was conducted in adjuvant-induced arthritis (AIA) mice to determine whether TH has protective effect against arthritis. Following that, grey correlation analysis (GCA) and bivariate correlation analysis (BCA) were introduced to investigate the fingerprint-activity relationship to screen out bioactive markers. Thirdly, high-performance liquid chromatography coupled with triple quadrupole-linear ion trap tandem mass spectrometry (HPLC-QTRAP-MS/MS) was used to determine the content of five constituents. Ultimately, the comprehensive quality of TH was evaluated based on principal components analysis (PCA) and technique for order preference by similarity to ideal solution (TOPSIS). The entire procedure of this strategy is summarized in Fig. 1.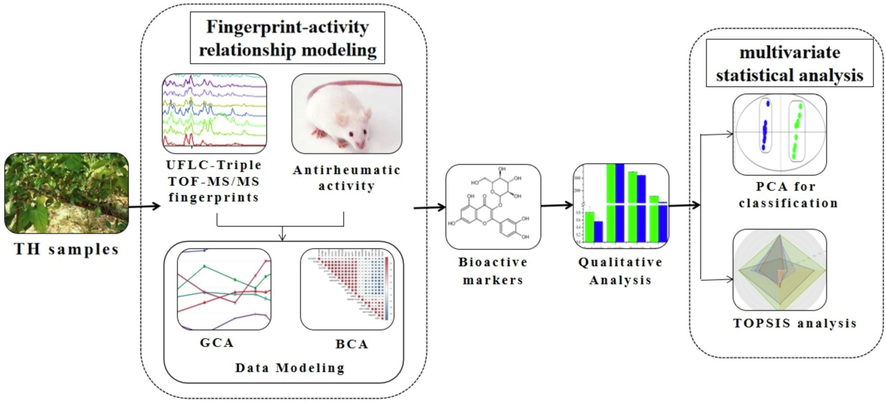
General strategy for the comprehensive quality evaluation of TH.
2 Materials and methods
2.1 Reagents, materials and animals
Isosakuranetin was provided by Liangwei Biotechnology Co., Ltd. (Nanjing, China). (+)-Catechin and hyperoside were supplied by Shanghai Yuanye Biotechnology Co., Ltd. (Shanghai, China). Isoquercitrin was provided by Chengdu Chroma Biotechnology Co., Ltd. (Chengdu, China). Quercitrin was provided by the National Institute for the control of Pharmaceutical and Biological Products (Beijing, China). The purity of five standards was more than 98% determined by HPLC. The enzyme-linked immunosorbent assay (ELISA) kits for Mouse interleukin 6 (IL-6; Lot NO., 202101), interleukin 10 (IL-10; Lot NO., 202101), interleukin 1β (IL-1β; Lot NO., 202101) and tumor necrosis factor-alpha (TNF-ɑ; Lot NO., 202101) were required from Shanghai ZCIBIO Technology Co., Ltd. (Shanghai, China). Tripterygium Glycosides Tablets (TGT, Lot NO., 200803) was obtained from Shanghai Fudanforward pharmaceutical Co., Ltd. (Shanghai, China). Freund’s complete adjuvant (FCA, Lot NO., SLCF1289) was obtained from Sigma-Aidrich (St, Louis, Mo, USA). Carboxymethyl cellulose sodium (CMC-Na, Lot NO., C10701134) was obtained from Shanghai Macklin Biochemical Co., Ltd.(Shanghai, China). Methanol and acetonitrile of HPLC grade were purchased from Merck (Darmstadt, Germany). Ultrapure water was prepared by Milli-Q purifying system (Millipore, Bedford, MA, USA).
20 batches of TH samples from Morus alba L. (10 batches of samples were numbered S1–S10) and Liquidambar formosana Hance (10 bathes of samples were numbered S11–S20) were collected from Wuzhou of Guangxi Province in China. The botanical origins of the materials were authenticated by Professor Xun-hong Liu (Department for Authentication of Chinese Medicines, School of Pharmacy, Nanjing University of Chinese Medicine, Nanjing, China). Voucher specimens were deposited in the laboratory of Chinese medicine identification, Nanjing University of Chinese Medicine.
Specific Pathogen Free-grade (SPF) ICR male mice (18–22 g, aged eight-week-old) were obtained from Qinglong Mountain Animal Breeding Farm Limited Company (Jiangning District, Nanjing, China) [Animal Quality Certificate No. 20210601Abzz0100000293; Animal Production License No. SCXK (ZHE) 2019-0002]. The animals were reared adaptively for a week in a barrier environment before the experiment with the following conditions: temperature at 20 ± 2 ℃, relative humidity at 50 ± 10%, and 12/12 h alternation of day and night. All animal experiments that provided data for the current analysis were conducted in accordance with established ethical standards and were approved by the Nanjing University of Traditional Chinese Medicine for animal use and welfare, and followed pertinent Institutional Animal Care and Use Committee (IACUC) [Application No. 202103A023].
2.2 HPLC‐Triple TOF‐MS/MS fingerprint
2.2.1 Preparation of sample and standard solutions
The dried TH samples from two hosts were finely ground and passed through a 50 mesh sieve. The sample powder was weighed about 0.5 g, sonicated with 15 mL of 50% v/v methanol for 30 min followed by centrifugation at 13,000 r/min for 10 min (H1650-W high speed centrifuge, Hunan Xiangyi Laboratory Instrument Development Co., Ltd., Hunan, China). And then, the supernatant was stored at 4 ℃ and filtered through a 0.45 μm membrane (Jinteng laboratory equipment Co., Ltd., Tianjin, China) prior to injection of HPLC-Triple TOF-MS/MS analysis. A mixed standard stock solution of 5 standards was prepared with 50% v/v methanol at a final concentration of 5 μg/mL (Yuan et al., 2021).
2.2.2 HPLC‐Triple TOF‐MS/MS conditions
Sample analysis was conducted by the HPLC system (Shimadzu, Kyoto, Japan) with the separation conducted by an Agilent ZORBAX SB‐C18 column (4.6 mm × 250 mm, 5 μm) at 30 °C. The mobile phase was made of methanol‐acetonitrile (1:1, v/v) (A) and 0.4% (v/v) formic acid aqueous (B) using the following gradient elution: 0–5 min, 2%–6% A; 5–6 min, 6%–10% A; 6–8 min, 10%–15% A; 8–12 min, 15%–18% A; 12–18 min, 18%–21% A; 18–21 min, 21%–23% A; 21–26 min, 23%–25% A; 26–30 min, 25%–27% A; 30–33 min, 27%–40% A; 33–38 min, 40%–50% A; 38–40 min, 50%–2% A; 40–45 min, 2%–2% A. The flow rate was set at 1.0 mL/min and the injection volume was 10 μL.
MS detection was achieved by an AB Sciex Triple TOFTM 5600 system-MS/MS (AB SCIEX, Framingham, MA, USA), equipped with an electrospray ionization (ESI) source in negative ion mode. The optimized MS conditions were as follows: the m/z scanning range was 100–2000 Da for the MS scan and 50–1500 for the TOF scan, respectively; ion source temperature (TEM), 600 °C; curtain gas (CUR), 40 psi; nebulization gas (GS1), 60 psi; auxiliary gas (GS2), 60 psi; spray voltage (IS), 4500 V; collision energy: −10 V; declustering potential, −100 V (Yuan et al., 2021).
2.2.3 Analysis of characteristic fingerprints
TH samples were chemically profiled under the HPLC‐Triple TOF‐MS/MS conditions as above mentioned. Sample S1 was selected for methodological investigation including precision (successive six injections), stability (solution stored for 0, 3, 6, 9, 15, and 24 h at room temperature) and repeatability (six replicates), respectively. The relative retention time and relative peak area of each common peak in the sample were calculated using peak 13 (quercitrin) as the reference peak. Furthermore, HPLC-Triple TOF-MS/MS fingerprints of 20 batches of TH samples were established by importing original chromatographic data processed by integration into the Similarity Evaluation System for Chromatographic Fingerprint of traditional Chinese medicine (version 2004A, Chinese Pharmacopoeia Commission). The reference fingerprint (R) was generated via the median method after automatic match and multi-point correction of chromatographic peaks, and the similarity between reference fingerprint and sample fingerprints was evaluated ultimately. The identification of common characteristic peaks could be divided into two methods. The first method was to identify the constituents by comparing with the retention time and characteristic fragment ions of the standards. The second method was to speculate based on related literature and databases including HMDB (https://www.hmdb.ca/), SciFinder (https://scifinder-n.cas.org/), and CNKI (https://www..cnki.net/).
Hierarchical clustering analysis (HCA) was conducted by Cluster 3.0 and Java Treeview 3.0 based on the area of common peaks, which used average linkage clustering method with the squared Euclidean distance as the metric.
2.3 Bioactivity assay
2.3.1 Preparation of TH extract
Approximately 60 g of powder was weighed from samples of two hosts for animal experiments. The specific process is as follows: firstly, it was extracted ultrasonically for 30 min after being soaked for 30 min with 600 mL of 50% v/v methanol, and then filtered. Secondly, the filter residue was extracted ultrasonically for 30 min with 480 mL of 50% v/v methanol. Thirdly, the concentrated solution was obtained by concentrating the combined filtrates with a rotary evaporator, which was further dissolved by 0.5% CMC-Na solution and diluted to obtain three dosages of high, medium and low with crude drug content of 10 g/kg, 5 g/kg, 2.5 g/kg, respectively. TGT was pulverized into a uniform powder and dissolved with 0.5% CMC-Na solution to obtain suspension at 1 mg/mL.
2.3.2 Establishment and administration of adjuvant-induced arthritis model
Mice were randomly divided into 9 groups of 10 animals each, which were numbered as Control, Model, TGT, SHD (Morus alba L. high dose), SMD (Morus alba L. middle dose), SLD (Morus alba L. low dose), FHD (Liquidambar formosana Hance high dose), FMD (Liquidambar formosana Hance middle dose) and FLD (Liquidambar formosana Hance low dose), respectively. The specific experimental procedure was summarized in Table S1. The AIA model was established by a single subcutaneous injection of 0.1 mL of FCA (fully shaken for 5 min before use) into the left hind foot of mice after disinfected with 75% alcohol and local white blisters could be observed. In contrast, the control group was injected with 0.1 mL normal saline (0.9%) at the same part (Wang et al., 2018; Li et al., 2016; Li et al., 2018; Guan, 2017; Wang, 2015). After 8 days, the mice in the control group and model group were given with 0.5% CMC-Na while the mice in the positive group were given with TGT suspension (10 mg/kg), and the mice in TH treatment groups were given with high (10 g/kg), medium (5 g/kg) and low (2.5 g/kg) dose solution, respectively. Gavage was given once a day for successive 22 days.
2.3.3 Overall observation and determination of pharmacodynamics indexes
During the whole experiment, the left rear ankle joint diameter of mice at the same position was measured with electronic digital caliper (Shanghai Hengliang Tools Co., Ltd., Shanghai, China) before modeling, 8th day of modeling and every 7 days from the 9th day of modeling. The general conditions and body weight (BW) of the mice were observed at the same time.
Half an hour after the last treatment on the 22nd day of administration, the whole blood was collected from mice orbit promptly. Then the thymus and spleen were took out rapidly after the mice were sacrificed by cervical dislocation. Immune organs were washed with normal saline to remove the blood stains and connective tissues on the surface, dried using absorbent paper, and then weighed. The ratio of thymus and spleen weight (mg) to the BW of mice (g) were used as the immune organ indexes.
For biochemical detection, the serum was separated by centrifugation at 3000 r/min for 15 min at 4 ℃ after the whole blood was left at room temperature for 30 min. The serum was stored at –20 ℃ for further analysis. The calibration curve was plotted by taking the concentration of inflammatory factors (IL-6, IL-10, IL-1β, and TNF-ɑ) in the serum as the horizontal coordinate (X) and the absorbance measured as the vertical coordinate (Y) according to the operation procedure in the ELISA kit.
2.4 Fingerprint-activity relationship modeling
GCA and BCA were applied to assess the fingerprint-activity relationship with Excel for Windows 2021 (Microsoft Corp., Seattle, WA, USA) and IBM SPSS software (version 21.0, Statistical Package for the Social Science Inc., Chicago, USA), respectively. The correlation between pharmacodynamic indexes and chromatographic peaks can be determined by combining the data analysis method of GCA and BCA, which provided a possibility for predicting the active substances in TCM. Complete details of GCA can be found in the Supplementary Materials.
Data statistics were analyzed by using IBM SPSS Statistics 21.0 software with processed data expressed as mean ± standard deviation. One-way analysis of variance (ANOVA) was used for comparison between different groups, where *P < 0.05, or **P < 0.01 means statistically significant differences.
2.5 HPLC‐QTRAP‐MS/MS analysis of 5 constituents in TH
2.5.1 Preparation of sample solutions
About 0.5 g powder of TH (50 mesh) was weighed accurately and ultrasonically extracted with 15 mL of 70% v/v methanol for 32 min. The extract solution was cooled at room temperature and then centrifuged at 12,000 r/min for 10 min. The supernatant was collected and diluted tenfold, stored at 4 ℃ and filtered through a 0.22 μm membrane prior to injection (Wu et al., 2021).
2.5.2 Preparation of standard solutions
A mixed standard stock solution of 5 standards was prepared with 70% v/v methanol and their concentrations were as follows: isosakuranetin, 50.5 μg/mL; (+)-Catechin, 5.8 μg/mL; hyperoside, 39.5 μg/mL; isoquercitrin, 401.2 μg/mL; quercetrin, 145.5 μg/mL. The diluted solutions were used for HPLC-QTRAP-MS/MS analysis. All the solutions were stored at 4 ℃ and were filtered through a 0.22 μm membrane prior to injection (Wu et al., 2021).
2.5.3 HPLC-QTRAP-MS/MS conditions
HPLC analysis was carried out using a SIL-20A XR system (Shimadzu Co., Kyoto, Japan). The separation was performed on an XBridge®C18 column (4.6 mm × 100 mm, 3.5 µm) at 30 ℃. The mobile phase consisted of 0.1% formic acid aqueous (A) and methanol (B) with a gradient elution: 0–5 min, 2–27% A; 5–8 min, 27–31% A; 8–14 min, 31–32% A; 14–17 min, 32–34% A; 17–22 min, 34–40% A; 22–26 min, 40–73% A; 26–29 min, 73–2% A. The injection volume was 2 μL and the flow rate was 0.5 mL/min.
Mass spectrometry was performed on an API5500 triple quadrupole linear ion trap tandem mass spectrometer (AB SCIEX, Framingham, MA, USA) equipped with ESI source operating in negative mode. The parameters were as follows: TEM: 550 ℃; GS1: 55 L/min; GS2: 55 L/min; CUR: 40 L/min; IS: –4500 V in negative ion mode (Wu et al., 2021).
2.5.4 Validation of the method
The method was validated for linearity, intra-day and inter-day accuracy, repeatability, stability, recovery and matrix effect. The calibration curves were obtained by plotting the integrated peak area and the corresponding concentration of each standard, and the regression equation, correlation coefficient and linear range were calculated through the curves. The detection limit (LOD) and quantification limit (LOQ) were determined at the signal-to-noise ratio (S/N) of about 3 and 10, separately. The mixed standard solution was determined for six duplicates within a single day for the intra-day precision test, and the solution was analyzed three times a day for three consecutive days for the inter-day precision test. The sample solution was analyzed for stability at 0, 2, 4, 8, 12, and 24 h, respectively. Six independent sample solutions from the same sample S1 were analyzed to ensure the repeatability. The test was performed by adding the corresponding marker constituents at low (80%), medium (100%) and high (120%) to the TH sample. Three replicates on each amount level were examined. The extraction recovery rate of each compound was calculated by the following formula: recovery (%) = (detected amount − original amount)/spiked amount × 100% (Wu et al., 2021).
2.6 Multivariate statistical analysis.
Principal components analysis (PCA), a commonly used unsupervised chemometric pattern recognition method, was used to describe the classification of TH samples from 2 hosts based on the data of 5 constituents using SIMCA-P 13.0 (Umetrics AB, Umea, Sweden) (Wang et al., 2017). Technique for order preference by similarity to ideal solution (TOPSIS) is a method of ranking a limited number of evaluation objectives based on their proximity to an idealized objective, and evaluating the relative merits of the existing sample (Tan et al., 2019). The steps of TOPSIS can be found in the Supplementary Materials.
3 Results
3.1 Chromatographic fingerprints and analysis of TH samples
3.1.1 Methodology validation
For methodology validation, peak 13 was selected as the reference peak and the relative retention time and relative peak area of common peaks in the samples were calculated to evaluate the precision, stability and repeatability. The results (Table S2) implied that the relative standard deviations (RSDs) of relative retention time and peak area of common characteristic peaks for precision, stability and repeatability were all less than 3%, proving that the optimized method for analyzing samples was reliable and repeatable.
3.1.2 Establishment of chromatographic fingerprint and similarity analysis
The chromatographic fingerprints of 20 batches of TH samples were generated and depicted in Fig. 2 under the above HPLC‐Triple TOF‐MS/MS conditions. The representative base peak chromatograms of the reference mixtures and TH samples from two hosts under negative ion mode were displayed in Fig. S1. A total of thirteen common characteristic peaks whose total peak area accounted for more than 90% of the total peak area were identified and the detailed information was listed in Table 1.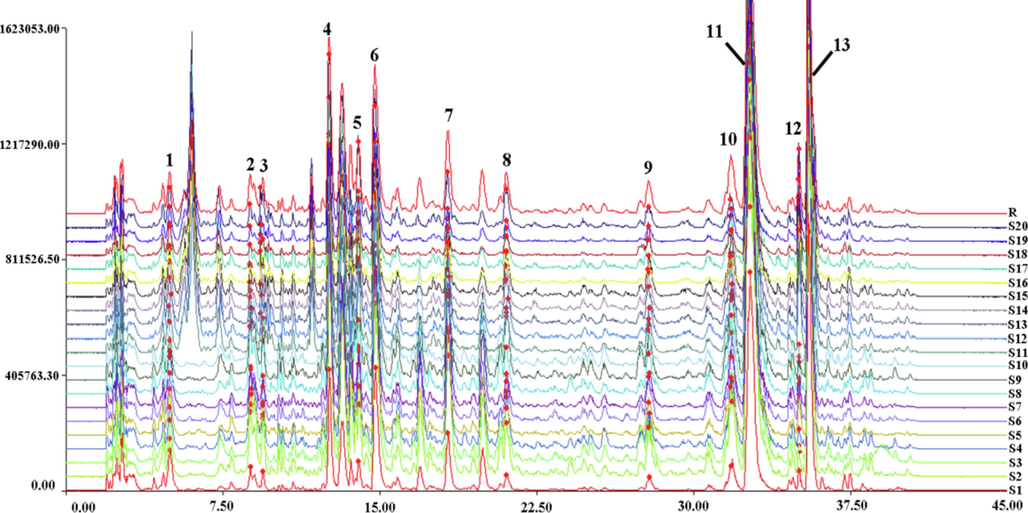
HPLC-Triple TOF-MS/MS fingerprints of 20 batches of Taxilli Herba samples.
Peak No.
tR (min)
Compounds
Molecular
formulaMass ([M − H]−, m/z)
Fragment Ions (m/z)
1
4.96
Citric acid a
C6H8O7
191.0206
173.0101, 154.9982, 129.0187, 103.0400
2
8.84
Glucogallin a
C13H16O10
331.0673
179.0137, 169.0253, 161.024
3
9.37
Homomangiferin a
C20H20O11
435.1129
271.0448, 313.0354, 151.0037, 125.0245
4
12.54
Procyanidin B2 a
C30H26O12
577.1354
451.0989, 425.0835, 407.0733, 289.0685, 245.0768, 179.0733, 125.0231
5
13.91
Isosakuranetin a,*
C16H14O5
285.0620
151.0184, 107.0291
6
14.78
(+)-Catechin a,*
C15H14O6
289.0724
245.0235, 179.0341, 167.0339, 163.0385,
149.0234, 137.0237, 125.0235, 109.0289
7
18.08
Unknow
Unknow
766.8245
729.0348
8
21.02
Kaempferitrin a
C27H30O14
577.1329
431.0985, 285.0244, 256.0179
9
29.52
(−)-Epicatechin gallate a
C22H18O10
441.0817
289.0713, 271.0630, 179.0362, 135.0242,
125.0247, 109.0292
10
31.79
Hyperoside a,*
C21H20O12
463.0864
301.0341, 271.0233, 151.0025
11
32.69
Isoquercitrin a,*
C21H20O12
463.0872
301.034, 151.0034
12
34.99
Kaempferol 3-O-rutinoside a
C27H30O15
593.1501
285.0405
13
35.51
Quercitrin a,*
C21H20O11
447.0921
301.0354, 283.022, 151.0024
The similarity assessment among samples was carried out using the generated control fingerprint profiles as a reference. It was noted that the similarity was in the range of 0.843 to 0.973, indicating that the overall chemical characteristics of samples were similar in a high degree, but different in relative content. The final results indicated that the control fingerprint profiles were representative. The relative peak areas of thirteen common peaks and similarity assessment results were presented in Table S3 and Table S4, respectively.
3.1.3 Hierarchical clustering analysis
The HCA heat map graphically exhibited the relative level of the constituents corresponding to common characteristic peak and the relationships among samples from two hosts. As shown in Fig. 3, samples from Morus alba L. and Liquidambar formosana Hance were obviously divided into two clusters. The relative content of the same ingredient was specified from green to red, representing the level from low to high, which might be related to high or low efficacy of this medicinal herb to some extent.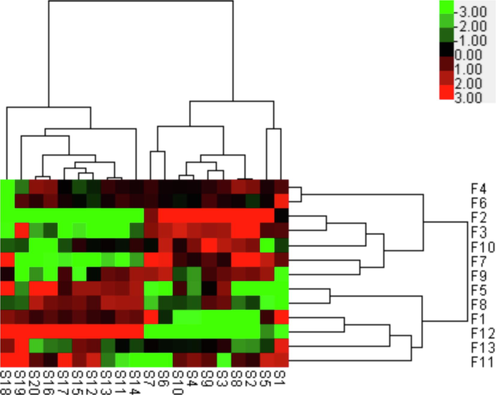
Hierarchical clustering analysis heat map based on the data of common characteristic peaks of Taxilli Herba samples under negative ion mode.
3.2 Antirheumatic activity
3.2.1 General observation of AIA model mice
RA is an autoimmune chronic disease leading to joint deformities. The AIA model is the most extensively applied induction model in laboratory at present based on its ability to mimic the pathogenesis and immunological pathological mechanism of human RA up to a point (Sun et al., 2021). The protective effect of TH extract against adjuvant-induced arthritis was investigated by measuring BW, ankle joint diameter, serum inflammatory factor levels, and two immune organ indexes in mice to explore its potential pharmacological mechanism.
Within 24 h after the FCA injection, the mice started licking their red, swollen and inflamed paws. After a while, the skin on the surface of the paw was taut and glossy, along with obvious avoidance behavior after touch. Local inflammation of the joints (swelling of ankles and paws) and systemic symptoms (mental fatigue, decreased behavior, dull fur, visible swelling of other paws and erythema on the ears of part mice) could be observed after modeling.
The BW of mice was almost the same in the beginning. On day 8, the normal diet was compromised due to pain and swelling of the ankle joint. The intake of the remaining groups was significantly reduced, and the BW gain rate was lower than the control group. During the administration, the BW rose as TH and TGT could relieve arthritis and discomfort. The rate of BW gain in high and medium dose groups was elevated than that in low dose group in later stages. More details were displayed in Fig. 4A and Table S5, respectively.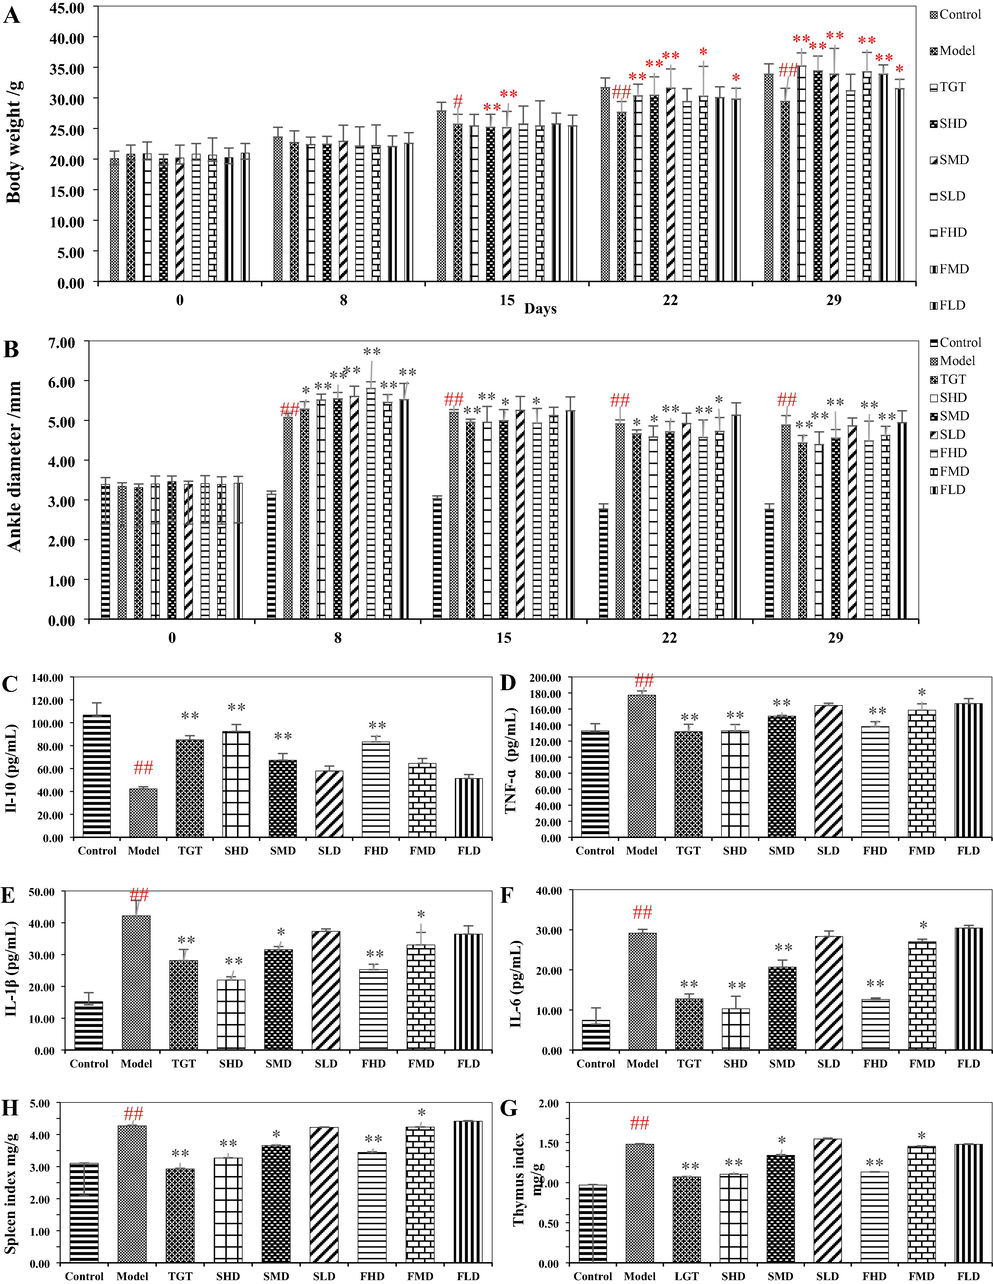
Influence of Taxilli Herba on body weight (A), ankle diameter (B), IL-10 (C), TNF-ɑ (D), IL-1β (E), IL-6 (F), thymus index (G) and spleen index (H) of AIA mice. Data are the mean ± SD (n = 10). #compared with control group (p < 0.05); ## compared with control group (p < 0.01); *compared with model group (p < 0.05); ** compared with model group (p < 0.01).
3.2.2 Effect of TH extract on paw swelling of AIA model mice
The degree of paw swelling is an extrinsic indicator for assessing the arthritis model measured before and after intragastric administration to evaluate the efficacy of TH extract. As can be seen from Fig. 4B, the left hind foot swelling got worse during modeling, with values up to 5.80 mm. Nevertheless, the symptoms were alleviated after treatment. Compared with the control group, paw swelling in the model group increased by approximately 70% on days 15, 22, and 29, revealing the successful establishment of the model. Compared with the model group, the swelling of the left hind foot in TGT and different dosing groups were all alleviated to varying degrees. In the last measurement, there was a significant improvement in the ankle joint diameter in the SHD and FHD groups, with values of 4.39 mm and 4.38 mm, respectively. Briefly, the effect was relatively more pronounced in high and medium doses (P < 0.05 or P < 0.01) and was substantially better than the low dose (Table S6). The results suggested that TH extract had protection against adjuvant arthritis and the efficacy increased with increasing extract concentration, indicating the existence of a dosage-effect relationship (Fan and Lv, 2020).
3.2.3 Effect of TH extract on serum levels of IL-10, TNF-ɑ, IL-1β, and IL-6
Abnormal levels of IL-10, TNF-ɑ, IL-1β, and IL-6 have been recognized as diagnostic indicators in the AIA model, and inflammatory responses caused by inflammatory cytokine intervention play an important role in RA. The secretion of IL-1β is increased after the onset of rheumatoid arthritis. It is a pro-inflammatory cytokine produced mainly by synovial macrophages and is central to the pathogenesis with levels correlating with disease activity. IL-6, as a major inflammatory mediator in RA, is an important factor causing joint destruction and inflammation which can induce the production and release of other cytokines such as IL-1 and TNF-α. TNF-α is a key factor in the production and persistence of synovitis in RA and can exacerbate the neutrophil inflammatory response, as well as play an important role in local synovial inflammation, pannus formation and tissue damage (Shu et al., 2019).
Compared with the control group, the serum levels of TNF-ɑ, IL-1β, and IL-6 were significantly increased in the model group. Compared with the model group, TH extracts showed significant inhibition of the above three cytokines in the serum, with maximum decreases of 26.06%, 47.82%, and 64.63%, respectively. The effect of high doses on IL-1 and IL-6 levels seemed to perform better than TGT, while there was practically no effect at low dose. IL-10 acts as an anti-inflammatory factor that blocks the production of IL-1β and TNF-α and antagonizes the development of RA, thus exhibiting a distinct-different outcome from the three aforementioned. In terms of the overall effect, the range of changes in the levels of inflammatory cytokines at low dose was not markedly, while TH at high dose had an effect nearly the same as TGT (Fig. 4C − F, Table S7 and Table S8) (Chi et al., 2014).
3.2.4 Effect of TH extract on immune organ indexes
Thymus and spleen are the central organs of the body for cellular and humoral immunity due to the abundant macrophages and lymphocytes they contain. Reactive hyperplasia occurs when the body is invaded by inflammation and tumors, etc. Changes in the weight of the thymus and spleen can reflect whether a drug has a regulatory or suppressive function on immunity, which are used to be important indicators of immune responses (Ma et al., 2020).
Compared with the control group, significant enlargement of the thymus and spleen could be observed in the model group. The situation improved after the administration and the immune response. Compared with the model group, the organ indexes of the TGT and high dose groups showed a significant decrease with the effect of the high dose slightly inferior to that of TGT. However, the effect was weaker at medium dose and nearly non-existent at low dose. The result (Fig. 4G − H and Table S7) demonstrated that TH could distinctly reduce thymus and spleen indexes that are elevated due to abnormally enhanced immune function and have a certain immune regulation effect.
3.3 Fingerprint-activity relationship modeling analysis
Bivariate correlation analysis and grey correlation analysis were used to determine the correlation between common characteristic peaks and efficacy, and to screen out efficacy-associated markers.
3.3.1 Grey correlation analysis
The correlation coefficient was calculated by taking the relative peak area of the common peaks of 20 batches of TH as the comparison sequence, and the paw swelling degree, four inflammatory cytokines and immune organ indexes as the reference sequence. The magnitude of the contribution of each common characteristic peak to the potency was determined based on the ranking of the relational degree (ri). ri quantitatively describes the consistency of the relative changes between the two in the development process, where ri greater than 0.6 indicates correlation while ri greater than 0.8 indicates high correlation (Liu et al., 2020).
The result of GCA showed that ri ranged from 0.404 to 0.987 (Table 2). The ri between all common peaks and paw edema and four inflammatory cytokines were greater than 0.8, showing a high correlation. F11 ranked first in the correlation ranking with both immune organ indexes. In conclusion, the top seven compounds with large relational degree values for each indicator were selected, which were the corresponding constituents of F11, F13, F6, F4, F7, F10, and F5.
Order
paw edema
IL-10
TNF-ɑ
IL-1β
IL-6
thymus index
spleen index
Peak
No.
ri
Peak
No.
ri
Peak
No.
ri
Peak
No.
ri
Peak
No.
ri
Peak
No.
ri
Peak
No.
ri
1
F11
0.9860
F11
0.9665
F11
0.9866
F11
0.9540
F11
0.9333
F11
0.9495
F11
0.9713
2
F13
0.9358
F13
0.9644
F13
0.9819
F13
0.9416
F13
0.9173
F13
0.6919
F13
0.9074
3
F6
0.8907
F6
0.9621
F6
0.9765
F6
0.9282
F6
0.9004
F6
0.5103
F6
0.8456
4
F4
0.8799
F4
0.9615
F4
0.9753
F4
0.9250
F4
0.8964
F4
0.4810
F4
0.8319
5
F7
0.8663
F7
0.9608
F7
0.9739
F7
0.9214
F7
0.8914
F7
0.4484
F7
0.8148
6
F10
0.8633
F10
0.9607
F10
0.9733
F10
0.9200
F10
0.8901
F10
0.4413
F10
0.8110
7
F5
0.8574
F5
0.9604
F5
0.9719
F5
0.9174
F5
0.8876
F5
0.4286
F5
0.8036
8
F8
0.8524
F8
0.9601
F9
0.9716
F8
0.9161
F8
0.8857
F8
0.4180
F8
0.7974
9
F1
0.8516
F1
0.9600
F8
0.9715
F9
0.9160
F1
0.8855
F1
0.4165
F1
0.7964
10
F9
0.8513
F12
0.9600
F1
0.9715
F1
0.9160
F9
0.8854
F9
0.4158
F9
0.7960
11
F12
0.8508
F9
0.9600
F2
0.9714
F2
0.9153
F12
0.8848
F12
0.4152
F12
0.7952
12
F2
0.8476
F2
0.9598
F3
0.9709
F12
0.9149
F2
0.8841
F2
0.4086
F2
0.7916
13
F3
0.8453
F3
0.9597
F12
0.9708
F3
0.9142
F3
0.8831
F3
0.4040
F3
0.7887
3.3.2 Bivariate correlation analysis
BCA describes the correlation between two variables which can be reflected by the value of the correlation coefficient. It can take values between −1 and +1, where 0 means no linear correlation and +1 (−1) means total positive (negative) linear correlation. (Zhang et al., 2014). In this paper, the common peak area of thirteen peaks and the results of pharmacodynamics indexes were imported into SPSS 21.0, and then bivariate correlation analysis was selected to perform Person analysis.
As shown in Table 3, F4 and F7 were significantly negatively correlated with TNF-ɑ. F2 has significantly negative correlation with IL-6; The same was true for F5 and F8 for spleen index. F2 was significantly positively correlated with IL-10. The results showed that the increase of the content of these constituents represented by the chromatographic peaks promoted the decrease of the content of pro-inflammatory factors and the increase in the content of anti-inflammatory factors. This indicated that the inflammatory response was significantly inhibited, and the constituents corresponding to the peaks were the main active ingredients that exerted anti-inflammatory effects. F12 was significantly negatively correlated with IL-10, and significantly positively correlated with IL-1β. It indicated that the changes of IL-1β content were consistent with the changes of corresponding constituents of F12, while the changes of IL-10 content were opposite, which promoted the occurrence of inflammatory response, which promotes the occurrence of inflammatory response. To sum up, five peaks (F2, F4, F5, F7, and F8) were screened out.
Peak No.
Pearson correlation coefficient (r)
paw edema
IL-10
TNF-ɑ
IL-1β
IL-6
thymus index
spleen index
F1
0.528
−0.579
0.586
0.588
0.110
0.693
−0.273
F2
−0.436
0.714*
−0.371
−0.560
−0.751*
−0.357
−0.384
F3
−0.463
0.428
−0.681
−0.566
−0.169
−0.610
−0.198
F4
−0.298
0.118
−0.736*
−0.322
0.042
−0.260
−0.452
F5
0.362
−0.454
−0.104
0.055
0.344
0.628
−0.739*
F6
−0.268
0.232
−0.547
−0.483
−0.110
−0.083
−0.596
F7
−0.519
0.349
−0.795*
−0.439
−0.057
−0.673
−0.092
F8
0.104
−0.374
−0.408
0.013
0.334
0.364
−0.722*
F9
−0.084
−0.298
−0.612
−0.090
0.415
0.027
−0.533
F10
−0.231
0.188
−0.610
−0.422
−0.055
−0.170
−0.523
F11
−0.021
0.371
−0.473
−0.124
−0.390
−0.437
−0.081
F12
0.507
−0.851**
0.274
0.777*
0.517
0.702
−0.221
F13
0.144
0.177
−0.252
−0.445
−0.134
0.043
−0.569
3.3.3 Identification of efficacy-associated markers
Based on GCA and BCA results, nine markers (F2, F4, F5, F6, F7, F8, F10, F11, and F13) were found to be related to anti-arthritis effect. Five of the constituents were identified by comparison with the retention time and characteristic fragment ions of standards, including isosakuranetin, (+)-Catechin, isoquercitrin, hyperoside and quercitrin. Other three constituents, including glucogallin, kaempferitrin, and procyanidin B2, were speculated based on databases and related literature, and a constituent could not be speculated. The efficacy of TH in dispelling rheumatism was the result of the synergistic effect of multiple ingredients. Seven of the nine markers were flavonoids, so it was presumed that flavonoids were the main material basis of efficacy. At the same time, it has been proved that procyanidin B2 (Ding et al., 2012; Liu et al., 2007), catechin (Su, 2018), kaempferitrin (Wang and Zhao, 2019), hyperoside (Jin et al., 2021), quercetin (Li et al., 2018), and isoquercitrin (Xing et al., 2020; Xu et al., 2016) have certain anti-inflammatory activities.
3.4 Quantitative analysis of 5 identified constituents in TH
3.4.1 Optimization of sample preparation
Three factors such as methanol concentration (60%, 70%, 80%, and 90% v/v), sample-solvent ratio (1:10, 1:20, 1:30, 1:40, 1:50, and 1:60 w/v) and ultrasonic time (20, 30, 40, 50, 60, and 70 min) were investigated by single variable investigation. The optimum sample extraction condition was achieved by using 15 times of 70% v/v methanol for 32 min. All of the samples were extracted at room temperature.
3.4.2 Optimization of HPLC-QTRAP-MS/MS conditions
To obtain the optimum elution conditions, various HPLC parameters including mobile phases (water − methanol, water − alcohol, water − acetonitrile, 0.1% formic acid aqueous − methanol), column temperature (25, 30, and 35 °C) and flow rate (0.3, 0.5, and 0.8 mL/min) were investigated. Finally, the optimum HPLC conditions were obtained when the mobile phase consisted of 0.1% formic acid aqueous − methanol, column temperature was 30 °C and flow rate was 0.5 mL/min. MS conditions were studied in negative mode. Five constituents were found to have better sensitivity and intensity in the negative ion mode.
3.4.3 Method validation
Table S5 listed the results of linear equations, linear correlation coefficients (r) of 5 constituents which exhibited good linearity (r2 > 0.999 0) within the tested range. Results of the LOD and LOQ were also summarized in Table S9. As for the precision (Table S10), the RSDs of intra-day and inter-day variations of 5 constituents were all less than 4.0%. The results (Table S10) indicated that the method had a good repeatability (RSD: 1.65%−3.65%) and stability (RSD: 1.37%−4.58%). The overall recoveries (Table S10) lay between 98.03% and 100.86% with RSD between 1.42% and 2.78%.
3.4.4 Quantitative analysis of sample
The developed HPLC-QTRAP-MS/MS method was subsequently applied to the quality evaluation of TH samples from two hosts. According to the quantitative results (Fig. 5 and Table S11) of isosakuranetin, (+)-Catechin, isoquercitrin, hyperoside and quercitrin, it was found that the content of five constituents in TH from Morus alba L. were higher than those of TH from Liquidambar formosana Hance. The result to some extent reasonably explained the superiority of the former in dispelling rheumatism over the latter and reflected the quality of TH from two hosts as well.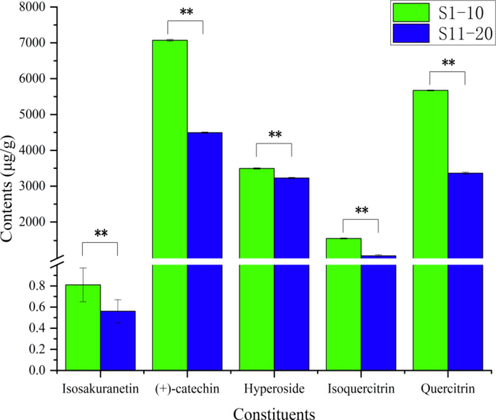
Content of 5 constituents in samples. (*, p < 0.05, **, p < 0.01).
3.5 Multivariate statistical analysis
3.5.1 PCA of samples
PCA was performed to classify TH samples from two hosts based on the content of 5 constituents. The first two principal components accounted for more than 90%, which could be used to represent the overall information of the samples (R2X [1] = 0.893, R2X [2] = 0.104). As shown in Fig. 6, the PCA score plot indicated that TH samples from two hosts were separated into two groups. Samples from Liquidambar formosana Hance were gathered in the negative axis of t[1], while samples from Morus alba L. were gathered in the positive axis t[1]. It was obvious that there was a significant difference between the TH samples from the two hosts with respect to 5 measured constituents.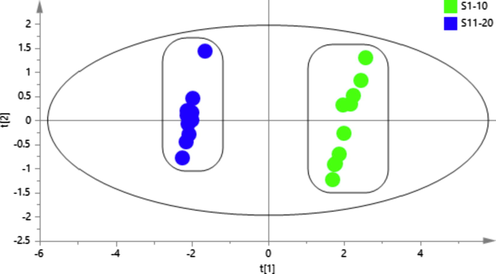
PCA score scatter plot for the classification of TH samples from two hosts based on the content of 5 constituents.
3.5.2 TOPSIS analysis of samples
As shown in Table 4, the Ci values of samples from Morus alba L. were all greater than those of samples from Liquidambar formosana Hance, and the overall ranking was in the top 10, indicating that the comprehensive quality of the former was higher than that of the latter in terms of these 5 constituents.
Samples
Di+
Di−
Ci
Ranking of Ci
Samples
Di+
Di−
Ci
Ranking of Ci
S1
0.139
0.190
0.579
9
S11
0.239
0.051
0.175
16
S2
0.051
0.237
0.824
3
S12
0.190
0.136
0.416
11
S3
0.004
0.276
0.987
1
S13
0.251
0.032
0.113
18
S4
0.139
0.191
0.579
8
S14
0.276
0.005
0.017
20
S5
0.158
0.183
0.537
10
S15
0.222
0.076
0.254
12
S6
0.098
0.209
0.681
6
S16
0.234
0.057
0.196
13
S7
0.060
0.230
0.793
4
S17
0.243
0.042
0.147
17
S8
0.028
0.255
0.900
2
S18
0.257
0.025
0.088
19
S9
0.126
0.195
0.607
7
S19
0.235
0.057
0.194
14
S10
0.067
0.227
0.773
5
S20
0.238
0.051
0.176
15
4 Conclusion
In this study, fingerprint-activity relationship modeling and multivariate statistical analysis were used to perform a quality evaluation of TH from two hosts. Firstly, HPLC-Triple TOF-MS/MS fingerprints were established, and the samples from two hosts were consistent in terms of major constituents. Then, the protective effect of TH against adjuvant-induced arthritis in mice was achieved by alleviating paw edema, decreasing serum levels of TNF-ɑ, IL-1β, and IL-6, increasing IL-10 level, and decreasing immune organ indexes. Nine markers with a high correlation with activity were screened out by GCA and BCA analysis of fingerprint-activity relationship modeling. Secondly, the mean content of 5 identified constituents determined by HPLC-QTRAP-MS/MS in TH sample from Morus alba L. was higher than those in samples from Liquidambar formosana Hance. Finally, PCA and TOPSIS were applied to evaluate the quality of TH. According to the results, the abundant flavonoids might be responsible for the protective effect against arthritis in mice and the therapeutic effect of TH from Morus alba L. was superior to that of TH from Liquidambar formosana Hance at the same high dose. The results of the statistical analysis also illuminated that samples from two hosts were significantly different and the comprehensive quality of the former was better than the latter. This strategy could serve as a useful reference for the discovery of bioactive markers, quality evaluation and future exploitation of TH.
CRediT authorship contribution statement
Jia-huan Yuan: Conceptualization, Methodology, Formal analysis, Investigation, Data curation, Writing – original draft. Zhi-chen Cai: Conceptualization, Formal analysis, Writing – review & editing. Cui-hua Chen: Methodology, Data curation. Nan Wu: Methodology, Formal analysis. Sheng-xin Yin: Methodology. Wen-xin Wang: Methodology. Hai-jie Chen: Methodology. Yong-yi Zhou: Methodology. Li Li: Resources. Xun-hong Liu: Conceptualization, Writing – review & editing, Supervision.
Acknowledgement
This work was supported by Guangxi Key Laboratory of Zhuang and Yao Ethnic Medicine [grant number GXZYKF2020-2].
Declaration of Competing Interest
The authors declare that they have no known competing financial interests or personal relationships that could have appeared to influence the work reported in this paper.
References
- Determination of properties and composition in Loranthaceae before and after processing. Res. Pract. Chin. Med.. 2019;33(001):16-19.
- [CrossRef] [Google Scholar]
- Research progress of drugs commonly used to anti-rheumatoid arthritis. China J. Chin. Mater. Med.. 2014;39(15):2851-2858.
- [CrossRef] [Google Scholar]
- Chinese Pharmacopoeia Commission, 2020. National Pharmacopoeia Committee. Pharmacopoeia of the People’s Republic of China. Part I; Chemical Industry Press, Beijing, p. 312.
- Effect of procyanidin dimer B2 on NF-κB nucleus transfer and expression of inflammatory cytokines in rat synovial cells. Chin. Pharmacol. Bull.. 2012;28(06):803-806.
- [CrossRef] [Google Scholar]
- Fan, W., Lv, L., 2020. Effect of Danggui Sini decoction on flammatory factor expression and TLR4/NF-kB signaling pathway in rats with rheumatoid arthritis. 32 (08), 1478–1482. http://doi.org/10.16448/j.cjtcm.2020.0820.
- Study on the Anti-rheumatism effective chemicals and meridian tropism of thr total flavonoids of Herba Taxill. HeNan, China: Henan University of Chinese Medicine; 2017. Thesis
- Effect of different medicinal hosts on the total flavonoid content of Taxilli Herba. J. Guangxi. Uni. Chin. Med.. 2017;20(03):34-36.
- [CrossRef] [Google Scholar]
- Therapeutic effect of hyperoside on mice with collagen-induced arthritis. J. Pract. Med.. 2021;37(17):2199-2203.
- [CrossRef] [Google Scholar]
- Antirheumatic substance and meridian tropism of Loranthus parasiticus based on ‘syndrome-efficacy-analysis of biological samples’. China J. Chin. Mater. Med.. 2016;41(10):1933-1939.
- [CrossRef] [Google Scholar]
- Li, L., Guan, J., Feng, J., Ma, K., Cui, Y., 2018. Study on the anti-rheumatism effective substances and meridian tropism of the total flavonoids of Taxillus chinensis (DC.) based on ‘syndrome-efficacy-analysis of biological samples’. China J. Tradit. Chin. Med. Pharm. 33 (05), 2203–2208. http://doi.org/CNKI:SUN:BXYY.0.2018-05-109.
- Lin, J., Zhou, Y., Xu, Z., He, X., Chen, G., Chen, Y., Zhao, Z., He, Y., 2017. Effects of Shudi jisheng Zhuanggu Decoction in anti-inflammatory and morphology of articular cartilage of knee post-traumatic osteoarthritis model rats. Chin. J. Basic Med. Tradit. Chin. Med. 23 (03), 411–414. http://doi.org/CNKI:SUN:ZYJC.0.2017-03-043.
- Study on spectrum-effect relationship of anti-inflammatory effect of different polar parts of Ampelopsis grossedentata in mice based on grey relational analysis. China. Pharm.. 2020;31(19):2382-2386.
- [CrossRef] [Google Scholar]
- Liu, G., M.D., 2007. Study on the therapeutic effect of proanthocyanidins on CIA rats. Guangdong Medical University. Guangdong, China.
- Lu, S., Gan, Y., Tang, L., Zhang, F., Su, B., 2020. Evaluation of the Quality of Taxillus chiueusis from Different Hosts Sources by HPLC Fingerprint Combined with Chemometrics. China Pharm. 31 (07), 794–799. http://doi.org/CNKI:SUN:ZGYA.0.2020-07-006.
- Ma, L.,Yu, D., Wu, J., Du, X., 2020. The action mechanism of traditional Chinese medicine and its active ingredients in treatment of rheumatoids arthritis. 42 (18), 2832–2841. http://doi.org/10.3969/j.issn.1002-7386.2020.18.026.
- Qualitative and quantitative analysis of the major constituents in Spatholobi Caulis by UFLC-Triple TOF-MS/MS and UFLC-QTRAP-MS/MS. J. Pharm. Biomed. Anal.. 2021;194:113803-1113014.
- [CrossRef] [Google Scholar]
- Research progress of combined rheumatoid factor ANCA, IL-1, IL-6, TNF-αdetection in diagnosing rheumatoid arthritis. Int. J. Lab. Med.. 2019;40(4):448-452.
- [CrossRef] [Google Scholar]
- Advances in studies on Taxilli Herba based on host differences. Lishizhen Med. Mater. Med. Res.. 2016;27(07):1716-1719.
- [CrossRef] [Google Scholar]
- Research progress on animal model of rheumatoid arthritis combined with disease and syndrome. J. Trad. Chin. Orth. Traum.. 2021;40(06):464-468.
- [CrossRef] [Google Scholar]
- Determination of multiple bioactive constituents in Ophiopogonis Radix processed by different methods and multivariate statistical analysis. Chin. J. Pharm. Anal.. 2019;39(06):992-1002.
- [CrossRef] [Google Scholar]
- The research of effective chemicals of Taxillus chinensis Danser and channel tropism based on disease-effect-bioanalysis. HeNan, China: Henan University of Chinese Medicine; 2015. Thesis
- From chemical consistency to effective consistency in precise quality discrimination of Sophora flower-bud and Sophora flower: Discovering efficacy-associated markers by fingerprint-activity relationship modeling. J. Pharm. Biomed. Anal.. 2017;132:7-16.
- [CrossRef] [Google Scholar]
- Su, J., Ph.D., 2018. Study of materials basis and mechanism of Ertengtongbi mixture based on anti rheumatoid arthritis. Nanjing University of Chinese Medicine. Nanjing, China.
- Wang, H., Guan, J., Feng, J., Niu, Y., Wang, X., Cui, Y., 2018. Effect of Total Flavonoids of Herba Taxilli on Adjuvant Arthritis in Rats. World Chin. Med. 13 (4), 799–802+807. http://doi.org/10.3969/j.issn.1673-7202.2018.04.004.
- Kaempferitrin inhibits proliferation, induces apoptosis, and ameliorates inflammation in human rheumatoid arthritis fibroblast-like synoviocytes. Phytother Res.. 2019;33(6):1726-1735.
- [CrossRef] [Google Scholar]
- Quality Evaluation of Taxilli Herba from Different Hosts Based on Simultaneous Determination of Multiple Bioactive Constituents Combined with Multivariate Statistical Analysis. Molecules.. 2021;26(24):7490-7505.
- [CrossRef] [Google Scholar]
- Isolation and identification of anti-inflammatory constituents from Houttuynia cordata. J. China Pharm. Univ.. 2016;47(03):294-298.
- [CrossRef] [Google Scholar]
- Xing, Q., Zhen, L., Gan, T., Xiao, T., Deng, Z., 2020. Anti-inflammatory effect and mechanism of major components in Tetrastigma hemsleyanum Diels et Gilg. Food Mach. 36 (05), 45–53+110 http://doi.org/10.13652/j.issn.1003-5788.2020.05.009.
- Qualitative Analysis and Componential Differences of Chemical Constituents in Taxilli Herba from Different Hosts by UFLC-Triple TOF-MS/MS. Molecules.. 2021;26(21):6373-6397.
- [CrossRef] [Google Scholar]
- Application comparison of grey correlation degree and pearson correlation coefficient. J Chifeng Univ.. 2014;20(21):1-2.
- [CrossRef] [Google Scholar]
Appendix A
Supplementary material
Supplementary data to this article can be found online at https://doi.org/10.1016/j.arabjc.2022.103933.
Appendix A
Supplementary material
The following are the Supplementary data to this article:Supplementary data 1
Supplementary data 1


