

Translate this page into:
Acid assisted-hydrothermal carbonization of solid waste from essential oils industry: Optimization using I-optimal experimental design and removal dye application
⁎Corresponding author. Faical.elouadrhiri@usmba.ac.ma (Faiçal El Ouadrhiri)
-
Received: ,
Accepted: ,
This article was originally published by Elsevier and was migrated to Scientific Scholar after the change of Publisher.
Peer review under responsibility of King Saud University.
Abstract
Solid waste (SW) generated from extracting of essential oils from medicinal and aromatic plants (MAPs) is an abundant and renewable resource, but proper recycling is necessary to prevent negative environmental impacts from improper disposal. This study focused on converting SW from essential oil (EO) extraction industry by citric acid-catalyzed hydrothermal carbonization (c-HTC) coupled with chemical activation into a carbonaceous material to remove organic pollutants. For this purpose, an I-optimal design coupled with response surface methodology (RSM) was developed to investigate the relationship between the severity factor (SF) of the c-HTC process and citric acid dose (HTCcat) on carbon retention rate (CRR) and hydrochar mass yield (MY). Under optimal conditions (5.32 and 2 g for SF and HTCcat, respectively), an optimized hydrochar (HCop) was characterized by a CRR and MY of 71.02% and 56.14%, respectively. HCop was chemically activated by KOH solution (AHCop) and characterized by a specific surface area of 989.81 m2.g−1, a pore volume of 0.583 cm3.g−1, a higher heating value (HHV) of 37.3 MJ/Kg, oxygenated surface functions such as –OH, –COOH, C-O and a methylene blue (MB) removal rate of 90.71%. In addition, modelling of the adsorption isotherms found that the Freundlich isotherm better describes the experimental data, and the second-order model regulates the adsorption kinetics well. Furthermore, The maximum adsorption capacity of AHCop was 588.24 mg.g−1, with a separation factor of 0.625 under the operating conditions (t = 6 h, T = 25 °C, m(AHCop) = 0.2 g, [MB]0 = 300 mg.L-1, and pH = 7), indicating its potential for effectively removing organic pollutants. Together, these results provide crucial information on using c-HTC to convert waste biomass into functional carbon materials to remove organic pollutants efficiently. Therefore, several studies must be conducted out to discover other application fields of this material.
Keywords
Solid waste essential oil extraction industry
Catalytic Hydrothermal carbonization
I-optimal Design
Response surface methodology
Dye Adsorption

- SW
-
Solid Waste
- EO
-
Essential Oil
- MAPs
-
Medicinal and Aromatic Plants
- c-HTC
-
Citric acid-catalyzed Hydrothermal Carbonization
- SF
-
Severity Factor
- HTCcat
-
Citric acid dose
- RSM
-
Response Surface Methodology
- HHV
-
Higher Heating Value
- HCop
-
optimized hydrochar
- AHCop
-
KOH Activated optimized hydrochar
- MB
-
Methylene Blue
- LIC
-
lithium-ion capacitor
- MY
-
Mass yield
- CRR
-
Carbon Retention Rate
- DoE
-
Design Of Experiment
- ANOVA
-
Analysis of variance
- R2
-
coefficient of determination
- PSD
-
pore size distribution
- Dp
-
average diameter pores size
- BJH
-
Barrett-Joyner-Halenda
- FTIR
-
Fourier Transform Infrared Spectroscopy
- SEM
-
scanning electron microscopy
- XRD
-
X-ray diffraction
- phpzc
-
point of zero charges
- IPD
-
intra-particle diffusion model
- PSO
-
pseudo-second-order model
- PFO
-
Pseudo-first-order model
Abbreviations
Data Availability Statement:
Not applicable.
1 Introduction
As the second-richest country in endemic biodiversity in the Mediterranean basin, Morocco has an outstanding floral heritage with more than 4,200 species of plants. With nearly 800 endemic species and 600 species classified as medicinal and aromatic plants (MAPs), Morocco produces approximately 140,000 tons of these plants annually. These plants are the subject of increasing attention due to their use in various areas, including traditional medicine, cosmetics, food preservation, and the extraction of essential oils (EOs) (Ajjoun et al., 2022). The main export products are carob, rosemary, thyme, argan oil, essential oils, and roses. Despite the development of different methods for extracting EOs from MAPs, the ratio between the quantity of EOs produced and the quantity of MAPs processed is very low (mass yield), resulting in significant quantities of extraction by-products (solid waste (SW)) that must be managed. According to (Santana-Méridas et al., 2012), the extraction of 1 kg of EOs from MAPs is estimated to generate 100 kg of solid residue. So, if only in Morocco the production of essential oils reaches 5.000 tons of EOs, mainly destined for Europe and America, it implies the generation of more than 500.000 t/year of solid waste.
Regardless of the method used, the solid residues from extracting EOs are considered waste that must be disposed of directly. However, these residues can be considered valuable raw materials for other waste valorization processes and converted into high-value-added biobased products. In this sense, (Saha and Basak, 2020) reported the different possible routes of valorizing solid biomass residue from the industrial use of MAPs. For example, SW can be used directly as battle feed after the extraction of phytochemicals. However, all these routes seem to be brilliant and promising, but they do not allow for to reduce in the residual biomass volume significantly (Chavan et al., 2018). In addition, the use of solid waste as bio-adsorbent (Agarwal et al., 2020); bio-fuel (Grifoni et al., 2021), soil amendment (Das et al., 2022) or other uses (Slavov et al., 2017) has also been studied.
Generally, the valorization of these solid residues through conventional thermochemical routes such as pyrolysis, gasification, or others poses two major problems: (i) energy efficiency (the need to dry the solid waste before proceeding to pyrolysis) and (ii) environmental impact (the release of greenhouse gases). To overcome these two problems, hydrothermal carbonization (HTC) has emerged as a clean, efficient and low-energy technique for converting solid waste into bio-based carbon materials (El Ouadrhiri et al., 2021; Pavlovič et al., 2013; Titirici and Antonietti, 2010; De et al., 2015; Jain et al., 2016). The HTC technique allows the conversion of any type of biomass or waste (dry and wet) under the effect of temperature [180 °C − 250 °C] and vapour saturation pressure in a closed reactor (Okolie, et al., 2022). Despite the many potential benefits of HTC process, its widespread adoption still has significant challenges and limitations, including the need for further research and development to optimize the process and improve its efficiency and cost-effectiveness. It should be noted that several factors can influence the quality of the HTC solid product, namely hydrochar (HC) (Akkaya Sayğılı and Sayğılı, 2022). However, temperature and reaction time are the most important factors (Nizamuddin, 2017). Most recently, (Li, 2022) prepared a hydrochar from Lavandula straw using the HTC process. Therefore, the authors reported that the optimal condition to obtain a usable hydrochar as combustible was with a severity factor (SF) of 6 with a high importance for the temperature compared to the reaction time.
On the other hand, it is advantageous to use a catalyst in the hydrothermal reaction to improve the HC’s physicochemical properties and make the process more profitable (MacDermid-Watts et al., 2020). For example, (Susanti et al., 2019) reported the production of an activated carbon via citric acid-catalyzed HTC (c-HTC) followed by chemical activation by KOH. The resulting activated carbon showed higher specific capacity in the lithium-ion capacitor (LIC) and long-term stability. In addition, (Zhang, 2021) reported the viability of HTC catalyzed by hydrochloric acid and nitric acid for the fabrication of functional microporous hydrochar from Bamboo residues. (Hsini et al., 2020) directly used the solid waste from the extraction of EOs from the Dittrichia plant as a bio-adsorbent for the removal of Cadmium.
Generally, several wastes and biomasses have been converted into carbonaceous material via c-HTC (Zhang, 2021; Ghaziaskar et al., 2019)– (Xue, 2012; Evcil et al., 2020). However, to the best of our knowledge, no study has been conducted on the valorization of SW from the EOs industry via the c-HTC process. Using SW from the EOs industry to dispose of wastewater pollution after c-HTC treatment could be the best valorization strategy from an economic and environmental perspective.
This study examined the potential to produce a new carbonaceous material using solid waste from the extraction of rosemary (Rosmarinus officinalis) plant through the c-HTC process, and its effectiveness in removing organic pollutants from water. Specifically, we investigated: (i) using Response Surface Methodology (RSM), this study aims to develop an optimal experimental design to optimize the mass yield (MY) and carbon retention rate (CRR) in hydrochar production through the c-HTC process and to evaluate the impact and presence of interaction between the studied parameters. (ii) The optimized hydrochar was activated through the potassium hydroxide (KOH) impregnation method, and the resulting optimized, and activated hydrochar (AHCop) was characterized. (iii) Assessment of the capacity of AHCop in the adsorption of organic pollutants in wastewater.
The use of solid waste as feedstock for producing of carbonaceous materials has the potential to address environmental issues such as waste management and pollution control. By converting waste into valuable materials through processes like c-HTC and chemical activation, we can address these issues and contribute to developing sustainable and efficient technologies for wastewater treatment.
2 Materials and methods
2.1 Precursor preparation
Solid residues were obtained from extracting EOs from rosemary chosen in this study as carbon precursor. First, the SWs were washed with distilled water (DW), ground in a GM200 mill (Retsch, GmbH, Germany), and sieved to a particle size fraction of 500 μm < d < 250 μm (60–35 mesh) for better decomposition in the c-HTC process, and finally stored in a desiccator for further use.
2.2 Hydrochar and activated hydrochar synthesis
The catalyzed hydrothermal carbonization of SW was carried out in a 100 mL polypropylene-lined (PPL) autoclave. First, 2 g of the SW powder was introduced into the Teflon autoclave with 60 mL of distilled water. Then, according to the experimental design below, citric acid (C6H8O7) was added to the mixture as a catalyst for the hydrothermal reaction. Finally, the autoclave was well sealed and heated in an oven at a temperature and time represented by the severity factor. The heating rate was constant (5 °C/min) during the c-HTC process. After natural autoclave cooling, the hydrochar was recovered by centrifugation, washed several times with distilled water and dried in the oven overnight. The optimized hydrochar selected using the above experimental design is named HCop. Furthermore, the obtained HCop was chemically activated by KOH (2 M) solution at 700 °C according to the procedure reported in our recent work (El Ouadrhiri et al., 2021). The activated hydrochar is named AHCop.
2.3 Optimal design of experimental
A design of experiment (DoE) is a systematic and scientific approach to evaluating the impact of one or more variables on a specific outcome. The experimental design involves carefully planning and organizing the various elements, including the independent and dependent variables, control conditions, sample size, data collection and analysis methods (Weissman and Anderson, 2015; Ghaedi, 2018). The goal of a DoE is to carefully control and manipulate variables to identify the underlying causes of a specific outcome and optimize processes or products (Antoy, 2014). However, classical DoE does not always address certain issues, such as the need to work with various factors types (Smucker et al., 2018).
The optimal design of experiments is an appropriate tool in practically all situations that suggest the possible use of a flexible experimental design (Goos and Jones, 2011). In fact, rigorous experimental design is required to increase the chances of success in an investigation (Smucker et al., 2018). In general, optimum designs have a flexible structure that allows them to adapt to the limitations imposed by the kind of component and the irregular experimental domain (Pukelsheim, 2006). Moreover, the optimal design with the I-criterion, also called the I-optimal design, differs from other optimal designs by its ability to give a minor average prediction variance and better estimate the effects of the factors (Ke, 2005). Importantly, I-optimality is preferred over other optimization strategies for response surface methodology (RSM) when making a critical prediction (Anderson and Whitcomb, 2014).
In this study, we examined the effect of temperature (HTCT) and reaction time (HTCt) combined and catalyst dose (HTCCat) on two responses, MY and CRR. Meanwhile, the severity factor (SF), as calculated using Eq. (1) (Heidari et al., 2019), was introduced to simplify the effect of temperature and reaction time during c-HTC, thus reducing the number of experiments.
The mathematical equation in Eq. (2) that describes the relationship between the factors (Xi) and responses (Yi) is a quadratic polynomial, where βi, βij, and βii represent the coefficients for the linear effect, interaction effect, and quadratic effect, respectively, and
represents the error (Goos and Jones, 2011). Using the Design Expert software, an I-optimal design was created with ten experiments.
Table 1 displays the range of values for the two factors, SF (X1) and HTCCat (X2), in the experiment. However, the SF factor has six levels, calculated to include the effects of HTCT and HTCt separately, as shown in Table S1. Additionally, the c-HTC experiments were conducted randomly to mitigate any potential randomized hidden effects. Table 2 presents the experimental matrix of the I-optimal design, along with the measured and predicted results for each response. Analysis of variance (ANOVA), lack of fit test and coefficient of determination (R2), as well as graphical inspection, were used to assess the fit and accuracy of the MY and CRR models (Yusop et al., 2021).
Factor
Name
Type
SubType
Coded Low
Coded High
Mean
Std. Dev.
X1
HTCCat (g)
Numeric
Discrete
−1 ↔ 2.00
+1 ↔ 6.00
4.00
1.63
X2
SF
Numeric
Discrete
−1 ↔ 4.61
+1 ↔ 5.62
5.06
0.2844
Run
Variables
Responses
X1:
X2:
MY(%)
CRR(%)
Natural
Coded
Natural
Coded
Experimental
Predicted
Experimental
Predicted
1
5.32
0.406
2
−1.000
56.57
57.46
69.15
68.89
2
5.05
−0.129
4
0.000
54.87
55.41
67.79
68.11
3
5.05
−0.129
4
0.000
55.79
55.41
68.20
68.11
4
5.32
0.406
6
1.000
48.55
48.76
73.03
72.59
5
5.49
0.743
4
0.000
48.30
47.70
69.65
70.00
6
5.05
−0.129
6
1.000
51.68
51.63
72.02
72.55
7
5.01
−0.208
2
−1.000
65.93
64.68
65.38
65.65
8
4.61
−1.000
2
−1.000
72.80
73.16
59.94
59.94
9
5.05
−0.129
4
0.000
54.98
55.41
68.70
68.11
10
4.61
−1.000
6
1.000
55.55
55.38
70.89
70.80
In this study, the numerical optimization algorithm was chosen among the various optimization methods because it allows for weight modification and prioritization of the factors and responses (Nocedal and Wright, 2006).
2.4 Characterization of the synthesized materials
Nitrogen physisorption isotherms at 77.35 K were used to investigate the textural characteristics of the HCop and AHCop using an ASAP 2020 manometric analyzer (Micromeritics, USA) (Micromeritics, USA). The specific surface area was calculated by the Brunauer-Emmett-Teller (BET) method in the relative pressure range of 0.05–0.35, and the total pore volume (Vp) was obtained from the amount of nitrogen absorbed at P/P0 ≈ 0.99. The micropore volume (Vmicro) was calculated using the t-plot method for the carbon-based materials(ASTM D6556-19) and the mesoporous volume (Vmeso) was deduced by subtraction. In addition, the pore size distribution (PSD) was determined by the Barrett-Joyner-Halenda (BJH) method (Barrett et al., 1951). The average diameter pores size (Dp) was calculated by assimilating them to a cylindrical shape (Klobes et al., 2006). Fourier Transform Infrared Spectroscopy (FT-IR) was used to identify the functional group of the samples using (Bruker Tensor 27). The morphology of the prepared hydrochars was observed by SEM analysis (scanning electron microscopy) using the JEOL JSM-IT500 InTouch Scope at an accelerating voltage of 16 kV. Crystal phase identification (position and intensity of the diffracted lines) was performed by X-ray diffraction (XRD) using an X-ray diffractometer (PANalytical X’Pert Pro) equipped with Cu-Kα radiation (1.54 Å). The samples’ point of zero charges (pHpzc) was determined by the pH-drift method, as described in our recent work (El Ouadrhiri et al., 2021).
Carbon (C), hydrogen (H), nitrogen (N), and sulfur (S) elements were all analyzed using an elemental analyzer (2400 CHN Elemental Analyzer, Perkin-Elmer, France), and oxygen content was determined by subtracting. Indeed, The higher heat value (HHV) was predicted using the unified model for the torrefied biomass in Eq. (3) reported by (Nhuchhen and Afzal, 2017).
In this study, the two responses of interest, MY(%) and CRR(%) were introduced to understand the mass and carbon profiles that occur during the c-HTC process. MY (%) was calculated using Eq. (4) as reported by (Rodríguez Correa et al., 2018). Therefore, CRR(%) is defined as the ratio of the carbon percentage in the feedstock to the hydrochar (Afolabi et al., 2020) and calculated using Eq. (5).
2.5 Adsorption study
Using a UV–visible spectrophotometer, we investigated adsorption capability in the absorption of MB (a basic dye) onto the synthesized samples. For this purpose, 5 mL of the solution was accurately taken at predefined time intervals (15 min), filtered through a membrane filter (0.45 μm), and recorded their absorbance spectrum. The elimination efficiency was calculated using Eq. (6) or the measurement of the concentration as a function of time using Eq. (7), allowing the determination of the adsorbed quantity (Qt). NaOH (0.1 M) and HCI (0.1 M) solutions were used to adjust the pH of the solution. However, the experimental results were interpreted using the Langmuir and Freundlich isotherms, and the adsorption kinetics of the pollutants by the prepared carbonaceous materials was studied by the Pseudo-first-order (PSO), pseudo-second-order model (PSO) models and the intra-particle diffusion (IPD) model grouped in Table S2.
3 Results and discussion
3.1 Optimal design of c-HTC process
Generally, the operating conditions of the HTC process, such as SF and the amount of catalyst added in the reaction, directly affect the hydrochar yield. However, results from the I-optimal design have been used to develop the mathematical equation between the studied factors and the responses of interest. Statistical modelling of the I-optimal design was performed to maximize and examine the interaction effect between the SF and HTCcat factors for each response of interest (MY and CRR).
3.1.1 Statistical modeling of MY model
Table 3 shows the results of the ANOVA test applied to the MY model. The term is statistically significant if the p-value < 0.05 (95% confidence). As seen in Table 3, the p-values are<0.0002 for the full model, indicating that the model is significant. The R2 value also shows that the MY model has an excellent variability of 99.93%. Another statistical measure used to evaluate the model is adequate precision, which gives the signal-to-noise ratio (Politis et al., 2017). It is 32.93% (much higher than 4) in the current work, indicating that the model is suitable for prediction. In addition, the A, B, AB, and A2 model terms have a p-value < 0.05 and a large F-value of 181.95, 153.39, 23.61, and 12.45, respectively, which shows that these terms have a significant impact on the MY. However, the p-value (=0.4692) for the B2 term was greater than 0.05, showing that this term does not significantly influence the MY model. On the other hand, the graphical inspection using the plot of Predicted vs Actual values (Fig. 1(a)) shows that all the points are distributed around the diagonal, which confirms that the model is valid for making predictions. In contrast, the Residuals vs Run plot (Fig. 1(b)) shows that the points have a random distribution across the set of experiments, which confirms that there is no effect of the order of the experiments on the model (Darvishmotevalli et al., 2019).
Source
Sum of Squares
df
Mean Square
F-value
p-value
Remarks
Model
511.13
5
102.23
115.63
0.0002
Significant
X1 - HTCcat
160.86
1
160.86
181.95
0.0002
X2 - SF
135.61
1
135.61
153.39
0.0002
X1 × X2
20.87
1
20.87
23.61
0.0083
(X1)2
11.00
1
11.00
12.45
0.0243
(X2)2
0.5638
1
0.5638
0.6378
0.4692
Residual
3.54
4
0.8841
Lack of Fit
3.03
2
1.52
6.00
0.1428
Not significant
Pure Error
0.5049
2
0.2524
Total
514.67
9
R2
0.9931
Adjusted R2
0.9845
Predicted R2
0.8638
Std. Dev.
0.9403
Adeq Precision
34.9542
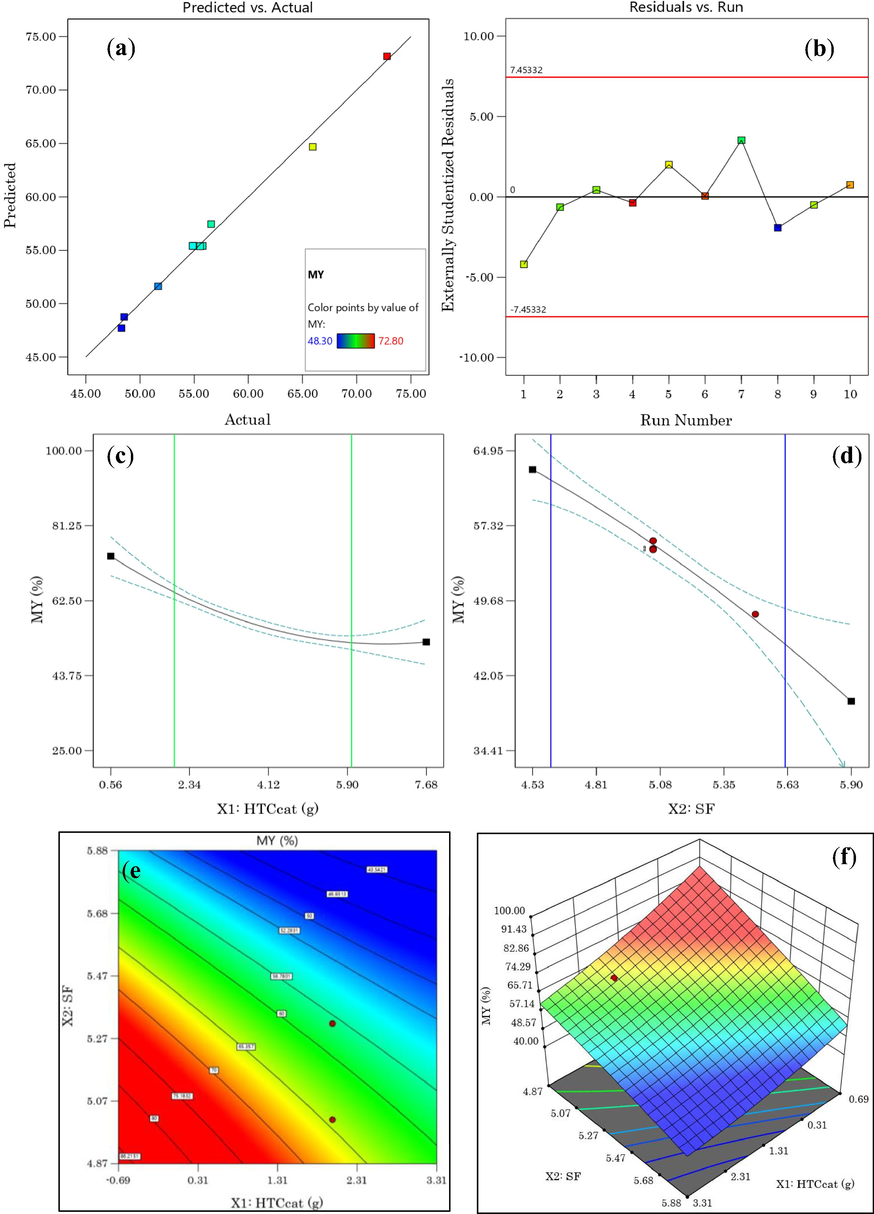
(a) Predicted vs. Actual value plot, (b) Residuals vs. Run plot, (c) HTCcat effect, (d) SF effect on MY, (e) 2D plot, (f) 3D plot response surface of MY as a function of SF and HTCcat.
Therefore, the final equation regarding the actual factors to predict the MY values is presented below (Eq. (8)).
As can be seen from the equation, the catalyst dose added in the hydrothermal reaction has the largest negative effect (–23.78), while the X1 × X2 interaction term has the largest positive effect (+3.2) on MY. In addition, the effect of the two separate factors on the MY shown in Fig. 1(c,d) shows that when the severity factor increases from 4.61 to 5.61 the hydrochar mass yield decreases from 62% to 45% for a catalyst dose equal to 4. This means that temperature and time simultaneously influence the hydrochar yield.
The 2D contour (Fig. 1(e)) and 3D (Fig. 1(f)) response surface plots show that there is a wide range of values (the red area) in which the MY is optimal.
However, the decrease in MY by increasing either the severity factor or the catalyst dose can be explained by the degradation of the components, i.e. cellulose, hemicellulose and lignin of the EOs extraction residues during c-HTC (Rout et al., 2015). A similar trend has also been reported in the literature when HTC of waste from Lavandin distillation (Li, 2022) and other waste (Ahring et al., 2015).
3.1.2 Statistical modeling of CRR model
Carbon densification is an interesting property that gives an idea about the efficiency of the HTC process to convert the raw material into a carbon-rich material for energy and environmental applications (Álvarez-Murillo et al., 2015). The ANOVA analysis in Table 4 shows that the quadratic model is statistically significant, with an F-value of 82.04. Additionally, the analysis of the fit statistic shows that the model has good predictive quality, not only by the difference between the adjusted R2 (0.978) and predicted R2 (0.899), which is<0.2, but also by the F-value of lack of fit (1.87).
Source
Sum of Squares
df
Coefficient Estimate
F-value
p-value
Remarks
Model
122.74
5
24.55
82.04
0.0004
Significant
X1 - HTCcat
41.79
1
2.88
139.68
0.0003
X2 - SF
17.49
1
3.01
58.45
0.0016
X1 × X2
12.97
1
−2.5
43.34
0.0028
(X1)2
3.13
1
−1.22
10.47
0.0318
(X2)2
1.84
1
−2.55
6.16
0.0680
Residual
1.20
4
Lack of Fit
0.7793
2
1.87
0.3488
Not significant
Pure Error
0.4175
2
Total
123.93
9
R2
0.9903
Adjusted R2
0.9783
Predicted R2
0.8994
Std. Dev.
0.5470
Adeq Precision
29.8680
The Adeq Precision measurement is a crucial aspect of signal to noise ratio assessment, as it helps to determine the adequacy of the signal with respect to the noise (Sepehrnia et al., 2023). In this research paper, we presented our findings on the interpretation of the result obtained from the Adeq Precision measurement. Our analysis indicated that a ratio greater than 4 is desirable, as it suggests that the signal is strong enough to overcome the noise. This indicates that the signal is adequately strong compared to the noise, making it a positive outcome for the design process. Furthermore, we suggested that the measurement model used in our study can be used as a tool for assessing and improving the quality of a design. However, the result of a standard deviation (Std. Dev) of 0.5470 for the CRR model is indicative of a tightly clustered dataset that is relatively close to the fitted curve. Overall, the result of a standard deviation of 0.5470 for the quadratic model is an important finding that supports the validity of the model and provides important insights into the nature of the data.
In the same context, it is evident that not only the distribution of points around the linear line in the Predicted vs Actual plot was homogeneous (Fig. 2(a)) but also the residuals of all the experimental points in the Residuals vs Run plot are inside the red lines, i.e. it varies only due to common cause variations (Tunç et al., 2020). The model’s lack of fit indicates no significant impact of the difference between the actual and predicted values compared to the pure error (Behera et al., 2018). However, according to the p-values in Table 4, the terms X1, X2, X1 × X2, and (X1)2 are all statistically significant in the CRR model, while HTCcat was the most significant term with an F-value of 139.68. On the other hand, the equation that explains the relationship of CRR as a function of HTCcat and SF (Eq. (9)) shows that both factors and the (HTCcat)2 term have a positive impact on the carbon retention rate, while the other terms in the equation have a negative impact.
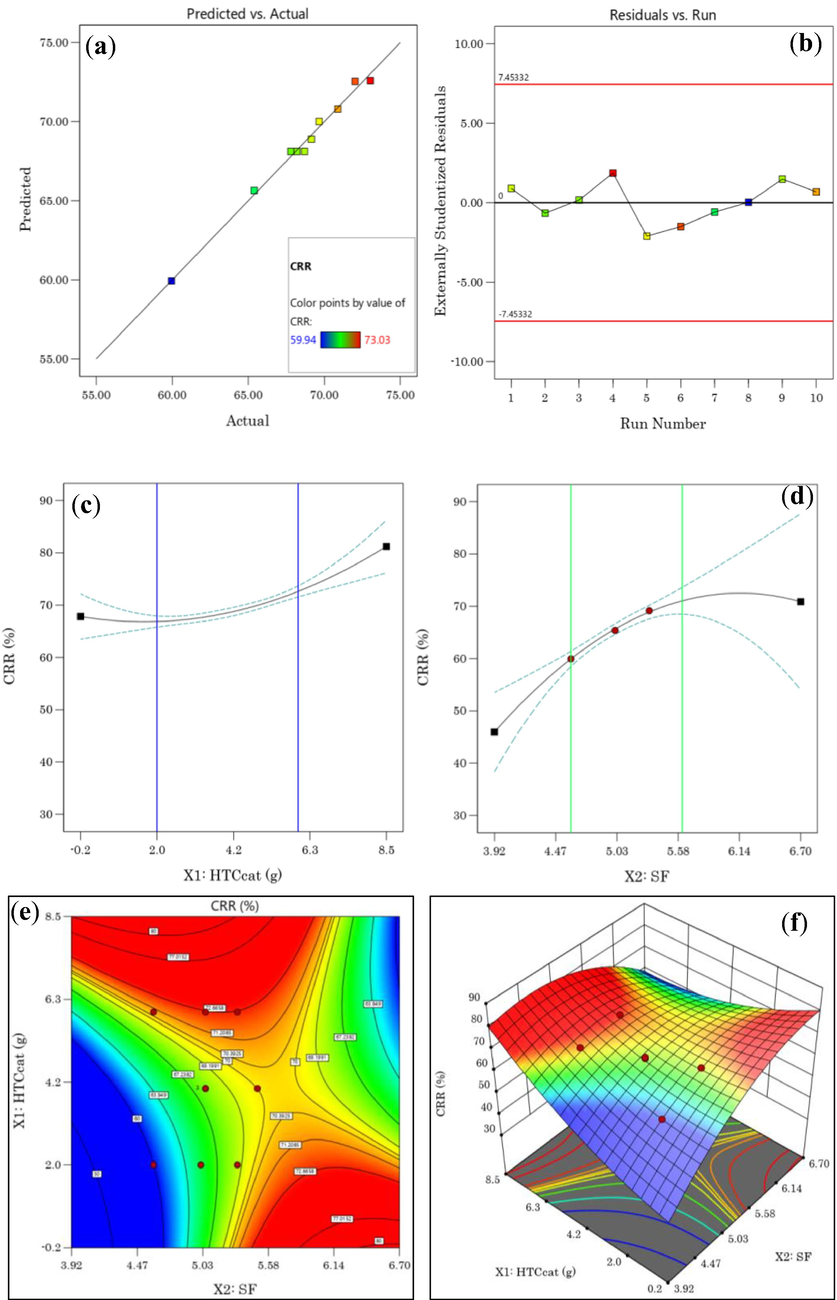
(a) Predicted vs. Actual plot, (b) Residuels vs. Run plot, (c) HTCcat effect, (d) SF effect on MY, (e) 2D plot, (f) 3D plot response surface of CRR as a function of SF and HTCcat.
Indeed, as can be seen in Fig. 2(c), if the catalyst dose (X1) is increased from 2 g to 6 g, the CRR increases from 65% to 74%. Similarly, in the experimental domain of the severity factor, an increase in the carbon retention rate increased from 59.9% to 71.2% (Fig. 2(d)). On the other hand, the 2D contour and 3D response surface graph shown in Fig. 2(e,f) show two domains (the red-coloured area) where the CRR is optimal. For example, for a citric acid dose and a severity factor of 4.61 and 5.30, respectively, we obtain a hydrochar with a CRR of 70%. Similarly, (Díaz et al., 2010; Heidari et al., 2019; González-Arias, 2020; Li, 2022) have reported results similar to this study.
3.1.3 Numerical optimization of MY and CRR model
According to the results obtained from modelling MY and CRR response, the severity factor and the citric acid dose play an important role in producing carbonaceous material with high mass yield and carbon retention rate. However, one of the aspects to be improved in the HTC process is the energy intensity, which makes it more cost-effective and economical (Heidari et al., 2019). Herein, numerical optimization using the desirability function (Amdoun, 2018; El Ouadrhiri et al., 2021) was adopted to determine the optimal mass yield and carbon retention rate level in the hydrochar with the constraints cited in table S3. Out of the seven solutions calculated by the software and represented in Fig. S1, the solution with the highest desirability value (73.9%) was selected as the optimal solution (Fig. 3).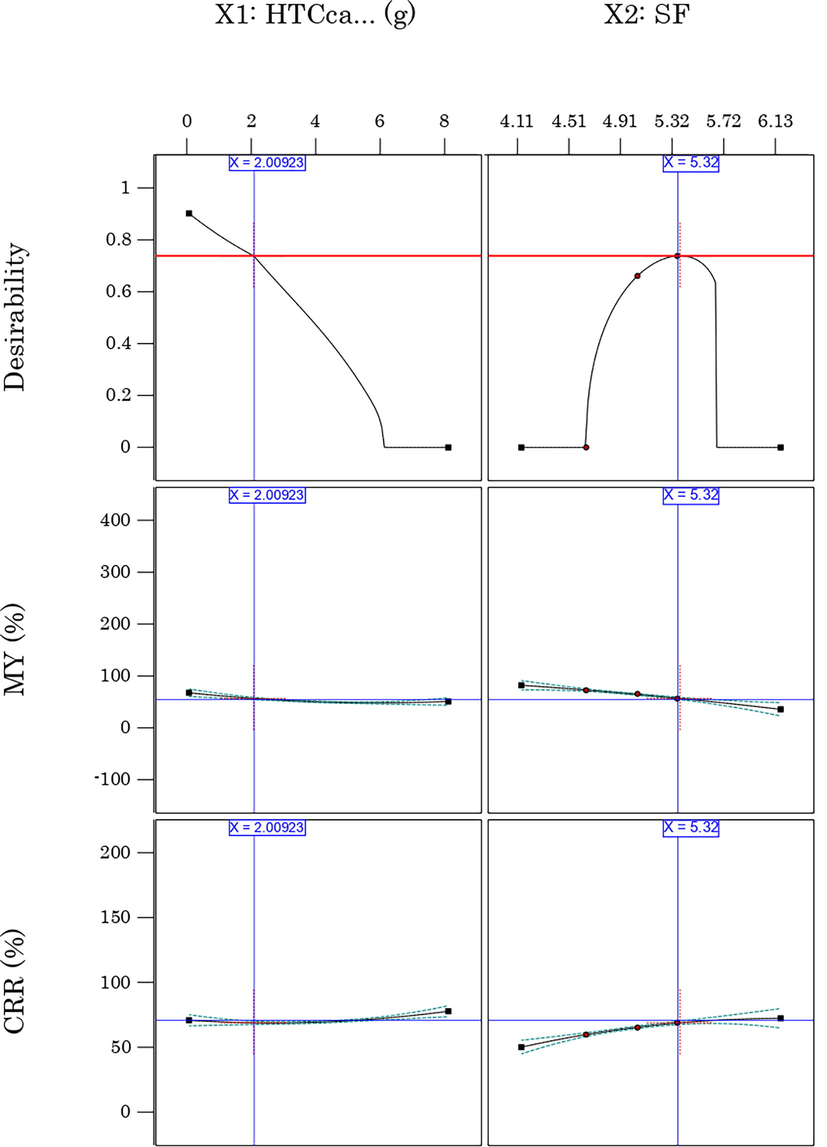
optimal solution under the imposed constraint.
As previously mentioned, this optimization aims to obtain a hydrochar from the solid waste of EOs extraction with optimal carbon content, the highest possible mass yield and the lowest possible energy intensity. On the other hand, under the conditions mentioned in Table S3 and represented in Fig. 3, the carbon retention rate in the optimized hydrochar (HCop) reaches its maximum at 68.7% with an optimal mass yield of 57.99%. Moreover, the experimental validation (Table 5) of the optimal solution (HTCcat = 2 g, SF = 5.32) shows only a percentage error of 1.85% and 2.32% for MY and CRR, respectively. Consequently, the accuracy of the optimal solution is confirmed.
HTCcat = 2 g, SF = 5.32 (optimal desiribality = 73.9%)
Predicted
Experimental
Error
MY (%)
57.99
56.14
1.85
CRR (%)
68.7
71.02
2.32
3.2 Characterization of the HCop and AHCop
The elemental analysis and atomic ratios (O/C) and (H/C) of the raw SW, HCop, and AHCop samples produced under optimal hydrothermal conditions (SF = 5.32 (corresponding to HTCT = 210 °C, HTCt = 2 h) and HTCcat = 2 g) are presented in Table 6. As seen in the table (below), the carbon percentages were 67.18% and 81.41% in the HCop and AHCop hydrochars, respectively, representing an increase of 42.24% and 72.37% compared to the raw SW. The increase in carbon content in the activated hydrochar can improve the textural properties and, as a result, their performance in eliminating organic pollutants, according to (Kumar and Jena, 2016).
Samples
Raw SW
HCop
AHCop
Elemental analysis
%. Carbon
47.23
67.18
81.41
%. Hydrogen
5.3
6.21
5.71
%. Nitrogen
0.69
0.71
0.73
%. Sulfur
0.28
0.18
0.23
%. Oxygen
41.94
25.73
12.4
HHV (MJ/Kg)
19.29
28.29
37.3
BET
Surface area (m2.g−1)
–
68.80
989.81
Total pores volume (cm3.g−1)
–
0.036
0.583
Average pores size (nm)
–
20.52
2.36
Micropore volume (cm3.g−1)
–
0.029
0.535
Mesopores volume (cm3.g−1)
–
0.007
0.048
Atomic ratio
O/C
0.666
0.287
0.152
H/C
1.337
1.101
0.908
XRD
Interlayer spacing (d002) (nm)
–
0.388
0.364
Width height (La) (nm)
–
2.50
3.07
Stacking height (Lc) (nm)
–
1.43
1.59
Number of layers (NL)
–
3.68
4.14
Meanwhile, the percentage of oxygen was decreased by 38.6% and 70.4% compared to raw SW in HCop and AHCop hydrochars, respectively. This decrease can be explained by the decarboxylation and dehydration reactions that manifest during c-HTC. Interestingly, there is also a significant increase of HHV in the hydrothermal solids HCop (28.29 MJ/Kg) and AHCop (37.30 MJ/Kg) compared to raw SW (19.29 MJ/Kg), which is very interesting from an energy point of view. The results of the current study are consistent with those of (Román et al., 2012) et (Yao et al., 2016; El Ouadrhiri et al., 2021; Rather et al., 2017). In fact, the increase in HHV and the percentage of carbon retained in hydrochars can be explained by the fact that the organic components containing the lignocellulosic raw SW are partially or completely eliminated during the 210 °C/2h hydrothermal reaction, which is consistent with previous studies (Liu and Balasubramanian, 2012; Akkaya Sayğılı and Sayğılı, 2022).
The elemental analysis of raw SW was used to calculate the atomic ratio values of O/C and H/C, and the resulting HCop and AHCop hydrochars were plotted in a Van Krevelen diagram (O/C vs H/C) to determine the direction of the hydrothermal reaction. As depicted in Fig. 4, the conversion of raw SW to HCop was primarily driven by the dehydration reaction, which was followed by the decarboxylation reaction. Notably, the AHCop hydrochar was found to be positioned adjacent to bituminous coal in the Van Krevelen diagram, indicating that the c-HTC coupling with KOH activation is a highly effective approach to rapidly generate a carbon-rich material while promoting the hydrolysis of raw SW in a short time.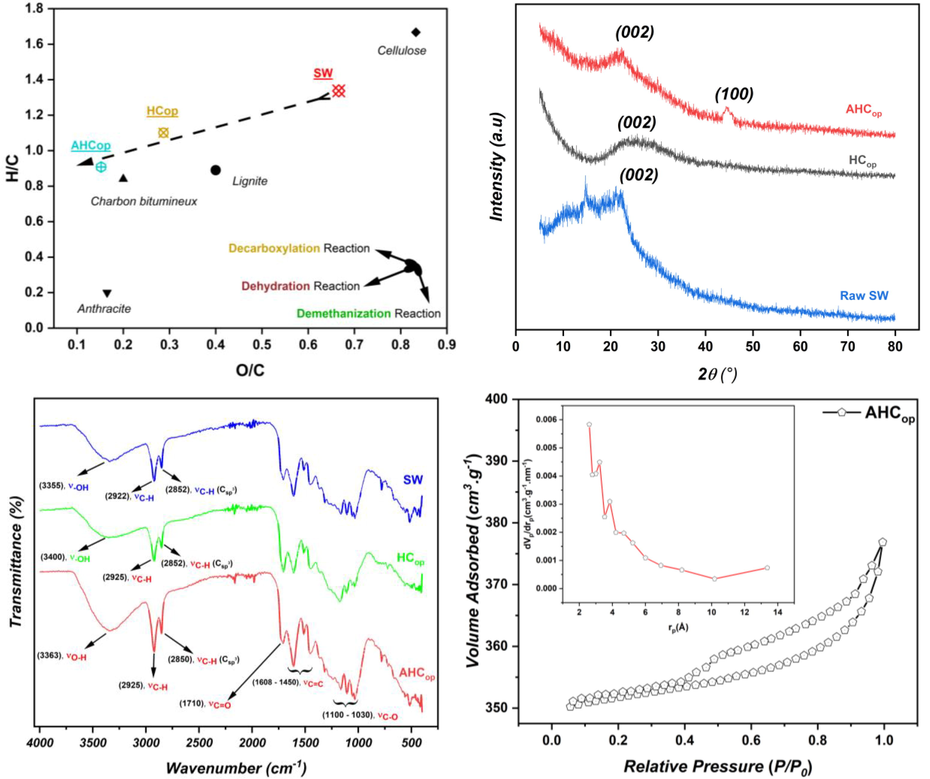
(a) Van Krevelen diagram, (b) XRD patterns, (c) FTIR spectre of the SW, HCop and AHCop and (d) N2 adsorption–desorption and PSD profil of AHCop.
FT-IR spectrum analysis using pellets of KBr has been performed to evaluate the nature, framework structural characteristics, and surface functionalities attachment to the surface of SW, HCop and AHCop (Fig. 4c). The presence of three intense peaks between 1030 cm−1 –1100 cm−1 exhibiting vibrational behaviour can be attributed to the behaviour of carboxylic functional groups (particularly the C-O bond) in the three samples. The wide band located at 3363 cm−1 in the AHCop spectrum compared to the raw SW and HCop spectra could be attributed to the hydroxyl group (–OH). This fact indicates the success of chemical activation with KOH in creating intense functions at the surface of AHCop. In addition, two very intense peaks between 2925 cm−1 and 2850 cm−1 in the case of AHCop were due to the vibration of the C–H bond. Meanwhile, those located at approximately 1608 cm−1 –1450 cm−1 and 1710 cm−1 could be attributed to the elongation of the C = C group (aromatic cycles) and C = O, respectively. The presence of the surface functions reported in this work for the activated hydrochar can be explained not only by the effect of the added citric acid in the hydrothermal reaction but also by the operational conditions of the c-HTC process (210 °C, 2 h).
In this study, FTIR analysis showed that adding citric acid in the hydrothermal reaction increased oxygen-containing functional groups (OFGs) in the HCop hydrochar compared to the raw SW. On the other hand, KOH activation further enriched the surface of AHCop with OFGs. Indeed, the findings in terms of peaks and bands found in this study are in line with the observations of (Susanti et al., 2019), who reported a decrease in the intensity of peaks (–OH), (-C–H), and (C-O), when the HTC temperature of salaca peel catalyzed by citric acid increased from 200 °C to 250 °C. One of the most important issues that emerge from these results is that OFGs groups serve as an active site that can interact with pollutant molecules, making them crucial for adsorption as reported by (Chen, 2011; An, 2022). In order to collect evidence of crystallinity, the X-Ray diffraction patterns of the powder of raw SW, HCop and AHCop were acquired and presented in Fig. 4(b). As can be seen, the two characteristic peaks at 2θ = 22.5° and 2θ = 25.23° for AHCop and HCop, respectively, were reflections from the (0 0 2) plane of the amorphous carbonaceous structure containing different surface functions. However, the large peak of HCop found compared to AHCop can be explained by the temperature used in the activation step, as reported in other studies (Tu, 2021). However, a peak at 2θ = 44.56° was observed only in the XRD spectrum of AHCop. This peak was characterized from the (1 0 0) plane of the graphitic carbon (Gai et al., 2017), indicating the successful preparation of a graphitized carbon material. In fact, the graphitic structure in the AHCop matrix was probably formed in the activation step at 700 °C. In addition, the interlayer spacing (d002) of successive and parallel planes of carbon atoms in the amorphous structure of HCop and AHCop (Table 6) was calculated using Bragg’s law (
) and found to be 0.388 and 0.364 (high compared to typical graphite layers (0.335 nm)), respectively which indicates an increased crystallinity and graphitization degree. It is essential to point out that the stacking thickness and degree of condensation of the aromatic layers are reflected in the XRD pattern of AHCop by the peaks (0 0 2) and (1 0 0), respectively. In this sense, specific parameters such as stacking height (Lc), width (La), and the number of layers (
) are calculated via Bragg’s law and Debye-Scherrer’s formula (
) (Scherrer, 1918) and processed by fitting method (Huh, 2014) to investigate deeply further the crystal structure modifications of the activated hydrochar AHCop derived from the SW. As shown in Table 6, the d002, La, Lc and N increased significantly from HCop to AHCop, indicating that KOH activation at 700 °C increased the degree of graphitization of the activated hydrochar. This result has been described previously in similar studies (Liu, 2020). For carbonaceous adsorbents, adsorption occurs primarily at the interface, and the specific surface area and pore size distribution on the surface of the carbonaceous material are the most important parameters affecting adsorption efficiency (Oginni et al., 2019). The N2 adsorption profiles and PSD for HCop and AHCop were represented in Fig. S2 and Fig. 4(d), respectively, and the calculated textural parameters were presented in Table 6. The AHCop isotherm may be classified as a type IV(a), characteristic of mesoporous adsorbents and abundant slit-like pores on the surfaces. The presence of a capillary condensation on a desorption branch is indicative of a type H3 hysteresis loop, as defined by the International Union of Pure and Applied Chemistry (IUPAC) classification (Thommes, 2015). However, the type HCop isotherm is almost the same as that of AHCop, which shows that the KOH activation step at 700 °C does not influence the pore type. The BET-specific surface area and total pore volume of HCop and AHCop are 68.80 m2.g−1 and 0.036 cm3.g−1 and 989.81 m2.g−1 and 0.583 cm3.g−1 respectively, proving the development of porosity in the hydrochar produced by citric acid-assisted HTC followed by the KOH activation step. In fact, as expected, the increase of the BET surface after catalyzed hydrothermal treatment is reported by other studies (Xing et al., 2019; Susanti et al., 2022). However, the BET surface area of the optimized hydrochar obtained in this study is higher than that reported by (Zhou, 2022) in HTC catalyzed by phosphoric acid. These results can be explained by the nature of the acid catalyst, the type of precursor used and the operating conditions of the HTC process. This fact shows that citric acid is a good candidate for developing high porosity in the hydrochar surface. In addition, the PDS graphs of HCop and AHCop show a pore distribution in the region (2 nm-50 nm), confirming the surface's mesoporous nature with a small number of micropores of 0.029 and 0.535, respectively. SEM analysis was done to show how the c-HTC process and KOH activation affected the morphology of the HCop and AHCop samples. Fig. 5 shows the corresponding images at different magnifications. From a global point of view, the pictures in Fig. 5(a-b) show that the surface of HCop is relatively smooth with less porosity due to the citric acid-assisted hydrothermal treatment. This observation is often reported for other hydrochars derived from lignocellulosic biomass (Liu, 2020; Ghaziaskar et al., 2019; Oumabady et al., 2020; Tu, 2021). Nevertheless, the surface morphology of AHCop presents a quite varied structure and a disorganized texture due to the KOH-activation process at 700 °C. Furthermore, the amorphous carbon regions and graphitic layers are well observed in AHCop with pores on the surface, which are consistent with the amorphous carbon’s nature and in agreement with the BET analysis.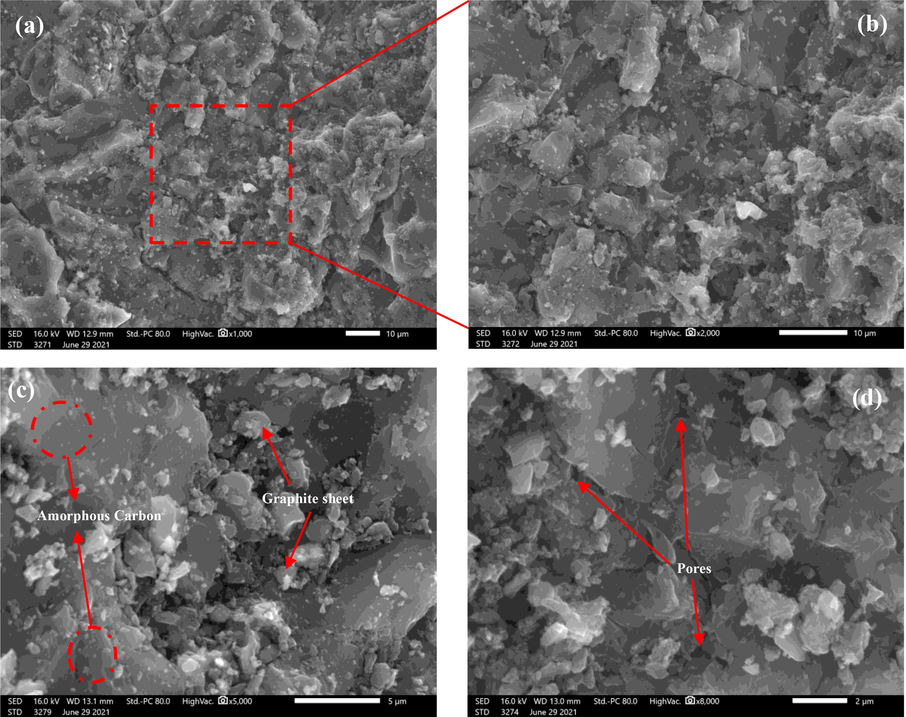
SEM image at low and high magnification of (a,b) HCop, (c,d) AHCop.
Indeed, there are several possible explanations for such a result. First, the penetration of citric acid into the raw SW matrix during the hydrothermal reaction favours better the fragmentation and solubilization reactions of the macromolecules, i.e. cellulose, hemicellulose and lignin in the raw SW, causing profound destruction of the latter (Rodríguez Correa et al., 2018). Then, the activation by KOH significantly increased the porosity and generated more pores in the interior and exterior surfaces of AHCop. Finally, thermal activation at 700 °C left the surface clearer and more graphitic as reported by (Zbair, 2020). Furthermore, the EDS analysis and the AHCop mapping images represented in Fig. 6 indicate the presence of the carbon atom in significant content, with the existence of some impurities such as silica (Si), aluminum (Al), potassium (K) and sulfur (S) in low content. The presence of the chemical elements Si, S and K, detected in EDX, would come from the citric acid and KOH used for the activation, having remained in the AHCop after the washing step. Regarding the element Si, its presence probably comes from the raw SW because it is an inorganic element encountered in the composition of wood ashes and some shells (Tu, 2021). Through the various analysis carried out, it should be noted that the presence of a developed porosity in terms of BET surface and the nature of pores on the surface of AHCop, as well as the presence of oxygenated functional groups, are crucial elements for the application of AHCop in the adsorption of organic pollutants (Dutta et al., 2021).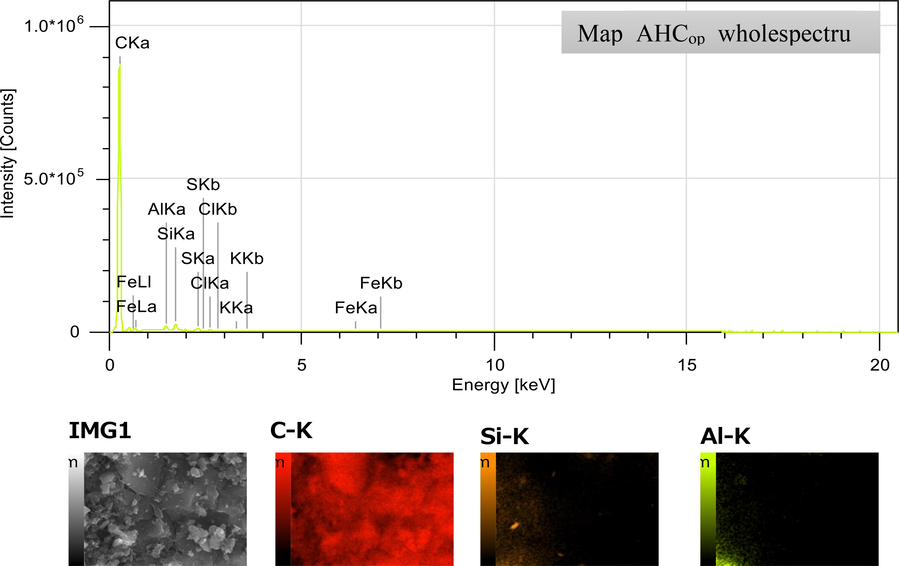
EDS spectrum and mapping images of AHCop.
3.3 Adsorption studies
3.3.1 MB Adsorption capacity onto SW, HCop and AHCop
The adsorption capacityof raw SW, HCop, and AHCop on methylene blue, as a pollutant molecule, were investigated and the result are presented in Fig. 7. Their adsorption capacities were 43.54, 134.37, and 340.25 mg.g−1, for raw SW, HCop and AHCop, respectively, under the following conditions: [t = 6 h, V = 250 mL, T = 25 °C, m = 0.2 g, C0 = 300 mg/L, and pH = 7], corresponding to 11.61%, 35.83%, and 90.73% elimination efficiency. The MB adsorption capacity of AHCop was clearly greater than that of raw SW, and HCop since the citric acid-assisted HTC procedure followed by the KOH-activation stage at 700 °C significantly increased the aromaticity and porosity of AHCop. In addition, the adsorption capacity of HCop was nearly three times that of raw SW, owing to the increase in BET surface area, pore volume, and functional groups of HCop after citric acid-assisted c-HTC, as demonstrated by BET and FT-IR analyses. In contrast, the MB removal rate by AHCop was three times that of HCop under the same circumstances, which is consistent with its large BET surface area (989.81 m2.g−1), pore volume, and abundance of OFGs such as –CO, C–H, -C = O, and –OH. Therefore, alkaline activation at 700 °C with KOH is a potential activation technique for enhancing the adsorption performance of activated hydrochar. Subsequently, additional batch experiments were conducted to investigate only MB’s adsorption characteristics and kinetics on AHCop.![MB adsorption capacity of raw SW, HCop and AHCop. operating conditions: [t = 6 h, V = 250 mL, T = 25 °C, m = 0.2 g, C0 = 300 mg.L-1, and pH = 7].](/content/184/2023/16/8/img/10.1016_j.arabjc.2023.104872-fig7.png)
MB adsorption capacity of raw SW, HCop and AHCop. operating conditions: [t = 6 h, V = 250 mL, T = 25 °C, m = 0.2 g, C0 = 300 mg.L-1, and pH = 7].
3.3.2 Adsorption isotherm of AHCop
Langmuir and Freundlich, the two most popular isotherm models for analyzing adsorption capability on AHCop, were investigated. The Langmuir model explains monolayer adsorption onto an adsorbent surface without interaction between adsorbate molecules (Vinayagam, 2023). In contrast, the Freundlich model predicts multilayer adsorption on an energetically heterogeneous surface with interacting adsorbate molecules (Freundlich, 1907). Fig. 8(a,b) show the plotting of the linear fit curves for the Langmuir and Freundlich isotherm models, respectively, and Table 7 provides the calculated parameters of each of these models. First, the Freundlich model has a slightly higher R2 coefficient (0.972) than the Langmuir model (0.967).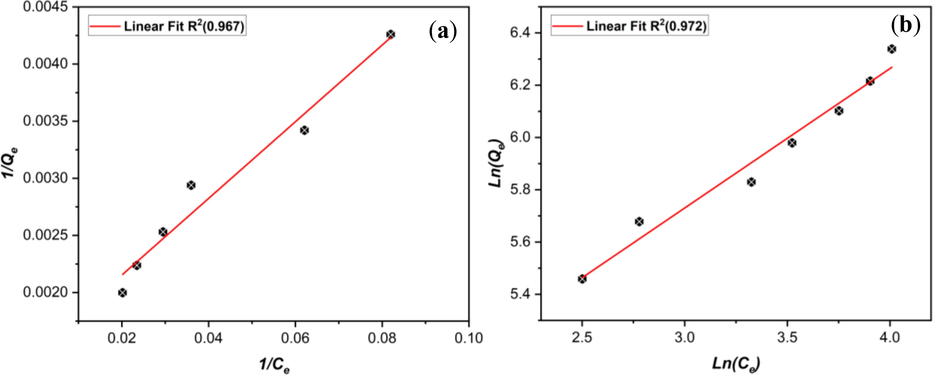
linear fit curves for the (a) Langmuir and (b) Freundlich isotherm models.
RL
Langmuir
Freundlich
Qm (mg/g)
KL (L/mg)
R2
KF (mg/g.(1/mg))
1/nF
R2
0.625
588.24
0.002
0.967
61.56
0.534
0.980
These results suggest that both models describe the adsorption process of MB on AHCop, indicating that the adsorption occurs in a monolayer way on a homogeneous surface and in a multi-layer way on a heterogeneous surface (Kurnia, 2022). Furthermore, the Freundlich constant (1/nF) equals 0.534 between 0 and 1, indicating intensive adsorption between the MB molecules and the AHCop. In addition, the calculation of the separation factor (RL) (Veloso et al., 2020), obtained from the Langmuir model, resulted in a value of 0.625, which was substantially below 1, which indicates that the adsorption of MB molecules on AHCop is thermodynamically advantageous and thus a sign of a high affinity of AHCop towards MB molecules (Theydan and Ahmed, 2012).
This result can be expressed by the large specific surface area that AHCop possesses and the richness of the surface by OFGs that contribute positively to the adsorption process (Supong et al., 2022). In addition, the point of zero charges (pHzhc) was measured and represented in Fig. 9(b). As can be seen, AHCop has a pHzhc of 6.40, which means that at pH values below 6.40, the surface of AHCop is positively charged, facilitating the adsorption of negatively charged molecules. On the other hand, at a pH above 6.40, the surface is negatively charged, facilitating the adsorption of basic dyes (Kurnia, 2022). The removal efficiency of MB at pH = 7 can be explained by the fact that the surface of AHCop has been negatively charged, which increases the adsorption of the negatively charged MB molecules at pH = 7.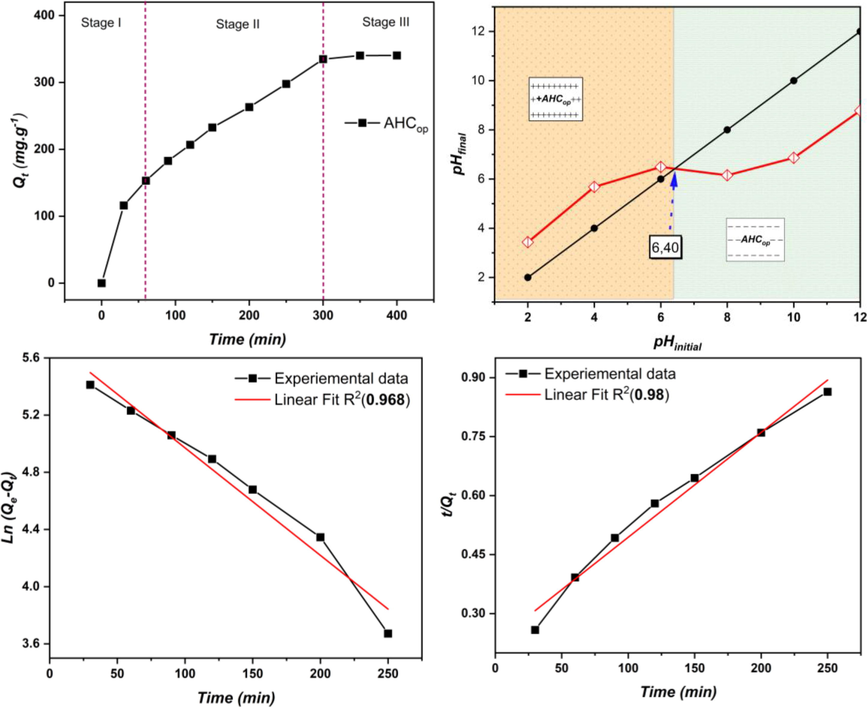
(a) adsorption capacity of MB on AHCop as a function of time, (b) Point of zero charge of AHCop, linear fitting of (c) PFO model and (d) PSO model.
3.3.3 Adsorption kinetic of AHCop
Adsorption kinetics models are mathematical equations that describe the rate at which a substance, known as the adsorbate, is adsorbed onto the surface of a solid or liquid, known as the adsorbent. These models are used to predict and understand the behaviour of adsorption processes and can be used to design and optimize adsorption systems. Two of the most widely used adsorption kinetics models are the pseudo-first-order model (PFO) and the pseudo-second-order model (PSO) (Benjelloun et al., 2021). Table 8 shows the experimental capacity of MB adsorption onto AHCop, and the associated calculated parameters of PSO and PFO, and Fig. 9(c,d) shows the graphs of these models.
model
PFO
PSO
parameter
Qe, exp (mg.g−1)
Qe, cal (mg.g−1)
k1 (min−1)
R2
Qe, cal (g/mg/min)
k2
R2
AHCop
340.25
314.66
0.0073
0.968
384.61
2.9 × 10⁻⁵
0.98
Fig. 9(a) shows that the adsorption process can be divided into three stages. In the first stage, the adsorption capacity of AHCop rapidly increases and reaches 150 mg.g−1 within 30 min. An exponential increase in the second stage results in a capacity of 291.75 mg.g−1 after 250 min. In the third stage, the capacity approaches a stable equilibrium, reaching a maximum of 340.25 mg.g−1 after an additional 350 min. On the other hand, the high R2 values (0.98) show that the PSO kinetics were a good fit for the MB adsorption on AHCop data over the whole adsorption period. Indeed, the theoretical Qe, cal values agreed well with the experimental Qe,exp values, suggesting that chemisorption predominated in the adsorption of MB by AHCop (Agboola and Benson, 2021; Elsayed et al., 2022).
The intra-particle diffusion model has frequently been used to analyze organic contaminants’ adsorption on solid surfaces (Salah omer et al., 2022). It has been proven to describe the adsorption process (McKay et al., 1987). It is based on the idea that the adsorption rate is limited by the rate at which the pollutant molecules can diffuse through the pores of the solid material (Sekine and Nakatani, 2002). The IPD model was developed by Weber and Morris using the following equation: to describe the mass transfer process (Masinga et al., 2022).
As seen in Table 9, the IPD model has a higher R2 (0.916), which means that the external mass transfer contributes significantly to the process of MB adsorption by AHCop because the linear part intercepts of the plots are significant.
Model
Intra-Particule Diffussion
Parameter
KIPD (mg/g/min0.5)
C (mg/g)
R2
AHCop
12.46
67.7
0.916
Indeed, two linear parts were seen in the plot of Qt versus t0.5, shown in Fig. 10. The first part can be attributed to the MB molecules transfer through the liquid film to the outer surface of the AHCop, known as the film diffusion (Yao and Chen, 2017). The second part can be attributed to the transport of MB molecules from the AHCop exterior surface to the pores or capillaries of the adsorbent internal structure, known as intraparticle diffusion (Kurnia, 2022). In fact, numerous investigations have revealed non-zero intercepts, showing that the rate-limiting phase in most adsorption processes includes intra-particle and film diffusion (Hameed and El-Khaiary, 2008; Doke and Khan, 2017; Vadivelan and Vasanth Kumar, 2005; Kurnia, 2022; Lopes, 2021). On the other hand, the significant value of the constant C was 67.7 mg.g-1, which is very far from zero, indicating that the boundary layer is thicker (Magdy and Altaher, 2018).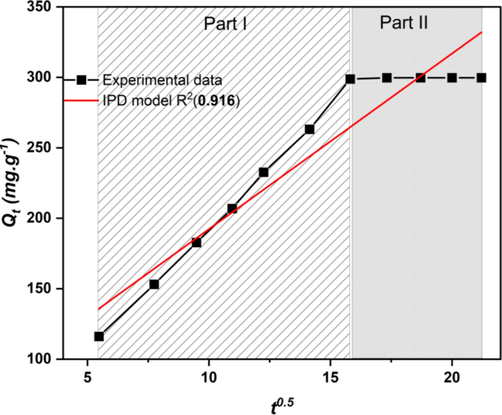
Intra-particle diffusion model for MB adsorption onto AHCop.
To determine the efficiency of the prepared AHCop compared to other low-cost adsorbents, the maximum adsorption capacity (Qm) values were compared. As shown in Table S4, the prepared AHCop activated with KOH had a comparable adsorption capacity for MB to other low-cost adsorbents. Based on this comparison, the prepared AHCop from the solid waste-based essential oil industry is a promising and effective option for removing MB from aqueous solutions due to its relatively high adsorption capacity. However, studying the regeneration of the material after its use would support the results obtained and further enrich the discussion.
4 Conclusion
In conclusion, the I-optimal experimental design proved to be an effective method for examining the relationship between the factors and responses studied in this work. By optimizing the hydrochar production conditions, the HCop obtained displayed high MY(%) and CRR(%) values, making it a promising material for further activation. The KOH (2 M) chemical activation of HCop at 700 °C provides an activated hydrochar (AHCop) with a high specific surface area, amorphous and graphitized structure, and dominance of mesopores as confirmed by SEM-EDS, XRD, and BET analysis. The adsorption experiments conducted on AHCop showed a high maximum adsorption capacity for MB and demonstrated the suitability of the Freundlich, Langmuir, and pseudo-second-order kinetics and intra-particle diffusion models for describing the isotherm and adsorption kinetics. Overall, this study has successfully developed and characterized a promising activated hydrochar for removing of MB from wastewater.
CRediT authorship contribution statement
Faiçal El Ouadrhiri: Conceptualization, Methodology, Software, Validation, Formal analysis, Investigation, Resources, Data curation, Writing – original draft, Writing – review & editing, Visualization. Ebraheem Abdu Musad Saleh: Methodology, Validation, Investigation, Resources, Writing – review & editing, Project administration, Funding acquisition. Kakul Husain: Resources, Writing – review & editing. Abderrazzak Adachi: Conceptualization, Investigation, Resources, Data curation. Anouar Hmamou: Conceptualization. Ismail Hassan: Resources. Marwa Mostafa Moharam: Validation, Funding acquisition. Amal Lahkimi: Conceptualization, Writing – review & editing, Supervision, Project administration, Funding acquisition.
Acknowledgements
We would like to express our sincere gratitude to the Prince Sattam Bin Abdulaziz University for their collaboration on this project. Their support were invaluable in helping us to achieve our research goals. We are grateful for the opportunity to work with such a distinguished institution.
Declaration of Competing Interest
The authors declare that they have no known competing financial interests or personal relationships that could have appeared to influence the work reported in this paper.
References
- “ASTM D6556-19, Standard Test Method for Carbon Black-Total and External Surface Area by Nitrogen Adsorption,“ ASTM International, West Conshohocken, PA, 2014.
- Optimisation and characterisation of hydrochar production from spent coffee grounds by hydrothermal carbonisation. Renew. Energy. 2020;147:1380-1391.
- [CrossRef] [Google Scholar]
- A. Agarwal, U. Upadhyay, I. Sreedhar, S. A. Singh, and C. M. Patel, “A review on valorization of biomass in heavy metal removal from wastewater,” Journal of Water Process Engineering, vol. 38. Elsevier, p. 101602, Dec. 01, 2020. doi: 10.1016/j.jwpe.2020.101602.
- O. D. Agboola and N. U. Benson, “Physisorption and Chemisorption Mechanisms Influencing Micro (Nano) Plastics-Organic Chemical Contaminants Interactions: A Review,” Frontiers in Environmental Science, vol. 9. Frontiers Media S.A., p. 167, May 28, 2021. doi: 10.3389/fenvs.2021.678574.
- Making lignin accessible for anaerobic digestion by wet-explosion pretreatment. Bioresour. Technol.. Jan. 2015;175:182-188.
- [CrossRef] [Google Scholar]
- M. Ajjoun, L. Kharchoufa, I. Alami Merrouni, and M. Elachouri, “Moroccan medicinal plants traditionally used for the treatment of skin diseases: From ethnobotany to clinical trials,” Journal of Ethnopharmacology, vol. 297. Elsevier, p. 115532, Oct. 28, 2022. doi: 10.1016/j.jep.2022.115532.
- Hydrothermal conversion of lignocellulosic waste to value-added biomaterial for high-performance contaminant removal: focusing on synthesis route and uptake mechanism. Mater. Chem. Phys.. Jul. 2022;286:126219
- [CrossRef] [Google Scholar]
- Biomass pyrolysis toward hydrocarbonization. influence on subsequent steam gasification processes. J. Anal. Appl. Pyrolysis. May 2015;113:380-389.
- [CrossRef] [Google Scholar]
- The desirability optimization methodology; a tool to predict two antagonist responses in biotechnological systems: case of biomass growth and hyoscyamine content in elicited Datura starmonium hairy roots. Iran. J. Biotechnol.. Feb. 2018;16(1):11-19.
- [CrossRef] [Google Scholar]
- Resource utilization of agricultural waste: converting peanut shell into an efficient catalyst in persulfate activation for degradation of organic pollutant. Chemosphere. Oct. 2022;304:135308
- [CrossRef] [Google Scholar]
- Practical aspects for designing statistically optimal experiments. J. Stat. Sci. Appl.. 2014;2(3):85-92.
- [CrossRef] [Google Scholar]
- J. Antoy, Design of Experiments for Engineers and Scientists: Second Edition. Elsevier Ltd, 2014. doi: 10.1016/C2012-0-03558-2.
- The determination of pore volume and area distributions in porous substances. I. computations from nitrogen isotherms. J. Am. Chem. Soc.. Jan. 1951;73(1):373-380.
- [CrossRef] [Google Scholar]
- Application of response surface methodology (RSM) for optimization of leaching parameters for ash reduction from low-grade coal. Int. J. Min. Sci. Technol.. Jul. 2018;28(4):621-629.
- [CrossRef] [Google Scholar]
- M. Benjelloun, Y. Miyah, G. Akdemir Evrendilek, F. Zerrouq, and S. Lairini, “Recent Advances in Adsorption Kinetic Models: Their Application to Dye Types,” Arabian Journal of Chemistry, vol. 14, no. 4. Elsevier, p. 103031, Apr. 01, 2021. doi: 10.1016/j.arabjc.2021.103031.
- P. Chavan, A. K. Singh, and G. Kaur, “Recent progress in the utilization of industrial waste and by-products of citrus fruits: A review,” Journal of Food Process Engineering, vol. 41, no. 8. John Wiley & Sons, Ltd, p. e12895, Dec. 01, 2018. doi: 10.1111/jfpe.12895.
- Simple approach to carboxyl-rich materials through low-temperature heat treatment of hydrothermal carbon in air. Appl. Surf. Sci.. Aug. 2011;257(20):8686-8691.
- [CrossRef] [Google Scholar]
- Optimization of saline wastewater treatment using electrochemical oxidation process: Prediction by RSM method. MethodsX. Jan. 2019;6:1101-1113.
- [CrossRef] [Google Scholar]
- S. K. Das, G. K. Ghosh, and R. Avasthe, “Valorizing biomass to engineered biochar and its impact on soil, plant, water, and microbial dynamics: a review,” Biomass Conversion and Biorefinery, vol. 12, no. 9. Springer, pp. 4183–4199, Jun. 30, 2022. doi: 10.1007/s13399-020-00836-5.
- Biomass-derived porous carbon materials: synthesis and catalytic applications. ChemCatChem. 2015;7(11):1608-1629.
- [CrossRef] [Google Scholar]
- Hydrothermal pre-treatment of rapeseed straw. Bioresour. Technol.. 2010;101(7):2428-2435.
- [CrossRef] [Google Scholar]
- Equilibrium, kinetic and diffusion mechanism of Cr(VI) adsorption onto activated carbon derived from wood apple shell. Arab. J. Chem.. Feb. 2017;10:S252-S260.
- [CrossRef] [Google Scholar]
- S. Dutta, B. Gupta, S. K. Srivastava, and A. K. Gupta, “Recent advances on the removal of dyes from wastewater using various adsorbents: A critical review,” Materials Advances, vol. 2, no. 14. Royal Society of Chemistry, pp. 4497–4531, Jul. 21, 2021. doi: 10.1039/d1ma00354b.
- Mesoporous carbon from optimized date stone hydrochar by catalytic hydrothermal carbonization using response surface methodology: application to dyes adsorption. Int. J. Chem. Eng.. 2021;2021:5555406.
- [CrossRef] [Google Scholar]
- Effective removal of anionic dyes from aqueous solutions by novel polyethylenimine-ozone oxidized hydrochar (PEI-OzHC) adsorbent. Arab. J. Chem.. May 2022;15(5):103757
- [CrossRef] [Google Scholar]
- Hydrothermal carbonization of lignocellulosic biomass and effects of combined Lewis and Brønsted acid catalysts. Fuel. Nov. 2020;279:118458
- [CrossRef] [Google Scholar]
- Über die adsorption in Lösungen. Zeitschrift Phys. Chem.. Oct. 1907;57U(1):385-470.
- [CrossRef] [Google Scholar]
- Facile one-pot synthesis of iron nanoparticles immobilized into the porous hydrochar for catalytic decomposition of phenol. Appl. Catal. B Environ.. 2017;204:566-576.
- [CrossRef] [Google Scholar]
- Removal of methylene blue by silver nanoparticles loaded on activated carbon by an ultrasound-assisted device: optimization by experimental design methodology. Res. Chem. Intermed.. Oct. 2018;44(5):2929-2950.
- [CrossRef] [Google Scholar]
- Catalyzed hydrothermal carbonization with process liquid recycling. Energy and Fuels. 2019;33(2):1167-1174.
- [CrossRef] [Google Scholar]
- Hydrothermal carbonization of olive tree pruning as a sustainableway for improving biomass energy potential: effect of reaction parameters on fuel properties. Processes. Sep. 2020;8(10):1201.
- [CrossRef] [Google Scholar]
- P. Goos and B. Jones, Optimal Design of Experiments: A Case Study Approach. 2011. doi: 10.1002/9781119974017.
- M. Grifoni, F. Pedron, M. Barbafieri, I. Rosellini, G. Petruzzelli, and E. Franchi, “Sustainable Valorization of Biomass: From Assisted Phytoremediation to Green Energy Production,” in Handbook of Assisted and Amendment: Enhanced Sustainable Remediation Technology, John Wiley & Sons, Ltd, 2021, pp. 29–51. doi: 10.1002/9781119670391.ch2
- Malachite green adsorption by rattan sawdust: Isotherm, kinetic and mechanism modeling. J. Hazard. Mater.. Nov. 2008;159(2–3):574-579.
- [CrossRef] [Google Scholar]
- A review of the current knowledge and challenges of hydrothermal carbonization for biomass conversion. J. Energy Inst.. 2019;92(6):1779-1799.
- [CrossRef] [Google Scholar]
- M. Heidari, O. Norouzi, S. Salaudeen, B. Acharya, and A. Dutta, Prediction of Hydrothermal Carbonization with Respect to the Biomass Components and Severity Factor, vol. 33, no. 10. 2019. doi: 10.1021/acs.energyfuels.9b02291
- Valorization of solid wastes from Dittrichia essential oil extraction as biosorbents for cadmium removal: biosorbent characterizations and isotherm modeling. Int. J. Environ. Sci. Technol.. Jun. 2020;17(11):4611-4622.
- [CrossRef] [Google Scholar]
- X-ray diffraction of multi-layer graphenes: Instant measurement and determination of the number of layers. Carbon N. Y.. Nov. 2014;78:617-621.
- [CrossRef] [Google Scholar]
- A. Jain, R. Balasubramanian, and M. P. Srinivasan, “Hydrothermal conversion of biomass waste to activated carbon with high porosity: A review,” Chemical Engineering Journal, vol. 283. Elsevier B.V., pp. 789–805, 2016. doi: 10.1016/j.cej.2015.08.014.
- W. Ke, “The Optimal Design of Blocked and Split-Plot Experiments,” Technometrics, vol. 47, no. 1, pp. 94–94, 2005, doi: 10.1198/tech.2005.s822.
- P. Klobes, K. Meyer, and R. G. Munro, “Porosity and Specific Surface Area Measurements for Solid Materials,” Mater. Sci., vol. 960–17, p. 79, 2006, [Online]. Available: http://www.ncbi.nlm.nih.gov/pubmed/22544181
- Preparation and characterization of high surface area activated carbon from Fox nut (Euryale ferox) shell by chemical activation with H3PO4. Results Phys.. Jan. 2016;6:651-658.
- [CrossRef] [Google Scholar]
- Insight into the adsorption of dyes onto chitin in aqueous solution: an experimental and computational study. Arab. J. Chem.. Nov. 2022;15(11):104293
- [CrossRef] [Google Scholar]
- Conversion of Lavandula straw into high-quality solid fuel: effect of hydrothermal carbonization conditions on fuel characteristics. Bioenergy Res. Jul. 2022:1-17.
- [CrossRef] [Google Scholar]
- Preparation of highly porous graphitic activated carbon as electrode materials for supercapacitors by hydrothermal pretreatment-assisted chemical activation. ACS Omega. 2020;5(19):11058-11067.
- [CrossRef] [Google Scholar]
- Hydrothermal carbonization of waste biomass for energy generation. Procedia Environ. Sci.. Jan. 2012;16:159-166.
- [CrossRef] [Google Scholar]
- D. Liu et al., “Microwave-Assisted Hydrothermal Preparation of Corn Straw Hydrochar as Supercapacitor Electrode Materials,” 2020, doi: 10.1021/acsomega.0c03605
- Steam-activated carbon from malt bagasse: optimization of preparation conditions and adsorption studies of sunset yellow food dye. Arab. J. Chem.. Mar. 2021;14(3):103001
- [CrossRef] [Google Scholar]
- K. MacDermid-Watts, R. Pradhan, and A. Dutta, “Catalytic Hydrothermal Carbonization Treatment of Biomass for Enhanced Activated Carbon: A Review,” Waste and Biomass Valorization, no. 0123456789, 2020, doi: 10.1007/s12649-020-01134-x
- Kinetic analysis of the adsorption of dyes from high strength wastewater on cement kiln dust. J. Environ. Chem. Eng.. Feb. 2018;6(1):834-841.
- [CrossRef] [Google Scholar]
- Removal of hexavalent chromium by polyethyleneimine impregnated activated carbon: intra-particle diffusion, kinetics and isotherms. J. Mater. Res. Technol.. May 2022;18:1333-1344.
- [CrossRef] [Google Scholar]
- Intraparticle diffusion process occurring during adsorption of dyestuffs. Water. Air. Soil Pollut.. Sep. 1987;36(3–4):381-390.
- [CrossRef] [Google Scholar]
- HHV predicting correlations for torrefied biomass using proximate and ultimate analyses. Bioengineering. 2017;4(1):pp.
- [CrossRef] [Google Scholar]
- An overview of effect of process parameters on hydrothermal carbonization of biomass. Renew. Sustain. Energy Rev.. 2017;73(February):1289-1299.
- [CrossRef] [Google Scholar]
- J. Nocedal and S. J. Wright, “Numerical optimization,” in Springer Series in Operations Research and Financial Engineering, 2006, pp. 1–664. doi: 10.1201/b19115-11
- Influence of one-step and two-step KOH activation on activated carbon characteristics. Bioresour. Technol. Reports. Sep. 2019;7:100266
- [CrossRef] [Google Scholar]
- J. A. Okolie et al., “Waste biomass valorization for the production of biofuels and value-added products: A comprehensive review of thermochemical, biological and integrated processes,” Process Safety and Environmental Protection, vol. 159. Elsevier, pp. 323–344, Mar. 01, 2022. doi: 10.1016/j.psep.2021.12.049.
- S. Oumabady, P. S. Paul Sebastian, S. P. B. Kamaludeen, M. Ramasamy, P. Kalaiselvi, and E. Parameswari, “Preparation and Characterization of Optimized Hydrochar from Paper Board Mill Sludge,” Sci. Rep., vol. 10, no. 1, p. 773, Dec. 2020, doi: 10.1038/s41598-019-57163-7.
- Hydrothermal reactions of agricultural and food processing wastes in sub- and supercritical water: a review of fundamentals, mechanisms, and state of research. J. Agric. Food Chem.. 2013;61(34):8003-8025.
- [CrossRef] [Google Scholar]
- Design of experiments (DoE) in pharmaceutical development. Drug Dev. Ind. Pharm.. 2017;43(6):889-901.
- [CrossRef] [Google Scholar]
- F. Pukelsheim, Optimal Design of Experiments, Classic Ed. Society for Industrial and Applied Mathematic, 2006. doi: 10.1137/1.9780898719109.
- Catalytic hydrothermal carbonization of invasive macrophyte Hornwort (Ceratophyllum demersum) for production of hydrochar: a potential biofuel. Int. J. Environ. Sci. Technol.. 2017;14(6):1243-1252.
- [CrossRef] [Google Scholar]
- Investigation of the textural and adsorption properties of activated carbon from HTC and pyrolysis carbonizates. Biomass Convers. Biorefinery. 2018;8(2):317-328.
- [CrossRef] [Google Scholar]
- Hydrothermal carbonization as an effective way of densifying the energy content of biomass. Fuel Process. Technol.. Nov. 2012;103:78-83.
- [CrossRef] [Google Scholar]
- P. K. Rout, A. D. Nannaware, and R. Rajasekharan, “PROCESS FOR CHEMICAL CONVERSION OF CELLULOSE SOLATED FROM AROMATIC SPENT BOMASS TO HYDROXYMETHYL FURFURAL,” 2015 Accessed: Nov. 23, 2022. [Online]. Available: https://patents.google.com/patent/US9199956B2/en.
- A. Saha and B. B. Basak, “Scope of value addition and utilization of residual biomass from medicinal and aromatic plants,” Industrial Crops and Products, vol. 145. Elsevier, p. 111979, Mar. 01, 2020. doi: 10.1016/j.indcrop.2019.111979.
- A. salah omer et al., “Adsorption of crystal violet and methylene blue dyes using a cellulose-based adsorbent from sugercane bagasse: characterization, kinetic and isotherm studies,” J. Mater. Res. Technol., vol. 19, pp. 3241–3254, Jul. 2022, doi: 10.1016/j.jmrt.2022.06.045.
- O. Santana-Méridas, A. González-Coloma, and R. Sánchez-Vioque, “Agricultural residues as a source of bioactive natural products,” Phytochemistry Reviews, vol. 11, no. 4. Springer, pp. 447–466, Nov. 30, 2012. doi: 10.1007/s11101-012-9266-0.
- Bestimmung der inneren Struktur und der Größe von Kolloidteilchen mittels Röntgenstrahlen. Kolloidchemie Ein Lehrbuch. 1918;1912:387-409.
- [CrossRef] [Google Scholar]
- Intraparticle diffusion and adsorption isotherm for sorption in silica gel studied by single-microparticle injection and microabsorption methods. Langmuir. Feb. 2002;18(3):694-697.
- [CrossRef] [Google Scholar]
- Experimental study and development of mathematical model using surface response method to predict the rheological performance of CeO2-CuO/10W40 hybrid nanolubricant. Arab. J. Chem.. Jun. 2023;16(6):104721
- [CrossRef] [Google Scholar]
- A. Slavov, I. Vasileva, L. Stefanov, and A. Stoyanova, “Valorization of wastes from the rose oil industry,” Reviews in Environmental Science and Biotechnology, vol. 16, no. 2. Springer, pp. 309–325, Apr. 22, 2017. doi: 10.1007/s11157-017-9430-5.
- B. Smucker, M. Krzywinski, and N. Altman, “Optimal experimental design,” Nature Methods, vol. 15, no. 8. Nature Publishing Group, pp. 559–560, Aug. 01, 2018. doi: 10.1038/s41592-018-0083-2.
- Density functional theory calculations of the effect of oxygenated functionals on activated carbon towards cresol adsorption. Surfaces. May 2022;5(2):280-289.
- [CrossRef] [Google Scholar]
- Activated carbon from citric acid catalyzed hydrothermal carbonization and chemical activation of salacca peel as potential electrode for lithium ion capacitor’s cathode. Ionics (Kiel). 2019;25(8):3915-3925.
- [CrossRef] [Google Scholar]
- Synthesis of high surface area activated carbon derived from cocoa pods husk by hydrothermal carbonization and chemical activation using zinc chloride as activating agent. Mater. Today Proc.. Jan. 2022;63:S55-S60.
- [CrossRef] [Google Scholar]
- Adsorption of methylene blue onto biomass-based activated carbon by FeCl3 activation: equilibrium, kinetics, and thermodynamic studies. J. Anal. Appl. Pyrolysis. Sep. 2012;97:116-122.
- [CrossRef] [Google Scholar]
- Physisorption of gases, with special reference to the evaluation of surface area and pore size distribution (IUPAC Technical Report) Pure Appl. Chem.. 2015;87(9–10):1051-1069.
- [CrossRef] [Google Scholar]
- Chemistry and materials options of sustainable carbon materials made by hydrothermal carbonization. Chem. Soc. Rev.. 2010;39(1):103-116.
- [CrossRef] [Google Scholar]
- A novel activation-hydrochar via hydrothermal carbonization and KOH activation of sewage sludge and coconut shell for biomass wastes: preparation, characterization and adsorption properties. J. Colloid Interface Sci.. 2021;593:390-407.
- [CrossRef] [Google Scholar]
- Growth of ZnO nanowires on carbon fibers for photocatalytic degradation of methylene blue aqueous solutions: an investigation on the optimization of processing parameters through response surface methodology/central composite design. Ceram. Int.. Apr. 2020;46(6):7459-7474.
- [CrossRef] [Google Scholar]
- V. Vadivelan and K. Vasanth Kumar, “Equilibrium, kinetics, mechanism, and process design for the sorption of methylene blue onto rice husk,” J. Colloid Interface Sci., vol. 286, no. 1, pp. 90–100, Jun. 2005, doi: 10.1016/j.jcis.2005.01.007.
- Adsorption of polymers onto iron oxides: equilibrium isotherms. J. Mater. Res. Technol.. Jan. 2020;9(1):779-788.
- [CrossRef] [Google Scholar]
- Bioinspiration synthesis of hydroxyapatite nanoparticles using eggshells as a calcium source: evaluation of Congo red dye adsorption potential. J. Mater. Res. Technol.. Jan. 2023;22:169-180.
- [CrossRef] [Google Scholar]
- Design of experiments (DoE) and process optimization. a review of recent publications. Org. Process Res. Dev.. 2015;19(11):1605-1633.
- [CrossRef] [Google Scholar]
- X. Xing, W. Jiang, S. Li, X. Zhang, and W. Wang, “Preparation and analysis of straw activated carbon synergetic catalyzed by ZnCl 2 -H 3 PO 4 through hydrothermal carbonization combined with ultrasonic assisted immersion pyrolysis,” Waste Manag., vol. 89, no. x, pp. 64–72, 2019, doi: 10.1016/j.wasman.2019.04.002
- Hydrogen peroxide modification enhances the ability of biochar (hydrochar) produced from hydrothermal carbonization of peanut hull to remove aqueous heavy metals: Batch and column tests. Chem. Eng. J.. 2012;200–202:673-680.
- [CrossRef] [Google Scholar]
- A film-diffusion-based adsorption kinetic equation and its application. Chem. Eng. Res. Des.. Mar. 2017;119:87-92.
- [CrossRef] [Google Scholar]
- Effects of hydrothermal treatment temperature and residence time on characteristics and combustion behaviors of green waste. Appl. Therm. Eng.. 2016;104:678-686.
- [CrossRef] [Google Scholar]
- Adsorption of cationic methylene blue dye using microwave-assisted activated carbon derived from acacia wood: Optimization and batch studies. Arab. J. Chem.. Jun. 2021;14(6):103122
- [CrossRef] [Google Scholar]
- Hydrothermal carbonization of Argan nut shell: functional mesoporous carbon with excellent performance in the adsorption of bisphenol A and Diuron. Waste Biomass Valorization. Apr. 2020;11(4):1565-1584.
- [CrossRef] [Google Scholar]
- Bamboo derived hydrochar microspheres fabricated by acid-assisted hydrothermal carbonization. Chemosphere. Jan. 2021;263:128093
- [CrossRef] [Google Scholar]
- Efficient removal of methylene blue by activated hydrochar prepared by hydrothermal carbonization and NaOH activation of sugarcane bagasse and phosphoric acid. RSC Adv.. Jan. 2022;12(3):1885-1896.
- [CrossRef] [Google Scholar]
Appendix A
Supplementary data
Supplementary data to this article can be found online at https://doi.org/10.1016/j.arabjc.2023.104872.
Appendix A
Supplementary data
The following are the Supplementary data to this article:Supplementary data 1
Supplementary data 1


