

Translate this page into:
Activated carbon surface chemistry: Changes upon impregnation with Al(III), Fe(III) and Zn(II)-metal oxide catalyst precursors from NO3− aqueous solutions
⁎Corresponding author. Tel.: +34 924289421; fax: +34 924 271449. vgomez@unex.es (Vicente Gómez-Serrano)
-
Received: ,
Accepted: ,
This article was originally published by Elsevier and was migrated to Scientific Scholar after the change of Publisher.
Peer review under responsibility of King Saud University.
Abstract
Because of the relevance in heterogeneous catalysis, the changes produced in the surface chemistry of activated carbon (AC) upon impregnation with the Al3+, Fe3+ and Zn2+ ions from aqueous solution of NO3− salts at pH 2.91 for Al3+, 1.54 for Fe3+ and 5.16 for Zn2+ in two successive soaking and oven-drying steps are studied. The samples (A120, F120 and Z120) were analyzed in terms of elemental composition and by energy dispersive X-ray analysis (EDX), FT-IR spectroscopy, X-ray photoelectron spectroscopy (XPS), and measurement of pH of the point of zero charge (pHpzc). The process yield was 102 wt% for A120, 114 wt% for F120, and 103 wt% for Z120. Chromene, pyrone and ether type structures are by far predominant in AC. The hydrolysis of metal ions markedly influences the pH of the impregnation solution and thereby the oxidation of surface functional groups of AC by O2 and NO3− dissolved in such a solution. The degree of AC oxidation is larger with the Fe3+ solution than with the Al3+ and Zn2+ solutions. Carboxylic acid groups for F120 and phenolic hydroxyl groups for Z120 and especially for A120 are formed from reducing structures of AC. The nitrogen content is higher by Z120 > A120 > F120 > AC. pHpzc is 10.50 for AC, 5.20 for A120, 4.00 for F120 and 6.30 for Z120.
Keywords
Activated carbon
Catalyst support
Al(III)
Fe(III)
Zn(II)
Surface chemistry

1 Introduction
Activated carbon is a carbon material widely used not only as adsorbent but also as catalyst and as a support for catalysts (Serp and Figueiredo, 2009). Concerning its uses in catalysis, the surface chemistry of the carbon plays an important role because of its reactivity. In the field of carbon materials, the surface chemistry usually refers to the chemical nature and properties of their surface, being made up of unpaired electrons and of the type, quantity and bonding of various heteroatoms, especially oxygen, which are bonded to the carbon skeleton and form the same surface functional groups as those typically found in aromatic compounds (Jankowska et al., 1991; Rodríguez-Reinoso, 1997). Such groups may be acidic groups (i.e. carboxyls, lactones and phenols) and basic groups (i.e. pyrones, chromenes, ethers and carbonyls) (López-Ramón et al., 1999). Also, the delocalized π-electrons of carbon basal planes are basic sites (Menéndez-Díaz and Martín-Gullón, 2006; Shafeeyan et al., 2010). Moreover, activated carbon has reducing ability due to oxygen functional groups such as phenolic, lactone, carbonyl, and quinone (Sirichote et al., 2002). To date, most of the studies carried out on the surface chemistry of activated carbon have focused on acidic groups. Such studies were predominantly aimed at increasing the content of such groups by activated carbon oxidation with reagents either in aqueous solution (i.e. HNO3, H2O2, (NH4)2S2O8) or in gas phase (i.e. air, O3) to be advantageously used with a specific end (Cookson, 1980). Conversely, basic/reducing structures of activated carbon such as pyrone and chromene structures have hardly been studied (Barroso-Bogeat et al., 2014a; Fuente et al., 2003; Menéndez et al., 1996; Montes-Morán et al., 2004, 2012). In fact, the presence of these structures in activated carbon has been frequently regarded as controversial (Menéndez-Díaz and Martín-Gullón, 2006; Rodríguez-Reinoso, 1997). In a recent study by FT-IR spectroscopy (Barroso-Bogeat et al., 2014a), however, they have been tentatively identified in activated carbon. On the other hand, the surface functional groups of carbons react in a similar way to the groups present in aromatic compounds with many reagents and therefore they strongly differentiate in the chemical reactivity (Jankowska et al., 1991; Rodríguez-Reinoso, 1997).
In heterogeneous catalysis, the surface chemistry of activated carbon is an important factor concerning not only the preparation of hybrid catalysts but also their performance and regeneration. First, the surface groups have a function of being anchorage sites for the catalyst precursor during catalyst preparation (Román-Martínez et al., 1995) and as a last resort control the specificity and extent to which the process occurs. With metal ions as catalyst precursors, surface complexes such as phenolates, carboxylates and chelates may be formed (Huang, 1980). Second, as another function in catalysis processes, surface oxygen complexes of the carbon support can act as active centers in multifunctional catalysts due to their acid-base or red-ox properties (Román-Martínez et al., 1995). Third, after the catalysis process, the surface chemistry of the carbon, depending on the degree of modification, may require to be restored by chemical methods. Accordingly, new insights into the surface chemistry of activated carbon and the role played by it in the catalysis process, particularly in the initial stage of catalyst preparation, are needed.
Activated carbon-metal oxide hybrid catalysts prepared from Al3+, Fe3+ and Zn2+ have been often used in catalysis processes (Barroso-Bogeat et al., 2011; Boorman et al., 1992; Castro et al., 2009; Changsuphan et al., 2012; Chen et al., 2012; Liu et al., 2011; Quintanilla et al., 2006). Activated carbons loaded with metal oxides such as Al2O3 and Fe2O3 have also been tested recently as adsorbents for the removal of organic compounds (Nazal et al., 2019; Istratie et al., 2019). Here, using such metal ions in NO3− solution as metal oxide precursors, the changes originated in the surface chemistry of activated carbon after two successive soaking and drying steps are studied by elemental analysis, EDX, XPS and FT-IR spectroscopies, and measurement of pH of the point of zero charge. The spectroscopy techniques were chosen to be used in the surface analysis of the samples as they provide valuable information on the elemental composition with a sensitivity of approximately 0.1 wt% (EDX), elemental composition with oxidation state to sensitivities of 0.5 at% (XPS) and the types of chemical bonds (FT-IR) (Walzak et al., 1998). XPS provides an estimate of the chemical composition of the few uppermost layers and cannot be used as a bulk analysis method (Erhan Aksoylu et al., 2001).
The results are mainly interpreted by taking into account that metal ions are prone to hydrolysis and also the presence in the impregnation solution of oxidizing chemical species such as dissolved O2 and NO3− ion. Furthermore, special emphasis is laid on the involvement of pyrone and chromene type structures of activated carbon in the chemical changes produced in its surface chemistry as it may serve to corroborate the presence of such structures in the starting carbon. This has been verified recently when studying the chemical changes originated in the surface chemistry of activated carbon after SnO2, TiO2 and WO3 supports (Barroso-Bogeat et al., 2016). Obtained results are further relevant because activated carbon is frequently treated with HNO3 in order to modify its surface chemistry by introducing oxygen groups, thus increasing the hydrophilic character of the carbon and presumably improving its behavior in the adsorption of metal ions from water. Likewise, as metal nitrates as a rule are readily soluble in water, their aqueous solutions are often used in the adsorption of solutes and in the preparation of heterogeneous catalysts, regardless of the feasible changes produced in the chemical composition of the solution, adsorbent and catalyst support.
2 Materials and methods
2.1 Materials and reagents
A granular activated carbon (AC) from Merck (Darmstadt, Germany; Cod. 1.02514.1000; 1.5 mm average particle size), as received, was used. The carbon was characterized by elemental and proximate compositions, porous texture, and chemical nature and acid-base character of its surface (Barroso-Bogeat et al., 2014b,a). The ash content of 4.72 wt% for AC is markedly lower than for other activated carbons that may contain up to 15 wt% of mineral matter (Rodríguez-Reinoso, 1998). AC is mainly a microporous carbon (micropore volume, 0.36 cm3 g−1; BET surface area, 711 m2 g−1) with significant meso- and macropore contents (mesopore volume, 0.15 cm3 g−1; macropore volume, 0.21 cm3 g−1). The aqueous solutions of the metal catalyst precursors were prepared from Al(NO3)3⋅9H2O, Fe(NO3)3⋅9H2O and Zn(NO3)2⋅6H2O, purchased from Panreac (Barcelona, Spain) and being of reagent grade.
2.2 Impregnation of AC
The impregnation of AC with the solutions of M(NO3)n was carried out in two successive steps of soaking at 80 °C for 5 h and oven-drying at 120 °C for 24 h, as described in detail in a previous report (Barroso-Bogeat et al., 2014b). Table 1 lists the pH of the initial solutions. By operating under identical conditions and for comparison purposes, blanks were prepared with deionized water at pH 5.05 (ACB) and with HNO3 solutions at pH ∼ 1.0, 2.0 and 3.0 (NA1, NA2 and NA3). The yield of the process of preparation of the samples was estimated by the following expression:
Precursor
pH
Yield (wt%)
Codes
Al(NO3)3·9H2O
2.91
102
A120
Fe(NO3)3·9H2O
1.54
114
F120
Zn(NO3)2·6H2O
5.16
103
Z120
2.3 Analysis of the samples
2.3.1 Proximate and elemental
In the present study, the ash content of the samples was determined by incineration at 650 °C for about 12 h in air, using a muffle furnace (Selecta). The elemental analysis (C, H, N and S) was performed in an analyzer (CHNS-932, LECO), whereas the O content was estimated by difference.
2.3.2 EDX
As obtained by difference in the elemental analysis, the O content of the samples is handicapped by cumulative errors introduced in the determination of other heteroatoms and also as a result of the presence of metals in the samples. Accordingly, the analysis of the samples was also undertaken by EDX spectrometry. EDX spectra were obtained in a 3D Quanta FEG equipment (FEI Company, Hillsboro, USA). Measurements were made in the high vacuum working mode, using an accelerating voltage of 15 kV.
2.3.3 FT-IR
Using a PerkinElmer Spectrum 100 spectrometer, the infrared spectra of the samples were recorded in the range of wave numbers from 4000 to 400 cm−1, with 8 scans being taken at 2 cm−1 resolution. In the preparation of pellets, the samples in a series of successive steps were first oven-dried at 120 °C overnight and size reduced for homogenization. Then, they were weighed in an analytical balance (Radwag, AS220/C/1) and thoroughly mixed with KBr (Panreac, PAI for IR spectroscopy) at the 1:1900 sample/KBr ratio, the total mass of the mixture being 238 mg, and compacted at 10 Tm cm−2 for 3 min under an oil pump vacuum in a PerkinElmer manual hydraulic press. The spectrum of a KBr pellet, approximately containing the same mass of KBr as the AC pellet, was used as background (Barroso-Bogeat et al., 2014a).
2.3.4 XPS
The surface of the samples was further analyzed by collecting the XPS spectra in a Thermo Scientific K-Alpha photoelectron spectrometer, using the monochromated Al Kα X-ray at 1486.68 eV (power consumption, 72 W) and operating under the following conditions: tilt angle, 30°; spot size, 30–40 μm; binding energy range, 1350–0 eV; step size, 1 eV; pass energy, 200 eV; sweep time, 50 min; and number of sweeps, 30. The previous conditioning of the samples was carried out at 2 × 10⁻⁶ Pa overnight. High resolution peaks were taken in the C 1 s and O 1 s regions. Quantitative analysis was performed with the Advantage software (version 4.87, Thermo Scientific). A Shirley-type background was subtracted from the signals. All the binding energies were calibrated with respect to the hydrocarbon C 1 s peak at 285.0 eV. From survey spectra the elemental composition spanning C, O, N and M was obtained, whereas the high resolution spectra provided information about the oxidation state of the analyzed elements.
2.3.5 pHpzc
The pHpzc was measured following the method previously proposed by Newcombe et al., 1993). 0.01 M NaCl aqueous solutions at pH 2, 4, 6, 8 and 10 were prepared by fixing these pH values with either 0.1 M HCl or NaOH aqueous solution. The pHpzc was obtained from the plot of pH of the initial solution against pH of the corresponding supernatant.
3 Results and discussion
3.1 Preparation of the samples
3.1.1 Blanks
The yield of the process of preparation of the samples was 96.0 wt% for ACB and 98.2 wt% for NA1, 96.0 wt% for NA2 and 95.7 wt% for NA3. The significant mass loss is attributable to the oxidation of AC. In principle, oxidation may affect any of both inorganic and organic fractions of AC. The term inorganic fraction is used here to denote all chemical constituents of mineral origin present in AC which were found in the starting material and that remained in the final product after its preparation (i.e., for the characterization of inorganic matter in biomass feedstocks and for the chemical changes undergone by it after heat treatment at high temperature, as a guide, see Suárez-García et al., 2002, and Pastor-Villegas et al., 1999, respectively). The oxidation of such a fraction should give rise to inorganic constituents of AC with an increased oxidation state which were consequently more hydrophilic in character and thereby more prone to undergo solubilization in water and thereby lixiviation from AC. The determined ash content on an average was 5.14 wt% for AC, 6.64 wt% for ACB, and between 6.5 and 8.0 wt% for the HNO3-treated samples. Therefore, from these results it becomes evident that oxidation affected the organic fraction of AC, instead of its inorganic fraction. In fact, the consumption of organic matter from AC is not surprising as the treatment of ACs with HNO3 produces textural changes (Huang et al., 2008; Jaramillo et al., 2010; Moreno-Castilla et al., 1995; Stavropoulos et al., 2008; Tamon and Okazaki, 1996) that are presumably due to carbon oxidation with CO2 release. It was also observed when coal was HNO3-treated under similar heating conditions as for AC (Hayatsu et al., 1982).
3.1.2 Samples A120, F120 and Z120
3.1.2.1 Solution speciation and pH
For metal cations (Mn+) in water, hydrolysis is a highly common equilibrium process that profoundly affects their chemistry in aqueous solution (Baes and Mesmer, 1976). An aquo-complex is formed first by a Lewis type acid-base reaction
Therefore, the hydroxo-complex is the conjugate base of the aquo-complex. As shown in Table 1, the pH of the aqueous solutions of Mn+ used in the impregnation of AC is 2.91 for Al3+, 1.54 for Fe3+, and 5.16 for Zn2+. Therefore, the character of these metal ions as a Brønsted acid varies by Fe3+> Al3+> Zn2+. The behavior exhibited by the Fe3+ ion is not surprising since one of the most notable features of the Fe3+ chemistry in aqueous solution is its tendency to hydrolyze and to form complexes. For the reaction (4),
Two chemical species present in the impregnation solutions are the molecular O2 and NO3− ion, the former because such solutions were not deaerated prior use and the latter due to its incorporation as metal salts in the preparation of the impregnation solutions. Both chemical species are strong oxidants (i.e., and ; Lide, 2005) that may interact therefore chemically with AĆs surface and contribute to its modification through the formation of functional groups. In the case of the NO3− ion, its behavior as a strong oxidant at the pH of the Mn+ solution was evident from the release of a brown color NO2 while soaking only in the preparation of F120. Furthermore, it proved that the NO3− ion was found concentrated in the Fe3+ solution.
3.1.2.2 Process yield
The yield of the process of preparation of the samples (Table 1) is 102 wt% for A120, 114 wt% for F120, and 103 wt% for Z120. Therefore, it varies by F120 ≫ Z120 > A120, which can be accounted for by the size of the Mn+ ions in aqueous solution. Since AC is a microporous carbon (Barroso-Bogeat et al., 2014b), diffusion in narrow pores of the carbon would be less hindered for the Fe3+ ion than for the Al3+ and Zn2+ ions because of the higher tendency of the Fe3+ ion to undergo hydrolysis with removal of protons from metal-coordinatively bound water molecules. Furthermore, it has also been reported that the Al3+ ion can be hydrolyzed extensively to form solutions of polynuclear hydroxide complexes and very large polymeric or colloid species (Baes and Mesmer, 1976). Also, the higher densities of Fe and Zn than of Al (i.e., 7.9, 7.1 and 2.7 g cm−3) (Emsley, 1989) likely influenced the sample weight.
3.1.2.3 Elemental composition
The determined ash content is 4.72 wt% for AC, 7.11 wt% for A120, 13.63 wt% for F120 and 9.73 wt% for Z120 (Barroso-Bogeat et al., 2015a), being therefore in line with yield values (Table 1). From data of the elemental analysis (C, H, N, S and O; see Table 2) it follows that AC mainly constitutes of carbon and to a much lesser extent of oxygen, as expected. The rest of the analyzed heteroatoms (i.e., H, N and S) are minor elements in AC. For A120, F120 and Z120, as compared to AC, the C and S contents decrease while the H, N, and O contents increase. The lower C and S contents for the prepared samples are attributable to the decreased presence of carbonaceous material to the benefice of metal oxide precursor. However, it should be also noted that the variation of the C content does not parallel with that of the process yield (i.e., for A120, in particular, it seems to be too low) which is indicative of the influence on the chemical constitution of the samples of factors, other than mass transfer from the bulk of the solution to AC, such as the chemical interaction of this solution with AĆs surface. As an example, the increase produced in the H and O contents is consistent with the formation of carbon-oxygen surface groups. Coordination water and hydroxyl groups belonging to the Mn+ coordination sphere should also contribute to increase the H and O contents. As a guide, the higher H content for A120 than for F120 is compatible with a greater incorporation of water molecules in the case of A120. Also, the lower O content than the H content for Z120 is in line with a smaller degree of cation hydrolysis with removal of protons from hydrate water molecules for Zn2+ than for Al3+ and Fe3+, which agrees with ion charges and sizes (Emsley, 1989). Finally, it should be mentioned that the N content is higher by Z120 > A120 > F120.
Sample
C (wt%)
H (wt%)
N (wt%)
S (wt%)
Odiff. (wt%)
AC
86.50
0.51
0.26
0.64
12.09
A120
72.83
1.16
0.49
0.56
24.96
F120
72.48
0.85
0.44
0.59
25.64
Z120
77.98
0.86
0.61
0.60
19.95
Table 3 lists EDX-composition data for the major chemical elements present in the samples. The C, O and M contents are expressed as percentage by weight (Xw) and atomic (Xa) (i.e., with X standing for C, O and M). The O contents are much lower as obtained by EDX than by elemental analysis, although the same tendency is followed (i.e., F120 > A120 > Z120) regardless of the determination method used in the chemical analysis of the samples. Also, the correlation with yield is good for the M content, expressed as both Mw and Ma. The fact that Mw is much higher than yield advocates for a large degree of M concentration in the samples, in particular for F120. It is also proved by the stronger effects of microporosity decrease and pore narrowing produced for F120 than for A120 and Z120, as described elsewhere (Barroso-Bogeat et al., 2014b). As a final comment it should be pointed out that the higher O content for A120 than for Z120, the yield and Mw being however lower for A120, is compatible with a greater presence of oxygen as compared to hydrogen containing groups (i.e., hydroxo groups instead of aquo groups) for A120.
Sample
Cw
Ca
Ow
Oa
Mw
Ma
AC
87.65
92.44
6.32
5.00
A120
79.11
85.86
12.94
10.51
4.58
2.22
F120
57.71
74.93
16.76
16.91
21.12
6.07
Z120
76.59
87.04
10.41
9.00
8.18
1.78
In Table 4 data of the XPS-elemental composition (i.e., C, N, O and M) obtained for the samples are presented. Comparison with the EDX results in Table 3 shows that the C content is markedly higher by XPS than by EDX, whereas the opposite as a rule applies to the O and M contents. These results may be surprising not only because in the samples the number of atomic layers amenable to the analysis is usually larger for EDX than for XPS but also because the oxygen surface groups and M should concentrate in the surface of AC. In fact, XPS has been used for determination of the surface oxygen content in activated carbon supports (Erhan Aksoylu et al., 2001). An overestimate of the elemental composition by XPS may be connected with a weight effect associated with the smaller number of chemical elements analyzed by XPS that were used for calculation purposes. Previously, the amounts determined for C, O and N were calculated from the corresponding peak areas and divided by the appropriate sensitivity factors (1.000 for C, 2.850 for O and 1.770 for N) (Ikeo et al., 1991; Figueiredo et al., 1999). However, the correction of the XPS data with such coefficient values would have led to even lower O and N contents than those present in Table 4 and thereby has not been performed in the present study. The N content varies by Z120 > F120 > A120. On the other hand, the calculated relative ratio O1s/C1s is 0.052 for AC, 0.089 for A120, 0.158 for F120, and 0.088 for Z120, which are close to those reported previously for surface-oxidized carbon fibers (Zielke et al., 1996). Such a ratio has been frequently taken as a measurement of the degree of oxidation of carbonaceous materials and therefore the here obtained O1s/C1s values indicate that it was markedly larger for F120 than for A120 and Z120. Finally, as yield, the M content varies by F120 > Z120 > A120.
Sample
C (wt%)
N (wt%)
O (wt%)
Al (wt%)
Fe (wt%)
Zn (wt%)
AC
94.82
0.24
4.94
A120
90.03
0.42
8.01
1.54
F120
82.65
0.53
13.02
3.80
Z120
89.78
0.56
7.88
1.78
3.2 FT-IR analysis
3.2.1 AC
The spectrum of AC and its interpretation were reported before (Barroso-Bogeat et al., 2014a). Band assignments and positions are summarized in Table 5. Abbreviations: υ, stretching; δ, bending (in-plane); as, asymmetric; s, symmetric.
Spectral feature
Position (cm−1)
Assignment
Group/structure
Peaks
2972–2823
υ(C—H)
Chromene structures
υ(O—H)
Quinone oximes
Band
1720
υ(C⚌O)
Carboxylic acid group, 2-pyrone structure
Shoulder
1657
υ(C⚌O)
Pyrone and chromene structures, carbonyl structures
Shoulder
1636
υ(C⚌C)
Pyrone and chromene structures
Band
1566
υs(C⚌C) skeletal
Aromatic ring
υ(C⚌C)
2-pyrone structures
Band
1279
δ(O—H)— υ(C—O)
Carboxylic acid
υas(⚌C—O—C)
4H-chromene
Shoulders
ca. 1249
υas(⚌C—O—C)
2H-chromene, 2-pyrone
Band
1024
υs(⚌C—O—C)
Chromene, pyrone, ether structures
3.2.2 Blanks
The FT-IR spectrum of ACB in Fig. 1, as the most salient differences with respect to the spectrum of AC shows two stronger bands at 1642 with a shoulder at around 1700 cm−1 and at 1192 cm−1. The former is a readily visible overlapping band compatible with the presence in ACB of oxygen surface groups such as intramolecular H-bonded carboxylic acid groups (—COOH) (Pretsch et al., 2009) and/or conjugated carbonyl groups (Coates, 2000) and also of water. In fact, for water the δ(H—O—H) vibration (ν2) occurs at 1640 cm−1 (Nakamoto, 1997). The latter spectral feature is ascribable to the ν(C—O) vibration of phenolic hydroxyl groups (C—OH). In the spectrum of ACB it can also be noted a strong absorption decrease between approximately 1060 and 950 cm−1 (i.e., for comparison purposes see the relative position, shape and intensity of the band at 1024 cm−1 for AC and at 1049 cm−1 for ACB and with respect to the band at 1069 cm−1 for AC and at 1091 cm−1 for ACB) which indicates that reducing structures of AC such as chromene and pyrone type structures were involved in the oxidation process of AC. On the other hand, the spectra obtained for NA1, NA2 and NA3, which are plotted in Fig. 2, are very similarly shaped, which proves that the concentration of the HNO3 solution used in the treatment of AC hardly influenced the changes originated in the surface chemistry of the material. The spectra registered for these samples display a badly defined band at 1686 cm−1 and two very broad and strong bands peaked at 1565 and 1208 cm−1. These spectral features are attributable in turn to ν(C⚌O) vibrations of —COOH groups, skeletal ν(C⚌C) vibrations of six-membered aromatic rings, and ν(C—O) vibrations of phenolic —OH groups. As characteristic frequencies, the —COOH group absorbs in the spectral regions of 1700, 1400, 1300–1200 and 900 cm−1 because of different bond vibration modes (Shevchenko, 1963). Also, a number of carbon-nitrogen surface groups absorb in the 1565 and 1205 cm−1 spectral regions (Pretsch et al., 2009). From the obtained infrared results for AC and blanks it follows that in the oxidation of oxygen surface groups of AC HNO3 behaves as a less selective chemical agent than O2.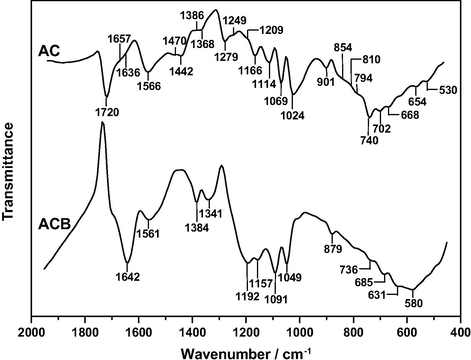
FT-IR spectrum of ACB.
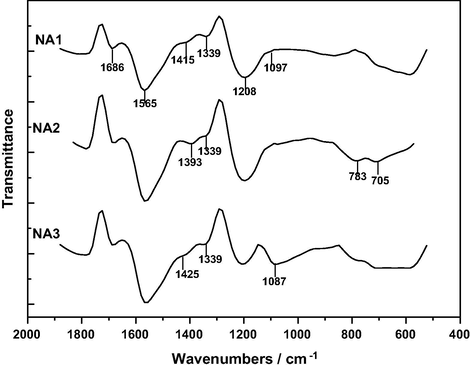
FT-IR spectra of the HNO3-treated samples.
3.2.3 Samples A120, F120 and Z120
The FT-IR spectra of A120, F120 and Z120 are shown in Figs. 3 and 4. Between 4000 and 2000 cm−1, the spectra have been plotted on a y-axis expanded scale in order to make easier their analysis. The very broad band registered between 4000 and 3460 cm−1 displays a large number of peaks for A120, contrary to F120. Furthermore, peak intensities as a rule vary by A120 > Z120 > F120. Since such spectral features are ascribable to the υ(O—H) vibration of free (non-associated by hydrogen bonding) —OH groups (i.e. hydroxyl and of H2O), their number and content are higher by A120 > Z120 ≫ F120. The —OH groups may come from the starting AC and hydroxylated Mn+ ions, which should remain unmodified in the final product or were formed after the chemical interaction of the Mn+ ion with AĆs surface. Perhaps, after protonation of the carbon surface by the acidic solution of a Mn+ ion and increase in the strength as a Brønsted acid of the AC-bound Mn+ ion, the loss of water molecules from the metal coordination sphere in two-successive deaquation and deprotonation steps was possible. C—OH groups may also be formed by oxidation of AC during the preparation of the samples, as commented above. Conversely, the content of —OH groups may decrease due to the reaction between —OH groups of AC and a hydroxo cation. The absence of salient peaks between 4000 and 3460 cm−1 for F120 indicates that the surface composition became more uniform after the treatment of AC with the Fe3+ solution in the preparation of this sample.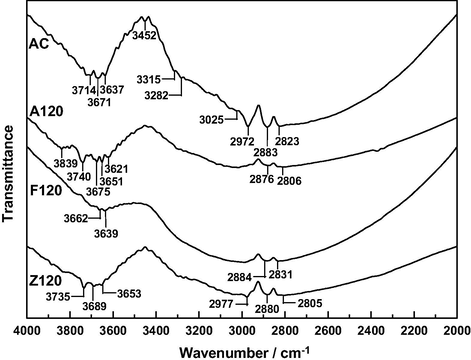
FT-IR spectra of the samples between 4000 and 2000 cm−1.

FT-IR spectra of the samples between 2000 and 400 cm−1.
In Fig. 3 it can also be noted that the number of shoulders between 3435 and ∼3000 cm−1 varies by Z120 > A120 > F120. These features were connected before with surface chemical structures of AC involved in hydrogen bonding (Barroso-Bogeat et al., 2014a). Such structures embraced pyrone and chromene type structures and therefore it appears that as a result of their protonation (León y León et al., 1992) disruption of hydrogen bonding occurred and that, as expected, the process was favored with decreasing pH of the Mn+ solution. The chemical interaction of the impregnation solution with chromene type structures of AC is evident from the peaks exhibited by the spectrum of AC at 2972, 2883 and 2823 cm−1, which were ascribed to the υ(C—H) vibration in —CH2— groups of such structures (Barroso-Bogeat et al., 2014a), as the peak at 2972 cm−1 is not registered for A120 and F120 and the three peaks are noticeably weaker for Z120. From these results it becomes clear that the effect of impregnation on chromene type structures of AC was dependent on the Mn+ ion, being weaker for the Zn2+ ion.
The band peaked at 1720 cm−1 in the spectrum of AC in Fig. 4 was assigned before to the υ(C⚌O) vibration of —COOH groups and 2-pyrone structures involved hydrogen bonding (Barroso-Bogeat et al., 2014a). As compared to AC, for A120, F120 and Z120 a shifted band is registered at 1695, 1726 and 1714 cm−1, respectively. Furthermore, it is weaker for Z120 and especially for A120 and stronger for F120. Accordingly, the effect of the impregnation of AC on the aforesaid oxygen functional groups was either detrimental or beneficial depending on the sample. Only for F120, the content of —COOH groups markedly increased. This is further proved by spectral changes produced at lower frequencies (Barroso-Bogeat et al., 2014a), such as the significantly stronger band at 1283 cm−1 for F120. However, for Z120 the band at 1274 cm−1 is not well defined, although it seems to be as intense as the band at 1279 cm−1 for AC.
Another peculiar feature in the spectra of the samples is the band at 1384 cm−1, which is stronger by Z120 ≫ A120 > F120. This variation of band intensities is similar to that noted for the determined N content for the samples (see data in Table 2). For a peach-stones granular activated carbon modified chemically by treatment with 6.0 M HNO3 at 80 °C, besides an increase in the N content, a spectral band registered also at 1384 cm−1 was attributed to C—NO2 groups (Soto-Garrido et al., 2003). The formation of C—NO2 groups on the surface of carbons by HNO3 treatment is not surprising at all as nitrating agents other than the usual H2SO4 and HNO3 mixture, including concentrated nitric acid, metal nitrates, nitrogen oxides and so on, have been previously used by many investigators (Joshi et al., 2003, and references therein). Furthermore, for the reaction of HNO3 oxidation a radical mechanism was proposed before (Ogata, 1978; Vinke et al., 1994). Moreover, in the synthesis of 3-nitro-2H-chromenes, treatment of evodionol and allevodionol with 68% HNO3 on heating in ethanol led to the nitration of both the pyran ring and the aromatic ring, yielding dinitro derivatives (Korotaev et al., 2013). The aforesaid band assignment would be further supported by the spectral appearance of the weak band at 881 cm−1 for Z120, which is ascribable to the ν(C—N) vibration mode (Nakanichi, 1962). However, doubts arise about it because of the appearance of only a single spectral band at 1384 cm−1, instead of two bands at 1525 ± 15 and 1345 ± 10 cm−1 due to the νas(C—NO2) and νs(C—NO2) vibrations (Nakanichi, 1962). According to the literature (Gatehouse et al., 1957; Davydov, 1984; Smidt et al., 2005), the 1384 cm−1 band is attributable to the nitrate group, which may be found as a metal ionic nitrate and as a covalently bound nitrato group in the samples and that strongly absorb in the range 1390–1350 cm−1 and at higher and lower frequencies, respectively (Gatehouse et al., 1957). The infrared spectrum of NO3− in ionic compounds shows three bands, ν2 (out-of-plane deformation), ν3 (doubly degenerated stretch), and ν4 (doubly generated in-plane bending) which appear in turn at frequency ranges 817–823 cm−1 (m), 1355–1368 cm−1 (vs) and 702–718 cm−1 (w). ν1 (symmetric stretching) is normally inactive (Curtis and Curtis, 1965). Since the spectrum of Z120 displays two bands at 1384 cm−1 (s) and at 881 cm−1 (w) and the ν4 band is weak, it seems likely that nitrogen was found as a chemical constituent of the NO3− group in the samples.
Other highly meaningful changes in the spectra of the samples occur in the region of approximately 1300 and 1161 cm−1. The great absorption increase produced for A120 is attributable to the υ(O—H) vibration of C—OH groups. Between 1274 and 1161 cm−1, absorption noticeably increases also for Z120, although to a lesser extent than for A120. By contrast, absorption significantly decreases between 1236 and 1167 cm−1 for F120. These results reveal that the impregnation of AC with the metal oxide precursor solutions resulted in a higher increase in the content of phenolic —OH groups for A120 than for Z120 and in a decrease in the content of these groups for F120. Probably, such surface groups were formed from pyrone and chromene type structures of AC. Notice that the band at 1024 cm−1 in the spectrum of AC is slightly shifted and becomes weaker in the spectra of A120 and F120. Furthermore, band intensities indicate that the change produced in the content of reducing structures of AC was less significant for F120 than for A120. Likewise, other C—O—C bonds containing oxygen surface structures of AC were not reactive and remained in the samples, as proved by the intensity of the band at 1161 cm−1 for A120 and at 1072 cm−1 for F120.
Below approximately 1200 cm−1, the main spectral changes are ascribable to υ(C—O—M) vibrations and δM(O—H) vibrations (Montoya et al., 2013; Park et al., 2010; Srivastava and Secco, 1967; Wolska and Szjada, 1983; Yu et al., 2013). Notice the increased intensity of the band at 1115 cm−1 for A120 and at 1122 cm−1 for F120 (i.e., for comparison purposes, see the bands at 1068 and 1072 cm−1, respectively). Also, absorption is markedly higher at 1048 cm−1 for Z120. The C—O—M atomic groupings will be formed by C—OH and M—OH condensation with water release. Absorption below 1300 cm−1 may also be caused by stretching vibrations of oxygen species chemisorbed on the surface of AC. As reported before (Busca, 1983), dioxygen is considered to form two different coordinated species: bent end-on “superoxo” species, absorbing in the 1300–1075 cm−1 region, and symmetrical side-on “peroxo” species, absorbing in the 985–790 cm−1 region. Oxygen surface species could be formed while oven-drying during the preparation of the samples as 120 °C is considerably higher than room temperature at which chemisorption of oxygen runs slowly and ion-radical oxygen structures absorbing at 1590 cm−1 are likely formed (Zawadzki, 1989). Furthermore, it is supported by the results obtained when a carbonized product was heated at various temperatures between 25 and 325 °C in an air stream as the mass of sample slightly increased between 100 and 225 °C (Gómez-Serrano et al., 1999).
In summary, from the FT-IR results it becomes apparent that the impregnation of AC with the Al3+, Fe3+ and Zn2+ aqueous solutions produced strong changes in the surface chemistry of the carbon. In particular, the increase in the content of —COOH groups for F120 and of phenolic —OH group for A120 and Z120 is worth mentioning. As a rule the chemical changes originated in AĆ surface have been connected with the oxidation of reducing structures of AC such as chromene and pyrone type structures, as the spectral changes associated with the —COOH groups and —OH groups are accompanied with an intensity decrease and even the absence of a large number of spectral features, including not only the weak peaks appearing in the spectral region of 3000–2800 cm−1 but also the bands and shoulders at 1657, 1636, 1442, 1249, 1024 and 740 cm−1 for AC (Barroso-Bogeat et al., 2014a). The dissimilar shape of the band peaked at 1024 cm−1 for AC and at 1027–1048 cm−1 for the prepared samples is a highly meaningful spectral feature in connection with the involvement of the aforesaid reducing structures of AC in the oxidation process. Valuable information is also provided by the infrared analysis concerning the feasible presence of nitrogen groups and of C—O—M bonds and chemisorbed oxygen in the samples.
3.3 XPS analysis
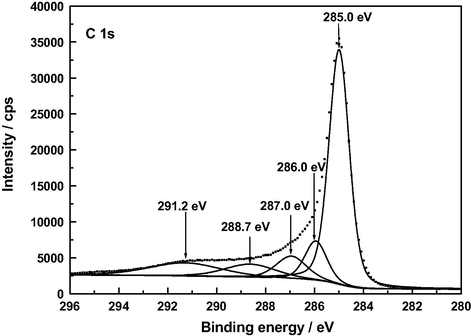
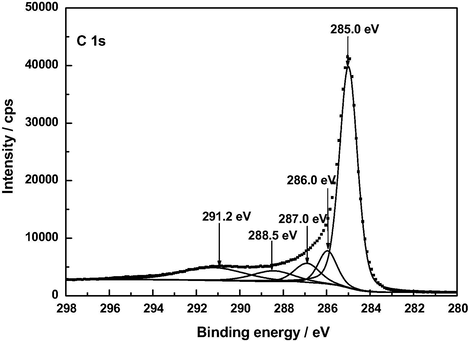
At present there is general agreement in the literature on peak assignments in XPS spectra of a variety of carbonaceous materials such as graphite (Hontoria-Lucas et al., 1995), carbon fibers (Zielke et al., 1996), activated carbon cloth (Polovina et al., 1997), activated carbons (Biniak et al., 1997; Terzyk, 2001), and carbon nanotubes (Kundu et al., 2008). For the here studied samples of such materials, the C 1 s photoelectron spectra are plotted in Figs. 5–8. The series of resolved peaks are centered at the binding energies collected in Table 6 and have been assigned to graphitic carbon (Cg; for AC, it was obtained from both peaks 284.5 and 285.0 eV), carbon singly bound to oxygen (C—O and/or C—O—C), carbon double bound to oxygen (C⚌O), carbon bound to two oxygens (O—C⚌O), and π–π transitions. Atomic composition data in Table 6 indicate that, regardless of the sample, the content of carbon–oxygen bonds varies by C—O, C—O—C > C⚌O > O—C⚌O. Furthermore, except for the O—C⚌O bonds, it is markedly higher for AC than for A120, F120 and Z120, for these samples the sequence being F120 > A120 > Z120. According to the above-mentioned FT-IR results, for the samples under study the carbon–oxygen bonds are likely present as surface phenolic —OH groups for the C—O bond, pyrone, chromene and ether structures for the C—O—C bond, pyrone structures for the C⚌O bond, and carboxylic acid groups for the O—C⚌O bond. Data in Table 6 reveal first that in AC the O—C⚌O bonds were predominantly found as 2-pyrone type structures, instead of as these structures and as carboxylic acid groups as reported before (Barroso-Bogeat et al., 2014a). Second, C—O and/or C—O—C bonds chemically transformed during the impregnation process of AC. Third, as shown by the higher contents of O—C⚌O bonds and C⚌O bonds in F120 and of C—O and/or C—O—C bonds in A120 than in Z120, as a result of such a process —COOH mainly for F120 and phenolic —OH groups by A120 > Z120 were formed. The noticeably higher content of C—O and/or C—O—C bonds in F120 than in A120, despite the decrease in phenolic —OH groups for F120, can be accounted for in terms of a smaller degree of oxidation of pyrone and chromene type structures of AC for F120. Also, the higher content of such bonds in A120 than in Z120 is in line with the greater formation of phenolic —OH groups for A120. Finally, it should be mentioned that, despite their involvement in the chemical changes, a large amount of the C⚌O structures present initially in AC remained unchanged after the impregnation treatment of the carbon, which is attributable to their unreactivity and/or inaccessibility to the oxidizing agents because of the microporous structure of the carbon support (Barroso-Bogeat et al., 2014b). In relation to the oxygen surface groups involved in the oxidation process, from the above XPS results it is evident that degree of AC oxidation was larger for F120 than for A120 and Z120.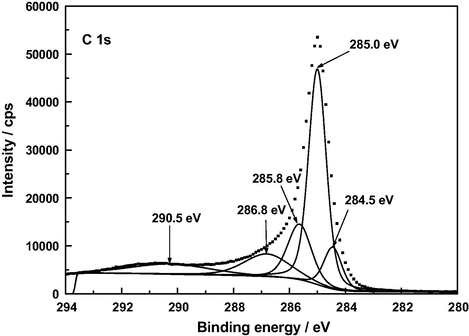
XP C 1 s deconvoluted spectrum of AC.

XP C 1 s deconvoluted spectrum of A120.
XP C 1 s deconvoluted spectrum of F120.
XP C 1 s deconvoluted spectrum of Z120.
Sample
285.0 Cg
286.0
C—O, C—O—CBinding energy/eV 287.0
C⚌O288.3–288.7
O—C⚌O290.5–291.2
π transitions
AC
61.5
17.1
13.4
10.3
A120
62.2
10.3
8.3
6.5
12.7
F120
60.2
10.9
8.6
8.5
11.8
Z120
62.4
9.8
7.8
7.2
12.8
A low content of —COOH groups in AC was surprising as a band at around 1720 cm−1 in the infrared spectrum of carbonaceous materials is customarily associated with the presence of such surface groups in the material. In view of these XPS results, the C 1 s spectrum of AC was differently fitted again and this resulted in a resolved spectrum (see Fig. 9) displaying five peaks at 285.0, 286.0, 286.9, 288.3 and 291.0 eV, the peak at 288.3 being ascribable to O—C⚌O bonds and the estimated surface atomic composition being then: Cg, 63.7%; C—O and/or C—O—C, 9.7%; C⚌O, 7.3%; and O—C⚌O, 5.9%. In any event, regardless of the C 1 s fitting, the results obtained in the XPS analysis of AC indicate that the content of carboxylic acid groups in this carbon is small as compared to that of 2-pyrone structures.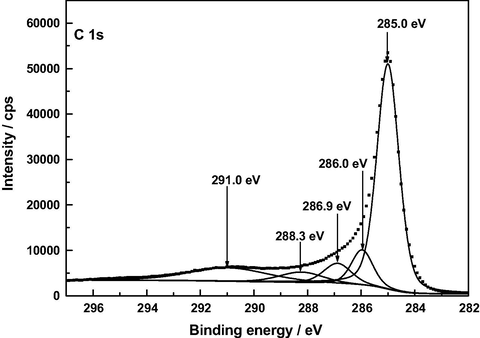
Alternative XP deconvoluted spectrum of AC.
The O 1 s spectra shown in Fig. 10 exhibit a similar shape for AC, A120 and Z120, unlike for F120. For the sake of brevity, only the spectra of AC and F120 have been resolved and are plotted in Figs. 11 and 12. Deconvolution of the O 1 s spectrum gave a different number of peaks depending on the sample, as inferred from data in Table 7. In connection with their assignment it should be borne in mind that, because oxygen atoms in carboxyl groups and pyrone structures have both single bonds and double bonds with carbon atoms, the oxygen atom in these groups contributes to both the C—O and C⚌O two peaks (Kundu et al., 2008). In fact, it was also stated that the —OH and C⚌O oxygen atoms in carboxyl groups cannot be distinguished in the XPS experiments carried out at room temperature (Zielke et al., 1996). Data in Table 7 show that, as expected, the oxygen functional groups with C—O and/or C—O—C bonds are by far predominant in AC and also, although much less, in the rest of the samples and it varies by the order AC ≫ A120 > Z120 > F120. The contents of the various carbon-oxygen bonds are compatible with a greater presence of pyrone and chromene type structures in AC than in A120, F120 and Z120 and with the oxidation of these structures to an extent by A120 > F120 > Z120 and formation of carboxylic acid groups for F120 and Z120 and of phenolic –OH groups by A120 > Z120 during the preparation of the samples. Water and oxygen have also been detected in the samples by XPS. According to the literature (Stöhr et al., 1991), the O 1 s spectrum for O2 adsorbed on carbon shows a main peak at 533 eV and a smaller peak near 531 eV. This second peak was attributed to chemisorbed oxygen in the form of carbonyl groups (Kozlowski and Sherwood, 1985). The XPS analysis tool has also enabled us to identify the M—O and M—OH bonds present in the samples. Specifically, the binding energies may be associated with the following chemical species: 530.9 eV, AlOOH or Al2O3 (Kloprogge et al., 2006); 530.1 and 531.3 eV, FeOOH, and 530.6 eV, Fe2O3 (Abdel-Samad and Watson, 1998); 531.3 eV, Zn(OH)2 (Duchoslav et al., 2014). In part at least, metal oxides may be formed as a result of the degradation of thermally unstable metal hydroxides during the XPS measurement (Duchoslav et al., 2014).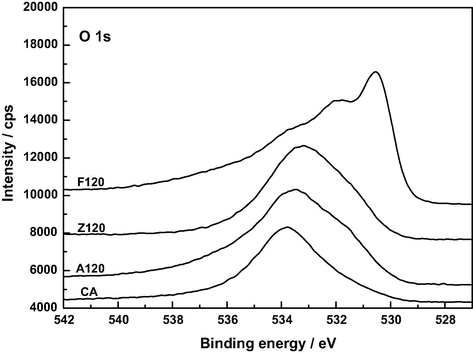
XP O 1 s spectra of AC, A120, F120 and Z120.
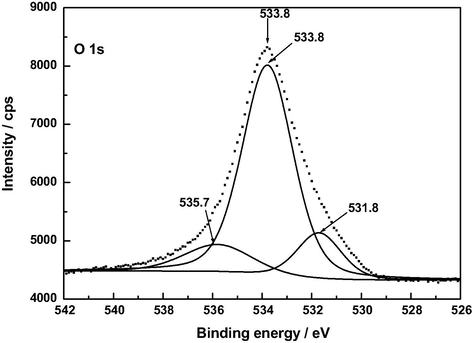
XP O 1 s deconvoluted spectrum of AC.
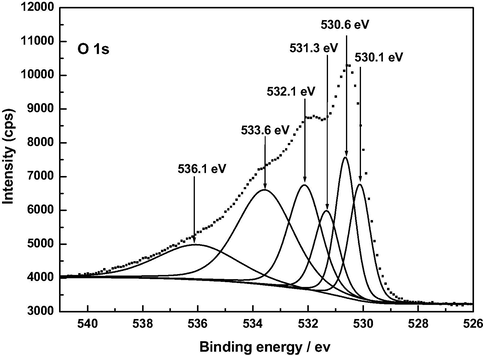
XP O 1 s deconvoluted spectrum of F120.
Sample
530.9/530.1
530.6
531.3
531.8–532.4
533.5–533.8
534.8–537.7
OH−
O2−
OH−
C⚌O, O—C⚌O
C—O, C—O—C
H2O, O2
Binding energy (eV)
AC
17.7
70.4
11.9
A120
6.9
15.9
52.3
24.9
F120
13.0
14.8
10.9
18.5
28.0
14.8
Z120
17.4
22.6
41.4
18.6
As for the N 1 s spectra (Fig. 13), the peak at 401.5 eV is attributable to graphitic (quaternary) N, i.e., N atoms replacing carbon atoms in graphene basal planes (Pels et al., 1995; Terzyk, 2001; Tai et al., 2014) and the peak at 406–407 eV to the nitrate group (Hu et al., 2009). The latter peak is only shown in the spectra of A120, F120 and Z120, the area of which being markedly larger for Z120 than for A120 and F120. The significant shifts of such a peak in the N 1 s spectra are likely connected with chemical environment in which the N atom is found in the samples (Hu et al., 2009; Bang et al., 2012). The results of the TG-MS analysis between 25 and 900 °C also provide proof of the presence of the NO3− group mainly in Z120 (Barroso-Bogeat et al., 2015b).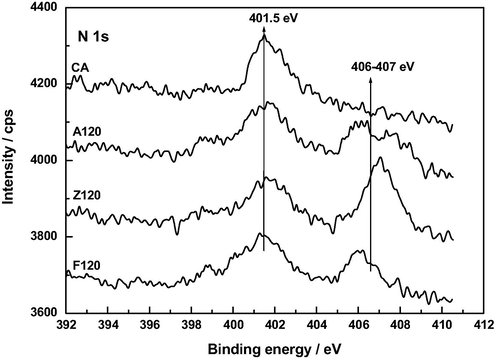
XP N 1 s spectra of AC, A120, F120 and Z120.
The XPS 2p spectra of FA120 and Z120 are omitted for the sake of brevity. In the case of A120, such a spectrum exhibits a strong peak at 74.5–75.0 eV compatible with the presence of Al2O3 and AlOOH in this sample. In fact, the Al-oxide peak in the Al 2p spectrum refers to both Al2O3 and Al-hydroxide (Zähr et al., 2012). For F120 (see Fig. 14), the spectrum closely resembles those reported previously for α,γ-FeOOH (Grosvenor et al., 2004; Jia et al., 2013). Typically, it features a main Fe3+ 2p3/2 peak at 711.6 eV and another strong Fe3+ 2p1/2 peak at 725.6 eV. Their associated satellite peaks, which are ascribable to shake-up or charge transference processes (Grosvenor et al., 2004), appear at 719.1 and 732.6 eV, respectively. The peak at 719.1 eV is a characteristic for the Fe3+ species typically seen in Fe2O3 (Wandelt, 1982; Deng et al., 2010). Interestingly, no peak at 708.4 eV ascribable to FeO is registered in the Fe p3/2 spectrum (Biesinger et al., 2011) and this suggests that reducing structures of Fe3+ to Fe2+ (Sirichote et al., 2002) were absent from AC because of their oxidation by chemical species other than the Fe3+ ion. In the case of Z120, the Zn 2p3/2 and 2p1/2 peaks are located at 1022.5 and 1045.5 eV, respectively. The Zn 2p3/2 peak for ZnO is quoted at 1021.7 eV with the O 1 s for ZnO found at 530.4 eV (Biesinger et al., 2010. For Zn(OH)2, the spectrum shows two peaks at 1020.8 and 1023.0 eV (Wang et al., 2015). Therefore, the practically intermediate position of the Zn 2p3/2 peak at 1022.5 eV between 1021.7 eV and 1023.0 eV argues for the presence of ZnO and Zn(OH)2 in Z120. In fact, ZnO together with ε-Zn(OH)2 was also detected in Z120 by X-ray diffraction analysis of the samples (Barroso-Bogeat et al., 2015b).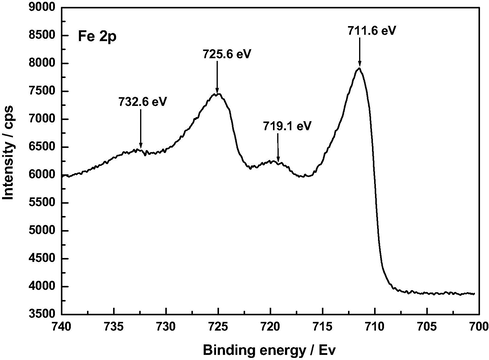
XP Fe 2p spectrum of F120.
3.4 AC oxidation
According to the infrared and XPS results, the impregnation of AC with the Al3+, Fe3+ and Zn2+ ions in aqueous solution produced the oxidation of reducing structures of AC by dissolved NO3− and O2. In connection with the oxidizing action of the NO3− ion, the rather dissimilar shapes of the infrared spectra registered for the HNO3-treated samples (Fig. 2) and for A120, F120 and Z120 (Fig. 4) indicate that the oxidation of AC was greatly influenced by whether the Mn+ ions were found in the aqueous medium or not. Certainly, the NO3− ion behaved as a more selective agent in the presence of the Mn+ ions. In this case, the lower oxidation power of the NO3− ion toward AC may be due to competition between AC and Mn+ for this ion and also to a pH increase in the impregnation solution because of the uptake of protons by AC (León y León et al., 1992). If the latter is so, it becomes clear then that the way by which protons originated, by either HNO3 dissociation or Mn+ hydrolysis, influenced their uptake by AC and pH of the supernatant and thereby the oxidizing action of the NO3− group. In any event it should be mentioned that the chemical nature and contents of the oxygen surface groups formed in the prepared samples are consistent with the increase in the oxidizing power of the NO3− ion with decreasing pH of the impregnation solution by Fe3+ > Al3+> Zn2+.
The oxidation of AC by O2 dissolved in water renders another possible oxidation path for A120 and Z120, as follows. Since activated carbons with a reducing/reduced or basic surface were reported to be more active in O2-reduction and H2O2-decomposition processes (Strelko et al., 2004; Khalil et al., 2001; Oliveira et al., 2004), as a tentative mechanism for the oxidation of AC during the soaking step, it is suggested here that after physical adsorption of water-dissolved O2 on the surface of AC, because of the reducing ability of this carbon on account of the presence of pyrone and chromene type surface structures, there was electron transfer from AC to O2 with formation of the dioxide (or superoxide anion) radical (O2•−). This ion radical may react first with water (Marklund and Marklund, 1974):
The pH dependence of the reactions (5) and (6) indicates that the generation of the radical OH• should be favored with pH decrease in the impregnation solution, which is true for A120 and Z120. The unexpected behavior shown by F120 suggests that, apart from pH, some other factor played a decisive role in the formation of hydroxyl radicals and effectiveness of the oxidation treatment of AC with respect to the generation of C—OH groups. Perhaps, the Fe3+ ion acted as a O2•− scavenger:
3.5 pHpzc
The pHpzc is 10.5 for AC, 5.20 for A120, 4.00 for F120, and 6.30 for Z120, and therefore it varies by AC > Z120 > A120 > F120. The markedly lower pHpzc for Z120, A120 and F120 than for AC is consistent with the increase in the content of acidic surface groups and decrease in the content of basic surface structures for the prepared samples. Specifically, the variation of pHpzc is compatible with the greater presence of —COOH groups in F120 and of phenolic —OH groups in A120 than in Z120. Moreover, the M—OH groups must be more acidic in character for the Fe3+ and Al3+ ions than for the Zn2+ ion as electronegativity (Li et al., 2012), and thereby the degree of polarization of the MO—H bond in coordination water molecules, varies by Fe3+> Al3+> Zn2+.
4 Conclusions
The effectiveness of the impregnation process and the chemical changes produced in the surface of AC are strongly dependent on the metal ion used as metal oxide catalyst precursor. Because of its chemical nature and inherently associated degree of hydrolysis, the metal ion markedly influences the pH of the impregnation solution and thereby the oxidizing power of this solution due to the presence of dissolved O2 and NO3− ion and as last resort the changes originated in the surface chemistry of the carbon. Yield is higher by Fe3+ > Zn2+ > Al3+. By oxidation of reducing structures of AC, such as pyrone and chromene type structures, —COOH groups for F120 and phenolic —OH groups for Z120 and especially for A120 are formed. The NO3− group remains in the samples to a larger extent according to Z120 ≫ A120 > F120. The condensation of AC—OH groups and M—OH groups may result in C—O—M atomic groupings. pHpzc is 10.50 for AC and 5.20 for A120, 4.00 for F120 and 6.30 for Z120. Therefore, the impregnation of AC produces an important increase in the acidic character of the carbońs surface. The chemistry of this surface in the process of preparation of the samples corroborates the presence of pyrone and chromene structures in AC and their involvement in the oxidation process of AC.
Ackowledgments
Financial support from Gobierno de Extremadura and European FEDER funds is gratefully acknowledged. A. Barroso-Bogeat thanks Spanish Ministerio de Educación, Cultura y Deporte for the concession of a FPU Grant (AP2010-2574).
References
- An XPS study of the adsorption of lead on goethite (α-FeOOH) Appl. Surf. Sci.. 1998;136:46-54.
- [Google Scholar]
- The Hydrolysis of Cations. New York: John Wiley & Sons; 1976.
- Photocurrent detection of chemically tuned hierarchical ZnO nanostructures grown on seed layers formed by atomic layer deposition. Nanoscale Res. Lett.. 2012;7:290-300.
- [Google Scholar]
- FT-IR analysis of pyrone and chromene structures in activated carbon. Energy Fuels. 2014;28:4096-4103.
- [Google Scholar]
- Activated carbon as a metal oxide support: a review. In: Kwiatkowski J.F., ed. Activated Carbon: Classifications, Properties and Applications. New York: Nova Science Publishers; 2011. p. :297-318.
- [Google Scholar]
- Preparation of activated carbon-SnO2, TiO2, and WO3 catalysts. Study by FT-IR spectroscopy. Ind. Eng. Chem. Res. 2016
- [CrossRef] [Google Scholar]
- Preparation of activated carbon-metal oxide hybrid catalysts: textural characterization. Fuel Process. Technol.. 2014;126:95-103.
- [Google Scholar]
- Preparation and microstructural characterization of activated carbon-metal oxide hybrid catalysts: new insights into reaction paths. J. Mater. Sci. Technol.. 2015;31:806-814.
- [Google Scholar]
- Preparation of activated carbon-metal (hydr) oxide materials by thermal methods. Thermogravimetric-mass spectrometric (TG-MS) analysis. J. Anal. Appl. Pyrolysis. 2015;116:243-252.
- [Google Scholar]
- Resolving surface chemical states in XPS analysis of first two transition metals, oxides and hydroxides: Sc, Ti, Cu and Zn. Appl. Surf. Sci.. 2010;257:887-898.
- [Google Scholar]
- Resolving surface chemical states in XPS analysis of first row transition metals, oxides and hydroxides: Cr, Mn, Fe, Co and Ni. Appl. Surf. Sci.. 2011;257:2717-2730.
- [Google Scholar]
- The characterization of activated carbons with oxygen and nitrogen surface groups. Carbon. 1997;35:1799-1810.
- [Google Scholar]
- A comparison of alumina, carbon and carbon-covered alumina as supports for Ni-Mo-F additives: gas oil hydroprocessing studies. Fuel. 1992;71:87-93.
- [Google Scholar]
- Vibrational frequency and coordination of molecular oxygen in surface and inorganic complexes. J. Mol. Struct.. 1983;105:11-16.
- [Google Scholar]
- Iron oxide dispersed over activated carbon: support influence on the oxidation of the model molecule methylene blue. Appl. Catal. A. 2009;367:53-58.
- [Google Scholar]
- Removal of benzene by ZnO nanoparticles coated on porous adsorbents in presence of ozone and UV. Chem. Eng. J.. 2012;181–182:215-221.
- [Google Scholar]
- Synthesis of zinc oxide/activated carbon nano-composites and photodegradation of rhodamine B. Environ. Eng. Sci.. 2012;29:392-398.
- [Google Scholar]
- Interpretation of infrared spectra, a practical approach. In: Meyers R.A., ed. Encyclopedia of Analytical Chemistry. Chichester: John Wiley & Sons; 2000. p. :10815-10837.
- [Google Scholar]
- Adsorption mechanisms: the chemistry of organic adsorption on activated carbon. In: Cheremisinoff P.N., Ellerbusch F., eds. Carbon Adsorption Handbook. Ann Arbor Sci.. MI: Ann Arbor; 1980. p. :241-279.
- [Google Scholar]
- Some nitrato-amine nickel(II) compounds with monodentate and bidentate nitrate ions. Inorg. Chem.. 1965;4:804-809.
- [Google Scholar]
- Infrared Spectroscopy of Adsorbed Species on the Surface of Transition Metal Oxides. Chichester: John Wiley & Sons; 1984.
- Preparation and characterization of Fe3O4(111) nanoparticles and thin films on Au(111) Surf. Sci.. 2010;604:627-632.
- [Google Scholar]
- XPS study of zinc hydroxide as a potential corrosion product of zinc: rapid X-ray induced conversion into zinc oxide. Corros. Sci.. 2014;82:356-361.
- [Google Scholar]
- The Elements. London: Clarendon Press; 1989.
- The effects of different activated carbon supports and support modifications on the properties of Pt/AC catalysts. Carbon. 2001;39:175-185.
- [Google Scholar]
- Modification of the surface chemistry of activated carbons. Carbon. 1999;37:1379-1389.
- [Google Scholar]
- Infrared spectroscopy of carbon materials: a quantum chemical study of model compounds. J. Phys. Chem. B. 2003;107:6350-6359.
- [Google Scholar]
- Infrared spectra of some nitrato-co-ordination complexes. J. Chem. Soc. 1957:4222-4225.
- [Google Scholar]
- Formation of oxygen structures by air activation. A study by FT-IR spectroscopy. Carbon. 1999;37:1517-1528.
- [Google Scholar]
- Investigation of multiplet splitting of Fe 2p XPS spectra and bonding in iron compounds. Surf. Interface Anal.. 2004;36:1564-1574.
- [Google Scholar]
- The catalytic decomposition of hydrogen peroxide by iron salts. Proc. R. Soc. London Ser. A. 1934;147:332-351.
- [Google Scholar]
- Superoxide dependent formation of hydroxyl radicals in the presence of iron salts. FEBS Lett.. 1978;96:238-242.
- [Google Scholar]
- Oxidation of coal. In: Trahanovski W.S., ed. Oxidation in Organic Chemistry. Vol vol. 5-D. New York: Academic Press; 1982. p. :279-354.
- [Google Scholar]
- Study of oxygen-containing groups in a series of graphite oxides: physical and chemical characterization. Carbon. 1995;33:1585-1592.
- [Google Scholar]
- Biomimetic syntheses of pure or doped metal hydroxide nitrate thin films by a dual-template approach. J. Mater. Chem.. 2009;19:2373-2379.
- [Google Scholar]
- Effect of surface acidic oxides of activated carbon on adsorption of ammonia. J. Hazard. Mater.. 2008;159:523-527.
- [Google Scholar]
- Chemical interactions between inorganics and activated carbon. In: Cheremisinoff P.N., Ellerbusch F., eds. Carbon Adsorption Handbook. Ann Arbor Sci.. MI: Ann Arbor; 1980. p. :281-329.
- [Google Scholar]
- Handbook of X-ray Photoelectron Spectroscopy. Tokyo: JEOL; 1991.
- Single and simultaneous adsorption of methyl orange and phenol onto magnetic iron oxide/carbon nanocomposites. Arab. J. Chem.. 2019;12:3704-3722.
- [CrossRef] [Google Scholar]
- Active Carbon. New York: Ellis Horwood; 1991.
- Oxidation of activated carbon by dry and wet methods: surface chemistry and textural modifications. Fuel Process. Technol.. 2010;91:1768-1775.
- [Google Scholar]
- Facile one-pot synthesis of lepidocrocite (γ-FeOOH) nanoflakes for water treatment. New J. Chem.. 2013;37:2551-2556.
- [Google Scholar]
- Nitration of phenol and substituted phenols with dilute nitric acid using phase-transfer catalysts. Org. Process. Res. Dev.. 2003;7:95-97.
- [Google Scholar]
- Decomposition of H2O2 on activated carbon obtained from olive stones. J. Chem. Technol. Biotechnol.. 2001;76:1132-1140.
- [Google Scholar]
- XPS study of the major minerals in bauxite: gibbsite, bayerite and (pseudo-)boehmite. J. Colloid Interf. Sci.. 2006;296:572-576.
- [Google Scholar]
- Synthesis and properties of 3-nitro-2H-chromenes. Russ. Chem. Rev.. 2013;82:1081-1116.
- [Google Scholar]
- X-ray photoelectron-spectroscopic studies of carbon-fibre surfaces. Part 5-The effect of pH on surface oxidation. J. Chem. Soc. Farad. Trans. 1. 1985;81:2745-2756.
- [Google Scholar]
- Thermal stability and reducibility of oxygen-containing functional groups on multiwalled carbon nanotubes surfaces: a quantitative high-resolution XPS and TPD/TPR study. J. Phys. Chem. C. 2008;112:16869-16878.
- [Google Scholar]
- Evidence for the protonation of basal plane sites on carbon. Carbon. 1992;30:797-811.
- [Google Scholar]
- Solution-phase electronegativity scale: insight into chemical behaviors of metal ions in solution. J. Phys. Chem.. 2012;116:4192-4198.
- [Google Scholar]
- Lide D.R., ed. Handbook of Chemistry and Physics (86 ed.). Boca Raton: Taylor & Francis; 2005–2006. p. :8-20-8-29.
- A novel alumina-activated carbon composite supported NiMo catalyst for hydrodesulfurization of dibenzothiophene. Catal. Commun.. 2011;12:521-524.
- [Google Scholar]
- On the characterization of acidic and basic surface sites on carbons by various techniques. Carbon. 1999;37:1215-1221.
- [Google Scholar]
- Superoxide-dependent production of hydroxyl radical catalyzed by iron-edta complex. FEBS Lett.. 1978;86:139-142.
- [Google Scholar]
- Involvement of the superoxide anion radical in the autoxidation of pyrogallol and convenient assay for superoxide dismutase. Eur. J. Biochem.. 1974;47:469-474.
- [Google Scholar]
- On the modification and characterization of chemical surface properties of activated carbon: in the search of carbons with stable basic properties. Langmuir. 1996;12:4404-4410.
- [Google Scholar]
- Types of carbon adsorbents and their production. In: Bandosz T.J., ed. Activated Carbon Surfaces in Environmental Remediation, Interface Science and Technology. New York: Academic Press; 2006. p. :1-47.
- [Google Scholar]
- On the nature of basic sites on carbon surfaces: an overview. Carbon. 2004;42:1219-1225.
- [Google Scholar]
- The basicity of carbons. In: Tascón J.D.T., ed. Novel Carbon Adsorbents. Amsterdam: Elsevier; 2012. p. :173-203.
- [Google Scholar]
- Influence of anion and pH on the electrochemical co-deposition and transformation of iron oxy-hydroxide. Int. J. Electrochem. Sci.. 2013;8:12566-12579.
- [Google Scholar]
- Activated carbon surface modifications by nitric acid, hydrogen peroxide, and ammonium peroxydisulfate treatments. Langmuir. 1995;11:4386-4392.
- [Google Scholar]
- Infrared and Raman Spectra of Inorganic and Coordination Compounds (five ed.). New York: John Wiley & Sons; 1997.
- Infrared Absorption Spectroscopy –Practical-. San Francisco: Holden-Day; 1962.
- The nature and kinetics of the adsorption of dibenzothiophene in model diesel fuel on carbonaceous materials loaded with aluminum oxide particles. Arab. J. Chem.. 2019;12:3678-3691.
- [CrossRef] [Google Scholar]
- Granular activated carbon: importance of surface properties in the adsorption of naturally occurring organics. Colloids Surf. A. 1993;78:65-71.
- [Google Scholar]
- Oxidation with nitric acid or nitrogen oxides. In: Trahanovski W.S., ed. Oxidation in Organic Chemistry. Vol vol. 5-C. New York: Academic Press; 1978. p. :295-342.
- [Google Scholar]
- The effect of H2 treatment on the activity of activated carbon for the oxidation of organic contaminants in water and the H2O2 decomposition. Carbon. 2004;42:2279-2284.
- [Google Scholar]
- Preparation of highly porous aluminum hydroxide gels by hydrolysis of an aluminum sulfate and mineralizer. J. Ceram. Process. Res.. 2010;11:64-68.
- [Google Scholar]
- Chemical study of extracted rockrose and of chars ans activated carbons prepared at different temperatures. J. Anal. Appl. Pyrolysis. 1999;50:1-16.
- [Google Scholar]
- Evolution of nitrogen functionalities in carbonaceous materials during pyrolyisis. Carbon. 1995;33:1641-1653.
- [Google Scholar]
- Fundamentals of isco using hydrogen peroxide. In: Siegrist R.L., Crimi M., Simpkin T.J., eds. In Situ Chemical Oxidation for Groundwater Remediation. New York: Springer Sci. and Business Media; 2011. p. :33-88.
- [Google Scholar]
- Surface characterization of oxidized activated carbon cloth. Carbon. 1997;35:1047-1052.
- [Google Scholar]
- Structure Determination of Organic Compounds. Tables of Spectral Data (fourth ed.). Berlin-Heidelberg: Springer-Verlag; 2009.
- Wet air oxidation of phenol at mild conditions with Fe/activated carbon catalyst. Appl. Catal. B. 2006;62:115-120.
- [Google Scholar]
- Activated carbon: structure, characterization, preparation and applications. In: Marsh H., Heintz E.A., Rodríguez-Reinoso F., eds. Introduction to Carbon Technologies. Alicante: Universidad de Alicante; 1997. p. :35-101.
- [Google Scholar]
- Metal-support interaction in Pt/C catalysts. Influence of the support chemistry and the metal precursor. Carbon. 1995;33:3-13.
- [Google Scholar]
- Carbon Materials for Catalysis. Hoboken, NJ: John Wiley & Sons; 2009.
- A review on surface modification of activated carbon for carbon dioxide adsorption. J. Anal. Appl. Pyrolysis. 2010;89:143-151.
- [Google Scholar]
- Infrared spectra of salts and complexes of carboxylic acids and some of their derivatives. Russ. Chem. Rev.. 1963;32:201-207.
- [Google Scholar]
- Adsorption of iron (III) on activated carbons obtained from bagasse, pericarp of rubber fruit and coconut shell. Songklanakarin J. Sci. Technol.. 2002;24:235-242.
- [Google Scholar]
- Characterization of different decomposition stages of biowaste using FT-IR spectroscopy and pyrolysis-field ionization mass spectrometry. Biodegradation. 2005;16:67-79.
- [Google Scholar]
- A peach stone activated carbon chemically modified to adsorb aqueous ammonia. J. Chil. Chem. Soc.. 2003;48:65-69.
- [Google Scholar]
- Studies on metal hydroxy compounds. II. Infrared spectra of zinc derivatives ε-Zn(OH)2, β-ZnOHCl, ZnOHF, Zn5(OH)8Cl2, and Zn5(OH)8Cl2·2H2O. Can. J. Chem.. 1967;45:585-588.
- [Google Scholar]
- Effect of activated carbons modification on porosity, surface structure and phenol adsorption. J. Hazard. Mater.. 2008;151:414-421.
- [Google Scholar]
- Enhacement of the catalytic activity of activated carbons in oxidation reactions by thermal treatment with ammonia or hydrogen cyanide and observation of a superoxide species as possible intermediate. Carbon. 1991;29:707-720.
- [Google Scholar]
- The mechanism of reductive adsorption of oxygen on active carbons with various surface chemistry. Surf. Sci.. 2004;548:281-290.
- [Google Scholar]
- Inorganic matter characterization in vegetable biomass feedstocks. Fuel. 2002;81:1161-1169.
- [Google Scholar]
- Influence of acidic surface oxides of activated carbon on gas adsorption characteristics. Carbon. 1996;34:741-746.
- [Google Scholar]
- Two-step synthesis of boron and nitrogen co-doped grapheme as synergistically enhanced catalyst for the oxygen reduction reaction. RSC Adv.. 2014;4:61437-61443.
- [Google Scholar]
- The influence of activated carbon surface chemical composition on the adsorption of acetaminophen (paracetamol) in vitro. Part II. TG, FTIR and XPS analysis of carbons and the temperature dependence of adsorption kinetics at the neutral pH. Colloid Surface. 2001;177:23-45.
- [Google Scholar]
- Modification of the surfaces of a gas activated carbon and a chemically activated carbon with nitric acid, hypochlorite, and ammonia. Carbon. 1994;32:675-686.
- [Google Scholar]
- The use of XPS, FTIR, SEM/EDX, contact angle, and AFM in the characterization of coatings. J. Mater. Eng. Perform.. 1998;7:317-323.
- [Google Scholar]
- Photoemission studies of adsorbed oxygen and oxide layers. Surf. Sci. Rep.. 1982;2:1-121.
- [Google Scholar]
- Electronic structure and optical properties of Zn(OH)2: LDA+U calculations and intense yellow luminescence. RSC Adv.. 2015;5:87496-87503.
- [Google Scholar]
- Use of infrared spectroscopy to identify crystalline aluminum hydroxides of the Al(OH)3-Fe(OH)3 system. J. Appl. Spectrosc.. 1983;38:137-140.
- [Google Scholar]
- Synthesis of alumina nanosheets via supercritical fluid technology with high uranyl adsorptive capacity. New J. Chem.. 2013;37:366-372.
- [Google Scholar]
- Characterisation of oxide and hydroxide layers on technical aluminum materials using XPS. Vacuum. 2012;86:1216-1219.
- [Google Scholar]
- Infrared spectroscopy in surface chemistry of carbons. In: Thrower P.A., ed. Chemistry and Physics of Carbon. New York and Basel: Marcel Dekker; 1989. p. :147-380.
- [Google Scholar]
- Surface-oxidized carbon fibers: I. surface structure and chemistry. Carbon. 1996;34:983-998.
- [Google Scholar]


