

Translate this page into:
Adaptive neuro-fuzzy interference system modelling for chlorpyrifos removal with walnut shell biochar
⁎Corresponding author. hakancelebi@aksaray.edu.tr (Hakan Çelebi)
-
Received: ,
Accepted: ,
This article was originally published by Elsevier and was migrated to Scientific Scholar after the change of Publisher.
Abstract
Accumulation of chlorpyrifos (CP), a pesticide, causes a significant environmental problem in food, surface/ground waters further to human health. The removal of the CP pollutant in surface/wastewater could be achieved by biochar due to the improved physical and chemical properties. In this work, the CP removal capacities of biochar samples derived from walnut shells at various temperatures from 450 to 900 °C were investigated. The experiments were performed as laboratory batch type study and the adsorption efficiency was determined at various conditions such as adsorbent dosage (10–500 mg/L), sorbate concentrations (100–1500 µg/L), contact time (0–300 min), initial pH (3–10), and the number of recycle.
By subtracting the pyrolysis temperature from 450 °C to 900 °C, the surface areas were found to increase from 12.9 m2/g to 353.3 m2/g, respectively.
The 143 experimental data were evaluated by a pair of kinetics and isotherm models and the Adaptive Neural Fuzzy Inference System (ANFIS). The developed ANFIS model was 98.56% successful in predicting the CP removal efficiency depending on the adsorption conditions. Walnut Shell Biochar (WSBC) can be applied for CP adsorption with 86.64% removal efficiency under optimum adsorption conditions (adsorbent = 250 µg/L, sorbate = 1000 µg/L, pH = 7.07 and contact time 15 min) thanks to its improved porosity. It was determined that the biochar samples could be reused 5 times. Equilibrium adsorption was observed to conform to the Langmuir isotherm, and the maximum adsorption capacity for WSBC@900 was 3.536 mg/g.
Keywords
Adsorption
Adaptive neuro-fuzzy interference system
Biochar
Chlorpyrifos
Walnut shell

1 Introduction
Pesticides, the chemicals fighting against the crop pests for protecting the crops and improving the yields have been largely applied in the agriculture fields to meet the enormous feed requirement in the world. Annually, an average of 2.7 billion kg of pesticide active ingredients are sold worldwide (Centner, 2018). On the other hand, about 1 million people are affected by acute poisoning as a result of contact with pesticides. A mortality rate between 0.4% and 1.9% is recorded each year arising out of pesticides (Hassaan and El Nemr, 2020). Pesticides are listed in Annex II of the EU Directive 67/548/EEC as toxic (R25), harmful (R21, R43), environmentally hazardous (R50, R53) materials. Only 10% of the applied pesticide can reach the pest that the rest ends up releasing into the air, water, and soil (Das et al., 2020). Over time, pesticides accumulate in soil or plants and finally reach surface waters/groundwater causing environmental pollution. One of the common pesticides used is Chlorpyrifos (CP) which benefits to control insects on cotton, grain, and fruit (Liu et al., 2019). The dissipation of CP, an organophosphate insecticide (O, O diethyl O-3, 5, 6-trichloro-2-pyridyl phosphorothioate) causes a significant environmental problem in food, surface/ground waters further to human health. Dalsager et al. (2019) reviewed exposing the CP which could result in neurotoxicity and brain damage in children. Human exposure directly to CP even at low doses has been found to cause health problems such as prostate and lung cancers and abortion (Zahran et al., 2021). The allowed tolerance limits of CP in surface water and food are given by WHO as 0.1 µg/L and 2 mg/kg, respectively.
The removal of the pollutant CP in surface/wastewater, in recent years, have been performed by various methods including ozonation (Alver and Basturk, 2019; Cruz-Alcalde et al., 2017), advanced oxidation (González et al., 2020; Malakootian et al., 2020), UV process (Yang et al., 2018), ultrasound, and adsorption (Alver et al., 2020; Çelebi, 2021; Özcan et al., 2018). Adsorption is considered to be an ease of operation, inexpensive, simple, and universal method (Wang et al., 2018) for removing the CP from water. High efficient and low-cost adsorbents are still a significant challenge in adsorption studies (Ma et al., 2019). Biosorbents prepared from biomass waste, such as banana shells, date pits, coconut fibers (Saleh et al., 2020), are still promising alternative adsorbents to remove the pesticides (Chen et al., 2019). Large amounts of biomass waste emerging in consequence of many agricultural and industrial activities would be evaluated as low cost, environmentally friendly, and recyclable adsorbents (Hassan and Carr, 2021). On the behalf of biosorption of CP from water, there can be found limited studies (Moradeeya et al., 2017).
Walnut is a popular tree fruit that is widely cultivated worldwide because of its valuable content (Jahanban-Esfahlan et al., 2019). Walnut is a woody cellulosic agricultural waste surrounded by three separate layers in total, the shell of which consists of cellulose (17.74%), hemicellulose (36.06%) and lignin (36.90%) (Jahanban-Esfahlan et al., 2020; Queirós et al., 2020). In addition, 60% of the walnut in total consists of shell. These shells can cause environmental pollution by being used as fuel for heating in some regions. Nutshells are an abundant agricultural residue that has great stability, large specific surface area, high mechanical strength, and simple regeneration, and have been successfully used in the removal of heavy metals from aqueous solutions by adsorption (Çelebi and Gök, 2017).
Carbonization of biomass by heat processes (pyrolysis, gasification, hydrothermal treatments) to biochar is a recent famous method for enhancing the adsorption properties of bio-adsorbents (Regkouzas and Diamadopoulos, 2019). The desired well adsorption properties such as surface area, surface functionality, surface morphology, and porosity of the biomass are enhanced by carbonization (Sizmur et al., 2017). Biochar is defined as the solid product of the thermochemical conversion of biomass generated at an oxygen-limited or inert atmosphere at relatively low temperatures (<500 °C) (Akdeniz, 2019). Recently, the removal of pollutants by biochar has been found in research and application areas in wastewater treatments due to the improved physical and chemical properties (Qiu and Duan, 2019). Biochar is also reported as an effective adsorbent for the removal of different types of pollutants (Cheng et al., 2021; Rosales et al., 2017). Suo et al. (2019), examined the triazine pesticide removal efficiency of the biochars prepared from a wide range of agricultural wastes (corn straw, corncob, and corn starch) as high as 96% removal efficiency. Wang et al. (Wang et al., 2020), studied the atrazine uptake by peanut-shell biochar at various temperatures and atrazine concentrations with sufficient quantities. Liu et al. (Liu et al., 2021) investigated the effect of the pyrolysis temperature effect on biochar production yield and the adsorption efficiency of trichloroethylene. Hence, limited studies on CP adsorption by biochar have been reported. Zheng et al. (2019) measured the chlorpyrifos adsorption capacity of deashed biochar derived from giant reed and the effect of co-existence of malic acid and citric acid during the adsorption process. A relative high adsorption capacity was determined as 14.8 mg/g by biochar prepared at 600 °C attributing to the well porosity and surface functionality.
In this study, the CP adsorption efficiency of biochar samples derived from walnut shells at different pyrolysis temperatures was determined in water by batch adsorption experiments at varying initial concentration, adsorbent dosage, initial pH, and reuse of adsorbent. The experimental results were modelled with kinetically and isothermal models to determine the adsorption rate, capacity, and mechanism. Besides, the ANFIS model has been applied to predict the CP removal ratio and removal efficiency at the experimental conditions. In this context, the aim is to contribute to clean production both directly and indirectly by developing an industrial symbiosis and industrial ecology perspective for researchers and producers. Particularly, describing agricultural wastes as garbage is a problem that we encounter all over the world. Indeed, it is possible to include easily obtainable nutshells in wastewater treatment with the logic of disposing the waste with another waste. There are several studies in the literature focusing on adsorption using nutshells, although they are not directly CP. Compared to these, the most important difference in this study is that the surface area in the biochar form is increased by applying carbonization to the adsorbent.
This study covers 3 steps; (i) to evaluate the biochars obtained at different pyrolysis temperatures that is more effective, (ii) to determine the effects of parameters in batch adsorption experiments and evaluate the removal efficiency under the optimum conditions, (iii) to model of the data with ANFIS.
2 Materials and methods
2.1 Preparation of walnut shell biochar
Walnut shell (WS) was obtained directly from the trees grown in Central Anatolia. At the first stage, the shells were washed three times with distilled water (Millipore, Q-8, Germany), then dried in an oven (Memmert, UNB 400, Germany) at 105 °C for 24 h. The dry WS was grinded, sieved through a 0.5 mm sieve, and stored in an airtight plastic box until reused. Biochar (BC) samples were derived in a rotary oven (Protherm, RTR 11/100/500, Germany) at the various temperatures of 450, 600, 750, and 900 °C at N2 atmosphere (1 L/min) for 1 h by pyrolysis. The heating program was 100 °C (10 min), 200 °C (10 min), 300 °C (10 min), 450 °C (60 min), 600 °C (60 min), 750 °C (60 min), and 900 °C (60 min) with 10 °C/min heating rate. The obtained samples were sieved again from 0.25 mm sieve and nomenclature as WSBC@450, WSBC@600, WSBC@750, and WSBC@900.
2.2 Characterizations of biochar samples
The characterization of the biochar samples was performed by various analyses. The point of zero charges (pzc) described as the pH at which the net charge of the total particle surface (i.e. absorbent's surface) is equal to zero, which is typically obtained by acid-base titrations of colloidal dispersions while monitoring the pH (Hach, HQ411D, Germany) of the suspension. The particle sizes of the samples were measured with Cilas-1190 instrument according to Mie Theory. The surface functionality of the biochars was examined by Fourier Transform Infrared Spectrophotometer (FTIR, Thermo Scientific Nicolet iS20, USA) at the 4000–400 1/cm region with a resolution of 1/cm after the averages of 3 scans. Elemental compositions were determined using Scanning Electron Microscopy (SEM) instrumentation (Hitachi, SU 1510, Japan) equipped with the energy-dispersive X-ray (EDX) detector. The BET is an important analysis technique for the measurement of the specific surface area of materials. Surface areas were established by the Brunauer Emmett Teller (BET, Quantachrome, Quadrasorb Evo 4, USA) multilayer adsorption method using micromeritics. The textural characterization of WSBC was carried out by N2 adsorption–desorption isotherms at 77 K using a surface area analyzer Quantachrome. The surface area, SBET, was determined by N2 isotherms using the Brunauer–Emmett–Teller equation (BET). Before adsorption measurement, the samples were outgassed at 150 °C for 3 h.
2.3 Adsorption experiment and chlorpyrifos analysis
Adsorption tests were conducted for each biochar sample at room temperature. 250 mL of CP (C9H11Cl3NO3PS, Sigma-Aldrich) solution with an initial concentration of 100–1500 µg/L was added to 500 mL Erlenmeyer flasks and water completed to 500 mL with the adjustments of 10–500 mg/L of each biochar materials. The prepared samples were shaken on a rotating shaker (Zhicheng, ZHWY-221D, Germany) at a constant contact time of 3 h. Control samples containing µg CP/L without biochar were also included. All the tests were triplicated. After equilibration, samples were centrifuged (Beckman Coulter, Allegra X-12, USA) at 3200 rpm for 10 min. and then filtered by using a 0.45 µm syringe filter. The supernatant from each sample was collected and analyzed for quantification of the concentration of CP using a UV–visible spectrophotometer (Shimadzu 1280 UV–VIS, Japan) according to the maximum absorbance at 290.5 nm of wavelength (y = 0.0188x + 0.0033, R2 = 0.9992) (Aswathi et al., 2019; Lockridge et al., 2019). A calibration curve was drawn by diluting a stock solution of CP (5000 µg/L) in isopropanol: DI water (30:70).
First, in adsorption experiments, the most suitable biochar type was determined among the biochar samples that were pyrolyzed at different temperatures, and then, biochar dosage (10, 250, 500 µg/L), CP concentration (100, 250, 1000, and 1500 µg/L) pH (3, 5, 7 and 10) and operating times (0–300 min.) for optimal biochar were examined. It was applied to other biochar samples under specified optimum conditions. In this study, three different kinetic models (pseudo-first-order, pseudo-second-order. and intra-particle diffusion) and two isotherms models (Langmuir and Freundlich) were used to find the adsorption capacity, rate, and mechanism. The amount of CP adsorbed by the biochar samples (qe) was determined by Eq. (1):
2.4 Development of the adaptive neuro-fuzzy interference system model using experimental variables
Fuzzy systems that establish a relationship between input variables and output variables using fuzzy sets can model even variables that do not have a numerical equivalent with the help of expectations (Alves and Aguiar, 2021). In this work, the Sugeno type model with optimized parameters (ANFIS) was established. The output parameters have the membership functions of the input variables. The Sugeno type ANFIS structure is given in Fig. 1.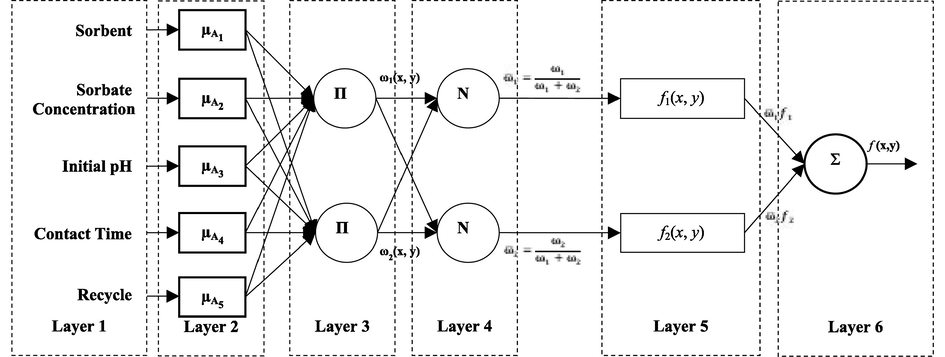
A Sugeno type adaptive neuro-fuzzy interference system model structure with 5 inputs, 1 output, and 243 rules.
In Layer 1, input signals from each node are transferred to other layers. The output for each node i is defined as Eq. (2):
Layer 2 is called the blur layer. Jang's ANFIS model uses the Bell activation function, which is generalized as a membership function, in separating input values into fuzzy sets. The output of each node consists of membership degrees that depend on the input values and the membership function used. Membership degrees obtained from Layer 2 are shown as
. Layer 3 is the rule layer. Each node in this layer represents the number and number of rules established according to Sugeno's fuzzy logic inference system. Output µi of each rule node is the product of membership degrees from Layer 2. The derivation of the μi values is obtained as (j = 1,2) and (i = 1,.,n) as in Eq. (3).
Layer 4 is the normalization layer. Each node in this layer accepts all nodes from the rule layer as the input value and calculates the normalized firing level of each rule. The normalized firing level
is calculated according to Eq. (4).
Layer 5 is the clarification layer. The weighted result values of a given rule are calculated at each node in the clarification layer. The output value of node i in the Layer 5 is calculated according to Eq. (5).
Layer 6 is the total layer. This layer has only one node and is labeled with ∑. Here, by adding the output value of each node in the 4th layer, the actual output value of the ANFIS system is obtained. The calculation of y, which is the output value of the system, is according to Eq. (6). The details of the equations and other things of ANFIS structure can be found in Alver et al. (Alver et al., 2020).
The learning algorithm of ANFIS based on the Sugeno System is a hybrid learning algorithm that consists of using the least-squares method and the backpropagation learning algorithm together. This learning algorithm is based on error backpropagation. A step in the learning process has two parts; In the first part, input samples are produced and the predecessor parameters are accepted as constant and the best result parameters are determined with the least mean square method. In the second part, the input samples are regenerated and the predecessor parameters are changed by the gradient descent method, assuming the final parameters constant. Then, this process is repeated. In this study, 143 data obtained from laboratory-scale experiments were modelled using ANFIS, and CP removal efficiency has been estimated based on parameters such as adsorbent dosage, adsorbate concentration, initial pH, contact time, and the number of recycling, which affect adsorption efficiency. Training, control, and testing data sets were created by randomly selecting data at different percentages. The correlation coefficient (R2) and the root of mean square error (RMSE) value given in Eqs. (7) and (8) were used as the performance evaluation criteria of the ANFIS model.
3 Results and discussion
3.1 Characterization of biochar samples
In order to understand the connection of the adsorption mechanism with pH, it was necessary to know the zero charge point of the adsorbents. The particle sizes WSBC@900 are determined by pHPZC measurements at the pH range from 2 to 10 shown in Fig. 2. The point of zero charges of biochar was 8.35. The surface charge of the biochar depends on the functional groups it contains, such as aliphatic, aromatic, and carboxyl groups. Carboxyl groups in the structure are the main ion-exchange sites for the adsorption or desorption of pesticides. The results of FTIR analysis performed to determine the functional groups on the biochar surface and to observe their changes after adsorption are given in Fig. 3. The —OH stretching peak is seen at 3627 1/cm as broadband. The peak at 1566 1/cm is belonged to C⚌C stretching while the C—H bending peaks of the biochar are seen at the 1200–1465 1/cm region. The peaks at 1200–1075 1/cm are causing possible Si—O stretching and the C⚌C bending peak at 740 1/cm is observed. The intensities of the FTIR peaks are becoming weaker when the pyrolysis temperature increase as a result of the probable removing of volatile molecules which are rich in functional groups. The FTIR analysis was performed after the adsorption for WSBC@900 as well, which showed the best adsorption characteristics. The weak peaks have become stronger and resembling CP peaks since CP has adsorbed on the surface pH value at the point of zero charge.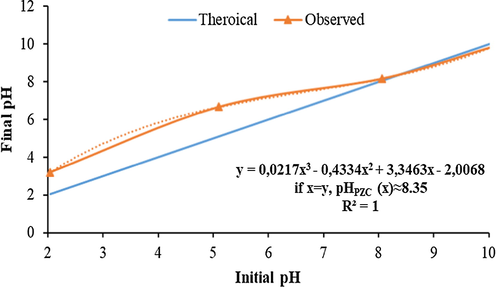
pH at the point of zero charge value of biochar pyrolyzed at 900 °C.
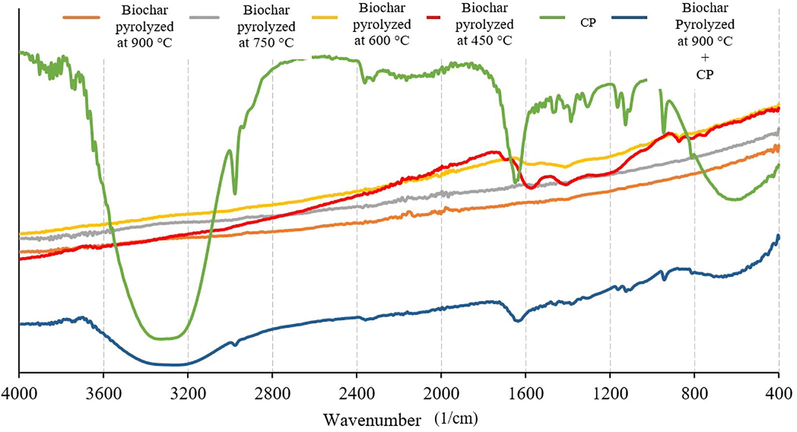
Fourier transform infrared spectrophotometer analysis of biochars and chlorpyrifos.
Another important parameter in biochar characterization and adsorption is the volume of macro-, meso- and micro-sized pores of the biochar to be used as a sorbent. The BET analysis results are summarized in Table 1. The pristine WS has a surface area of 2.77 m2/g. The surface area of WSBC@450 is the smallest as 12.9 m2/g due to the possible insufficient removal of volatiles from the surface. The surface areas increase with an increase in pyrolysis temperature to 353.3 m2/g. Corresponding pore volumes are increasing from 0.0137 cc/g to 0.2015 cc/g with pyrolysis temperature which could be the result of enlargement or coalescence of internal cavities by the further release of volatile compounds (Sizmur et al., 2017).
Sample
Surface area (m2/g)
Micropore volume (cc/g)
Total pore volume (cc/g)
WS
2.77
0.001
0.0044
WSBC@450
12.9
0.004
0.0137
WSBC@600
254.9
0.128
0.1445
WSBC@750
285.1
0.141
0.1795
WSBC@900
353.3
0.194
0.2015
SEM-EDX analysis is an effective way to describe and examine the changes in the surfaces and structures of biochar and its properties. Fig. 4 shows the SEM and EDX analysis of the raw WSBC@900 sample and the CP sorbed on the WSBC@900. The rate of adsorption of Cl, which was not included in the elemental analysis of the biochar, but was found in CP due to the percentage increase on the WSBC@900 surface, was proven by EDX analysis.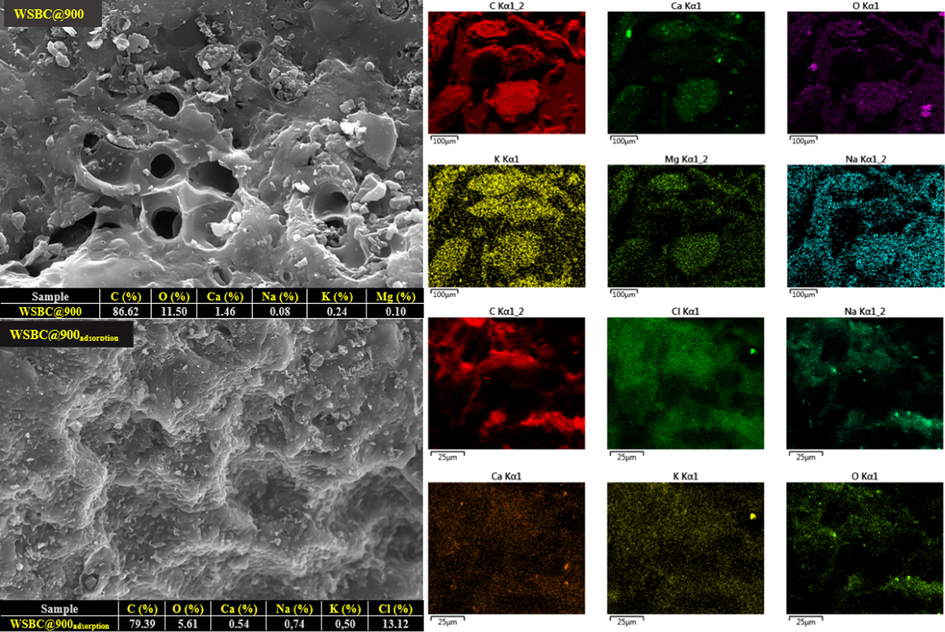
Scanning Electron Microscopy and energy-dispersive X-ray analysis of the biochar pyrolyzed at 900 °C and the chlorpyrifos sorbet on the biochar pyrolyzed at 900 °C.
As seen in Fig. 4, as a result of the heat process applied to the walnut shell, it was observed that the porosity and surface roughness increased, resulting in macro-sized pores on the surface as a result of the carbonization process. The WSBC@900 surface, which appears to be quite rough and porous, appears to be suitable for adsorbing macro and micropollutants. Also, the macropores formed on the surface of the WSBC have partial meso and micropores that open towards the interior, but it is also seen that they are not sufficient. Chemical and physical activation methods can be applied to increase the volume of meso and micropores. It is seen that the pores on the surface of WSBC@900 are filled with CP after adsorption. Besides, 13.12% Cl- increase on WSBC@900 surface, which is one of the best evidence of CP adsorption, is shown in Fig. 4 with green color. As can be seen, observed in Fig. 4, before the CP removal from the structure, the percentages of C, O, Ca, Na, K, and Mg were 86.62%, 11.50%, 1.46%, 0.006%, 0.24%, and 0.10%, respectively. However, after the removal, the elemental composition of CP changed to: 79.39% for C, 5.61% for O, 0.54% for Ca, 0.74% Na, 0.50 % K, and 13.12% for Cl (see Fig. 4).
3.2 The effect of pyrolysis temperature
The CP removal efficiencies are shown in Fig. 5 at a constant adsorbent concentration of 250 µg/L for all the WSBCs. The removal ratio is increasing with pyrolysis temperature from 450 to 900 °C and according to the surface area. The efficiency is becoming more visible at longer retention times that sorbate concentration could decrease from 1000 till 170 µg/L or qe values could increase from 0.2 to nearly 3.5 µg/mg. The surface area/porosity could be a leading factor affecting the CP adsorption than surface functionality since qe values are very close at the beginning of the experiments.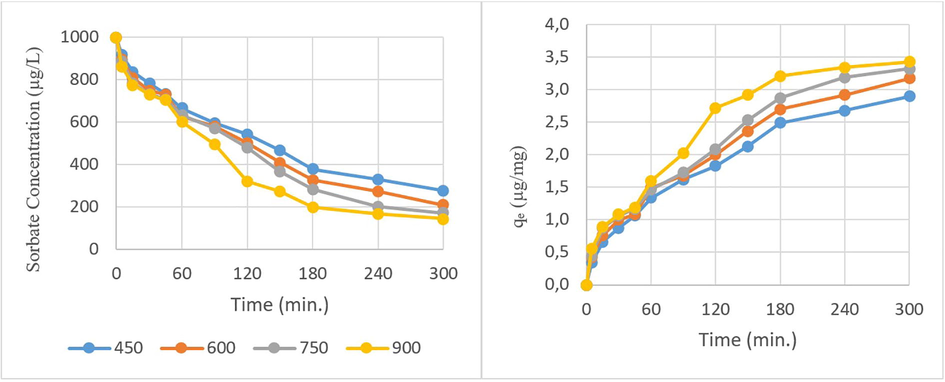
The pyrolysis temperature effect on adsorption (biochar pyrolyzed at 900 °C = 250 µg/L, chlorpyrifos = 1000 µg/L, pH = 7.07, time = 0–300 min.)
3.3 The effect of biochar dosage
Fig. 6 shows the effect of adsorbent concentration on the adsorption evaluated for WSBC@900 as the best adsorbent among BCs having the highest qe values. The adsorption capacities of WSBC@900 biochar at 10, 250, 500 µg/L at a dose of 1000 µg/L CP were determined at pH 7.07 for 300 min. The qe values were quantified as 72.87, 3.42, and 2.00 µg/mg, respectively. The CP removal reaches equilibrium after 150 min. for all three adsorbent dosage eventual filling available pores gradually. In the isotherm studies of this study although the qe value was found to be 4.368 µg/mg in the pseudo-second-order model adsorption reaction (Table 2). It was observed that the max qe capacity increased to 72.87 µg/mg. Although it was determined that the most efficient sorbent was 10 mg/L WSBC@900 (271.27 µg/L) at the end of operation periods. It was determined that it did not meet the receiving environment limits. Therefore 250 µg/L WSBC@900 sorbent dose was chosen as the optimum dose.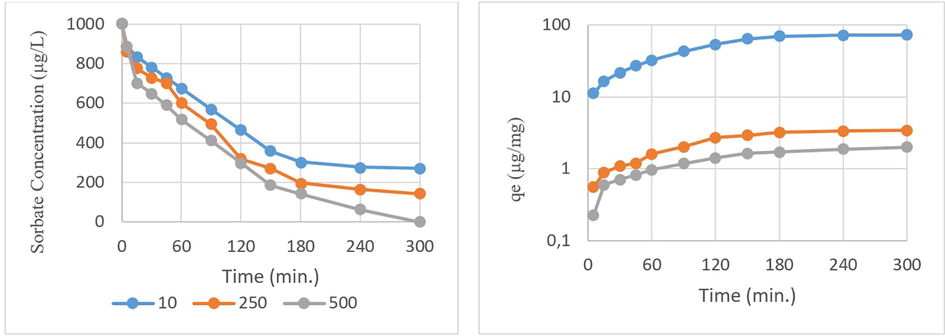
Adsorbent dosage effect on adsorption (Biochar pyrolysis temperature = 900 °C, chlorpyrifos = 1000 µg/L, pH = 7.07, time = 0–300 min.)
Adsorbent
qe (mg/g)
pH
Dose (mg)
Time (min)
Yield (%)
References
Bagasse based biochar
3.20
6.8
500
45
89
Jacob et al. (2020)
Zinc oxide-pea pells
47.85
2.0
30
60
64
Haq et al. (2020)
Polyurethane foam
12.50
6.0
300
60
97
Bouraie & Abdelghany (2020)
Pumice stone
20.65
3.0
4000
30
76
Dehgani et al. (2021)
Cinnamon waste biochar
12.37
7.0
100
120
83
Ettish et al. (2021)
WSBC@900
72.87
7.07
0.25
15
86
In this study
3.4 The effect of chlorpyrifos concentration
The removal efficiencies were examined at 100, 250, 1000, and 1500 µg/L CP initial concentrations by 300 min of retention time and 250 µg/mg WSBC@900. As shown in Fig. 7, when the initial concentration of CP increased from 100 µg/L to 1000 µg/L, the amount of pesticide adsorbed on WSBC@900 increased from 0.4 µg/mg to 3.42 µg/mg after 300 min. Increasing the pesticide concentration further to 1500 µg/L causes a partial decrease in the adsorbed amount of CP but then reaches 3.06 µg/mg after 150 min. These would be the result of the adsorption limit of the adsorbent as 250 µg/mg which had a restrictive effect on sorption for CP concentrations above 1000 µg/L coherent with literature (Rodríguez-Romero et al., 2020). Therefore, the initial CP dose was decided as 1000 µg/L for further kinetic studies for this work.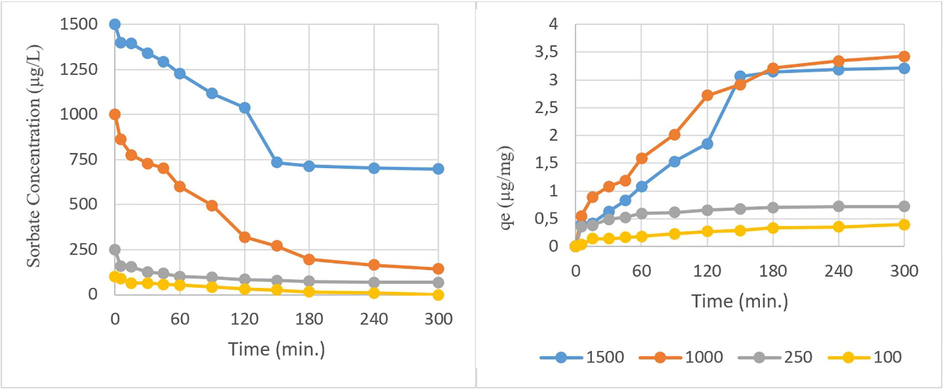
Initial sorbate concentration effect on adsorption (biochar pyrolyzed at 900 °C = 250 µg/L, pH = 7.07, time = 0–300 min.)
3.5 The effect of pH
The pH is one of the most important parameters affecting adsorption (Wu et al., 2021). The pH of each solution was adjusted to the required value by adding dilute acid and base solutions. The optimum pH on the adsorption efficiency was determined at 250 µg/L WSBC@900 and 1000 µg/L CP, 300 min. residence time, and at various pH values of 3, 5, 7, and 10 (Fig. 8). With the change of solution pH, H+ or OH– ions in the solution are bound to the biochar surface by electrostatic attractions. While the solution pH decreases that the H+ concentration increases, the electrostatic interactions become favourable on the negatively charged biochar surface (Fig. 4). Furthermore, hydraulic stability of CP decreases in pH decreases (John and Shaike, 2015) which causes the pushing force between the pesticide and biochar. Thus, the adsorption efficiency decreased at very low pHs. Nonetheless, the adsorption amount increased significantly by changing the pH from 3 to 5, then it varied a little with the continuous increase to pH 7.0. The decrease in the concentration of hydronium ions in the environment instead of the increase in the concentration of negatively charged hydroxyl ions brought about an increase in the adsorption capacity for positively charged CP. The electrostatic attraction between the negatively charged adsorbent surface and the positively charged CP in the basic environment also increased. The qe values were determined as 1.2, 3.1, 3.4, and 3.3 for pHs of 3, 5, 7, and 10, respectively. pH 7 was examined as the optimum value with the adsorption efficiency as 86%.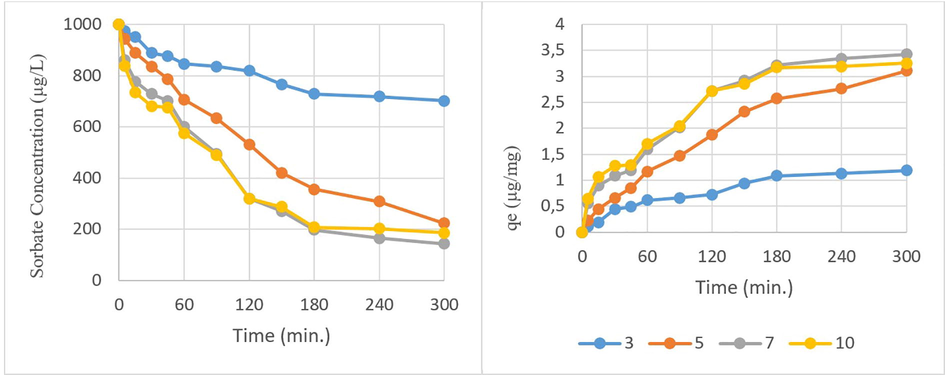
Initial pH effect on adsorption (biochar pyrolyzed at 900 °C = 250 µg/L, chlorpyrifos = 1000 µg/L, time = 0–300 min.)
3.6 Contact time
Adsorption is a process that continues until a dynamic balance is established between the concentration of solute remaining in solution and the concentration of solute held on the solid surface (Balci and Elçin, 2017). To find the equilibrium time, the concentration of CP remaining in the solution was determined in the samples taken at a certain time interval and the optimum contact time was determined. The data obtained after 300 min of operation under optimum conditions (adsorbent = 250 µg/L, Sorbate = 1000 µg/L, and pH = 7.07) were given in Fig. 6 and Fig. 7. The adsorption capacity values increase as the operating time increases. Experimental results show that the adsorption rate increases more rapidly, especially after an average of 15 min after the start of the process. Initially, the excess active empty areas required for adsorption on the adsorbent surface cause the adsorption to occur faster. However, as the time approaches equilibrium, the interaction between the sorbate and the adsorbent decreases (Changmai et al., 2018). Equilibrium mainly depends on the saturation of active areas on the adsorbent surface and slow pore diffusion (Jacob et al., 2020). It can be concluded that the optimum operating time would be 150 min at which approximately 73% removal efficiency was achieved.
3.7 Comparison studies of walnut shell biochar with other adsorbent
It is very hard to directly compare the other studies with our study due to the various experimental conditions that was used different adsorbents for removal CP removal. But, the experimental results of this study clearly showed that the adsorption capacity of the WSBC was nearly same as other adsorbents with CP adsorption. The maximum adsorption capacity of WSBC was comparised with other adsorbents at Table 2 for CP removal. Vigneshwaran et al (2019), investigated the initial concentration, pH, operating time and dose parameters in the removal of chlorpyrifos using a heterogeneous metal-free graphite carbon nitride (g-C3N4) incorporated into chitosan. They achieved 85% efficiency under optimum conditions. It was observed that the yield they obtained was almost the same as the yield in our study (86.64%). Gonçalves et al. (2019), stated that 4 g of activated biochars produced from tobacco biomass are sufficient to cure 1 L of water contaminated with chlorpyrifos. Zheng et al. (2019), stated that while the adsorption capacity for chlorpyrifos was 4.32 mg/g in the biochar samples they obtained at 300 °C, the adsorption capacity increased by 14.8 mg/g in the biochars at 600 °C. In our study, it was observed that the highest removal efficiency of biochar samples obtained at high temperatures was higher. Hamadden et al. (2021a), reported in their study that higher removal efficiencies were obtained in the first operating times in the chlorpyrifos adsorption mechanism using green adsorbent. In the study in which chlorpyrifos pesticide removal was carried out by using nanoparticles of water treatment residues, it was determined that 92% removal efficiency was obtained after 30 min of operation at pH 7, from Hamadden et al. (2021b), reported in another study.
3.8 Reusability of the adsorbent
Reusability of the sorbent is an important factor for an adsorbent for environmental benefit and the cost be minimized. The stability of WSBC@900 was investigated for the reusable test for 10 cycles as shown in Fig. 9. After each cycle, the biochar was washed three times with distilled water and dried at 70 °C, and used in the next cycle. After 5 cycles, there was no significant loss of activity.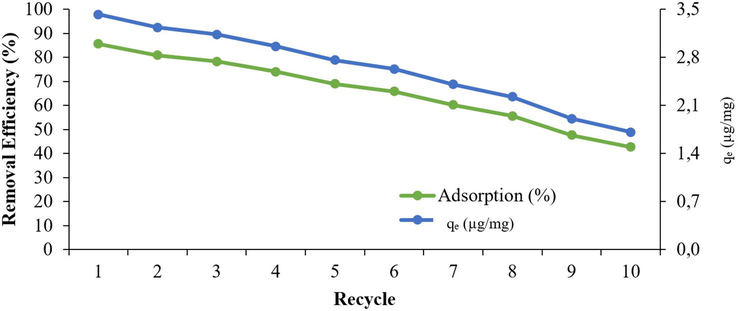
The stability of biochar (biochar pyrolyzed at 900 °C = 250 µg/L, chlorpyrifos = 1000 µg/L, pH = 7.07, time = 300 min.)
3.9 Adsorption isotherm kinetics and mechanism
Kinetic is an important step in determining the adsorption mechanism and understanding the adsorption steps that affect the adsorption rate. As a result of kinetic studies, the adsorption rate and the required contact time for filling the adsorbent surface with sorbate can be determined. Also, the adsorption rate is an important parameter in choosing the most suitable sorbent. In determining the adsorption rate and rate constant, the compatibility of experimental data and kinetic models such as pseudo-first-order. Pseudo-second-order and intra-particle diffusion were examined. Besides adsorption is generally described through isotherms by the concentration of sorbate adsorbed at a constant temperature as a function of the sorbate concentration on the adsorbent. Freundlich and Langmuir are the most frequently used isotherm models in the literature. Freundlich isotherm describes the concentration of dissolved sorbate on the sorbent surface by the concentration of dissolved sorbate in the liquid. This model assumes that adsorption occurs on a heterogeneous surface. The Langmuir isotherm states that the adsorption of sorbate molecules on the sorbent surface is related to the sorbate concentration on the sorbent surface at a constant temperature and it is based on the fact that the adsorption process takes place in a monolayer on the sorbent surface. The experimental data obtained from batch sorption experiments and the model coefficients were given in Table 3. qe: is the amount of CP adsorbed per unit weight of adsorbent at the equilibrium, qt: the amount of CP removed at time t, k1: the rate constants of the first-order kinetic equations for adsorption k2: the rate constants of the second-order kinetic equations for adsorption, Ce: CP concentration in the aqueous phase, kd: the rate of sorption controlled by intraparticle diffusivity, qmax: the equilibrium concentration of adsorbate on the adsorbent surface, KL: Langmuir constant related to the energy of adsorption, KF: Freundlich constant related to the sorption capacity of the sorbent, 1/n: Freundlich constant related to the energy heterogeneity of the system and the size of the adsorbed molecule. RL: Separation factor: RL > 1: unfavorable; RL = 1: linear; RL = 0: irreversible; 0 < RL < 1: favourable. n: intensity of adsorption: 1/n = 0 irreversible; 1/n > 1 unfavorable; 0 < 1/n < 1 favourable.
Models
Equations
Coefficients
Langmuir
qmax (mg/g)
3.536
KL (L/mg)
0.015
RL
0.948
R2
0.950
Freundlich
KF (mg/g)
0.049
1/n
0.400
R2
0.839
Pseudo-First Order
k1 (1/min)
0.015
R2
0.969
Pseudo-Second Order
k2 (g/mg/min)
0.003
R2
0.958
Intra particle
kd
0.218
R2
0.958
Mechanisms for sorption of CP in aquatic environments that have been demonstrated or postulated include hydrophobic bonding, electrostatic attraction, van der Waals affinity, hydrogen bonding, chelation/coordination, covalent bonding, and entrapment in WSBC micropores. Dissolving into the aquatic environment is commonly assumed to be the main mechanism of pesticide transport and entrapment into biochar micropores. Besides to the correlation between the CP sorption coefficient and the microporosity of biochars is very good (R2 = 0.96), and normalization of kd values with micropore content explains an important component of the variability of CP absorption between biochars.
3.10 The adaptive neuro-fuzzy interference system model
The process of creating and structuring the ANFIS model is one of the main problems to be solved. All these processes, such as selecting inputs, selecting the type and number of membership functions for inputs. Determining the number of rules by creating the rule layer, and determining the initial values of membership functions parameters, include the stage of developing the ANFIS model. For the selection of the ANFIS model structure expert knowledge based on experience is generally used. However, in many cases. The knowledge of the experts may be insufficient in determining the most appropriate criteria for the ANFIS model by making the right choices. It is the most applicable process to choose the most suitable variables by making different trials. In this study. ANFIS model was developed with MATLAB R2019b software to well estimate the adsorption efficiency in the range of factors used in the batch adsorption experiments performed to determine the CP removal efficiency of newly synthesized walnut shell-based biochar. The factors of initial sorbate concentration, sorbent dosage, initial pH, contact time, and sorbent reuse which affect the adsorption efficiency in batch adsorption experiments were defined as inputs to the ANFIS model and adsorption efficiency as output. All experimental data set containing 109 data (excluding characterization study) in order to training testing and checking the ANFIS model was randomly divided into 60–20-20%. 70–15-15% and 80–10-10% data, respectively. In addition to the data set ratios membership function variables and optimization methods were changed to develop the best ANFIS model structure and the performance of the model in training testing and control were determined by following RMSE and R2 values and presented in Table 4. Each variable was calculated by running the model in 500 epochs.
Data Ratio (%)
Membership Function
Optimum Method
RMSE
R2
Number
Type
Train
Check
Train
Test
Check
60–20-20
3 3 3 3 3
tri
hybrid
1.3664
2.4457
0.9971
0.9945
0.9914
70–15-15
3 3 3 3 3
tri
hybrid
1.3192
2.6857
0.9973
0.9930
0.9899
80–10-10
3 3 3 3 3
tri
hybrid
1.4142
2.8988
0.9969
0.9915
0.9889
60–20-20
3 3 3 3 3
trap
hybrid
4.9576
5.3994
0.4322
0.4857
0.5862
60–20-20
3 3 3 3 3
gbell
hybrid
1.6166
3.4003
0.7040
0.7003
0.9836
60–20-20
3 3 3 3 3
gauss
hybrid
2.1705
2.4809
0.9927
0.9899
0.9910
60–20-20
3 3 3 3 3
tri
backpropa
52.969
49.785
0.2161
0.2003
0.2961
60–20-20
2 2 2 2 2
tri
hybrid
8.3729
6.3396
0.8914
0.8463
0.9422
60–20-20
4 4 4 4 4
tri
hybrid
1.2464
2.9731
0.9976
0.9472
0.9874
The ANFIS model structure in the first row of Table 3 is the one with the best predictive ability. This model structure consists of 524 nodes. 243 linear parameters. 45 nonlinear parameters. 288 parameters in total. 65 training data pairs. 22 testing data pairs. 22 checking data pairs and 243 fuzzy rules. The sensitivity of the developed ANFIS model in training testing and control are given in Fig. 10. The ability of the developed ANFIS model to represent the data in the experimental data set is 98.56%. This developed model has similar or better success than many model studies performed in the literature to predict the adsorption efficiency depending on the adsorption variables it contains (El Hanandeh et al., 2021). For this reason, the ANFIS model was found to be quite successful in predicting the CP adsorption efficiency on the WSBC@900 at the experimental data limit depending on the initial sorbate concentration, sorbent dosage, initial pH, contact time, and sorbent reuse adsorption factors. Due to a large number of parameters in the data set used a fuzzy rule creation technique in which ANFIS and different optimization methods such as grid partitioning subtractive clustering fuzzy c-means clustering etc. are integrated can be used to create higher performance ANFIS models by reducing the number of fuzzy rules and parameters.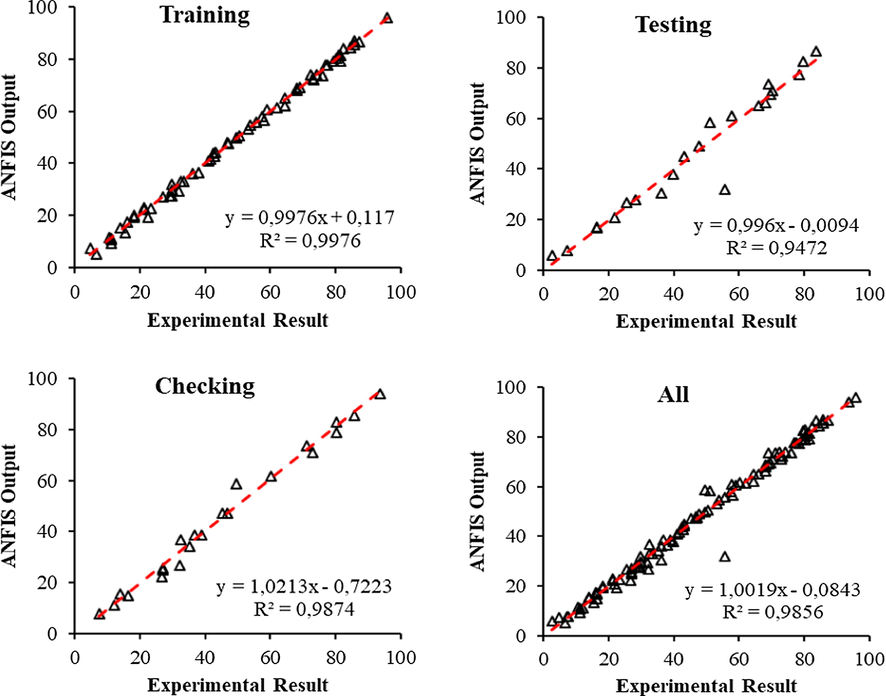
Correlation results analysis of adaptive neuro-fuzzy interference system model: training, testing, and checking.
3.11 Walnut shell biochar cost analysis
In literature, the potential usage and the efficiency of adsorbents is frequently mentioned, but cost analysis was not utilized. This section provides a preliminary assessment of the cost of WSBC. However, the cost analysis may differ from region to region. The simple cost calculation for the production and disposal of WSBC is as follows:
-
Raw material cost:
Since the walnut shells used in the study are an agricultural waste, there is no cost of raw material.
-
Biochar production cost:
The first cost was the electrical energy consumed by the system to produce biochar and the second one is the nitrogen (N2) gase cost were given to the system for the pyrolysis process. The most attractive biochar was obtained at 900 °C pyrolysis temperature and the cost calculations were carried out according to these conditions. (2) grams of biochar is produced from 5 g of walnut shells and the total time for heating was 240 min (4 h). The power of the system was 1.3 kW.
The cost of 1 g of biochar:
Electricity consumption cost ($) = 1.3 kW*4h*0.11$/kWh) = 0.572 cent/2g = 0.286 cent/g.
1L of N2 gase per minute was given to the system for 1 h. Since the cost of 60 L nitrogen gase was $15.
The cost of nitrogen gas spent for the production of 1 g of biochar; 15$/2g = 7.5$/g
Since the biochar can be reused 5 times, the cost will be reduced by 1/5 and the actual cost will be 1.56 $/g (1560 $/kg).
-
Biochar disposal cost:
The cost for the disposal of 1 kg of Biochar in the landfill = 2.4$
The sum of production and disposal costs was = 1562.4$/ kg (1.5624$/g)
Therefore, the cost of WSBC is significantly more feasible and economical than commercially available activated carbons.
4 Conclusions
The CP removal capacities of biochar samples derived from the walnut shell at various pyrolysis temperatures between 450 and 900 °C were examined in this work. The experiment results were modelled by ANFIS and isothermally. It can be concluded that CP removal could be achieved by WSBC@900 at neutral conditions as of 86% from water. The initial sorbate concentration, sorbent dosage, initial pH, and contact time parameters are effective on the adsorption by biochar. Although the adsorption would be occurred by competing mechanisms such as hydrophobic bonding, electrostatic attraction, van der Waals affinity, hydrogen bonding, and covalent bonding, and entrapment in WSBC micropores, the main mechanism is the transport and entrapment of CP into biochar micropores. WSBCs can be easily applicable for CP adsorption efficiently.
Acknowledgments
I want to thank my colleagues at the Environmental Engineering Department of Aksaray University for their advice, comments, and help in other ways during this paper.
Declaration of Competing Interest
The authors declare that they have no known competing financial interests or personal relationships that could have appeared to influence the work reported in this paper.


